Article

Impact of Land Use Changes on Ecosystem Services Supply: A Meta Analysis of the Italian Context

Department of Biosciences and Territory, University of Molise, 86090 Pesche, Italy
*
Author to whom correspondence should be addressed.
Land 2023, 12(12), 2173; https://doi.org/10.3390/land12122173
Submission received: 14 November 2023 / Revised: 12 December 2023 / Accepted: 14 December 2023 / Published: 16 December 2023

Abstract

:
Changes in land use and land cover (LULC) are caused by several factors, including climate change, socio-demographic dynamics, human pressures and urban sprawl. These factors alter the structure and functionality of ecosystems and their capacity to provide ecosystem goods and services to society. The study of LULC changes is important for understanding the dynamics of relationships between environmental, social and economic components and for analyzing the factors affecting natural capital. Including ecosystem services (ES) in spatial planning tools and sectoral policies is useful for improving governance. In this paper, the impact of LULC changes on ES provision has been estimated. To this end, we carried out a literature review (Step 1) to select the biophysical and economic coefficients of ES supply by land cover classes and collect them in a database (Step 2). We subsequently aggregated the economic and biophysical coefficients by macro classes (Step 3) and, using the benefit transfer approach, we estimated the change in the supply of ESs concerning permanence and transition phenomena in Italy from 1990 to 2018 (Step 4). The transition phenomena analysis also allowed us to evaluate the consequences of urbanization and urban green space governance on ES supply. Indeed, these urban green spaces can help reduce risks to people’s health and safety and mitigate the effects induced by climate change. In total, approximately 800 coefficients (biophysical and economic) of ESs supplied by Corine Land Cover classes were acquired. The results show a reduction in the annual supply of ecosystem services of EUR 927 million (2022) caused by LULC changes between 1990 and 2018. This research proposes a methodology to improve knowledge of ESs concerning anthropogenic impacts and to support land-use planning policies regarding Agenda 2030 for Sustainable Development Goals.

1. Introduction

1.1. Background

Changes in land use and land cover (LULC) are the result of human activities that have altered the land surface through various social and economic processes, influencing ecosystem stability and the conservation of biodiversity [1,2]. In the past 300 years, the Earth’s biosphere has been transformed from a predominantly wild to an anthropogenic environment [3]. The main cause of this transformation is the land use and land cover change, which, in combination with the indiscriminate use of natural resources, has caused a drastic loss of biodiversity [4,5,6]. Data published by the global IPBES report in 2019 show that land use and land cover changes are responsible for more than 50 percent of human impacts on terrestrial and freshwater ecosystems [7,8]. Some scientific studies based on the meta-analysis approach [9,10,11,12,13] have examined the relationship between biodiversity loss and changes in land use and land cover. These studies show that land surface transformation linked to intensification and urbanization causes a general decline in species richness, composition and abundance. Changes in land use and land cover affect biodiversity and ecosystems in which the provision of goods and services is essential for human well-being [2,14,15]. Indeed, their supply is strictly linked to ecosystems and land use. For example, forested areas are linked to the provision of regulating services (i.e., climate regulation) while grazing areas are linked to provisioning ESs (i.e., forage production). Therefore, a change in land use and land cover can lead to a change in the provision of goods and services [2,16,17]. Changes in land use and land cover on the one hand and the increasing demand for ESs on the other have highlighted the need to implement governance tools to ensure the environmental, economic, and social benefits provided by natural capital for present and future generations. These governance tools, such as the SEEA-EA Environmental Accounting of Ecosystem Services, support public decision-makers to achieve some of the objectives defined in international and EU natural capital conservation policies and strategies. Hence the necessity to monitor the qualitative and quantitative state of natural capital, to assess the costs and benefits related to its consumption, to integrate the issue of ESs into decision-making processes and improve management (Agenda 2030 for Sustainable Development; Biodiversity Strategy for 2030). Having information on the value of ESs increases knowledge about the state of ecosystems and improves decision-making. The availability of reliable information on the value of ESs can make the contribution of natural areas more visible and quantifiable at the highest decision-making levels [18].

1.2. ES Evaluation Methodologies: A Synthesis

The internationally recognized framework for the correct valuation and management of ESs involves the process of mapping, biophysical quantification and economic valuation [19,20,21,22]. Specific methodologies can be used for each step. For example, mapping ES supply is mainly based on land use and land cover and the spatial distribution of biophysical/abiotic resources [23,24,25]. Or it can be done through qualitative matrices that associate each land use and land cover class (Corine Land Cover) with the qualitative value of potential ES provision [26]. Concerning biophysical quantification, the most appropriate methodology can be chosen according to the ecosystem service to be investigated as well as the temporal and spatial scale. The quantification of ESs can be carried out either through the use of software, such as INVEST, ARIES and SolVES, which are based on changes in land use and land cover, or through the use of indicators. The choice of the method depends on the availability of data and the characteristics of the software, which in some cases is designed to estimate only certain services.
The evaluation of LULC changes on ES supply is a current issue. For example, Schirpke et al., 2021 [27] mapped the change in ES supply at the ecoregions scale in Europe between 2000 and 2018. The analysis of LULC changes is also useful for predicting scenarios to support the public decision-maker in territorial and urban planning [28].
Furthermore, several authors have used transition matrices to evaluate the ES supply variation due to LULC changes [29,30,31,32,33,34,35].
Concerning the economic valuation of ES supply, monetary techniques inherent to both traditional valuation and consumer surplus (expressed and detected preferences) are used [36]. The choice of the most appropriate economic technique depends on the biophysical quantification that allows for defining the economic characteristics ((non-)rival and (non-)excludable) of the analyzed ESs [2]. In recent decades, an increasing number of scientific publications have been conducted at different spatial scales [22,37,38] using the benefit transfer technique [39,40,41]. The objective of the benefit transfer method is to estimate the benefits of ESs by transferring available information (especially values) from studies already completed in another location and/or context [42]. It is used in the valuation of ESs either to avoid expensive data collection or to complete an assessment in a limited timeframe [43,44]. Based on this methodology, to facilitate scientific and political debate, databases have been created that systematically aggregate economic coefficients from studies carried out internationally, for example, the Ecosystem Service Valuation Database (ESDV) [45] and The Environmental Valuation Reference Inventory [46]. While at the European level, Integrated Natural Capital Accounting (INCA) [47] has been implemented, providing an operational procedure for ES valuation.

1.3. The Issues and Innovation of the Study

Our paper aims to assess the impacts of anthropogenic activities on human well-being by analyzing the change in ES supply (biophysical and economic) concerning land use changes that occurred between 1990 and 2018 in Italy. To this end, biophysical and economic values for ES supply extrapolated from the literature were stored in a database. Subsequently, the data were analyzed to define biophysical and economic unit coefficients for land cover classes and estimate, through benefit transfer, the ES supply value in the years under investigation. Finally, to estimate and further detail the change that occurred in ES supply, we combined economic coefficients with the transition and permanence approach from previous work [48]. This approach is innovative as it combines transition matrices with biophysical and economic ES coefficients for land cover classes.
The study, while having its limitations, is the first step in a line of research that aims to propose approaches to estimate the variation of ESs on spatial and temporal scales. Such studies could support the governance and implementation of natural capital conservation policies and strategies at a global level.

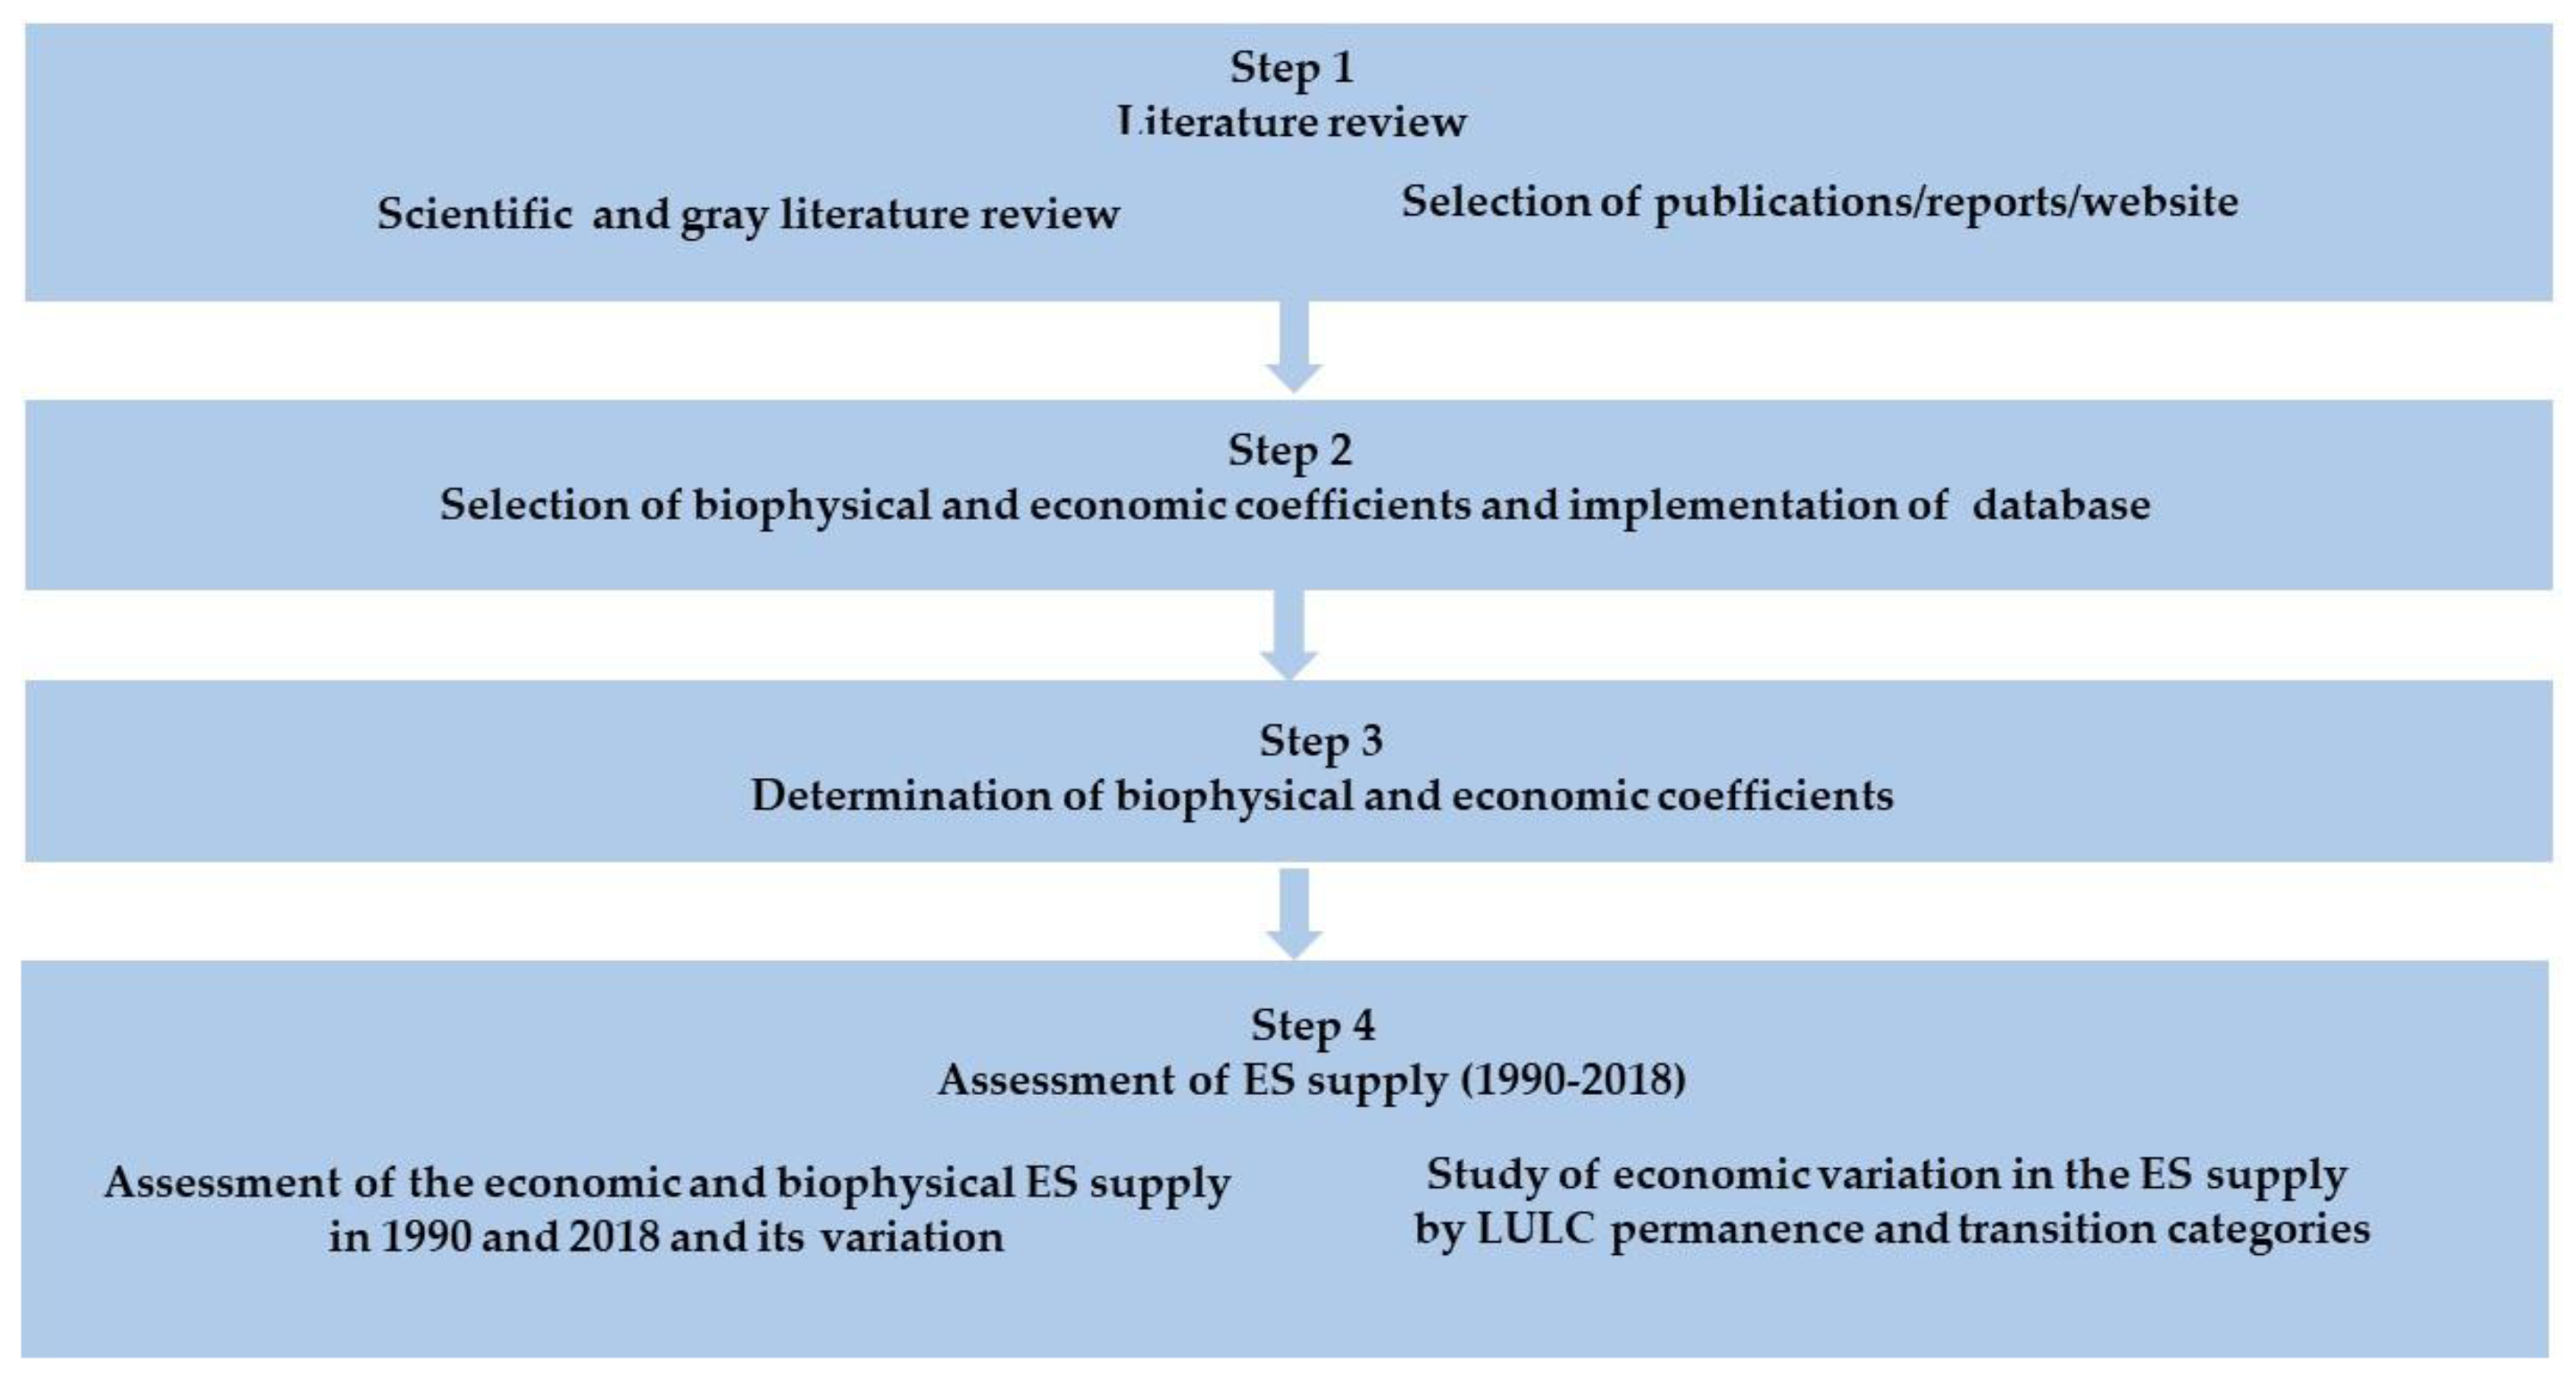
2. Materials and Methods
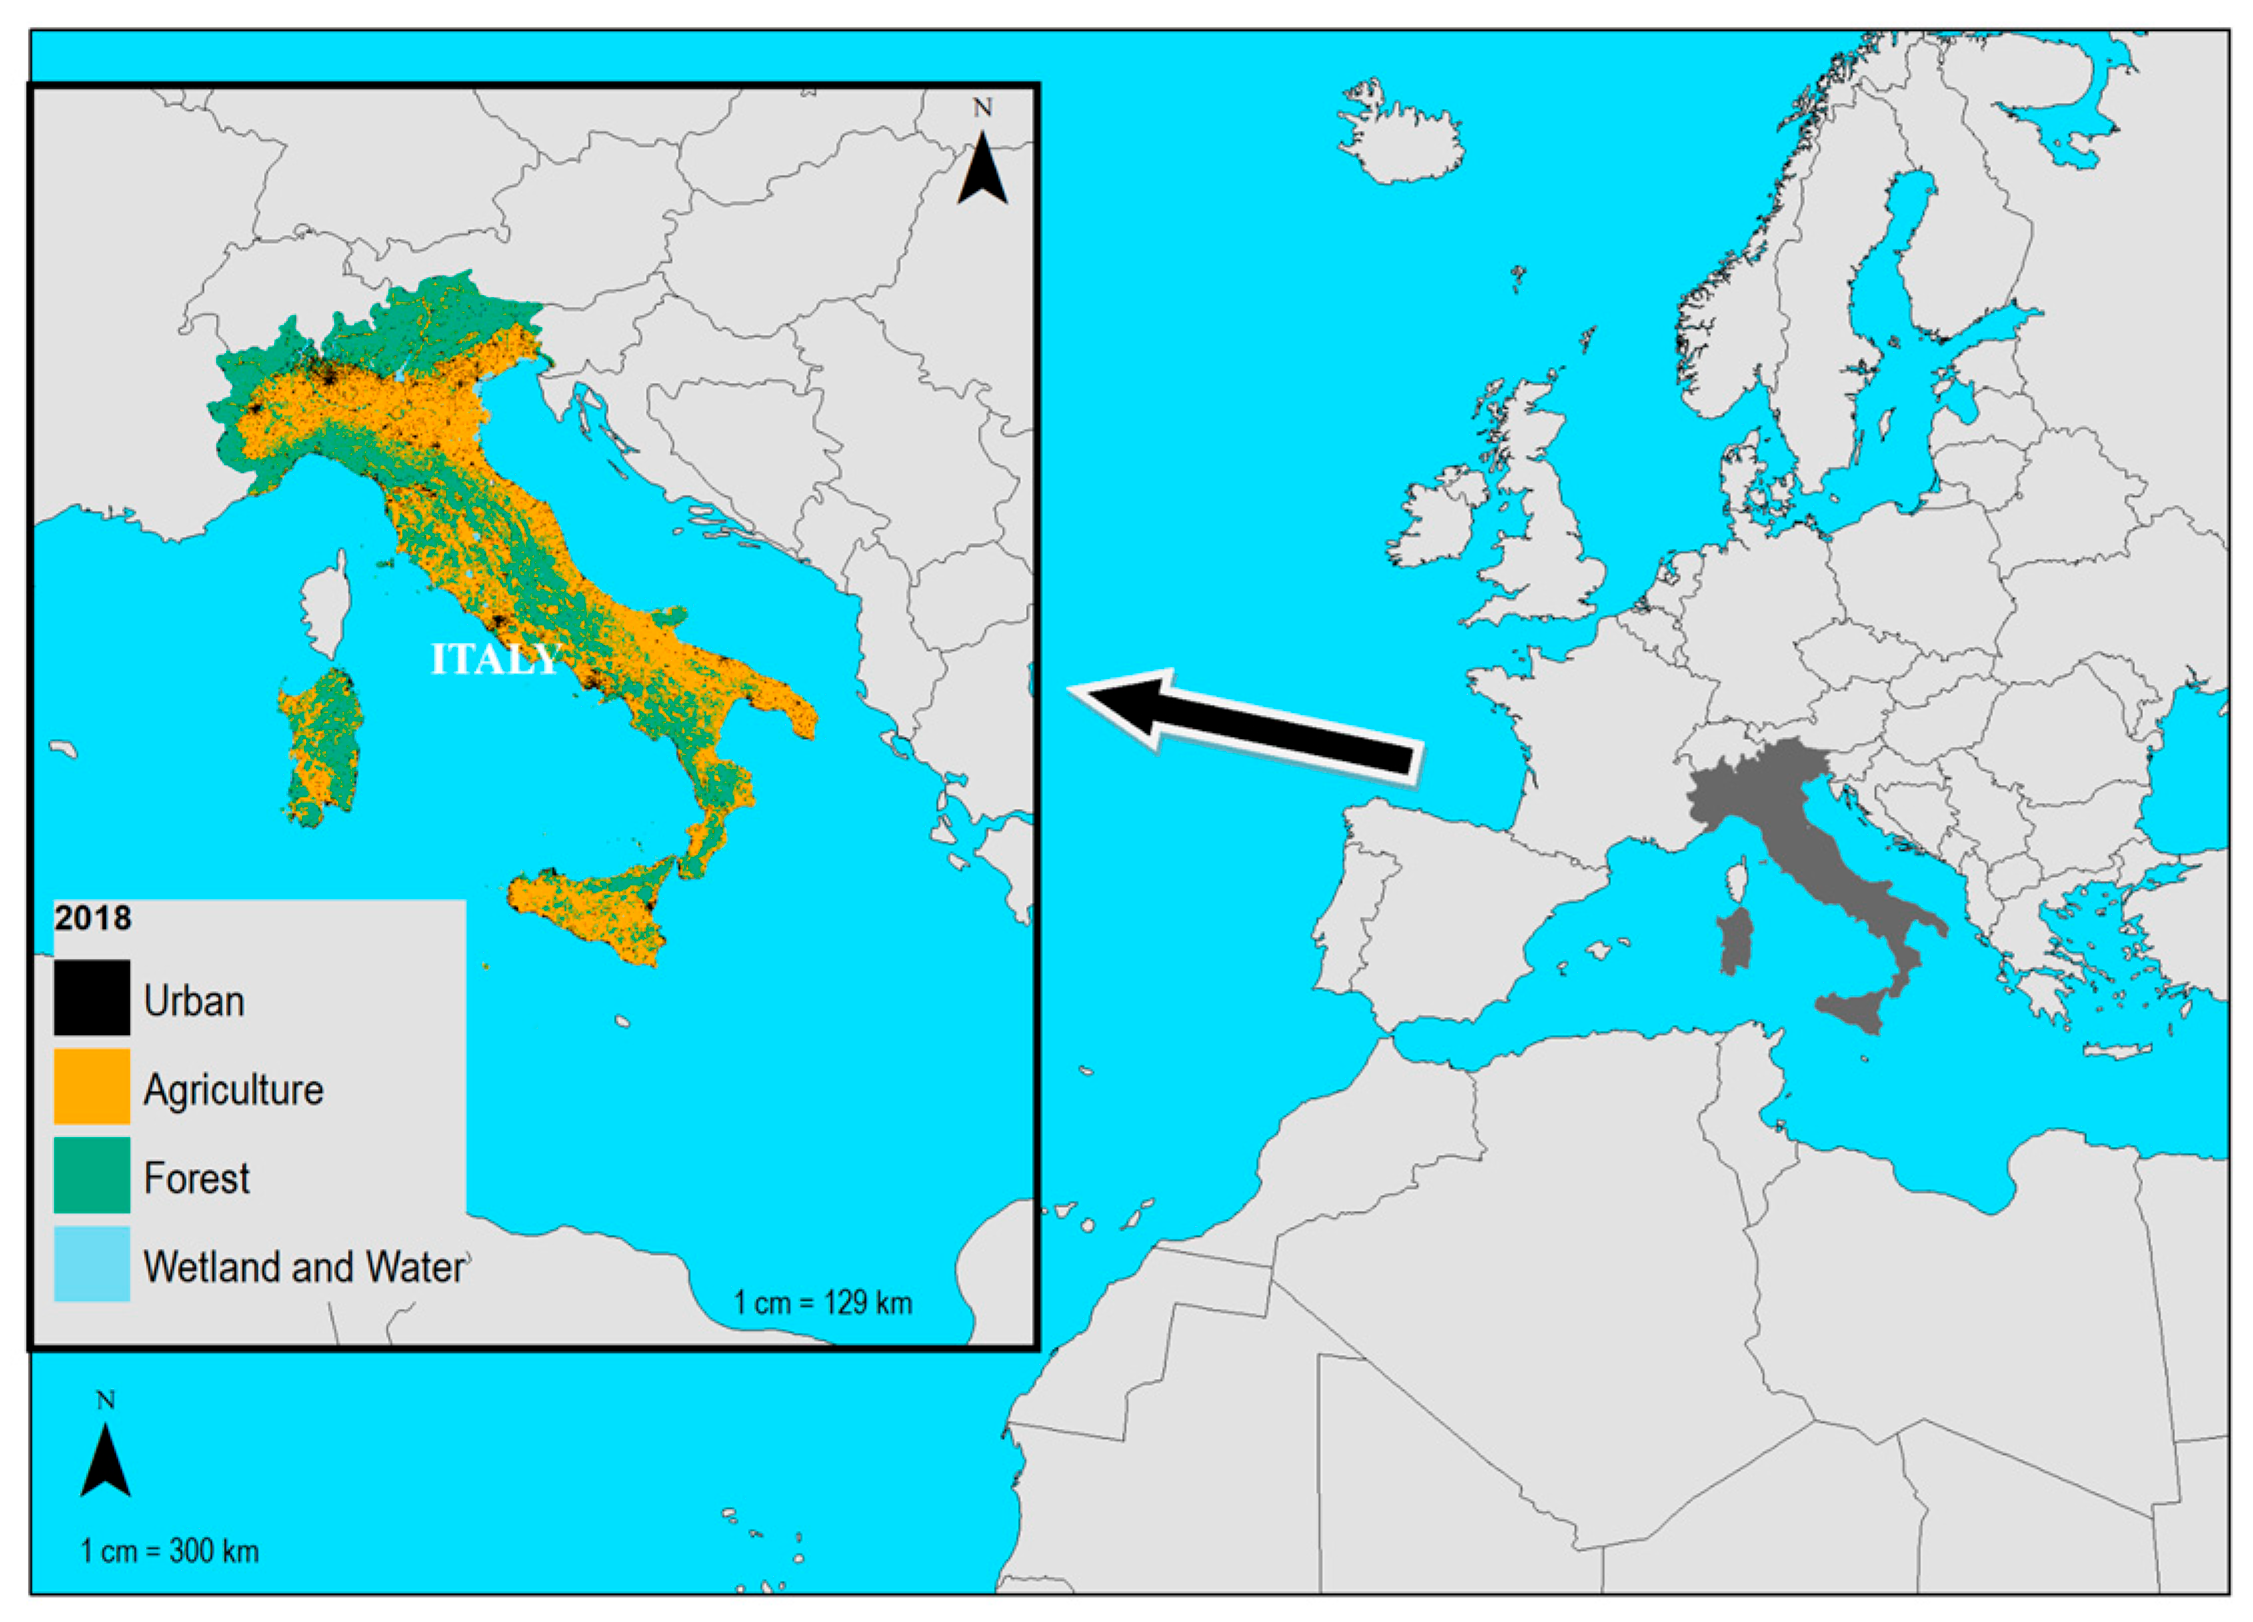
This research was carried out in four steps, which are shown in Figure 1. After conducting the literature review (Step 1) we selected the biophysical and economic coefficients of ES supply by land-cover class. We created a database, associating each land use and land cover class with a biophysical and economic coefficient (Step 2). Next, we aggregated these values by macro class to increase the degree of coverage of the biophysical and economic coefficients for Corine Land Cover classes (Step 3). Finally, using the benefit-transfer approach, we assessed the variation in ES supply in relation to permanence and transition phenomena [48] in Italy from 1990 to 2018 (Step 4).

2.1. Study Area

The study area corresponds to the territory of Italy, which covers 301,605 square kilometers (Figure 2).
The study of land use changes was conducted through the approach of transition categories [48,49] which allows synthesizing the results related to the dynamics of transformation and permanence of land uses (Perm.) into classes such as permanence (of arable land, permanent crops, urban area, forests, heterogeneous agricultural areas, water bodies), evolution to complex systems (Etcs), urbanization (Urb.), agricultural intensification (Ag. Int.) and extensification (Ag. Ext.) and forest expansion (For. Exp.) (Figure 3).
The predominant category is permanence, which occupies 77% of the study area. Forest extension covers 14% of the area, agricultural intensification 6%, complex system evolution 3%, and urbanization 1%, while extensification affected close to zero percent of the area. Each transition has shown a specific presence at the regional level: e.g., urbanization is particularly important in the Piemonte region in the north (2880 ha), evolution to complex systems and intensification in Sicily in the south (respectively 174,181 and 624,255 ha).

2.2. Literature Review (Step 1)

The bibliographic review started in March 2023. First, we used the Scopus search engine [50] to analyze the scientific literature over 23 years from 2000 to 2023. We tested different combinations as search queries consisting of the same set of keywords for the title, author keywords and abstract sections. Within the combinations, we used: (i) economic AND biophysical AND value AND ecosystem AND services; (ii) economic AND coefficient AND ecosystem AND services; biophysical AND coefficient AND ecosystem AND services. In addition, we consulted the ESVD database [45]. Despite the quantity of studies available both in the Scopus search engine [50] and in the ESVD database [45], we selected data considering: (i) studies conducted in areas with a similar climatic typology to Italy; (ii) the possibility of associating the ES values with our minimum considered spatial unit, that is, the CLC class at level III; (iii) the availability of coefficients (biophysical and economic) referring to the surface area (e.g., EUR /ha). We also consulted grey literature (Appendix A) and other statistical sources. In particular, for the extraction of the unit coefficients for the agricultural production service, we referred to the agricultural section of the Italian Institute of Statistics (ISTAT) [51] and data from the Research Council for Agriculture and Agricultural Economics Analysis [52]. From the first source, we extracted the biophysical production values per hectare of the major Italian crops, and from the second the respective economic values per Mg produced. Concerning the ESs analyzed in our paper, we have not considered cultural ESs. As regards green urban spaces in Italy, we have selected some articles, including those by Manes et al., 2014 [53] and Bottalico et al., 2016 [54], which highlight their contribution in terms of PM10 removal (air purification ES).
An obstacle to research has also been the persistence—despite the fact that the scientific literature seems to converge towards shared nomenclatures (e.g., CICES)—of differentiation both in the ES nomenclature and in assessment approaches.

2.3. Selection of Biophysical and Economic Coefficients and Implementation of the Database (Step 2)

From the studies selected in the literature review, we then extracted the biophysical and economic supply values of ten ESs (four provisioning and six regulating), in the form of unit coefficients per hectare, at CLC level III. We have not considered cultural ES because, in comparison to regulating ESs and provisioning ESs based on biophysical attributes of ecosystems, they are studied through relational and place-based approaches. The provisioning ESs and regulating ESs are often investigated through land cover analysis and remote sensing techniques that associate biophysical values with land uses [55], while cultural ESs are often analyzed through participatory approaches such as, for example, participatory mapping, to reveal place knowledge and related cultural benefits [56,57]. In fact, aesthetic and spiritual recreational benefits are strictly linked to the environmental, cultural and historical heritage of the area.
The biophysical and economic values were entered into a database and sorted by the ES type considered and by the CLC Level III class providing the specific service. Finally, for the economic coefficients, we converted and discounted the estimates into 2022 EUR ha−1 yr−1 using the consumer price index [58].

2.4. Determination of Biophysical and Economic Coefficients (Step 3)

Since the collection of coefficients at CLC Level III did not allow for optimal coverage of land uses that could potentially generate ESs, we aggregated these values into ‘macro classes’. To do this, we used the weighted average based on the proportion in the area (in 1990 and 2018) of the CLC Level III classes contained within the “macro classes”. These macro classes conform to the CLC Level II land use classification, except for classes 100 and 500 which are higher-order aggregations (see Section 3.2). We then analyzed the coefficients collected through statistics such as the mean, standard deviation, median, minimum, and maximum for each macro class and each ecosystem service. This allowed us to analyze the distribution of values, their variability and to identify the central values.

2.5. Assessment of ES Supply (1990–2018) (Step 4)

To quantify the supply of services in 1990 and 2018 and the related variation, we used the values for macro classes, and in particular the average values for provisioning services and the median values for regulating services. The choice of using median values for regulating services is because the values (both biophysical and economic) extracted for regulating services have very wide ranges and internal variability, and the median is generally a more appropriate indicator of centrality in the distribution in such cases [59]. The selected values were then multiplied by the area of the specific macro class in 1990 and 2018, resulting in the ecosystem service provision in the two years under investigation. Finally, the relative difference was calculated.
The variation in the ES supply has been more in-depth and summarized through the transition category approach to explain land use change (permanence and transitions) in relation to the specific ES supply variation that occurred in the investigated period.

3. Results

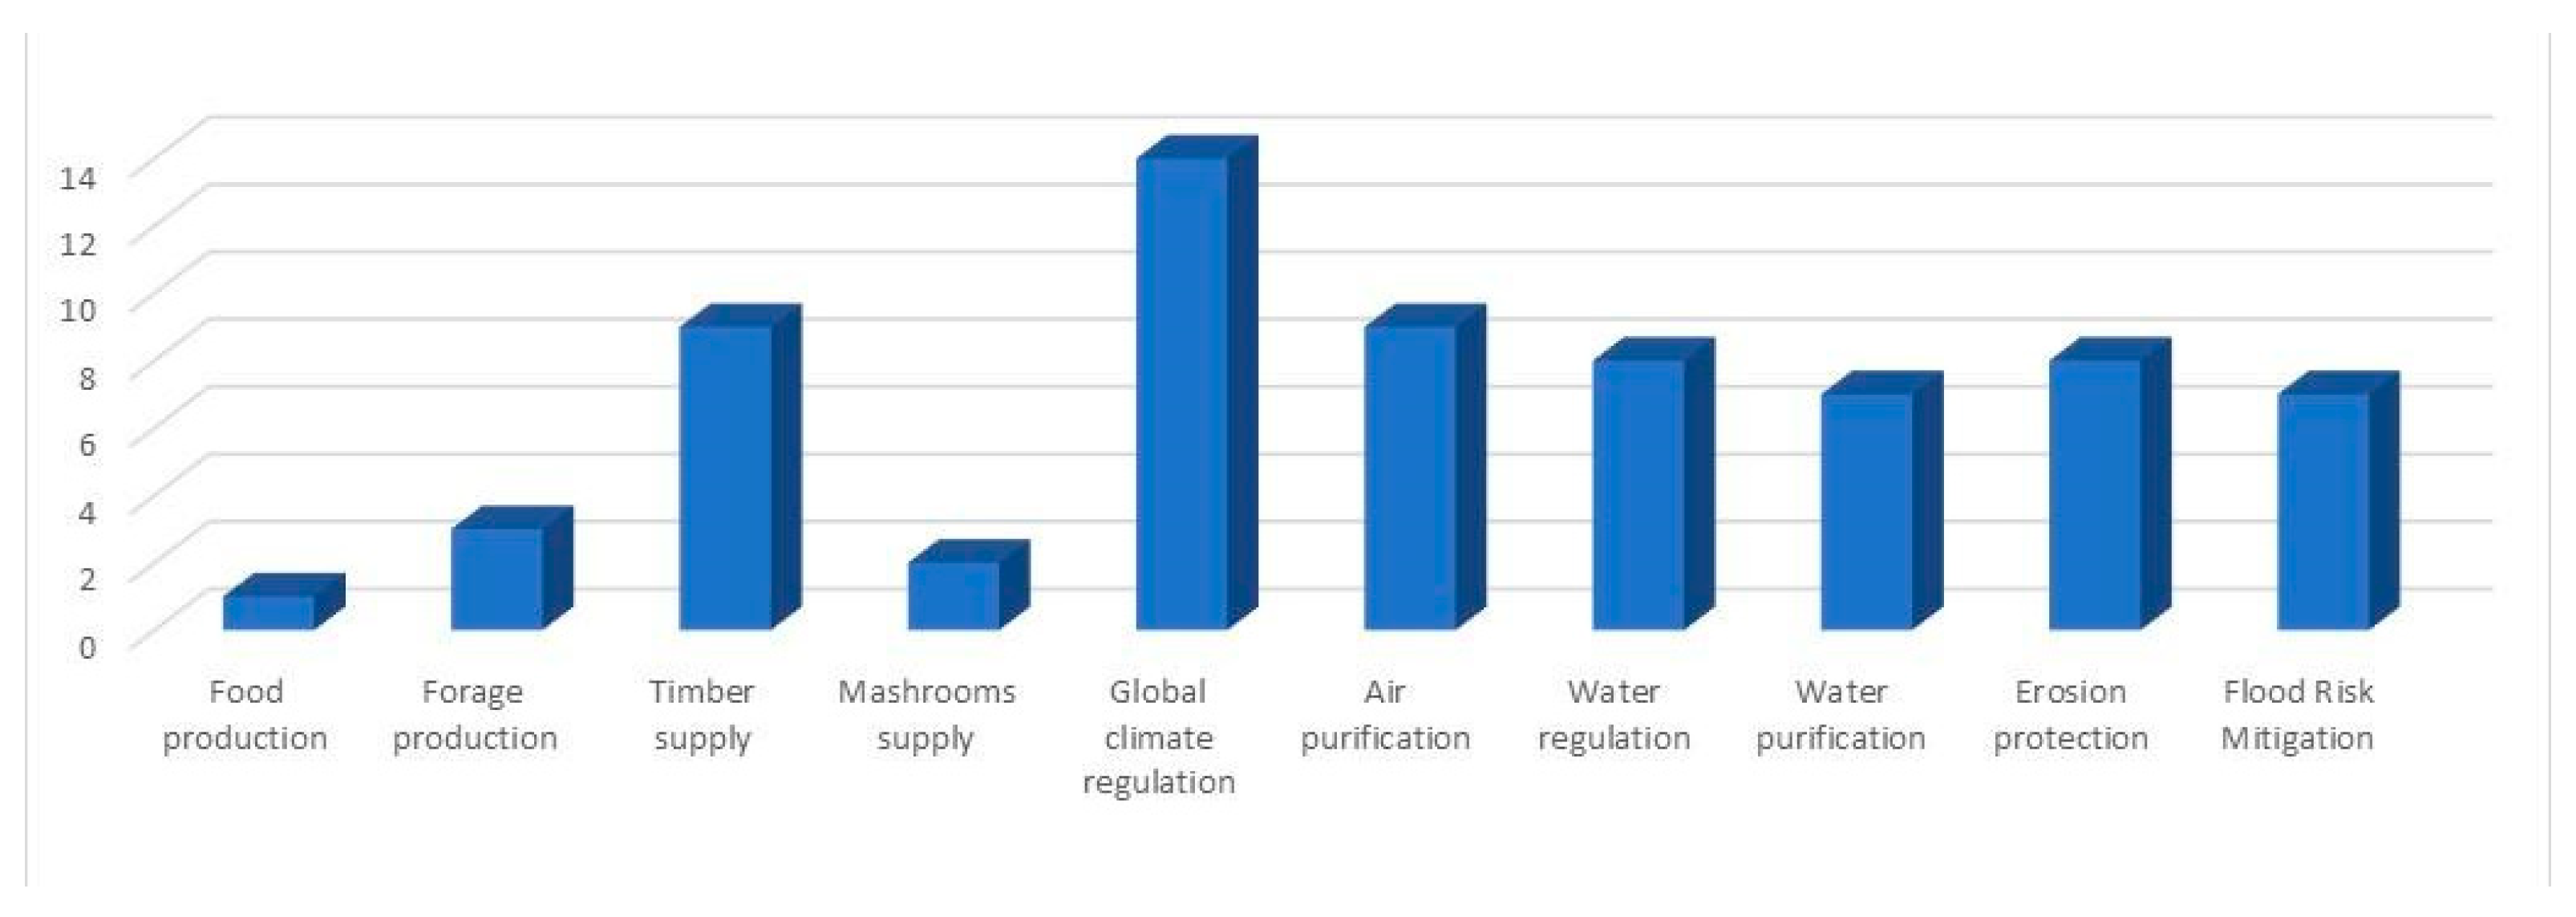
3.1. Literature Review

In total, we considered 29 references that provide biophysical and economic values of ten ES (four provisioning and six regulating ESs) in the function of land cover such as agricultural production, forage production, timber supply, mushroom supply, global climate regulation (carbon sink), air purification, water regulation, water purification, erosion protection and flood risk mitigation.
The studies reviewed (listed in Appendix A) were conducted in Europe (90%), America (7%), and China (3%). From these studies, we extracted about 800 coefficients associated with land cover classes (Corine Land Cover), of which 383 were biophysical and 404 economic. The largest number of coefficients extracted from the analyzed scientific articles concerned the services of global climate regulation, air purification, erosion protection, flood mitigation and raw material supply (timber) (Figure 4).
From analyzing the bibliographic sources, a heterogeneity of methodologies emerged, especially for the quantification and evaluation of regulating ES. Some authors, for example, used the INVEST software for the quantification of erosion protection and flood mitigation ESs [49,60].
The choice of methodologies and software to be used often depends on data availability [61]. Moreover, the economic and biophysical value of an ecosystem service can be calculated by different methodologies. For example, the economic value of the global climate regulation ES can be estimated either by the market price or the social cost method [2,62]. This can lead to unit coefficients of different orders.
The variety of methods and software used for some ESs produces data with a large range of values (MIN and MAX).
Furthermore, it is highlighted that biophysical and economic values are strongly influenced by the spatial context. For example, erosion protection and flood mitigation services are closely related to vegetation cover, geology, lithology, soil gradient, altitude, etc. [63,64,65]. We also observed that many authors have used the same biophysical and economic coefficients to estimate ESs. For example, the work of Nowak et al., 2006 [66] and Escobedo & Nowak (2009) [67] was used to estimate the air purification service. From the bibliographic review (see Appendix A) we observed that for some classes of land use, there is a lack of biophysical and economic coefficients for the provision of ESs. The reason is dual: (1) the scientific literature is limited; and (2) some land cover classes have no or low potential capacity to provide services as indicated by Burkhard et al., 2014 [26]. In this sense, we have found that in the literature, there is a marked majority of studies on the ecosystem services provided by forests, compared to other ecosystems. This trend in the literature can be attributed to the fact that forests are among the ecosystems with the greatest capacity to provide ecosystem services, both in terms of abundance and variety.

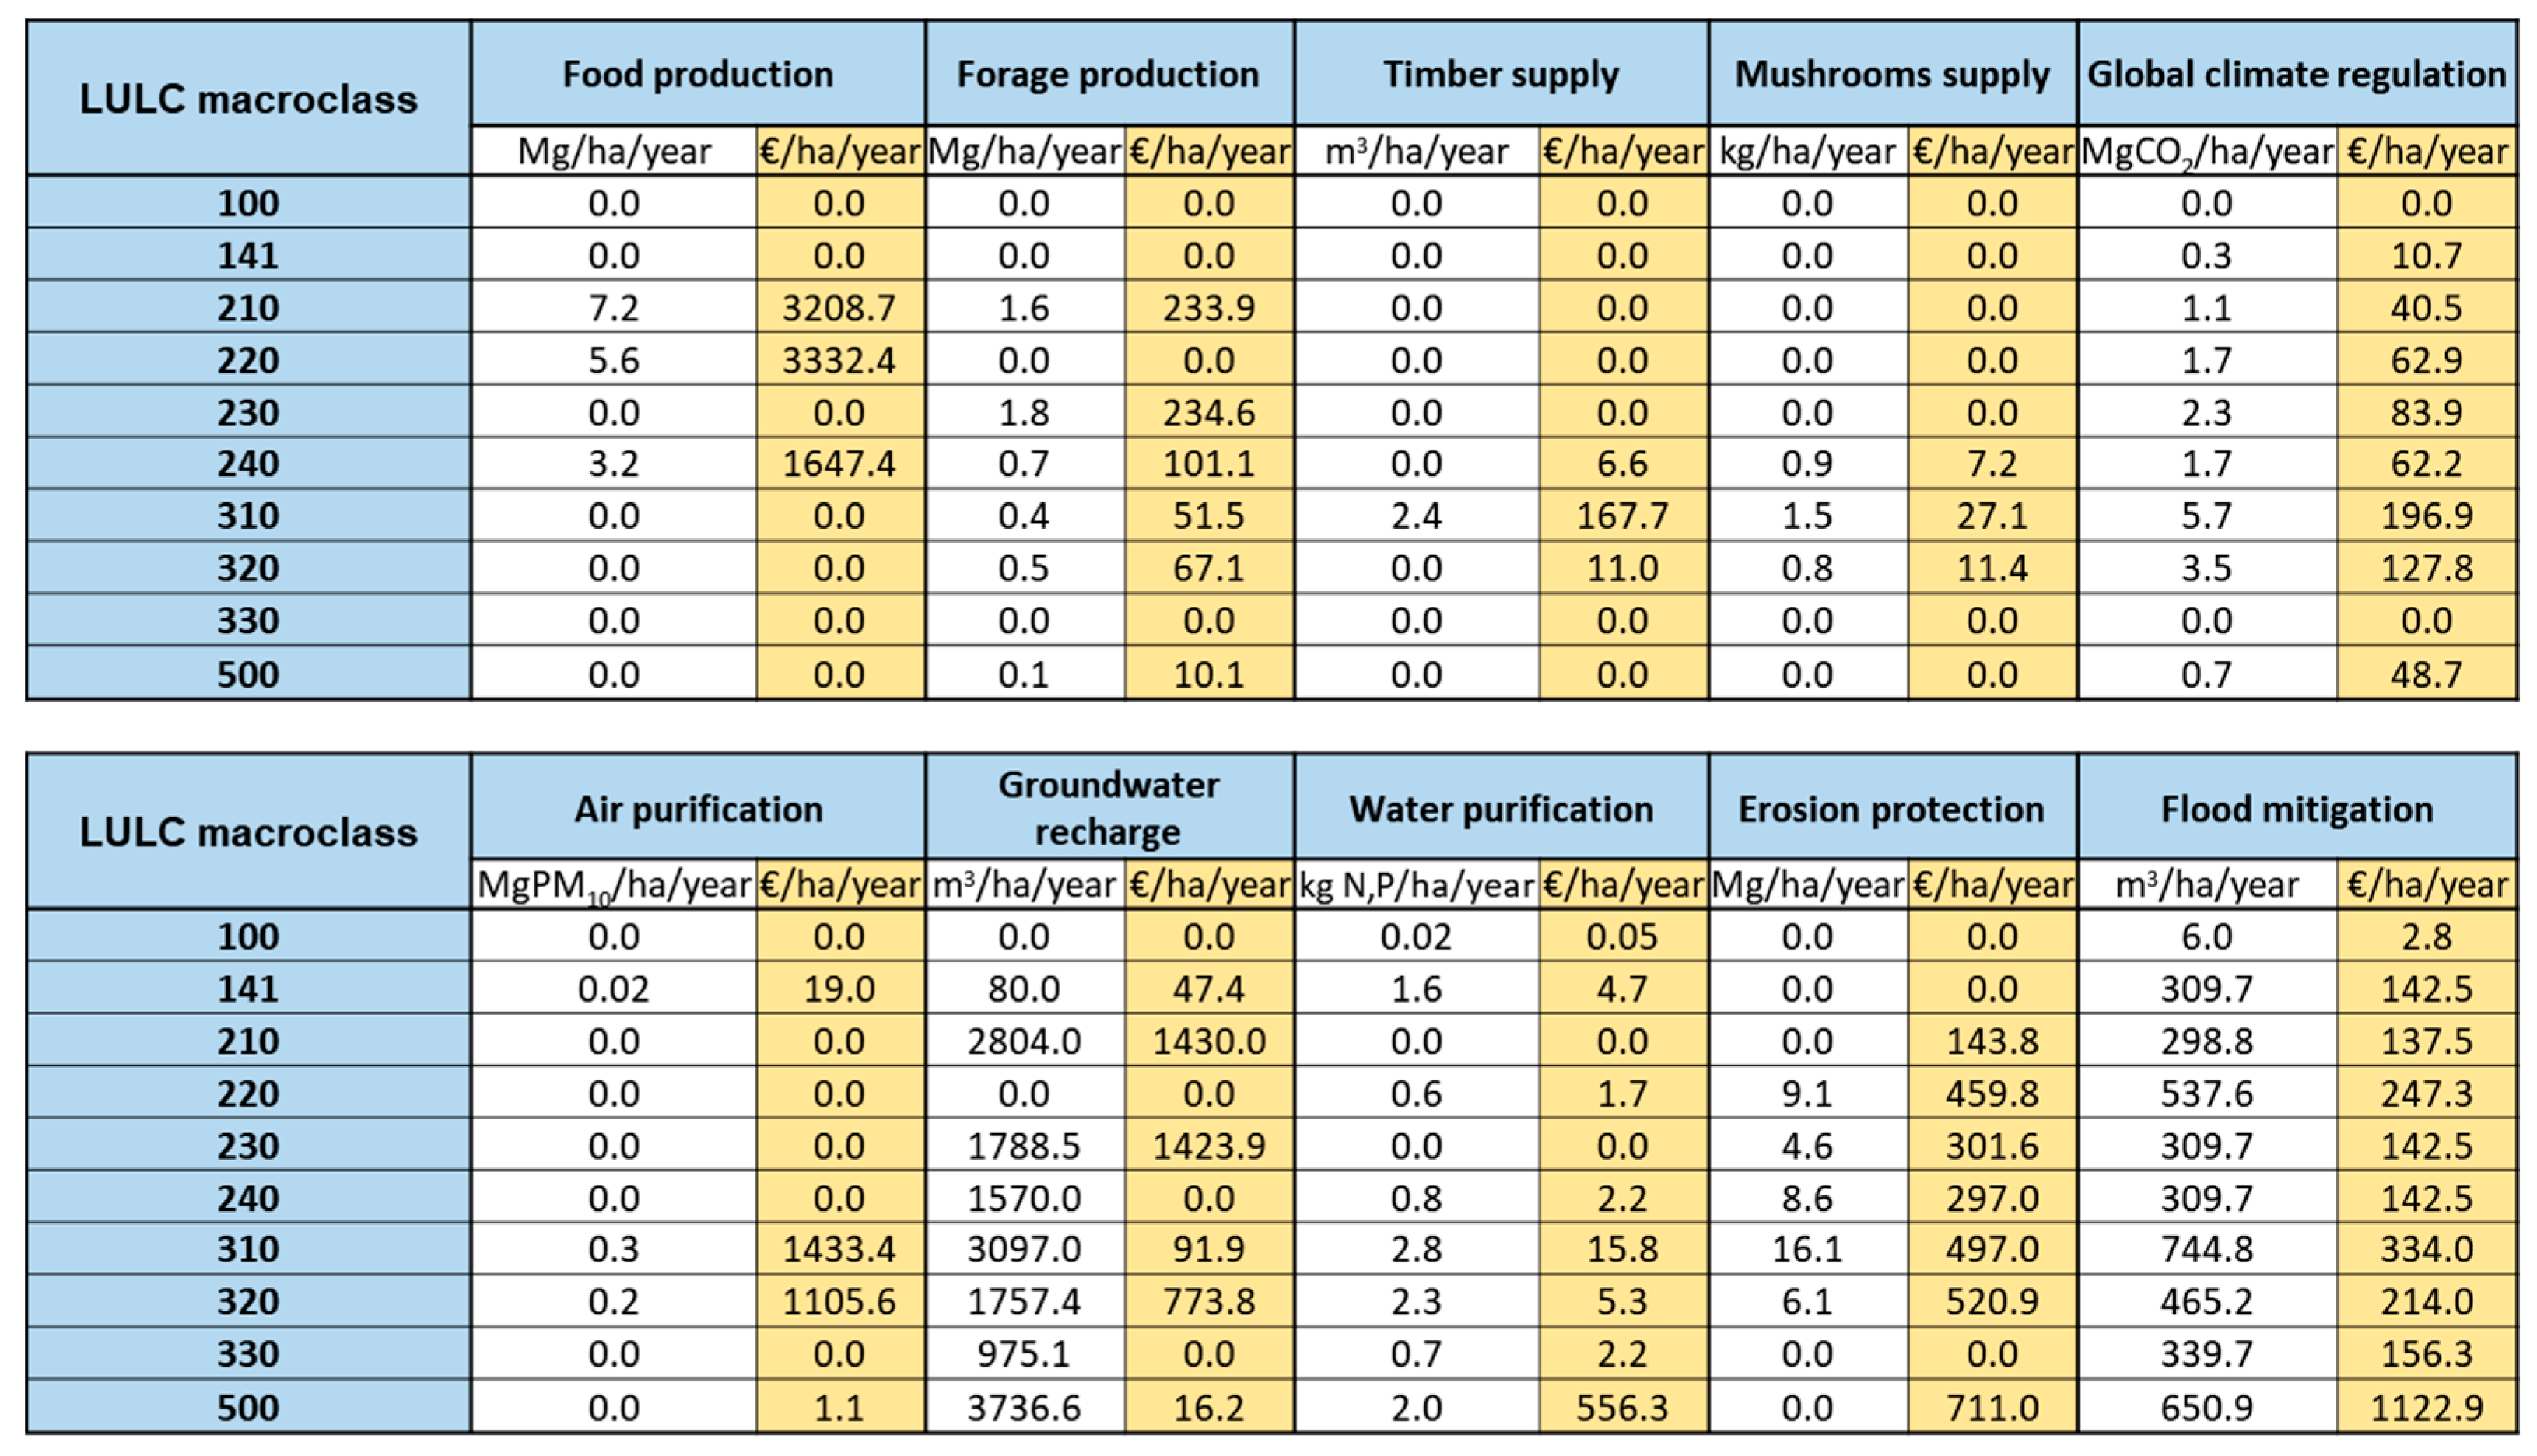
3.2. Determination of Biophysical and Economic Coefficients

Below is a figure (Figure 5) representing the biophysical and economic unit values of the ten ESs analyzed (mean in the case of provisioning ESs and median for regulating ESs, see Section 2.4 and Section 2.5 in Section 2). The values are associated with the macro classes of land use and land cover.
The weighting by macro classes allowed us to obtain a distribution of the coefficients also for those land cover classes in which data was not available from our bibliographic research.
The values reported thus represent the annual (biophysical and economic) flow of ESs for each land use and land cover macro class.

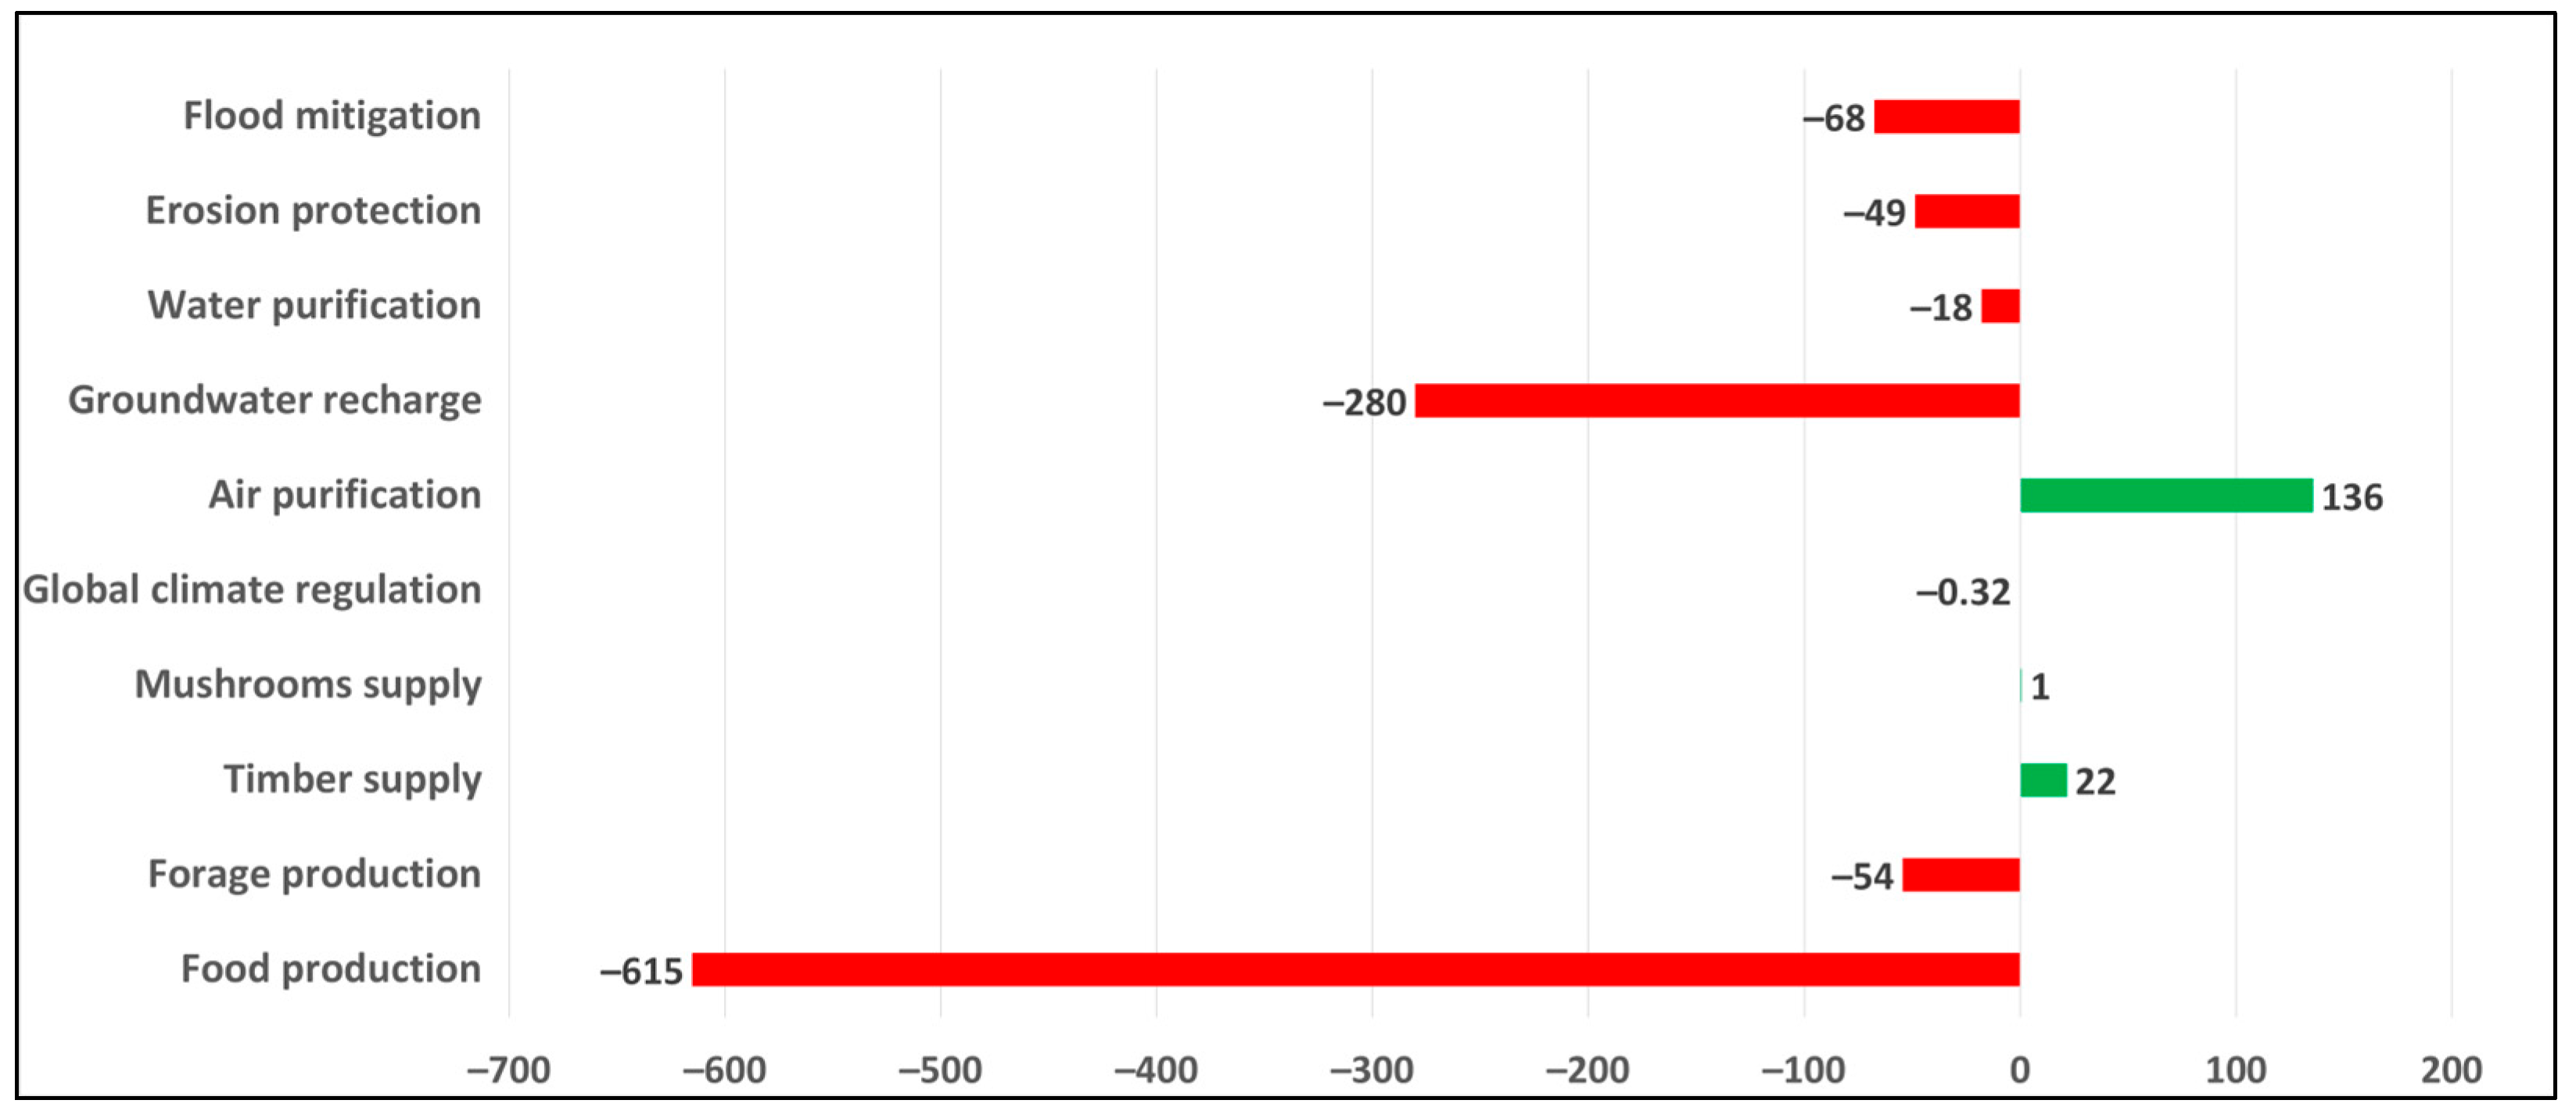
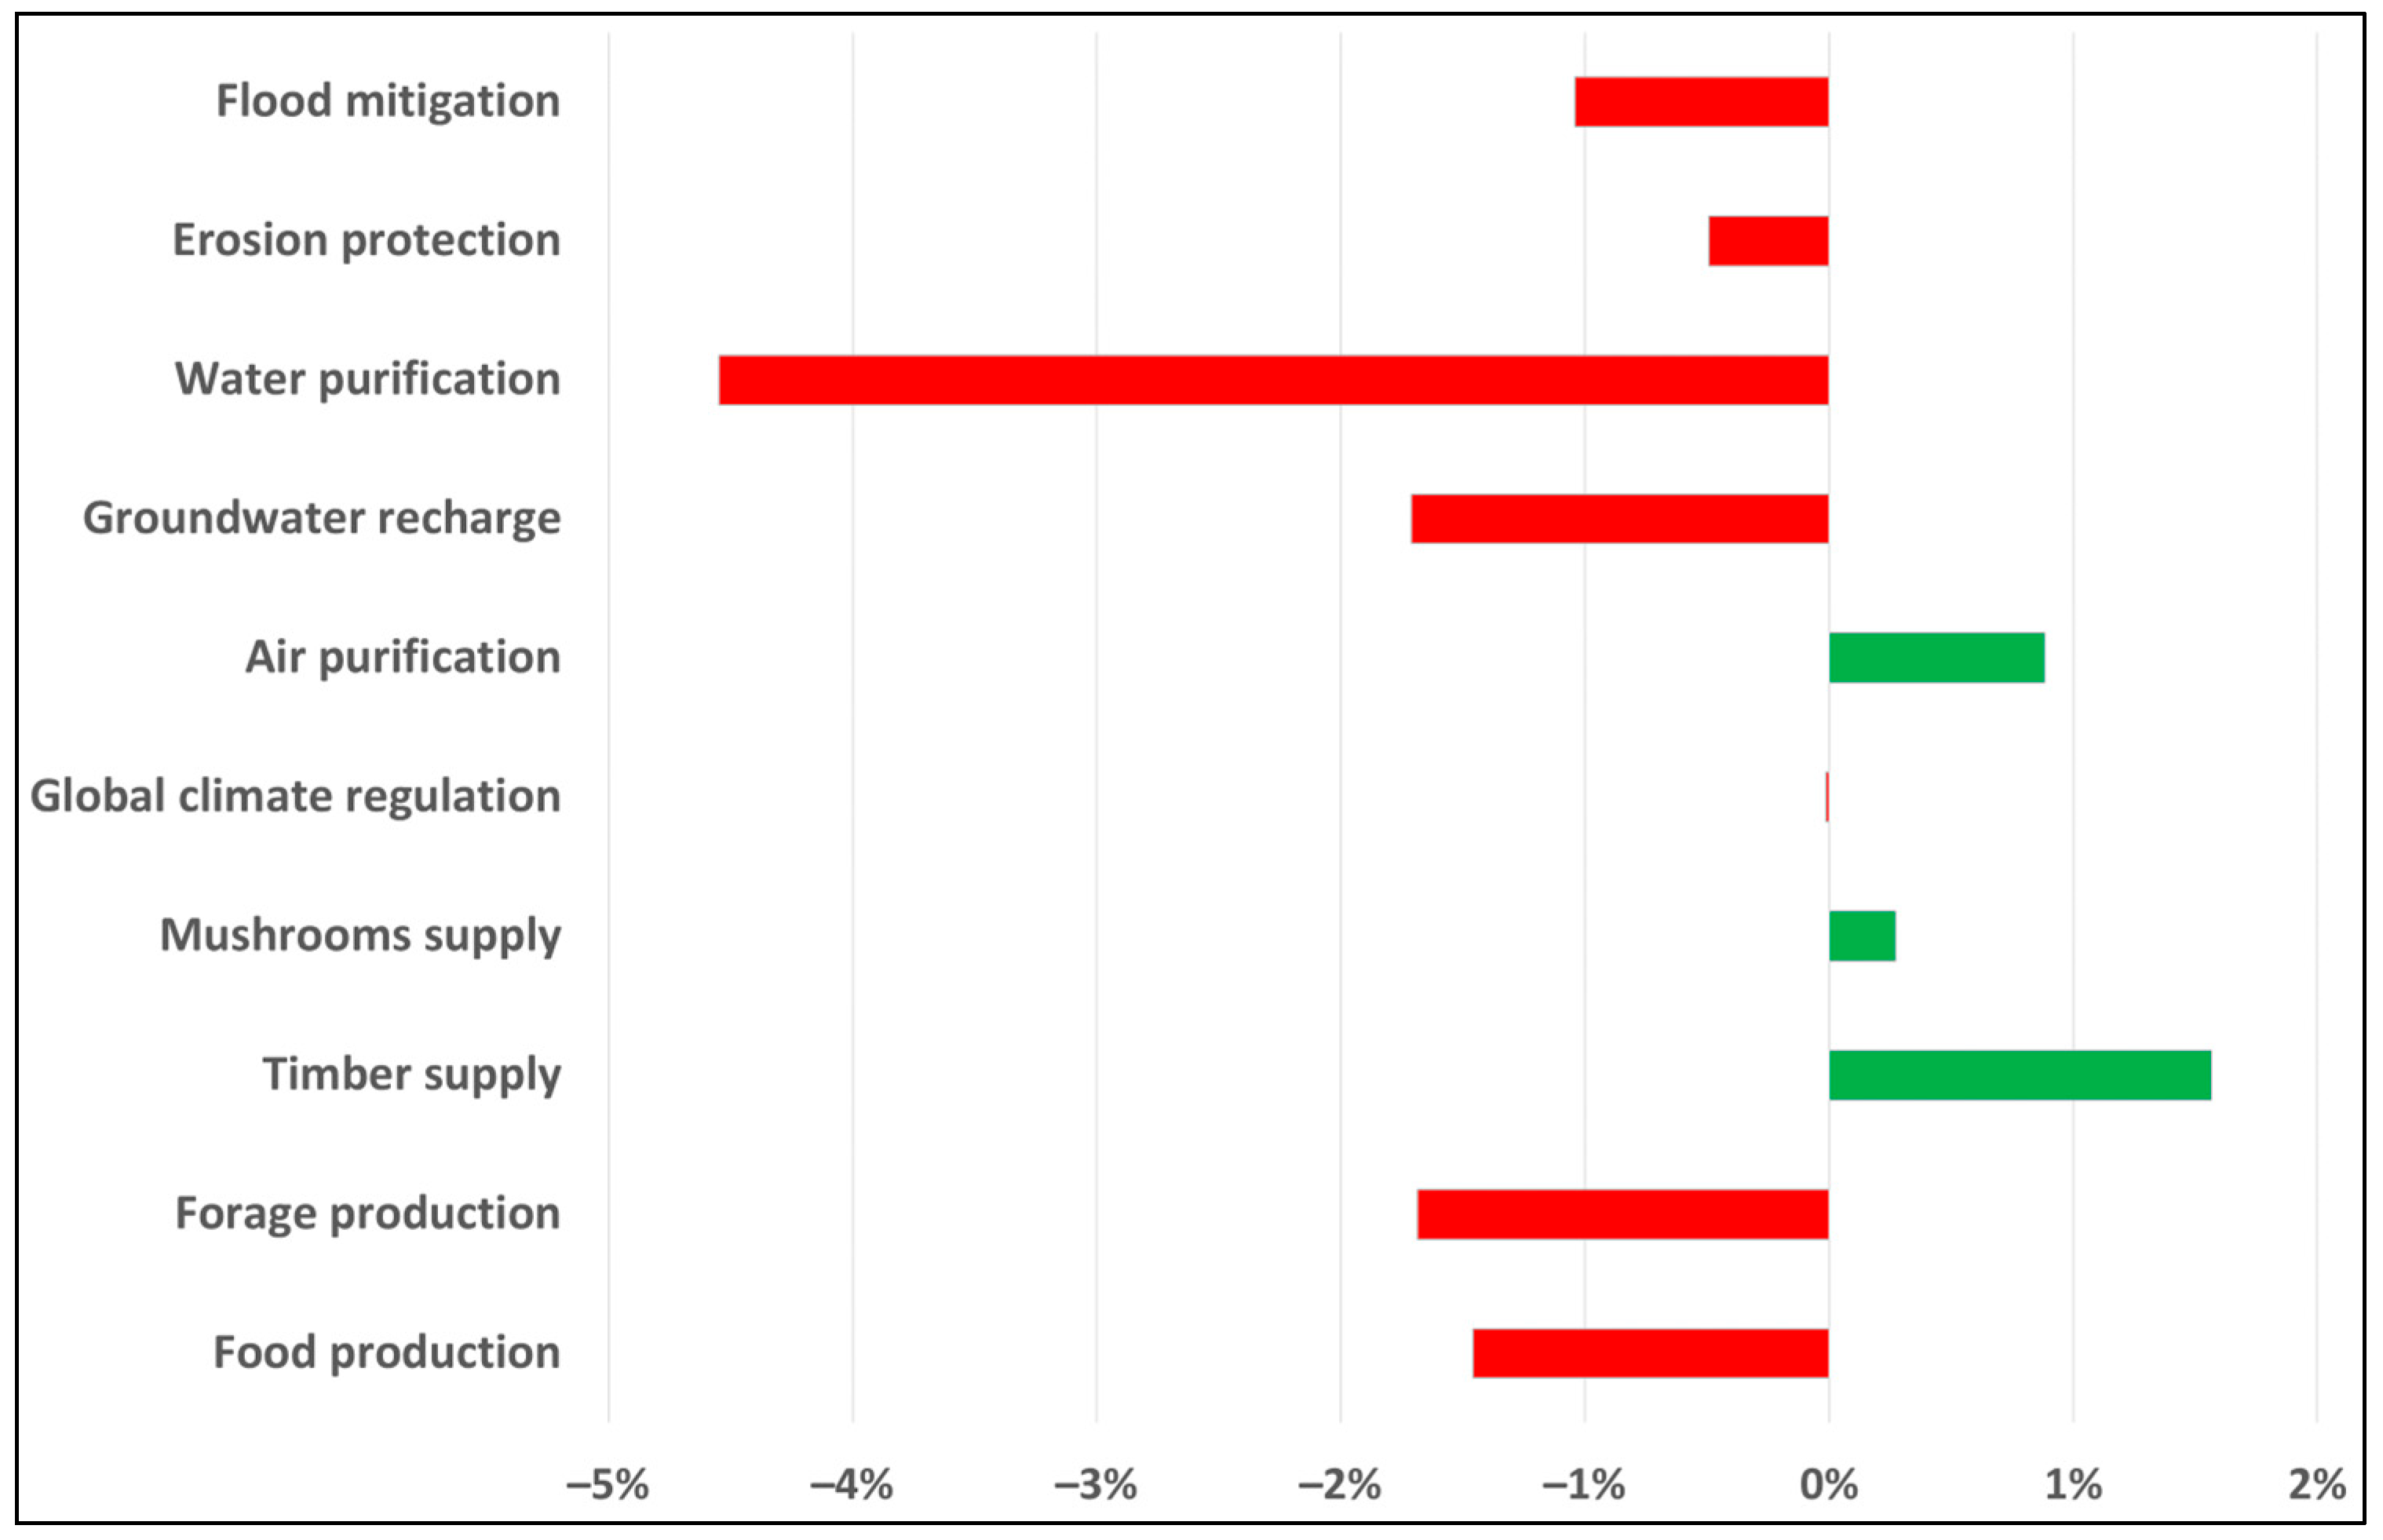
3.3. ES Supply in the Years Investigated and Their Variation

The application of the coefficients found to the Italian land cover in 1990 and 2018 returned the results summarized in the figures below. In particular, Figure 6 shows the breakdown of the economic value of services in the most recent year, 2018.
It can be seen that the service that obtains the highest economic value is food production with a detected value of about 41.5 billion. This is followed by groundwater recharge (about 16 billion), air purification (about 15.5 billion), erosion protection (about 10 billion) and flood mitigation (about 6.5 billion). Finally, with even lower, but still significant values, we find forage production (about 3 billion), climate regulation (almost 3 billion), and timber supply (about 1.5 billion). Water purification and the supply of undergrowth products, especially mushrooms, close with values in the hundreds of millions. Note that those shown are the values of the annual flows (in 2018) of the ten ESs investigated. The total economic value of annual ES supply flows in 2018 is about 97.5 billion. Regarding the change in the annual flows of ES, Figure 7 shows the economic fluctuation of each ES supply determined by LULC changes over the period 1990–2018.
It can be seen that the greatest change in absolute terms is attributable to the agricultural production service, with a loss in annual supply estimated at around 615 million. This is followed by a reduction of about 280 million for the groundwater recharge service. The other services show reductions of an order of magnitude smaller than the first two and concern the ESs of flood mitigation (−68 million), forage production (−54 million), erosion protection (−49 million) and water purification (−18 million). At the same time, for three ESs, we noted an increase in annual supply. In particular, the largest increase is for the ES of air purification with +136 million, followed by relatively smaller increases, i.e., +22 million for timber supply and about +1 million for the supply of mushrooms. We can therefore see that seven out of ten services show negative changes, two of which (agricultural production and groundwater recharge) in the order of hundreds of millions. Overall, the LULC changes in the Italian context that have occurred in the 28 years between the two years investigated, have led to a net reduction in the total annual flow of the considered ESs of EUR 927 million. Finally, the change, expressed in percentage terms, in the biophysical supply of services in 2018 compared to 1990 is shown below (Figure 8). The change in ESs, in this case, has been calculated in percentage terms to obviate the different units used to quantify the different ESs (Mg of CO2 sequestered, m3 of runoff avoided, etc.).
In terms of percentage change, it can be seen that the service that varies the most is water purification, with about +5% (or about +1.9 million kg of pollutants removed) in 2018 compared to 1990. The service that varies the least is that of global climate regulation, with a reduction of only 0.04% (or about 31,000 fewer Mg of CO2 sequestered). Of the negative changes, the largest is agricultural production, with a reduction of just over 1% (almost 1 million Mg of agricultural products) compared to 1990. In only two cases (water purification and erosion protection) are the changes found to be the opposite of what was found for the respective economic analysis (see Figure 7). This can be attributed both to the different coverage of land uses in terms of biophysical and economic unit coefficients found in the literature, as well as to the values found, which in some cases differ in the magnitude of service provision.

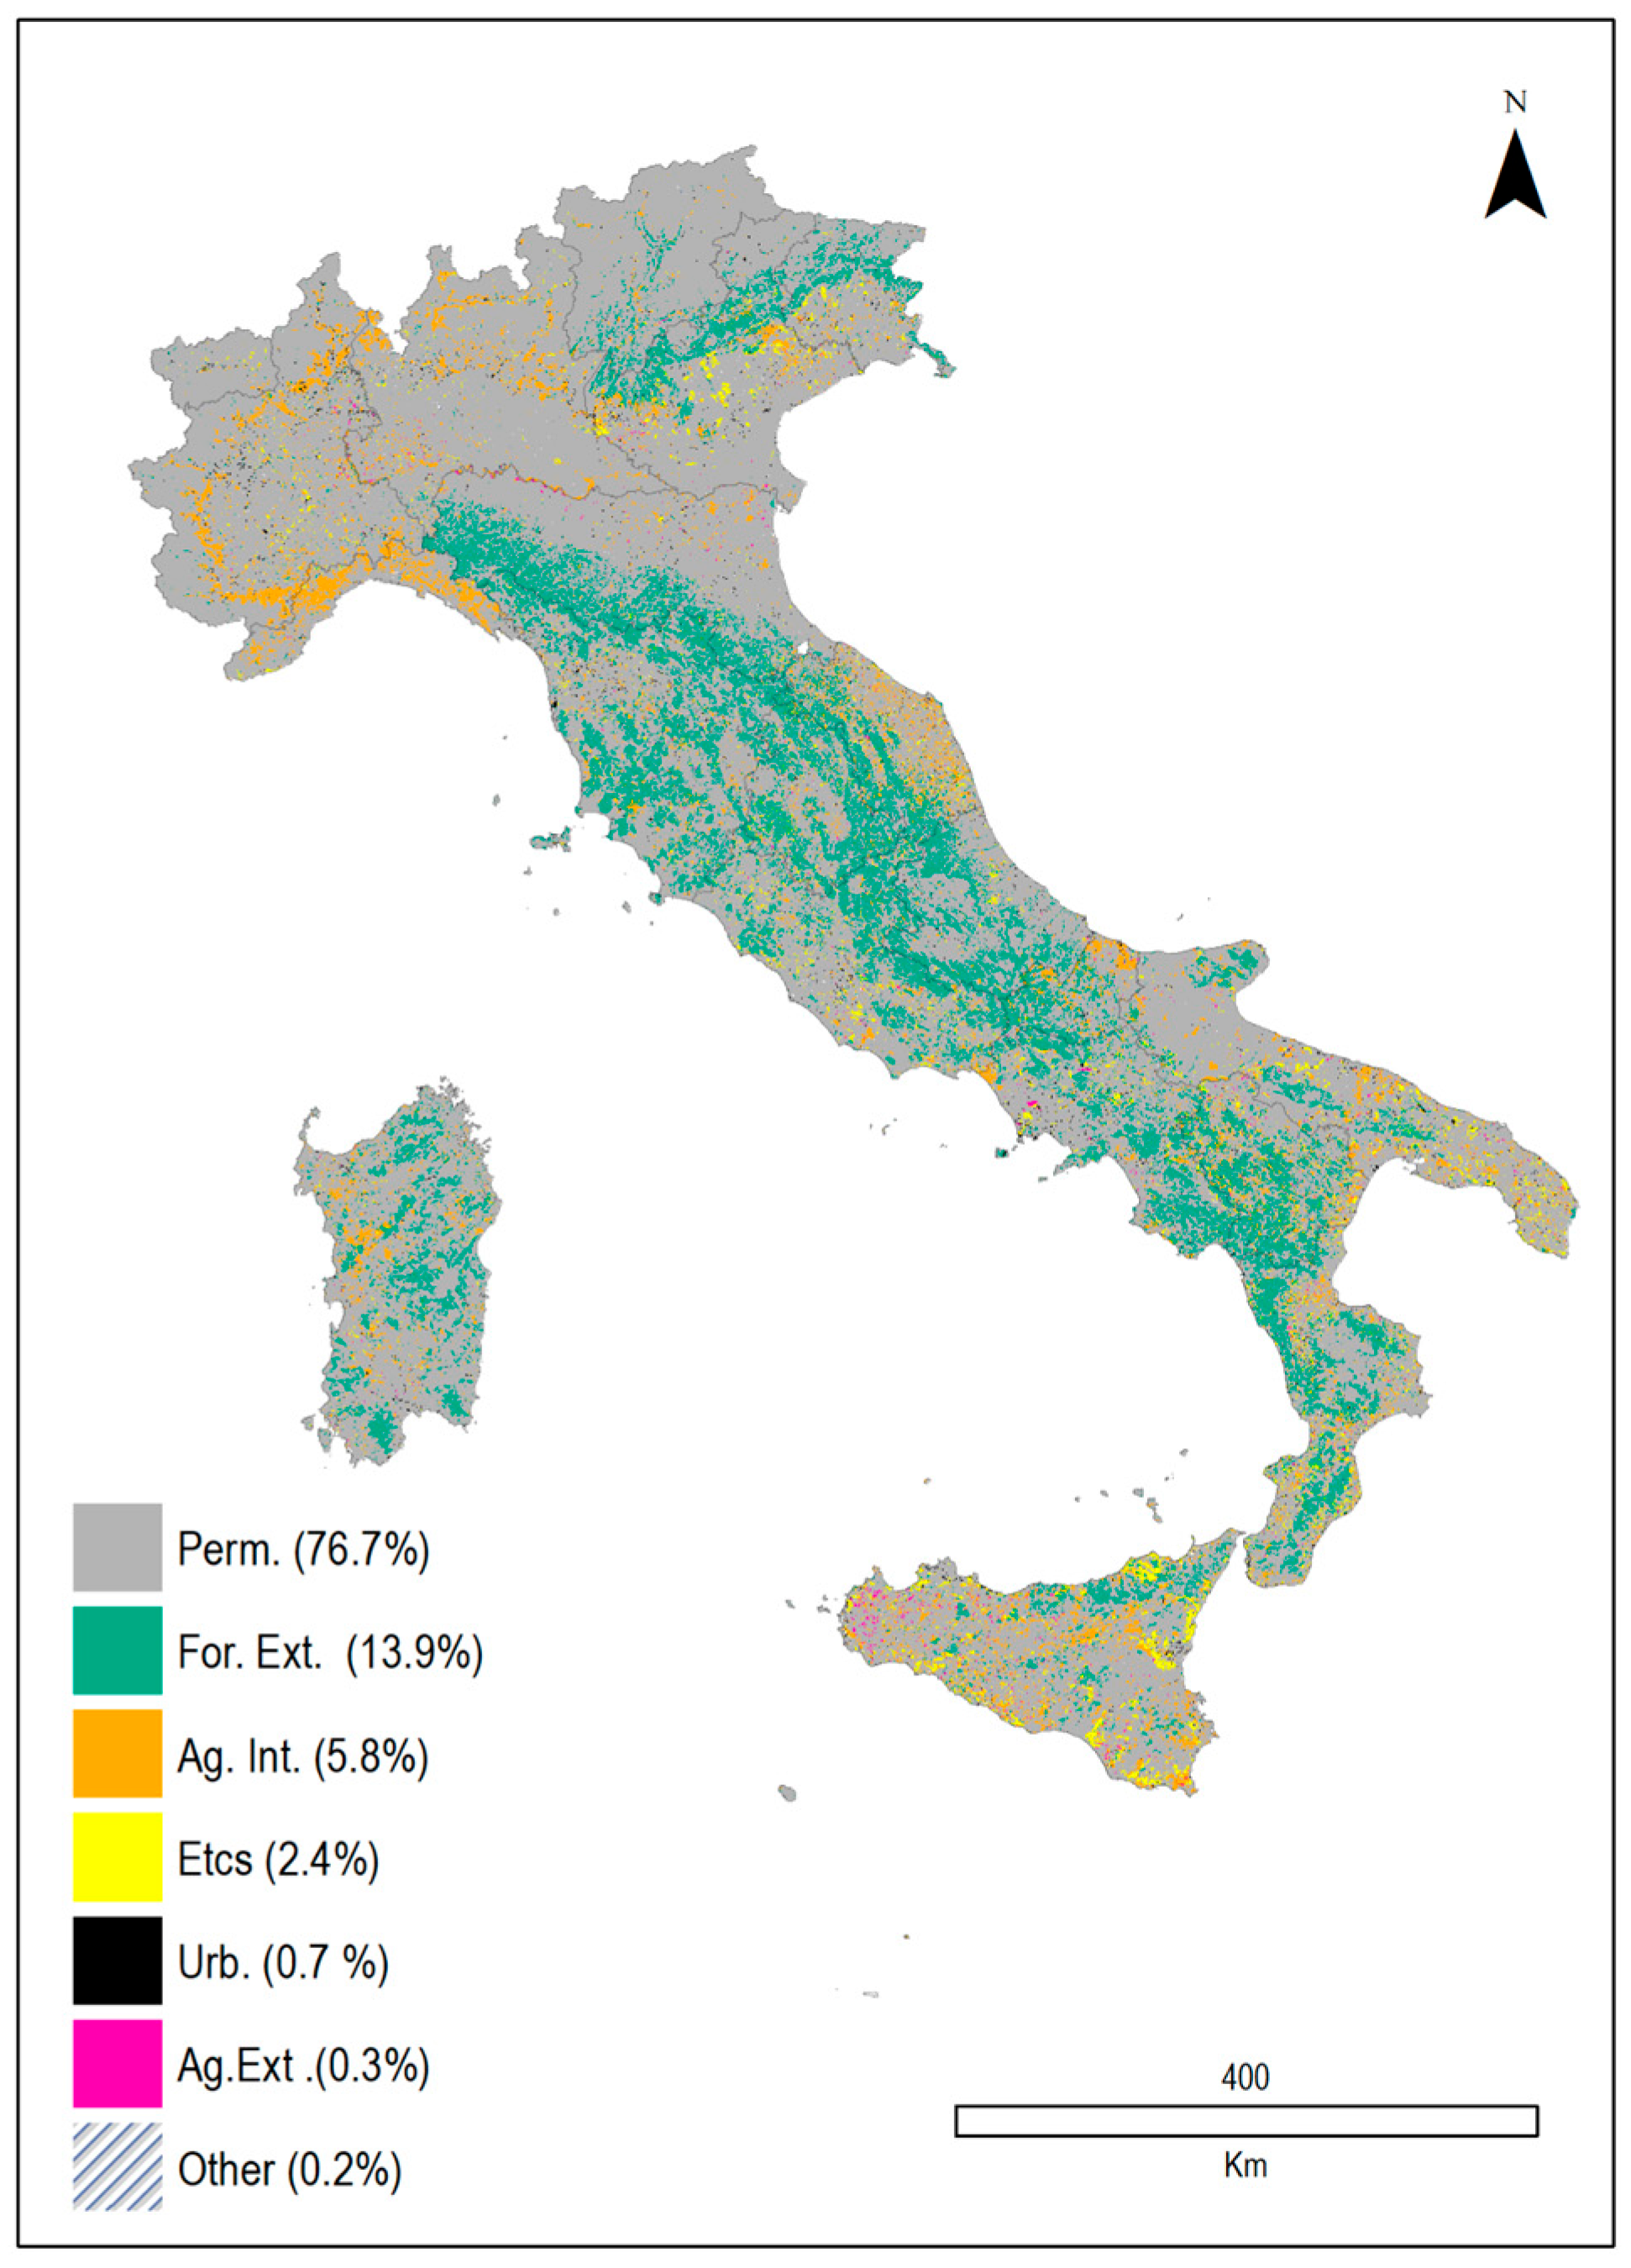
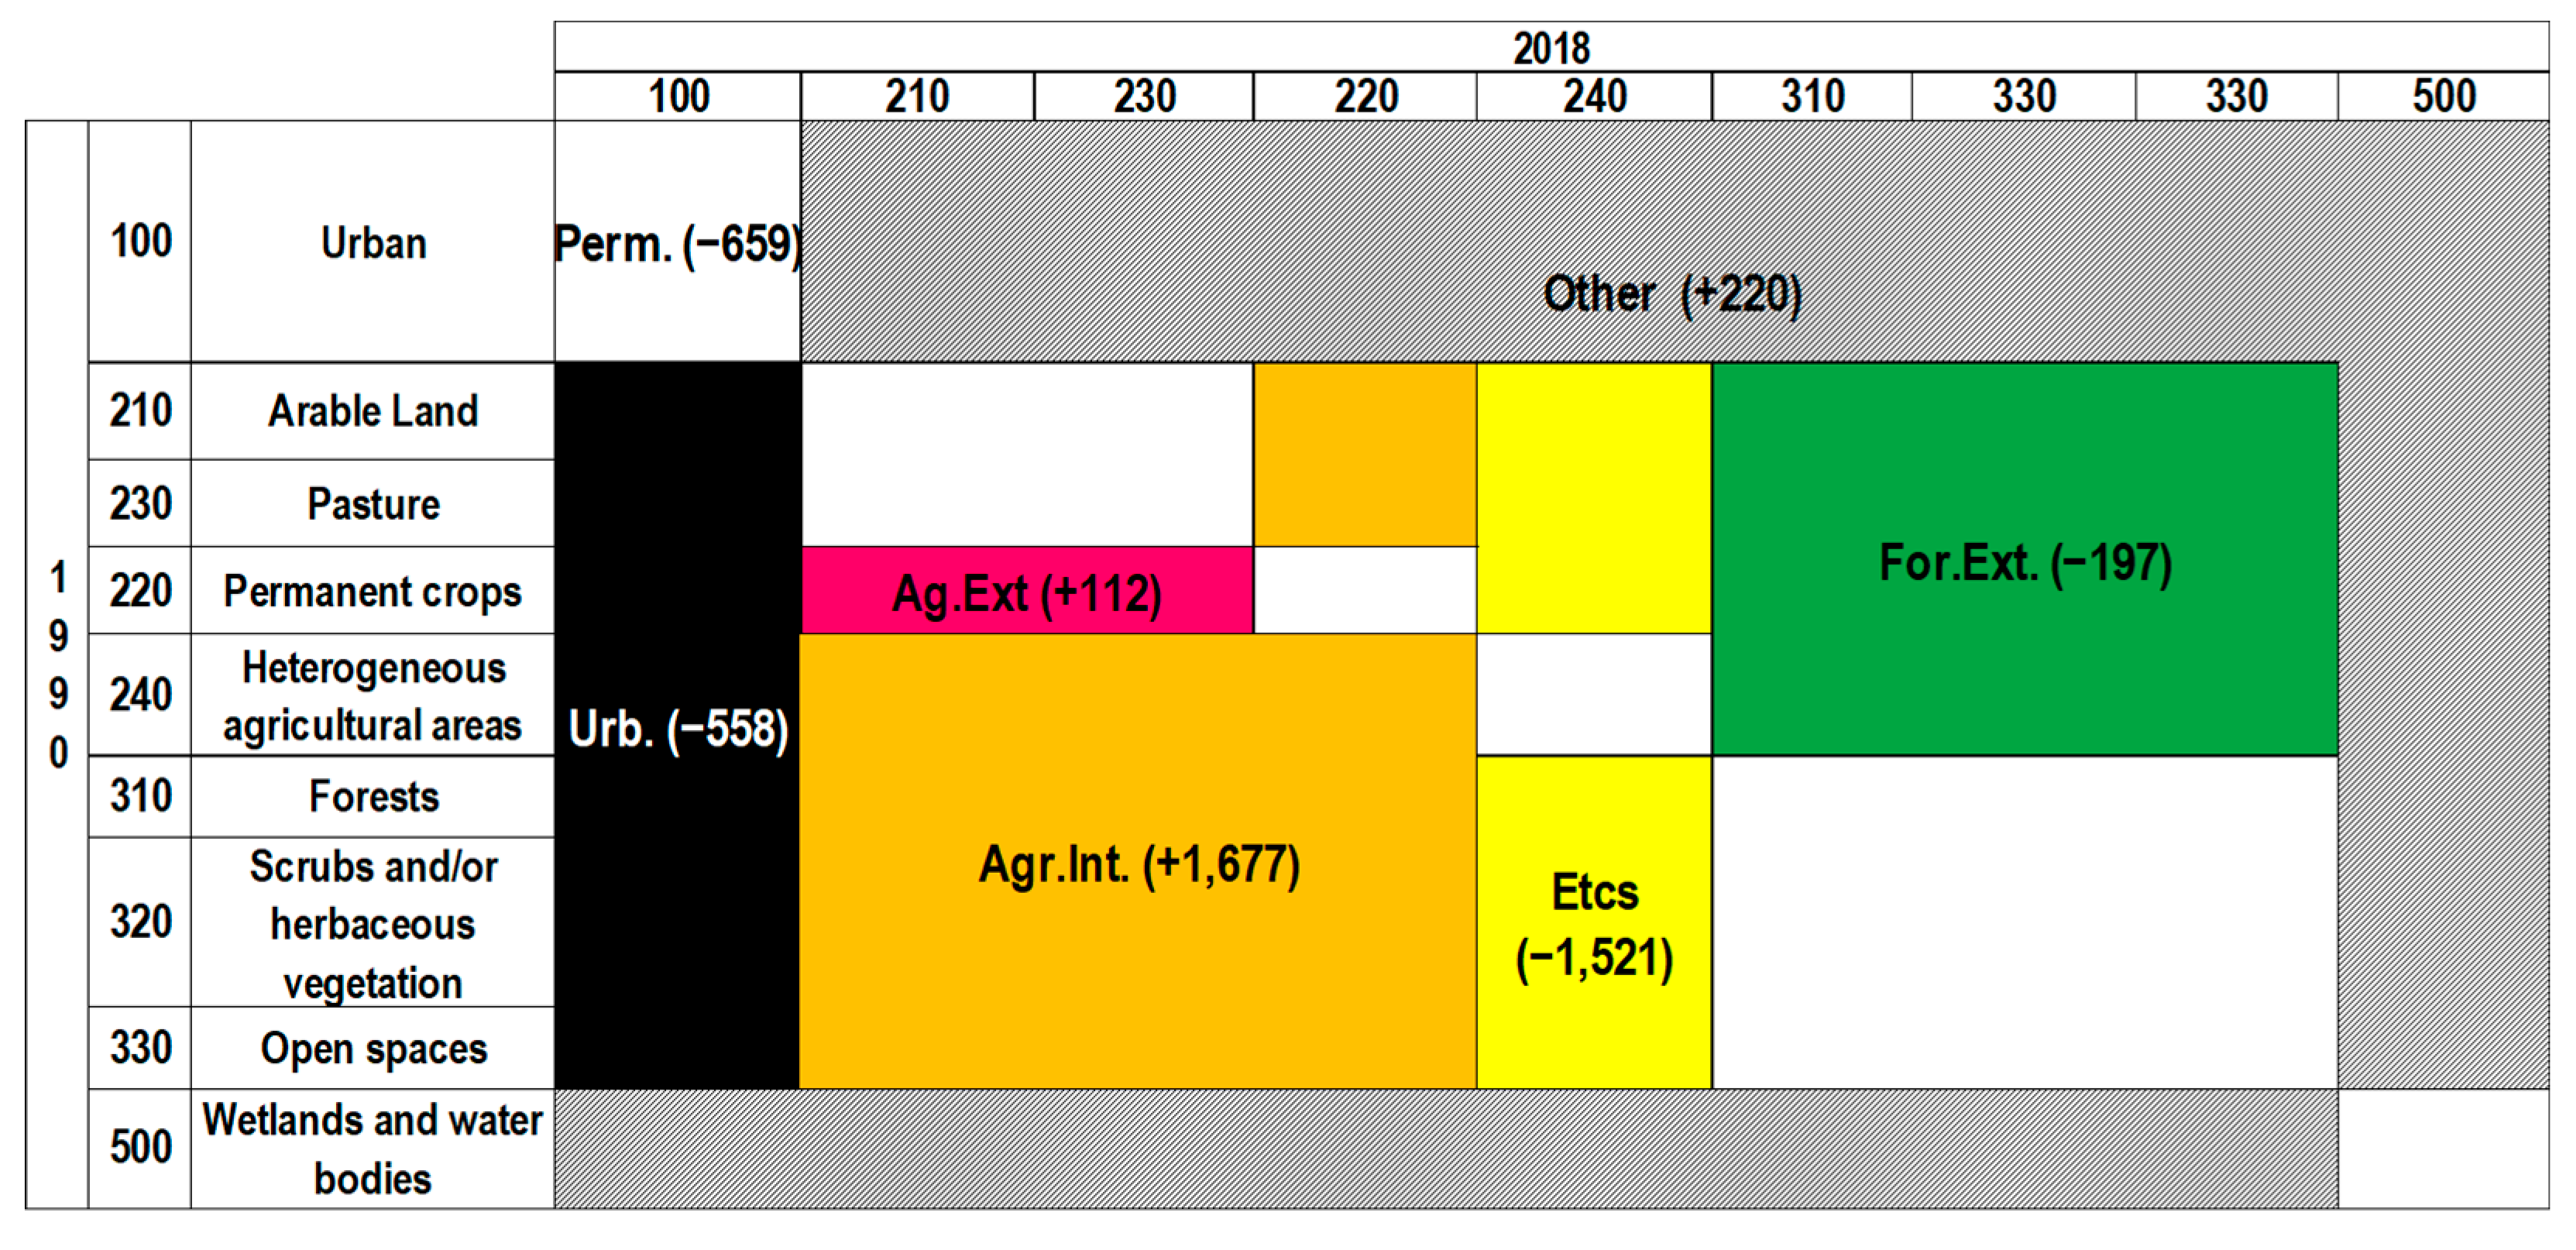
3.4. Economic Variation of ES Supply Concerning the Permanence and Transitions Categories

Concerning the analysis of ES supply variation (Figure 9), the results highlight a relevant economic increase related to the agricultural intensification (+EUR 1677 M) and, conversely, a great decrease linked to evolution to complex system categories (−EUR 1521 M).
In the first case, the increase is due to 77% of the changes toward both arable land (210) and permanent crops (220) from heterogeneous (240) and from forests (310, 320, 330). A low increase, corresponding to 1%, is caused by changes from open spaces with little or no vegetation (330) toward heterogeneous agricultural areas (240).
In the second case, 66% of the transitions toward heterogeneous agricultural areas are caused by changes from arable land (210), 33% are caused by changes from permanent agricultural areas (220), and the rest are caused by changes from forests (310).
Permanence also generates a variation in ESs. This category includes areas in which there are different types of land use permanence such as (i) permanence of permanent crops (olive grove, vineyard, orchard), (ii) permanence of arable land and pastures, (iii) permanence of artificial surfaces and (iv) permanence of heterogeneous agricultural areas. This variation depends on the different coefficient values associated with each land use and the consequent value variation: e.g., in economic terms, the loss of pastures in favor of arable areas gives rise to an increase in food production of more than EUR 3000/ha. For this reason, it is possible to detect ES variations.
Furthermore, since the coefficients for macro classes were obtained on the basis of the values assigned to CLC Level III classes and weighted for the respective macro class areas in 1990 and 2018—the final coefficients for macro classes in 1990 and 2018 do not always coincide. This also allows for the internal variability of the specific macro classes in the two years that were considered and leads to possible variation even in the permanence of the same macro class.
The results of the economic variation analysis are presented in Table 1, summarized for single ESs and single transition categories. Table 1 shows the economic variation of ES supply based on the phenomena of LULC permanence and transition. Between 1990 and 2018, we experienced an economic loss of ESs estimated at EUR 927 million as a result of transition and permanence processes. Evolution into complex systems is the transition that has caused the major loss of ESs (EUR 1521 M). Through evolution to complex systems, productive agricultural systems have been fragmented into different mosaics leading to the loss of all ESs except for the ecosystem service of mushroom production. Evolution to complex systems, permanence, urbanization and forest extension have resulted in an overall loss of agricultural production of EUR 625 million. For example, in rural areas, the abandonment of agricultural areas has favored the growth of forested areas, which has led to an increase in all regulating services and some provisioning services, such as timber and mushrooms. Another relevant result is the high increase in economic value associated with agricultural intensification due to increased food production.
Conversely, the highest decrease associated with this transition category is linked to air purification.
On the other hand, to explain the major negative variation, the study highlighted that the evolution toward complex systems that occurred between 1990 and 2018 led to a remarkable decrease in economic value because of the great loss in food production and in groundwater recharge. In general terms, the total variation is mainly related to the negative fluctuation of food production and groundwater recharge.
Concerning urbanization processes, it should be noted that these processes are about one percent in area (out of the total of permanence and transitions) and include the increase of green urban areas (+1049 ha) and sports areas (+14,386 ha).
These two subclasses, and in particular, green urban areas (CLC 141), in contrast to the other urban areas (e.g., continuous urban fabric), provide ESs that are in some cases even relevant and certainly fundamental for communities in cities [68,69]. In fact, through a coefficient search, we found that green urban areas generate ESs such as global climate regulation, air purification, groundwater recharge and flood mitigation (see Figure 5). In our review, we found the highest values for the flood mitigation service, with an average economic value of EUR 175 per hectare of green urban area.
To analyze the spatial distribution of the economic variation in the investigated time period, the regional administrative boundaries have been overlaid as shown in Figure 10. Our study demonstrates a certain clustering of value fluctuation. In large areas in the central area of Veneto, (NE), and in Sicily (S), for example, the study highlighted strong decreases of economic value in the order of more than −EUR 800 M. This variation was caused in most of the cases by agricultural land abandonment (Etcs transition category) that determined, in turn, the great loss of food production. In the named regions, the decreases were only in part contrasted by ES increases generated by forest permanence. As far as negative variations are concerned, in the western part of Valle D’Aosta region and in the Piemonte region (NW), it is possible to detect large areas of increases of more than +EUR 100 M. These phenomena are linked to forest permanence and specifically to the transformation from scarce vegetation cover toward higher vegetation abundance.
Zonal statistics applied at the regional variations pointed out that at both average and sum levels, seventeen out of twenty regions have experienced decreases in economic value. Fluctuation was especially negative in Sicily and Veneto while, on the contrary, was strongly positive in Valle d’Aosta.

4. Discussion

This work belongs to the growing body of literature that seeks to estimate the value of natural capital and the impacts of LULC changes on the ESs it provides. Some authors [31,32,34] have used transition matrices to study LULC and landscape changes. For example, Assefa (2012) [30] used these matrices and the coefficients of Kindu et al. (2016) [70] to assess ESs. In many cases, to assess the ES variation at the level of biomes, the coefficients of Costanza et al. (1997, 2014) [21,22] are used. In our study, we have used biophysical and economic coefficients at a spatial scale of greater dictum (Corine) which are thus potentially more useful for studying the processes of permanence and transition. Since ESs are the basis for human well-being and survival, spatial transformations can have very significant impacts on multiple domains of well-being [22,71,72]. The results obtained in this paper can contribute to the international debate on the need to study and understand how LULC changes affect the ES provision [73,74,75,76]. For example, while the increase in agricultural areas at the expense of natural and semi-natural environments leads to an increase in agricultural production services, it also leads to a reduction in the provision of other services such as carbon absorption, air purification, etc. The processes of land transformation are also influenced by several factors including socio-demographic dynamics [77,78,79]. The depopulation of mountain and rural areas in favor of urban and coastal areas causes the transformation of the territory. For example, in rural and mountainous areas, the abandonment of agricultural areas and pastures causes various phenomena such as soil erosion, hydrogeological instability and loss of biodiversity. Even in urban areas, soil consumption produces a loss of ESs with risks to the safety and health of citizens. Urban flooding has become increasingly frequent due to increased urbanization and climate change [80]. Urban green spaces can play an important role in reducing flooding [81]. Investing in urban green spaces and green infrastructure could therefore help strengthen the resilience of territories against climate change.
In the specifics of the distribution of the coefficient values collected in our database, we found the following features: (i) the range of values is generally greater in the regulating ES than in the provisioning ones; (ii) the range of values is generally greater for economic values than for biophysical ones; and (iii) the range of values generally increases as the studies considered increase (and therefore the number of coefficients extracted), e.g., for forest classes. The first point can be explained largely by the fact that the analysis of provisioning services is very often based on point accounts, which can be found in official statistical systems, whereas regulating services are not often included in this type of statistics but are evaluated employing heterogeneous methodologies, which often have a higher degree of approximation. Concerning the second point, the higher variability of economic values compared to biophysical ones stems from the fact that the latter suffers from a double variability since they are both usually derived from biophysical values (with their intrinsic variability), and from the use of non-standardized economic values (see the social cost of carbon, as a case in point).
The economic supply values of the ESs found for the two years are in some cases within the ranges found in other works at the national level [82] while in other cases, they are outside these ranges. The difference can be attributed, at least in part, to the methodologies of employed analysis. A good example in this sense comes from the quantification reported in the IV report on Italian natural capital [82] where, through the use of ARIES technology, the economic value of a service is estimated based on the degree of protection of potentially floodable assets (calculation of avoided damage). On the contrary, in our work, the economic coefficients extracted from the literature refer mainly to the ‘replacement cost’, i.e., the cost of building a lamination basin that can collect a given amount of rainwater. We estimated the annual cost of the infrastructure as a function of the construction cost [83] and the average infrastructure duration of 25 years.
At the same time, the same report attributes the value of the groundwater recharge service in 2018 at approximately EUR 14,073 million (values as of 2018), similar to the value found in our study (16,115 million), especially if we consider that our values are indeed attributed to land cover in the year 2018, but are discounted in economic terms to 2022.
Concerning the total economic change in services from 1990 to 2018 found in our paper, although at first glance it may not seem particularly relevant (a decrease of about EUR 927 million out of a total supply in 1990 of 98.5 billion), this becomes more significant if one considers that the change found concerns only the difference in the supply of ESs generated by land cover in 2018, compared to land cover in 1990. Our results therefore do not include the total annual changes in ES supply that occurred between 1990 and 2018, but only the differential between the supply capacity in 1990 and that in 2018. If we hypothetically assume a linear trend of decreasing ES supply in the 28 years between 1990 and 2018, we would have to count (i.e., sum) the losses that occurred year by year over the entire period. The final accounting would be higher in this case.
Our study thus highlights how the capacity of the Italian territory to generate ecosystem services has decreased in 2018 compared to 1990. As reflected in the international literature [21,22,84], the decrease in ecosystem services is a global issue. IPBES [8], for example, calculates that globally from 1970 to 2019, 14 of the 18 ESs analyzed are decreasing. The increases are only in the ES of potential food and bioenergy production resulting from the expansion of agricultural land globally. However, agricultural area expansion (along with urbanization and deforestation) is among the land-use changes that most impact other ESs. In our case, economic ES supply variation was analyzed through the transition categories approach to point out the weight that each land-use change had on the ES variation. In this sense, this study finds a remarkable correspondence between food production and agricultural intensification, which is the most important factor of the total fluctuation. This correspondence can be found especially in some regions, such as Veneto and Sicily.
In our opinion, an added value of this work is that the approach adopted allows for the distinction of spatial processes that lead to “synergies” and “trade-offs” in the provision of ESs. Synergies consist of a simultaneous increase or decrease in service provision as a result of the same driver of change (LULC changes in our case), while trade-offs involve opposite changes in service provision [85]. A good example in terms of trade-offs comes again from agricultural intensification which brings increased food and forage production but at the expense of many other services (notably air purification, erosion protection and global climate regulation). These results are in line with the international literature [86,87] and derive from the simplification of the landscape that agricultural intensification brings with it. In particular, in the Italian case we analyzed, the processes of agricultural intensification mainly involved [87] the transition from heterogeneous agricultural and semi-forested areas to arable land and permanent crops (vineyards in particular). A possible solution to mitigate the adverse effects of agricultural intensification on the provision of many regulating ESs is offered by “agroecology”, which seeks a better balance between purely productive outputs and the conservation of natural capital [88,89,90,91,92].Another exemplary case concerns reforestation processes, which account for almost 14% in area of the total permanence and transitions, and generate a positive synergy for all ESs, but the trade-offs are those typical of agricultural areas such as food and forage production. In this case, synergies involve those ESs that are typically generated by forests and also defined in the literature as “bundles of ESs” [93], namely “a set of associated ESs that are linked to a given ecosystem and that usually appear together repeatedly in time and/or space” [94]. Other examples of synergy, in this case with negative effects, are urbanization and evolution into complex systems transitions.
The former, as might be expected, leads to a reduction in all ESs, while the latter in almost all. In fact, urbanization (except in the case of the establishment of urban green areas), leads to a major loss of natural capital and generated ESs. While the evolution to a complex system involves a significant net reduction in ESs, because, as we have noted, this transition occurs primarily at the expense of agricultural and forestry land uses which are known to provide high provisioning (the former) and regulating (the latter) services.
In general, the practice of analyzing spatial dynamics in terms of synergies, trade-offs and ES bundles can be a useful tool for managing a territory with greater awareness and in our opinion should be integrated into spatial planning processes. In particular, the results of this study on trade-offs and synergies arising from LULC changes could be a good information basis for specific cost–benefit analyses and/or for informing local spatial planning on the many complex effects of certain decisions.

Limitations of the Study and Future Steps

It is important to highlight that in this paper, the economic estimation of ESs was carried out using benefit transfer. Benefit transfer is a method that allows for a relatively quick assessment of the value of ecosystem services, but at the same time can be a source of errors in the assessment. One of the main errors in the use of benefit transfer is what the literature refers to as ‘generalization’, i.e., the lack of correspondence between the site from which values are taken (‘study site’) and the one to which they are transferred (‘policy site’) [44,95,96]. To limit this approximation, in this work, the CLC class at Level III was used as the initial minimum unit of analysis. To the best of our knowledge, this level of detail is used in very few studies, as most refer to biomes with lower resolution. Thus, using this level of detail, values can be transferred between land use and land cover units with a fair degree of correspondence. Furthermore, it should be emphasized that our case study is the entire Italian national territory, which, with its multitude of climates, biomes and territorial configurations, already presents intrinsic variability in the provision of ecosystem services. In this sense, therefore, the variability of the values that we have found in our study, may even be less than the variability that would be obtained by analyzing Italian biodiversity with other, more analytical methods. Similarly, applying a single method of analysis for the entire Italian territory would not necessarily lead to greater precision in estimation, since in any case, it is very likely that it would have to resort to approximations or generalizations to include the great variability of the structures, processes and conditions of Italy’s natural capital that underlie the generation of ecosystem services. We believe, therefore, that the benefit transfer method used herein fits well with the purpose of this work, which does not reside in a punctual and local analysis of the provision of ESs, but in the most representative, albeit approximate, value of the average capacity to provide ecosystem services. In our study we tried to acquire as many articles as possible to extrapolate ES biophysical and economic unit values for land cover classes. Despite our efforts, not all ESs potentially generated in the Italian territory have been considered. This is probably also reflected in the results, e.g., we found that the main drivers of the ES economic value variation at the national level can be associated with the decrease in food production that, despite the boost of agricultural intensification, is reduced by other transitions (e.g., urbanization, forest expansion). In this regard, it is necessary to point out that, by not counting all possible ESs provided by forests, our study inevitably underestimates the economic value of reforestation. Among the services provided by forests and not valued in this study, we find, for example, recreational and heat wave mitigation services. Counting, among others, these two services could certainly increase the economic value obtained from reforestation processes. In any case, it should also be noted that many of the ESs provided by forests are not accounted for in an official market and therefore their value is more difficult to derive. In this sense, new accountings such as the SEEA framework [97] are therefore crucial, precisely in order not to further neglect the benefits provided by forests.
Among the ESs not analyzed in this paper are cultural services in particular. Due to methodological challenges, cultural ESs are rarely fully considered in ES assessments [98]. In fact, research on cultural ESs requires alternative assessment approaches that draw on a wide range of social science tools and methods [99]. Therefore, to integrate cultural ESs into our evaluation, specific investigations of biophysical and economic evaluations should be conducted for CLC classes at the national scale.
In the future, it will be necessary to try to include, through specific coefficients, the contribution of cultural ESs to the overall provision of services, but this operation requires a deep reflection from a methodological point of view and careful use of the results. In fact, cultural ESs, by their very characteristics, are related to the cultural capital of populations and this makes the interaction between man and the environment that is the basis of cultural ESs [84] extremely variable—for the same land use, or even for the same biomes or ecosystems. One of the future challenges of our research is to implement specific survey methods such as participatory approaches [56,57] or the use of the Social Values for Ecosystem Services (SolVES) software to have biophysical and economic coefficients for cultural ESs. Furthermore, to expand the database that we created, we aim to improve the literature research using other search engines such as Web of Science (WOS) and to review the keywords. We will also expand the bibliographic research considering a broader time than the one considered. This would allow us to find more articles from which to extract biophysical and economic coefficients and obtain greater coverage in terms of the considered ESs.
Finally, the methodological combination applied in this study also allows an analysis of the trade-offs and synergies of ESs resulting from LULC changes, which are potentially very useful in spatial planning processes. Future research directions in this regard could explore the role of synergy and trade-off analysis in order to meet the specific ES demands found in a given area. In the same way, it would be very useful to further investigate the relationship between provisioning and regulating services, providing suggestions on how to optimize service provision with a view to balanced spatial planning that generates ‘win-win’ results, according to the identified needs.

5. Conclusions

Compared to other studies conducted in Italy, the original contribution of our research is to present an approach for assessing the impacts of LULC changes on the provision of ESs using the combination of transition matrices with biophysical and economic coefficients from the literature. In comparison to ISPRA (2022), which analyzes the impacts of land consumption, urbanization and infrastructure on the landscape and ESs, we analyzed the assessment of ESs as a function of the transition and permanence processes over a broad period (1990–2018). Furthermore, compared to the IV report on Italian natural capital [84], we extrapolated a large set of biophysical and economic data from the literature. This analysis could be used to predict future scenarios to support mitigation and adaptation strategies and policies.
The proposed approach is versatile and can be applied in other spatial contexts since the matrices and coefficients are associated with Corine land use classes. In fact, by knowing the extent of land cover classes and the unit values (biophysical and economic) per hectare, it is possible to estimate both the supply of ESs and its resulting variation due to changes in LULC. In this sense, the results of this study can also be used as a predictive tool in regional or urban planning. The negative consequences of soil sealing, for example, cannot be completely mitigated by afforestation interventions (in case, e.g., of environmental offset) since the significant ES loss is not compensated by the possible increases.
The presented approach has been applied to implement the study by Marino et al., 2022 [48] and provide a synthesis of the variations in the economic value of ESs observed in Italy in the period 1990–2018 caused by the transition and permanence processes. The study, of which this work is a part, is oriented to promoting methodologies for the estimation of ESs, contributing to enriching the scientific literature on this topic. In fact, there are many studies in the literature and the authors (Appendix A) have used different software, methodologies and approaches to quantify and assess ESs at the biome level [22], ecosystem level [100], and land cover classes (see studies listed in Appendix A). The study by land cover classes has the advantage of measuring, with greater precision and detail, the impact of land transformation processes on ES supply. Furthermore, the constant updates of Corine data at a European level allow applications at different spatial and temporal scales.
The results of this study are open to comparison, to improve the proposed approach to ES assessment, to update the coefficients from new studies and to deepen the spatial distribution through the use of some geographic detectors (e.g., Markow chain and Gini coefficient). However, our challenge will be to augment the database with other coefficients (biophysical and economic) by improving the literature review. The proposed approach may be functional for monitoring ESs at spatial and temporal scales as a function of land transformation process support for the implementation of SEEA Ecosystem Accounting (SEEA EA) to account for ESs [97]. Environmental accounting tools can support public decision-makers in choosing policies and strategies for global and local governance.

Author Contributions

Conceptualization, D.M. and M.P.; methodology, D.M., M.P., A.M. and A.B.; software, A.B. and S.P.; formal analysis, A.B. and S.P.; investigation, A.B., A.M. and M.P.; data curation, A.B. and A.M.; writing—original draft preparation, A.B., M.P. and A.M.; writing—review and editing, M.P., A.M., A.B. and S.P.; visualization, A.B. and S.P.; supervision, D.M., A.M. and M.P. All authors have read and agreed to the published version of the manuscript.

Funding

This research received no external funding.

Data Availability Statement

The data presented in this study are available on request from the corresponding author.

Conflicts of Interest

The authors declare no conflict of interest.

Appendix A

Table A1. Bibliographic references of biophysical and economic coefficients. Note: The articles are listed in the references.
ESSourcesBiophysical CoefficientEconomic CoefficientStudy Area
Food productionCouncil for Agricultural Research and Economics, 2022 [52]Italy
Forage productionSchirpke et al., 2015 [101] Natura 2000 Sites (Italy)
Marino et al., 2021 [2]National Parks (Italy)
Tardieu et al., 2015 [102]Natural and semi-natural areas (France)
Timber supplyGrilli et al., 2015 [103] Italian Alps
Häyhä et al., 2015 [36]Alpine forests (Italy)
Vysna et al., 2019 [100]Europe
Pedroso et al., 2018 [104] Natural Park of Serra de São Mamede, Portugal
Bernetti et al., 2013 [105] Forest area of Tuscany (Italy)
Pettenella et al., 2021 [106] Forests in the Veneto region (Italy)
Hein et al., 2011 [107]Hoge Veluwe protected forest (Netherlands)
White, 2015 [108]Protected areas in England and Scotland
Marchetti et al., 2018 [109]Italians forest
Mushrooms supplySchirpke et al., 2015 [101]Natura 2000 Sites (Italy)
Bernetti et al., 2013 [105]Toscana Region (Italy)
Global climate regulationDe Jong et al., 2016 [110] Limburg Province (Netherlands)
Remme et al., 2016 [111] Limburg Province (Netherlands)
Marino et al., 2021 [2]National Parks (Italy)
Schirpke et al., 2015 [101]Natura 2000 Sites (Italy)
Morri et al., 2014 [83]Apennines and coastal areas (Italy)
Häyhä et al., 2015 [36]Alpine forests (Italy)
Cervelli et al., 2022 [112] Vesuvius National Park (Italy)
Paletto et al., 2015 [113] Austrian Alps
Bernetti et al., 2013 [105] Forest area of Tuscany (Italy)
White, 2015 [108]Protected areas in England and Scotland
Willis et al., 2003 [114] Forests (Great Britain)
Xue et al., 2001 [115]Changbaishan Mountain Biosphere Reserve (Northeast China)
Marino et al., eds (2023) [60]Monte Amiata e Mugello, Toscana (Italy)
Marino et al., eds (2023) [116]Città metropolitana Roma Capitale (Italy)
Air purificationDe Jong et al., 2016 [110] Limburg Province (Netherlands)
Remme et al., 2016 [111] Limburg Province (Netherlands)
Duarte et al., 2021 [117] Salt marsh plant species of six Portuguese transitional systems
Marino et al., 2021 [2]National Parks (Italy)
Bottalico et al., 2016 [54] Florence (Italy)
Manes et al., 2014 [53] Rome (Italy)
Hein, 2011 [107]Hoge Veluwe protected forest (Netherlands)
White, 2015 [108]Protected areas in England and Scotland
Marino et al., eds (2023) [60]Monte Amiata e Mugello, Toscana (Italy)
Water regulationDe Jong, 2016 [110] Limburg Province (Netherlands)
Remme, 2016 [111] Limburg Province (Netherlands)
Duarte et al., 2021 [117] Salt marsh plant species of six Portuguese transitional systems
Schirpke et al., 2015 [101] Natura 2000 Sites (Italy)
Bernetti et al., 2013 [105] Toscana Region (Italy)
Hein et al., 2011 [107]Hoge Veluwe protected forest (Netherlands)
Esen et al., 2023 [118]Forest in Southern Aegean region of Turkey
Xue et al., 2001 [115]Changbaishan Mountain Biosphere Reserve (Northeast China)
Water purificationDuarte et al., 2021 [117] Salt marsh plant species of six Portuguese transitional systems
Marino et al., eds (2023) [60]Monte Amiata e Mugello, Toscana (Italy)
Marino (eds), 2023 [116]Città metropolitana Roma Capitale (Italy)
Piaggio et al., 2021 [119] Forest areas (Costa Rica)
Mueller et al., 2014 [120] Forest in northern Arizona (USA)
De la Cruz et al., 2009 [121] Pico da Vara Special Protected Area (Portugal)
Matero et al., 2007 [122] Finnish forests (Finland)
Erosion protectionEsen et al., 2023 [118]Forest in Southern Aegean region of Turkey
Duarte et al., 2021 [117] Salt marsh plant species of six Portuguese transitional systems
Schirpke et al., 2015 [101]Natura 2000 Sites (Italy)
Marino et al., eds (2023) [60]Monte Amiata e Mugello, Toscana (Italy)
Mastrorilli et al., 2018 [123]Calabria Region, Italy
Morri et al., 2014 [83]Apennines and coastal areas (Italy)
Häyhä et al., 2015 [36] Alpine forests (Italy)
Pedroso et al., 2018 [104] Natural Park of Serra de São Mamede, Portugal
Xue et al., 2001 [115] Changbaishan Mountain Biosphere Reserve (Northeast China)
Flood risk mitigationEsen et al., 2023 [118] Forest in Southern Aegean region of Turkey
Duarte et al., 2021 [117] Salt marsh plant species of six Portuguese transitional systems
Marino et al., eds (2023) [60]Monte Amiata e Mugello, Toscana (Italy)
Morri et al., 2014 [83]Apennines and coastal areas (Italy)
Mastrorilli et al., 2018 [123]Calabria Region, Italy
Marino et al., 2023 [49]Città metropolitana Roma Capitale (Italy)
Broadmeadow et al., 2018 [124] Forest in Great Britain (GB)

References

  1. Steffen, W.; Crutzen, P.J.; McNeill, J.R. The Anthropocene: Are Humans Now Overwhelming the Great Forces of Nature? Ambio 2007, 36, 614–621. Available online: http://www.jstor.org/stable/25547826 (accessed on 30 March 2023). [CrossRef] [PubMed]
  2. Marino, D.; Palmieri, M.; Marucci, A.; Tufano, M. Comparison between Demand and Supply of Some Ecosystem Services in National Parks: A Spatial Analysis Conducted Using Italian Case Studies. Conservation 2021, 1, 36–57. [Google Scholar] [CrossRef]
  3. Ellis, E.C.; Goldewijk, K.K.; Siebert, S.; Lightman, D.; Ramankutty, N. Anthropogenic Transformation of the Biomes, 1700 to 2000. Glob. Ecol. Biogeogr. 2010, 19, 589–606. [Google Scholar] [CrossRef]
  4. Fang, Z.; Ding, T.; Chen, J.; Xue, S.; Zhou, Q.; Wang, Y.; Wang, Y.; Huang, Z.; Yang, S. Impacts of Land Use/Land Cover Changes on Ecosystem Services in Ecologically Fragile Regions. Sci. Total Environ. 2022, 831, 154967. [Google Scholar] [CrossRef] [PubMed]
  5. Hasan, S.S.; Zhen, L.; Miah, M.G.; Ahamed, T.; Samie, A. Impact of Land Use Change on Ecosystem Services: A Review. Environ. Dev. 2020, 34, 100527. [Google Scholar] [CrossRef]
  6. Zhang, Z.; Liu, Y.; Wang, Y.; Liu, Y.; Zhang, Y.; Zhang, Y. What Factors Affect the Synergy and Tradeoff between Ecosystem Services, and How, from a Geospatial Perspective? J. Clean. Prod. 2020, 257, 120454. [Google Scholar] [CrossRef]
  7. Davison, C.W.; Rahbek, C.; Morueta-Holme, N. Land-Use Change and Biodiversity: Challenges for Assembling Evidence on the Greatest Threat to Nature. Glob. Chang. Biol. 2021, 27, 5414–5429. [Google Scholar] [CrossRef]
  8. IPBES. Summary for Policymakers of the Global Assessment Report on Biodiversity and Ecosystem Services; IPBES: Bonn, Germany, 2019; Volume 45, ISBN 9783947851133. [Google Scholar]
  9. Beckmann, M.; Gerstner, K.; Akin-Fajiye, M.; Ceaușu, S.; Kambach, S.; Kinlock, N.L.; Phillips, H.R.P.; Verhagen, W.; Gurevitch, J.; Klotz, S.; et al. Conventional Land-Use Intensification Reduces Species Richness and Increases Production: A Global Meta-Analysis. Glob. Chang. Biol. 2019, 25, 1941–1956. [Google Scholar] [CrossRef]
  10. Gerstner, K.; Dormann, C.F.; Stein, A.; Manceur, A.M.; Seppelt, R. Effects of Land Use on Plant Diversity—A Global Meta-Analysis. J. Appl. Ecol. 2014, 51, 1690–1700. [Google Scholar] [CrossRef]
  11. Newbold, T.; Hudson, L.N.; Hill, S.L.L.; Contu, S.; Gray, C.L.; Scharlemann, J.P.W.; Börger, L.; Phillips, H.R.P.; Sheil, D.; Lysenko, I.; et al. Global Patterns of Terrestrial Assemblage Turnover within and among Land Uses. Ecography 2016, 39, 1151–1163. [Google Scholar] [CrossRef]
  12. Aronson, M.F.J.; La Sorte, F.A.; Nilon, C.H.; Katti, M.; Goddard, M.A.; Lepczyk, C.A.; Warren, P.S.; Williams, N.S.G.; Cilliers, S.; Clarkson, B.; et al. A Global Analysis of the Impacts of Urbanization on Bird and Plant Diversity Reveals Key Anthropogenic Drivers. Proc. R. Soc. B Biol. Sci. 2014, 281, 20133330. [Google Scholar] [CrossRef] [PubMed]
  13. Murphy, G.E.P.; Romanuk, T.N. A Meta-Analysis of Declines in Local Species Richness from Human Disturbances. Ecol. Evol. 2014, 4, 91–103. [Google Scholar] [CrossRef] [PubMed]
  14. Admasu, S.; Yeshitela, K.; Argaw, M. Impact of Land Use Land Cover Changes on Ecosystem Service Values in the Dire and Legedadi Watersheds, Central Highlands of Ethiopia: Implication for Landscape Management Decision Making. Heliyon 2023, 9, e15352. [Google Scholar] [CrossRef] [PubMed]
  15. Benítez, F.L.; Mena, C.F.; Zurita-Arthos, L. Urban Land Cover Change in Ecologically Fragile Environments: The Case of the Galapagos Islands. Land 2018, 7, 21. [Google Scholar] [CrossRef]
  16. Burkhard, B.; Kroll, F.; Müller, F.; Windhorst, W. Landscapes’ Capacities to Provide Ecosystem Services—A Concept for Land-Cover Based Assessments. Landsc. Online 2009, 15, 1–22. [Google Scholar] [CrossRef]
  17. Sharma, R.; Rimal, B.; Baral, H.; Nehren, U.; Paudyal, K.; Sharma, S.; Rijal, S.; Ranpal, S.; Acharya, R.P.; Alenazy, A.A.; et al. Impact of Land Cover Change on Ecosystem Services in a Tropical Forested Landscape. Resources 2019, 8, 18. [Google Scholar] [CrossRef]
  18. Hailu, A.; Mammo, S.; Kidane, M. Dynamics of Land Use, Land Cover Change Trend and Its Drivers in Jimma Geneti District, Western Ethiopia. Land Use Policy 2020, 99, 105011. [Google Scholar] [CrossRef]
  19. Maes, J.; Liquete, C.; Teller, A.; Erhard, M.; Paracchini, M.L.; Barredo, J.I.; Grizzetti, B.; Cardoso, A.; Somma, F.; Petersen, J.E.; et al. An Indicator Framework for Assessing Ecosystem Services in Support of the EU Biodiversity Strategy to 2020. Ecosyst. Serv. 2016, 17, 14–23. [Google Scholar] [CrossRef]
  20. Potschin, M.B.; Haines-Young, R.H. Ecosystem Services: Exploring a Geographical Perspective. Prog. Phys. Geogr. 2011, 35, 575–594. [Google Scholar] [CrossRef]
  21. Costanza, R.; D’Arge, R.; de Groot, R.; Farber, S.; Grasso, M.; Hannon, B.; Limburg, K.; Naeem, S.; O’Neill, R.V.; Paruelo, J.; et al. The Value of the World’s Ecosystem Services and Natural Capital. Ecol. Econ. 1998, 25, 3–15. [Google Scholar] [CrossRef]
  22. Costanza, R.; de Groot, R.; Sutton, P.; van der Ploeg, S.; Anderson, S.J.; Kubiszewski, I.; Farber, S.; Turner, R.K. Changes in the Global Value of Ecosystem Services. Glob. Environ. Chang. 2014, 26, 152–158. [Google Scholar] [CrossRef]
  23. De Vreese, R.; Leys, M.; Fontaine, C.M.; Dendoncker, N. Social Mapping of Perceived Ecosystem Services Supply-The Role of Social Landscape Metrics and Social Hotspots for Integrated Ecosystem Services Assessment, Landscape Planning and Management. Ecol. Indic. 2016, 66, 517–533. [Google Scholar] [CrossRef]
  24. Plieninger, T.; Dijks, S.; Oteros-Rozas, E.; Bieling, C. Assessing, Mapping, and Quantifying Cultural Ecosystem Services at Community Level. Land Use Policy 2013, 33, 118–129. [Google Scholar] [CrossRef]
  25. van Riper, C.J.; Kyle, G.T.; Sutton, S.G.; Barnes, M.; Sherrouse, B.C. Mapping Outdoor Recreationists’ Perceived Social Values for Ecosystem Services at Hinchinbrook Island National Park, Australia. Appl. Geogr. 2012, 35, 164–173. [Google Scholar] [CrossRef]
  26. Burkhard, B.; Kandziora, M.; Hou, Y.; Müller, F. Ecosystem Service Potentials, Flows and Demands-Concepts for Spatial Localisation, Indication and Quantification. Landsc. Online 2014, 34, 1–32. [Google Scholar] [CrossRef]
  27. Schirpke, U.; Tasser, E. Trends in Ecosystem Services across Europe Due to Land-Use/Cover Changes. Sustainability 2021, 13, 7095. [Google Scholar] [CrossRef]
  28. Ongsomwang, S.; Pattanakiat, S.; Srisuwan, A. Impact of Land Use and Land Cover Change on Ecosystem Service Values: A Case Study of Khon Kaen City, Thailand. Environ. Nat. Resour. J. 2019, 17, 43–58. [Google Scholar] [CrossRef]
  29. Wang, H.; Lü, Z.; Gu, L.; Wen, C.; Palomo-Campesino, S.; García-Llorente, M.; Hevia, V.; Boeraeve, F.; Dendoncker, N.; González, J.A.; et al. Linking Flood Risk Mitigation and Food Security: An Analysis of Land-Use Change in the Metropolitan Area of Rome. Ecosyst. Serv. 2021, 11, 1–23. [Google Scholar]
  30. Assefa, G.; Kijora, C.; Kehaliew, A.; Sonder, K.; Peters, K.J. Effect of Pre-Feeding Forage Treatments, Harvesting Stage, and Animal Type on Preference of Tagasaste (Chamaecytisus palmensis). Agrofor. Syst. 2012, 84, 25–34. [Google Scholar] [CrossRef]
  31. Gashaw, T.; Tulu, T.; Argaw, M.; Worqlul, A.W. Evaluation and Prediction of Land Use/Land Cover Changes in the Andassa Watershed, Blue Nile Basin, Ethiopia. Environ. Syst. Res. 2017, 6, 17. [Google Scholar] [CrossRef]
  32. Berihun, M.L.; Tsunekawa, A.; Haregeweyn, N.; Meshesha, D.T.; Adgo, E.; Tsubo, M.; Masunaga, T.; Fenta, A.A.; Sultan, D.; Yibeltal, M. Exploring Land Use/Land Cover Changes, Drivers and Their Implications in Contrasting Agro-Ecological Environments of Ethiopia. Land Use Policy 2019, 87, 104052. [Google Scholar] [CrossRef]
  33. Ciocănea, C.M.; Sorescu, C.; Ianoşi, M.; Bagrinovschi, V. Assessing Public Perception on Protected Areas in Iron Gates Natural Park. Procedia Environ. Sci. 2016, 32, 70–79. [Google Scholar] [CrossRef]
  34. Lin, J.; Huang, J.; Prell, C.; Bryan, B.A. Changes in Supply and Demand Mediate the Effects of Land-Use Change on Freshwater Ecosystem Services Flows. Sci. Total Environ. 2021, 763, 143012. [Google Scholar] [CrossRef] [PubMed]
  35. Chen, W.; Zhao, H.; Li, J.; Zhu, L.; Wang, Z.; Zeng, J. Land Use Transitions and the Associated Impacts on Ecosystem Services in the Middle Reaches of the Yangtze River Economic Belt in China Based on the Geo-Informatic Tupu Method. Sci. Total Environ. 2020, 701, 134690. [Google Scholar] [CrossRef] [PubMed]
  36. Häyhä, T.; Franzese, P.P.; Paletto, A.; Fath, B.D. Assessing, Valuing, and Mapping Ecosystem Services in Alpine Forests. Ecosyst. Serv. 2015, 14, 12–23. [Google Scholar] [CrossRef]
  37. Urbina-Cardona, N.; Cardona, V.O.; Cuellar, S. Uncovering Thematic Biases in Ecosystem Services Mapping: Knowledge Shortfalls and Challenges for Use in Conservation. Biol. Conserv. 2023, 283, 110086. [Google Scholar] [CrossRef]
  38. Leal Filho, W.; Azeiteiro, U.M.; Balogun, A.L.; Setti, A.F.F.; Mucova, S.A.R.; Ayal, D.; Totin, E.; Lydia, A.M.; Kalaba, F.K.; Oguge, N.O. The Influence of Ecosystems Services Depletion to Climate Change Adaptation Efforts in Africa. Sci. Total Environ. 2021, 779, 146414. [Google Scholar] [CrossRef]
  39. Brouwer, R. Environmental Value Transfer: State of the Art and Future Prospects. Ecol. Econ. 2000, 32, 137–152. [Google Scholar] [CrossRef]
  40. Desvousges, W.H.; Naughton, M.C.; Parsons, G.R. Benefit Transfer: Conceptual Problems in Estimating Water Quality Benefits Using Existing Studies. Water Resour. Res. 1992, 28, 675–683. [Google Scholar] [CrossRef]
  41. Bateman, I.J.; Brouwer, R.; Ferrini, S.; Schaafsma, M.; Barton, D.N.; Dubgaard, A.; Hasler, B.; Hime, S.; Liekens, I.; Navrud, S.; et al. Making Benefit Transfers Work: Deriving and Testing Principles for Value Transfers for Similar and Dissimilar Sites Using a Case Study of the Non-Market Benefits of Water Quality Improvements Across Europe. Environ. Resour. Econ. 2011, 50, 365–387. [Google Scholar] [CrossRef]
  42. Rosenberger, R.S.; Stanley, T.D. Measurement, Generalization, and Publication: Sources of Error in Benefit Transfers and Their Management. Ecol. Econ. 2006, 60, 372–378. [Google Scholar] [CrossRef]
  43. Boutwell, J.L.; Westra, J.V. Benefit Transfer: A Review of Methodologies and Challenges. Resources 2013, 2, 517–527. [Google Scholar] [CrossRef]
  44. Richardson, L.; Loomis, J.; Kroeger, T.; Casey, F. The Role of Benefit Transfer in Ecosystem Service Valuation. Ecol. Econ. 2015, 115, 51–58. [Google Scholar] [CrossRef]
  45. Ecosystem Services Valuation Database. Available online: https://www.esvd.info/ (accessed on 8 August 2023).
  46. The Environmental Valuation Reference. Inventory. Available online: https://evri.ca/en (accessed on 8 August 2023).
  47. INCA Platform. Available online: https://ecosystem-accounts.jrc.ec.europa.eu/ (accessed on 8 August 2023).
  48. Marino, D.; Palmieri, M.; Marucci, A.; Pili, S. Long-Term Land Cover Changes and Ecosystem Services Variation: Have the Anthropogenic Transformations Degraded Human Well-Being in Italy? Ital. Rev. Agric. Econ. 2022, 77, 7–23. [Google Scholar] [CrossRef]
  49. Marino, D.; Palmieri, M.; Marucci, A.; Soraci, M.; Barone, A.; Pili, S. Linking Flood Risk Mitigation and Food Security: An Analysis of Land-Use Change in the Metropolitan Area of Rome. Land 2023, 12, 366. [Google Scholar] [CrossRef]
  50. SCOPUS. Available online: https://www.scopus.com/ (accessed on 30 March 2023).
  51. Italian Institute of Statistics (ISTAT). Available online: https://www.istat.it/it/agricoltura?dati (accessed on 8 August 2023).
  52. CREA. Annuario Dell’Agricoltura Itialiana; CREA: Roma, Italy, 2021; ISBN 9788833851532. [Google Scholar]
  53. Manes, F.; Silli, V.; Salvatori, E.; Incerti, G.; Galante, G.; Fusaro, L.; Perrino, C. Urban Ecosystem Services: Tree Diversity and Stability of PM10 Removal in the Metropolitan Area of Rome. Ann. Bot. 2014, 4, 19–26. [Google Scholar] [CrossRef]
  54. Bottalico, F.; Chirici, G.; Giannetti, F.; De Marco, A.; Nocentini, S.; Paoletti, E.; Salbitano, F.; Sanesi, G.; Serenelli, C.; Travaglini, D. Air Pollution Removal by Green Infrastructures and Urban Forests in the City of Florence. Agric. Agric. Sci. Procedia 2016, 8, 243–251. [Google Scholar] [CrossRef]
  55. Crouzat, E.; De Frutos, A.; Grescho, V.; Carver, S.; Büermann, A.; Carvalho-Santos, C.; Kraemer, R.; Mayor, S.; Pöpperl, F.; Rossi, C.; et al. Potential Supply and Actual Use of Cultural Ecosystem Services in Mountain Protected Areas and Their Surroundings. Ecosyst. Serv. 2022, 53, 101395. [Google Scholar] [CrossRef]
  56. Schirpke, U.; Timmermann, F.; Tappeiner, U.; Tasser, E. Cultural Ecosystem Services of Mountain Regions: Modelling the Aesthetic Value. Ecol. Indic. 2016, 69, 78–90. [Google Scholar] [CrossRef]
  57. van Riper, C.J.; Kyle, G.T.; Sherrouse, B.C.; Bagstad, K.J.; Sutton, S.G. Toward an Integrated Understanding of Perceived Biodiversity Values and Environmental Conditions in a National Park. Ecol. Indic. 2017, 72, 278–287. [Google Scholar] [CrossRef]
  58. ISTAT. Available online: https://rivaluta.istat.it/Rivaluta/ (accessed on 8 August 2023).
  59. Manikandan, S. Measures of Central Tendency: Median and Mode. J. Pharmacol. Pharmacother. 2011, 2, 214–215. [Google Scholar] [CrossRef] [PubMed]
  60. Marino, D.; Poli, D.; Rovai, M.; Butelli, E.; Marucci, A.; Trinchetti, T. Montagna, Servizi Ecosistemici, e Strumenti Di Governance in Toscana; I libri Della Giunta Regionale–Società: Toscana, Italy, 2022; Volume 5, ISBN 09788870401516. [Google Scholar]
  61. Rasmussen, L.V.; Mertz, O.; Christensen, A.E.; Danielsen, F.; Dawson, N.; Xaydongvanh, P. A Combination of Methods Needed to Assess the Actual Use of Provisioning Ecosystem Services. Ecosyst. Serv. 2016, 17, 75–86. [Google Scholar] [CrossRef]
  62. Ricke, K.; Drouet, L.; Caldeira, K.; Tavoni, M. Country-Level Social Cost of Carbon. Nat. Clim. Chang. 2018, 8, 895–900. [Google Scholar] [CrossRef]
  63. Mangala, S.; Toppo, P.; Ghoshal, S. Study of Infiltration Capacity of Different Soils. Int. J. Trend Res. Dev. 2016, 3, 2394–9333. [Google Scholar]
  64. Levavasseur, F.; Bailly, J.S.; Lagacherie, P.; Colin, F.; Rabotin, M. Simulating the Effects of Spatial Configurations of Agricultural Ditch Drainage Networks on Surface Runoff from Agricultural Catchments. Hydrol. Process. 2012, 26, 3393–3404. [Google Scholar] [CrossRef]
  65. Irham, M.; Ilhamsyah, Y.; Sugianto; Deli, A.; Syahreza, S. Is Flash Flood Cycle? A Preliminary Climate Study on Teunom Fluvial System. IOP Conf. Ser. Earth Environ. Sci. 2019, 273, 012001. [Google Scholar] [CrossRef]
  66. Nowak, D.J. Institutionalizing Urban Forestry as a ‘Biotechnology’ to Improve Environmental Quality. Urban For. Urban Green. 2006, 5, 93–100. [Google Scholar] [CrossRef]
  67. Escobedo, F.J.; Nowak, D.J. Spatial Heterogeneity and Air Pollution Removal by an Urban Forest. Landsc. Urban Plan. 2009, 90, 102–110. [Google Scholar] [CrossRef]
  68. Derkzen, M.L.; Nagendra, H.; Van Teeffelen, A.J.A.; Purushotham, A.; Verburg, P.H. Shifts in Ecosystem Services in Deprived Urban Areas: Understanding People’s Responses and Consequences for Well-Being. Ecol. Soc. 2017, 22, 51. [Google Scholar] [CrossRef]
  69. Niemelä, J. Ecology of Urban Green Spaces: The Way Forward in Answering Major Research Questions. Landsc. Urban Plan. 2014, 125, 298–303. [Google Scholar] [CrossRef]
  70. Kindu, M.; Schneider, T.; Teketay, D.; Knoke, T. Changes of Ecosystem Service Values in Response to Land Use/Land Cover Dynamics in Munessa-Shashemene Landscape of the Ethiopian Highlands. Sci. Total Environ. 2016, 547, 137–147. [Google Scholar] [CrossRef] [PubMed]
  71. Schirpke, U.; Leitinger, G.; Tasser, E.; Schermer, M.; Steinbacher, M.; Tappeiner, U. Multiple Ecosystem Services of a Changing Alpine Landscape: Past, Present and Future. Int. J. Biodivers. Sci. Ecosyst. Serv. Manag. 2013, 9, 123–135. [Google Scholar] [CrossRef] [PubMed]
  72. Gomes, E.; Inácio, M.; Bogdzevič, K.; Kalinauskas, M.; Karnauskaitė, D.; Pereira, P. Future Land-Use Changes and Its Impacts on Terrestrial Ecosystem Services: A Review. Sci. Total Environ. 2021, 781, 146716. [Google Scholar] [CrossRef] [PubMed]
  73. Belay, T.; Melese, T.; Senamaw, A. Impacts of Land Use and Land Cover Change on Ecosystem Service Values in the Afroalpine Area of Guna Mountain, Northwest Ethiopia. Heliyon 2022, 8, e12246. [Google Scholar] [CrossRef] [PubMed]
  74. Tolessa, T.; Senbeta, F.; Kidane, M. The Impact of Land Use/Land Cover Change on Ecosystem Services in the Central Highlands of Ethiopia. Ecosyst. Serv. 2017, 23, 47–54. [Google Scholar] [CrossRef]
  75. Subedi, Y.R.; Kristiansen, P.; Cacho, O. Drivers and Consequences of Agricultural Land Abandonment and Its Reutilisation Pathways: A Systematic Review. Environ. Dev. 2022, 42, 100681. [Google Scholar] [CrossRef]
  76. Schirpke, U.; Tscholl, S.; Tasser, E. Spatio-Temporal Changes in Ecosystem Service Values: Effects of Land-Use Changes from Past to Future (1860–2100). J. Environ. Manag. 2020, 272, 111068. [Google Scholar] [CrossRef]
  77. Li, J.; Chen, H.; Zhang, C.; Pan, T. Variations in Ecosystem Service Value in Response to Land Use/Land Cover Changes in Central Asia from 1995–2035. PeerJ 2019, 7, e7665. [Google Scholar] [CrossRef]
  78. Xie, Y.; Mei, Y.; Guangjin, T.; Xuerong, X. Socio-Economic Driving Forces of Arable Land Conversion: A Case Study of Wuxian City, China. Glob. Environ. Chang. 2005, 15, 238–252. [Google Scholar] [CrossRef]
  79. Shi, Y.; Wang, R.; Fan, L.; Li, J.; Yang, D. Analysis on Land-Use Change and Its Demographic Factors in the Original-Stream Watershed of Tarim River Based on GIS and Statistic. Procedia Environ. Sci. 2010, 2, 175–184. [Google Scholar] [CrossRef]
  80. Kadaverugu, A.; Nageshwar Rao, C.; Viswanadh, G.K. Quantification of Flood Mitigation Services by Urban Green Spaces Using InVEST Model: A Case Study of Hyderabad City, India. Model. Earth Syst. Environ. 2021, 7, 589–602. [Google Scholar] [CrossRef]
  81. Yang, B.; Lee, D. Urban Green Space Arrangement for an Optimal Landscape Planning Strategy for Runoff Reduction. Land 2021, 10, 897. [Google Scholar] [CrossRef]
  82. Comitato per il Capitale Naturale. Quarto Rapporto Sullo Stato del Capitale Naturale in Italia; Comitato per Il Capitale Naturale: Roma, Italy, 2021. Available online: https://www.mase.gov.it/pagina/quarto-rapporto-sullo-stato-del-capitale-naturale-italia-2021 (accessed on 24 August 2023).
  83. Morri, E.; Pruscini, F.; Scolozzi, R.; Santolini, R. A Forest Ecosystem Services Evaluation at the River Basin Scale: Supply and Demand between Coastal Areas and Upstream Lands (Italy). Ecol. Indic. 2014, 37, 210–219. [Google Scholar] [CrossRef]
  84. Reid, W. Ecosystems and Human Well-Being: A Report on the Conceptual Framework Working Group of the Millenium Ecosystem Assessment; Island Press: Washington, DC, USA, 2005; Volume 5, ISBN 1559634022. [Google Scholar]
  85. Rodríguez, J.P.; Beard, T.D.; Bennett, E.M.; Cumming, G.S.; Cork, S.J.; Agard, J.; Dobson, A.P.; Peterson, G.D. Trade-Offs across Space, Time, and Ecosystem Services. Ecol. Soc. 2006, 11, 28. [Google Scholar] [CrossRef]
  86. Power, A.G. Ecosystem Services and Agriculture: Tradeoffs and Synergies. Philos. Trans. R. Soc. B Biol. Sci. 2010, 365, 2959–2971. [Google Scholar] [CrossRef] [PubMed]
  87. Watson, S.C.L.; Newton, A.C.; Ridding, L.E.; Evans, P.M.; Brand, S.; McCracken, M.; Gosal, A.S.; Bullock, J.M. Does Agricultural Intensification Cause Tipping Points in Ecosystem Services? Landsc. Ecol. 2021, 36, 3473–3491. [Google Scholar] [CrossRef]
  88. Palomo-Campesino, S.; García-Llorente, M.; Hevia, V.; Boeraeve, F.; Dendoncker, N.; González, J.A. Do Agroecological Practices Enhance the Supply of Ecosystem Services? A Comparison between Agroecological and Conventional Horticultural Farms. Ecosyst. Serv. 2022, 57, 101474. [Google Scholar] [CrossRef]
  89. Nentwig, W.; Gloor, D.; Kropf, C. Spider Taxonomists Catch Data on Web. Nature 2015, 528, 479. [Google Scholar] [CrossRef]
  90. Boone, L.; Roldán-Ruiz, I.; Van linden, V.; Muylle, H.; Dewulf, J. Environmental Sustainability of Conventional and Organic Farming: Accounting for Ecosystem Services in Life Cycle Assessment. Sci. Total Environ. 2019, 695, 133841. [Google Scholar] [CrossRef]
  91. Seitz, S.; Goebes, P.; Puerta, V.L.; Pereira, E.I.P.; Wittwer, R.; Six, J.; van der Heijden, M.G.A.; Scholten, T. Conservation Tillage and Organic Farming Reduce Soil Erosion. Agron. Sustain. Dev. 2019, 39, 4. [Google Scholar] [CrossRef]
  92. Gattinger, A.; Muller, A.; Haeni, M.; Skinner, C.; Fliessbach, A.; Buchmann, N.; Mäder, P.; Stolze, M.; Smith, P.; Scialabba, N.E.H.; et al. Enhanced Top Soil Carbon Stocks under Organic Farming. Proc. Natl. Acad. Sci. USA 2012, 109, 18226–18231. [Google Scholar] [CrossRef] [PubMed]
  93. Raudsepp-Hearne, C.; Peterson, G.D.; Bennett, E.M. Ecosystem Service Bundles for Analyzing Tradeoffs in Diverse Landscapes. Proc. Natl. Acad. Sci. USA 2010, 107, 5242–5247. [Google Scholar] [CrossRef] [PubMed]
  94. Berry, P.; Turkelboom, F.; Verheyden, W.; Martín-López, B. Ecosystem Service Bundles. OpenNESS 2015, 10, 1–5. [Google Scholar]
  95. Johnston, R.J.; Boyle, K.J.; Loureiro, M.L.; Navrud, S.; Rolfe, J. Guidance to Enhance the Validity and Credibility of Environmental Benefit Transfers; Springer: Dordrecht, The Netherlands, 2021; Volume 79, ISBN 0123456789. [Google Scholar]
  96. Plummer, M.L. Assessing Benefit Transfer for the Valuation of Ecosystem Services. Front. Ecol. Environ. 2009, 7, 38–45. [Google Scholar] [CrossRef]
  97. Hein, L.; Edens, B.; Obst, C.; Remme, R.; Schröter, M.; Sumarga, E. An Introduction to Ecosystem Accounting. Routledge Handb. Ecosyst. Serv. 2018, 213–219. [Google Scholar] [CrossRef]
  98. Plieninger, T.; Draux, H.; Fagerholm, N.; Bieling, C.; Bürgi, M.; Kizos, T.; Kuemmerle, T.; Primdahl, J.; Verburg, P.H. The Driving Forces of Landscape Change in Europe: A Systematic Review of the Evidence. Land Use Policy 2016, 57, 204–214. [Google Scholar] [CrossRef]
  99. Daniel, T.C.; Muhar, A.; Arnberger, A.; Aznar, O.; Boyd, J.W.; Chan, K.M.A.; Costanza, R.; Elmqvist, T.; Flint, C.G.; Gobster, P.H.; et al. Contributions of Cultural Services to the Ecosystem Services Agenda. Proc. Natl. Acad. Sci. USA 2012, 109, 8812–8819. [Google Scholar] [CrossRef]
  100. Vysna, V.; Maes, J.; Petersen, J.; La Notte, A.; Vallecillo, S.; Aizpurua, N.; Ivits, E.; Teller, A. Accounting for Ecosystems and Their Services in the European Union (INCA)—Final Report from Phase II of the INCA Project Aiming to Develop a Pilot for an Integrated System of Ecosystem Accounts for the EU, 2021st ed.; Publications Office: Luxembourg, 2020. [Google Scholar]
  101. Schirpke, U.; Scolozzi, R.; De Marco, C. B.4 -B9 Modello Dimostrativo di Valutazione Qualitativa e Quantitativa Dei Servizi Ecosistemici Nei Siti Pilota. Parte 1: Quantificazione dei Servizi Ecosistemici. Report del Progetto Making Good Natura (LIFE+11 ENV/IT/000168); EURAC Research: Bolzano, Italy, 2015; pp. 1–116. Available online: http://www.lifemgn-serviziecosistemici.eu/IT/docu/Pages/default.aspx.html (accessed on 9 March 2023).
  102. Tardieu, L.; Roussel, S.; Thompson, J.D.; Labarraque, D.; Salles, J.M. Combining Direct and Indirect Impacts on Ecosystem Service Loss Associated with Infrastructure Construction. J. Environ. Manag. 2015, 152, 145–157. [Google Scholar] [CrossRef]
  103. Grilli, G.; Nikodinoska, N.; Paletto, A.; De Meo, I. Stakeholders’ Preferences and Economic Value of Forest Ecosystem Services: An Example in the Italian Alps. Balt. For. 2015, 21, 298–307. [Google Scholar]
  104. Marta-Pedroso, C.; Laporta, L.; Gama, I.; Domingos, T. Economic Valuation and Mapping of Ecosystem Services in the Context of Protected Area Management (Natural Park of Serra de São Mamede, Portugal). One Ecosyst. 2018, 3, e26722. [Google Scholar] [CrossRef]
  105. Bernetti, I.; Sottini, V.A.; Marinelli, N.; Marone, E.; Menghini, S.; Riccioli, F.; Sacchelli, S.; Marinelli, A. Quantification of the Total Economic Value of Forest Systems: Spatial Analysis Application to the Region of Tuscany (Italy). Aestimum 2013, 62, 29–65. [Google Scholar] [CrossRef]
  106. Pettenella, D.; Marchetti, M.; Motta, R.; Vacchiano, G. Vaia Storm Facing the Unbearable Lightness of Forest Reporting. Forest 2021, 18, 1–4. [Google Scholar] [CrossRef]
  107. Hein, L. Economic Benefits Generated by Protected Areas: The Case of the Hoge Veluwe Forest, the Netherlands. Ecol. Soc. 2011, 16, 13. [Google Scholar] [CrossRef]
  108. White, C.; Dunscombe, R.; Dvarskas, A.; Eves, C.; Finisdore, J.; Kieboom, E.; Maclean, I.; Obst, C.; Rowcroft, P.; Silcock, P. Developing Ecosystem Accounts for Protected Areas in England and Scotland: New Forest National Park Summary Report; Department for Food, Environment & Rural Affairs: London, UK, 2015; pp. 1–34. [Google Scholar]
  109. 109 Marchetti, M.; Motta, R.; Pettenella, D.; Sallustio, L.; Vacchiano, G. Forests and Forest-Wood System in Italy: Towards a New Strategy to Address Local and Global Challenges. Forest 2018, 15, 41–50. [Google Scholar] [CrossRef]
  110. de Jong, R.; Edens, B.; van Leeuwen, N.; Schenau, S.; Remme, R.; Hein, L.; Remme, R. Ecosystem Accounting Limburg Province, the Netherlands. Part I: Physical Supply and Condition Accounts. 2016, pp. 1–26. Available online: https://www.wavespartnership.org/en/knowledge-center/ecosystem-accounting-limburg-province-netherlands-part-1-physical-supply-and (accessed on 9 March 2023).
  111. Remme, R.; Hein, L. Ecosystem Accounting Limburg Province, The Netherlands. Part II: Monetary Supply and Use Accounts. 2016, pp. 1–26. Available online: https://www.wavespartnership.org/en/knowledge-center/ecosystem-accounting-limburg-province-netherlands-part-2-monetary-supply-and-use (accessed on 9 March 2023).
  112. Cervelli, E.; Pindozzi, S.; Allevato, E.; Saulino, L.; Silvestro, R.; Scotto Di Perta, E.; Saracino, A. Landscape Planning Integrated Approaches to Support Post-Wildfire Restoration in Natural Protected Areas: The Vesuvius National Park Case Study. Land 2022, 11, 1024. [Google Scholar] [CrossRef]
  113. Paletto, A.; Geitner, C.; Grilli, G.; Hastik, R.; Pastorella, F.; Garcìa, L.R. Mapping the Value of Ecosystem Services: A Case Study from the Austrian Alps. Ann. For. Res. 2015, 58, 157–175. [Google Scholar] [CrossRef]
  114. Willis, K.G.; Garrod, G.; Scarpa, R.; Lovett, A.; Bateman, I.J.; Hanley, N.; Macmillan, D.C.; Commission, F. The Social and Environmental Benefits of Forests in Great Britain. Soc. Environ. Benefits For. Phase 2 2003, 1–36. Available online: https://forestry.gov.scot/publications/665-the-social-and-environmental-benefits-of-forests-in-great-britain-main-report (accessed on 9 March 2023).
  115. Xue, D.; Tisdell, C. Valuing Ecological Functions of Biodiversity in Changbaishan Mountain Biosphere Reserve in Northeast China. Biodivers. Conserv. 2001, 10, 467–481. [Google Scholar] [CrossRef]
  116. Marino, D. La Contabilità Ambientale Dei Servizi Ecosistemici Della Città Metropolitana Di Roma Capitale; Unimol: Campobasso, Italy, 2023; ISBN 9788896394410. [Google Scholar]
  117. Duarte, B.; Carreiras, J.; Caçador, I. Climate Change Impacts on Salt Marsh Blue Carbon, Nitrogen and Phosphorous Stocks and Ecosystem Services. Appl. Sci. 2021, 11, 1969. [Google Scholar] [CrossRef]
  118. Esen, S.E.; Hein, L.; Cuceloglu, G. Accounting for the Water Related Ecosystem Services of Forests in the Southern Aegean Region of Turkey. Ecol. Indic. 2023, 154, 110553. [Google Scholar] [CrossRef]
  119. Piaggio, M.; Siikamäki, J. The Value of Forest Water Purification Ecosystem Services in Costa Rica. Sci. Total Environ. 2021, 789, 147952. [Google Scholar] [CrossRef] [PubMed]
  120. Mueller, M.; Pander, J.; Geist, J. The Ecological Value of Stream Restoration Measures: An Evaluation on Ecosystem and Target Species Scales. Ecol. Eng. 2014, 62, 129–139. [Google Scholar] [CrossRef]
  121. de la Cruz, A.; Benedicto, J. Assessing Socio-Economic Benefits of Natura 2000—A Case Study on the Ecosystem Service Provided by SPA Pico Da Vara/Ribeira DO Guilherme. Output of the Project Financing Natura 2000: Cost Estimate And Benefits of Natura 2000 (Contract No.: 070307/2007/484403/MAR/B2). 2009, Volume 44. Available online: http://ec.europa.eu/environment/nature/natura2000/financing/docs/azores_case_study.pdf (accessed on 9 March 2023).
  122. Matero, J.; Saastamoinen, O. In Search of Marginal Environmental Valuations—Ecosystem Services in Finnish Forest Accounting. Ecol. Econ. 2007, 61, 101–114. [Google Scholar] [CrossRef]
  123. Mastrorilli, M.; Rana, G.; Verdiani, G.; Tedeschi, G.; Fumai, A.; Russo, G. Economic Evaluation of Hydrological Ecosystem Services in Mediterranean River Basins Applied to a Case Study in Southern Italy. Water 2018, 10, 241. [Google Scholar] [CrossRef]
  124. Broadmeadow, S.; Thomas, H.; Nisbet, T.; Valatin, G.; Nisbet, T.; Valatin, G. Valuing flood regulation services of existing forest cover to inform natural capital accounts. For. Res. Alice Holt Lodg. Farnham Surrey 2018, 1–28. Available online: https://www.forestresearch.gov.uk/publications/valuing-flood-regulation-services-of-existing-forest-cover-to-inform-natural-capital-accounts/ (accessed on 9 March 2023).
Figure 1. Methodological framework.
Land 12 02173 g001
Figure 2. Study area.
Land 12 02173 g002
Figure 3. Transition categories areas (%) in Italy (1990–2018). (Ag. Ext.: agricultural extensification, Etcs.: evolution to complex system, Ag. Int.: agricultural intensification, Perm.: permanence, For. Ext.: forest extension, Urb.: urbanization).
Land 12 02173 g003
Figure 4. Bibliographic sources used for ES (number).
Land 12 02173 g004
Figure 5. Biophysical and economic values (EUR 2022) per hectare and LULC macro class used for the quantification of ES. Macro class codes correspond to urban areas (100), urban green areas (141), arable land (210), permanent crops (220), pastures (230), heterogeneous agricultural areas (240), forests (310), shrub and/or herbaceous vegetation (320), non and sparsely vegetated areas (330) wetland and water bodies (500). In water purification ESs the letters N and P stand for nitrogen and phosphorus, respectively.
Land 12 02173 g005
Figure 6. Economic values (in 2022 EUR millions) of the analyzed ES for the year 2018.
Land 12 02173 g006
Figure 7. Positive (in green) and negative (in red) economic supply variation (in 2022 EUR millions) of the ten ES considered between 1990 and 2018.
Land 12 02173 g007
Figure 8. Positive (in green) and negative (in red) Change (%) in the annual biophysical ES supply between 1990 and 2018.
Land 12 02173 g008
Figure 9. Transition categories and economic variation (EUR millions). Every color corresponds to the label transition category.
Land 12 02173 g009
Figure 10. Spatial distribution of economic value variation (M ln EUR).
Land 12 02173 g010
Table 1. Economic variation of ES supply (in 2022 EUR millions) summarized by transition categories.
Perm.Urb.Ag. Ext.Ag. Int.For. Ext.EtcsOtherTot
Food−853−342431883−653−822129−615
Fodder−54−192140−29−228−54
Timber41−3−4−112−4122
Mushroom5−2−1−92401
Global climate regulation32−16−5−3620−150
Air purification462−34−31−475278−7712136
Groundwater recharge−306−3013037376−55834−280
Water purification−14−20−3100−18
Erosion41−73−29−9084−320−49
Flood mitigation−13−38−12519−3811−68
Tot−659−5581121677−197−1521220−927
Disclaimer/Publisher’s Note: The statements, opinions and data contained in all publications are solely those of the individual author(s) and contributor(s) and not of MDPI and/or the editor(s). MDPI and/or the editor(s) disclaim responsibility for any injury to people or property resulting from any ideas, methods, instructions or products referred to in the content.

