Article

Seasonal Variations of Dissolved Organic Matter in Urban Rivers of Northern China

1
Tianjin Key Laboratory of Water Resources and Environment, Tianjin Normal University, Tianjin 300387, China
2
Institute of Surface-Earth System Science, School of Earth System Science, Tianjin University, Tianjin 300072, China
3
Haihe Laboratory of Sustainable Chemical Transformations, Tianjin 300192, China
*
Authors to whom correspondence should be addressed.
Land 2023, 12(2), 273; https://doi.org/10.3390/land12020273
Submission received: 21 December 2022 / Revised: 8 January 2023 / Accepted: 14 January 2023 / Published: 18 January 2023

Abstract

:
Dissolved organic matter (DOM) is ubiquitously present in aquatic environments, playing an important role in the global carbon cycle and water quality. It is necessary to reveal the potential sources and explore spatiotemporal variation of DOM in rivers, especially in urban zones impacted by human activities. It was designed to aim to explore spatiotemporal variations of DOM in urban rivers and ascertain the influencing factors. In this study, dissolved organic carbon (DOC) concentrations, UV-Vis absorption spectroscopy, and 3D fluorescence spectroscopy combined with parallel factor analysis were utilized to characterize DOM composition in urban rivers (the Jiyun, Chaobai, and Yongding rivers) in Tianjin city, northern China. The results showed that DOC (1.28 to 25.85 mg·L−1), generally, was at its highest level in spring, followed by summer, and lowest in autumn and winter, and that the absorption parameters E250:365 (condensation degree/molecular weight, 7.88), SUVA254 (aromaticity, 3.88 L mg C−1 m−1), a355 (content of chromophores, 4.34 m−1), a260 (hydrophobicity, 22.02 m−1), and SR (molecular weight, 1.08) of CDOM (chromophoric DOM) suggested that DOM is mainly composed of low-molecular-weight fulvic acid and protein-like moieties, and had the capability of participating in pollutant migrations and transformations. The results demonstrated significant seasonal differences. Generally, high DOC content was detected in rivers in urban suburbs, due to anthropogenic inputs. Three fluorescence components were identified, and the fluorescence intensity of the protein class reached the highest value, 294.47 QSU, in summer. Different types of land use have different effects on the compositions of riverine DOM; more protein-like DOM was found in sections of urban rivers. The correlation between DOC concentration and the CDOM absorption coefficient was found to be unstable due to deleterious input from industrial and agricultural wastewater and from domestic sewage from human activities. HIX and BIX elucidated that the source of CDOM in three river watersheds was influenced by both terrestrial and autochthonous sources, and the latter prevailed over the former. Geospatial data analysis indicated that CDOM in autumn was sourced from plant detritus degradation from forest land or from the urban green belt; construction land had a great influence on DOC and CDOM in riparian buffer areas. It was revealed that DOM in the watershed is highly impacted by nature and human activities through land use, soil erosion, and surface runoff/underground percolation transport; domestic sewage discharge constituted the primary source and was the greatest determiner among the impacts.

1. Introduction

Rivers are an essential link in the water/solute cycle and an important channel for transporting pollutants from terrestrial sources into lakes and oceans. As integrators of terrestrial processes and reactors of biogeochemistry, rivers are also an important aspect of the global carbon cycle [1,2,3]. Dissolved organic matter (DOM) is a class of organic mixtures with multiple features, a wide range of sources, and complex structures, which are widely found in aquatic ecosystems such as rivers, reservoirs, lakes, and oceans. The classes of DOM primarily include humic acid, fulvic acid, various hydrophilic organic acid, nucleic acid, amino acid, surfactants, etc. [1,3]. The molecular-weight size and polarity of the components vary widely. DOM in natural water is primarily derived from exogenous and endogenous sources. Exogenous sources include natural organic matter in the atmosphere, terrestrial systems, and anthropogenic discharge of sewage into bodies of water through rainfall, surface runoff, and infiltration, and the main components are expressed as humus-like substances; endogenous sources are related to biological activities, i.e., the release of dissolved and metabolic products generated by various aquatic plants, bacteria, and other organisms in natural water, and its main components are expressed as protein-like substances [3,4]. Dissolved organic matter (DOM) plays a central role in the regional and global carbon cycle and in water quality in rivers. The composition and quality of DOM in bodies of water have an important impact on the activation of nutrients in biogeochemical cycles, the transport and transformation of heavy metals and organic pollutants, and aquatic environment quality [5,6].
Fluorescence and UV-Vis absorption spectroscopy are essential to characterize DOM composition, molecular structure, and sources. Three-dimensional fluorescence and parallel factor analysis techniques have become the most widely applied techniques to study the source and components of DOM. They can describe the information of fluorescence intensity (FI) when the excitation wavelength (Ex) and emission wavelength (Em) change simultaneously [1,3]. Three-dimensional fluorescence spectroscopy not only combines the advantages of conventional fluorescence analysis methods with high sensitivity and better selectivity but also overcomes the disadvantages of conventional fluorescence spectroscopy—that it can only provide broad and featureless fluorescence peaks, is susceptible to Raman scattering, and provides incomplete spectral information.
Land use changes affect the hydrological processes and biogeochemical cycles of rivers, while land use patterns within a watershed are one of the main factors that change the water quality of rivers [7,8,9]. There are significant differences in the sources and contributions of different forms of carbon in rivers influenced by land use in the watershed [10,11]. Land use is also one of the critical factors influencing the composition of DOM in a watershed and can be used to partially explain the variation in composition and quality of DOM [12]. Previous studies emphasized the effects of different land-use practices on DOM in rivers [12,13,14,15], showing that there are more significant differences in the composition and sources of DOM in rivers within regions such as forests, agricultural land, and urban areas. Studying the influence of land use practices on changing DOM composition in rivers is important to reveal the transport and transformation of regional carbon.
The three northern rivers (TNRs), including the Jiyun, Chaobai, and Yongding rivers, are part of the Hai River that flows slowly through the city and possesses an extensive system of tributary streams in northern China that discharge into the Bohai sea. The TNRs provide one of the important water sources for Tianjin city, one of the four municipalities in China. The river system possesses a fragile ecological environment and scarce water resources. Dramatic climatic change and human activities have a significant impact on the riverine system. Water consumption and wastewater discharge are increasing, and the contradiction between supply and demand of water resources has become a major constraint to sustainable social development [16]. To date, relatively few studies have been conducted on compositions of dissolved organic carbon and the seasonal variations in these rivers. Therefore, this study aims to (1) investigate the content, spatial and temporal distribution patterns, and structural characteristics of DOM in urban rivers, using a combination of UV-visible spectroscopy and 3D fluorescence spectroscopy; (2) further explore the correlations between DOM and water quality parameters to indicate the sources and reveal the migration, transformation, and implications for provenance and the environment due to DOM in urban rivers; (3) investigate the influence of land use patterns on DOM properties and concentrations in rivers, based on calculating the proportions of different land uses, and to provide theoretical data for water quality improvement and ecological restoration of urban rivers.

2. Materials and Methods
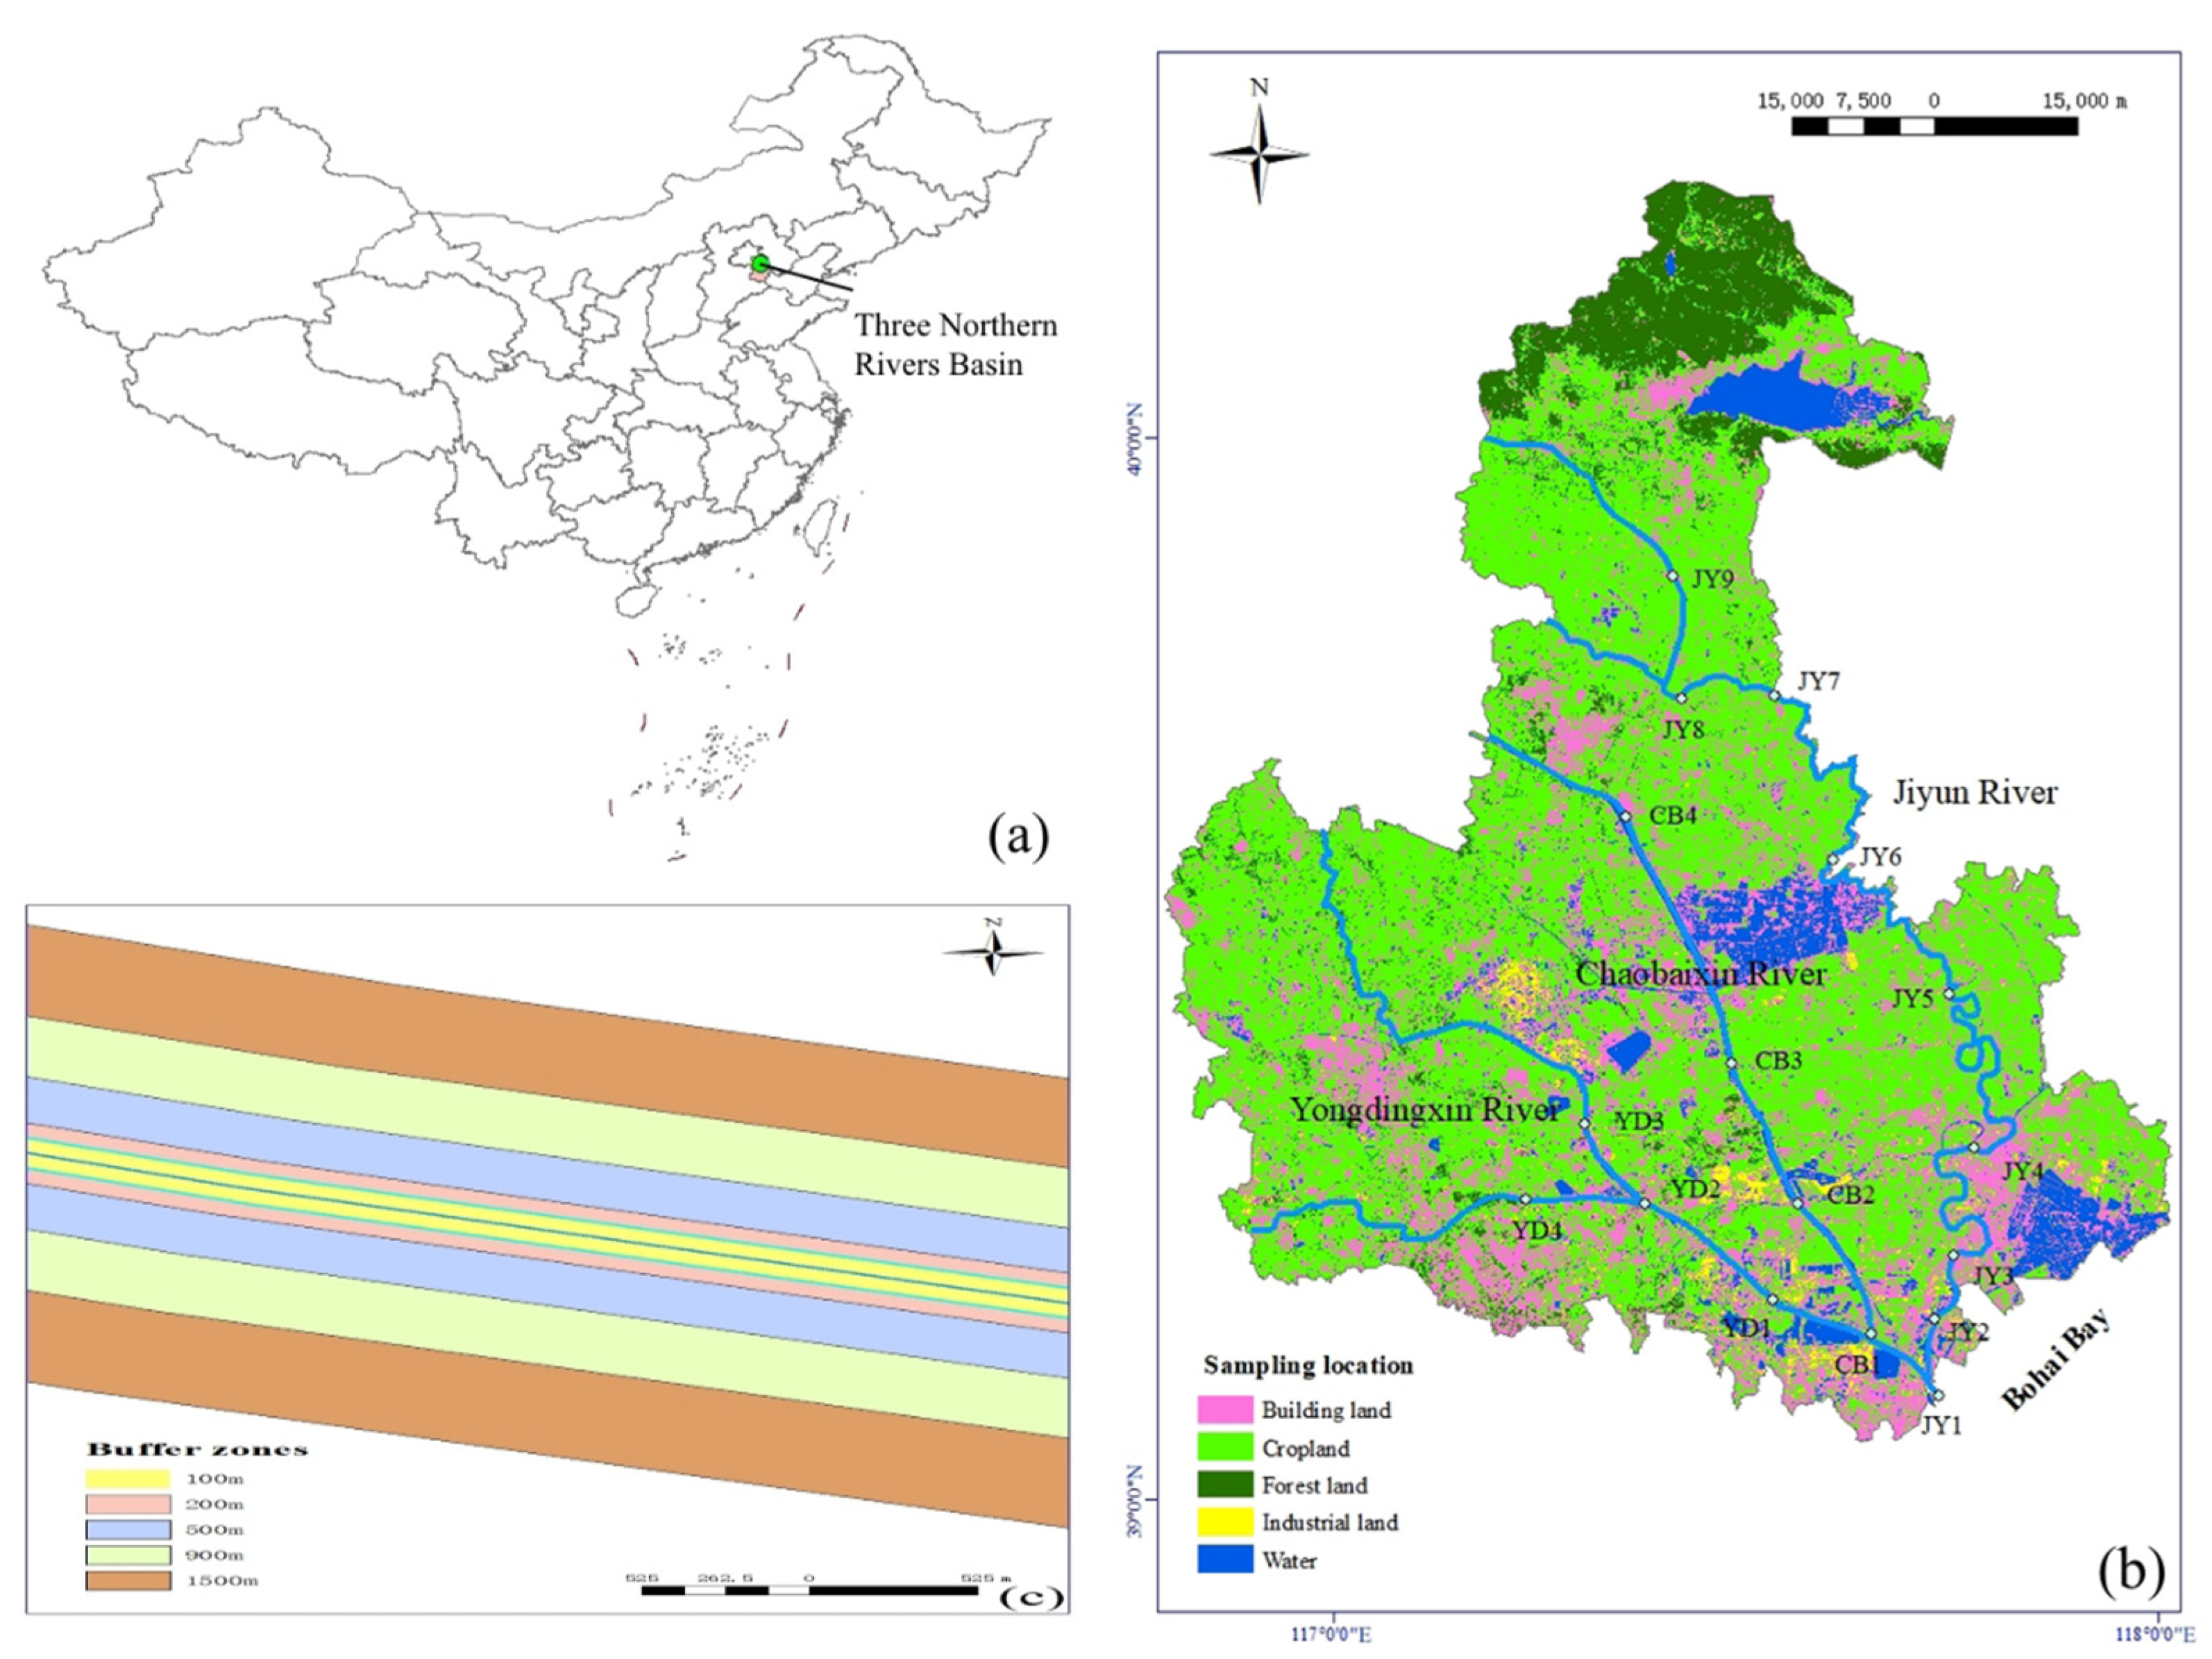
2.1. Study Area

The TNRs’ watershed is situated at 112°~120° E, 35°~43° N, east of Bohai Bay, west of Taihang Mountain, south of Yellow River and of the Mongolian Plateau [17]. It is one of the important water sources in the Beijing–Tianjin–Hebei area, subjected to intense human interference (Figure 1). The overall terrain of the TNRs slopes downward gradually from the northwest to the southeast, with a drainage area of about 4 × 10⁵ km2. The population is 1.176 × 10⁸, accounting for 10% of the country’s total population. The urban population accounts for 24% of its total population, and the rural population accounts for 76%; the average population density in the watershed is 371 people per square kilometer (http://www.giwp.org.cn/index.do (accessed on 17 January 2023)). The distribution and changes of arable land and forest/grassland will directly affect the soil and water conservation function, which in turn has a series of impacts on the water ecology and water environment of the watershed. The arable land area is 1.09 × 10⁵ km2, accounting for 11% of the country’s arable land; dry land is the main type, with an area of 1.05 × 10⁵ km2, while paddy fields constitute 3.2 × 10³ km2. The effective irrigated area is 6.8 × 10⁴ km2 and the per capita possession of farmland is 920 m2, roughly equivalent to the national average. The TNRs’ watershed is one of the main grain-producing areas in China. However, the arable land has declined year after year since 1949 due to environmental change. The annual average runoff of the TNRs is 27.55 × 10⁸ m3; Yongding River is the greatest, at 20.29 × 10⁸ m3. The average annual rainfall is about 600 mm; 80%~85% of which occurs during the wet season. The period from mid-July to early August is the main wet precipitation period. The North China Plain has a vast land, mild climate, and sufficient sunshine suitable for the growth of a variety of food and cash crops. The TNRs produce ~10% of the total grain in China, including ~30% of the total wheat and ~20% of the total corn [18]. Water and soil erosion is serious in the upper reaches of Yongding River watershed, with larger silt deposits than other rivers in the TNR system. Flood discharge capacity has been reduced sharply. The Chaobai River also flows upstream through the Loess Plateau; flood sand produces a downstream migration of silt. In the Jiyun River watershed, the tributaries are scattered, the source is short, and flow is urgent. This watershed has a low regulation and storage capacity, relatively large flood peak modulus, and less silt content. The security of water resources has become a serious problem. The problem of water shortages was further aggravated by the overexploitation of water resources and climate change [19]. The quality of the ecological environment, including that of water in the watershed, directly affects economic production and people’s lives, and the temporal and spatial resolution of DOM at the watershed scale are, indeed, necessary for rational land use, water resource management, the water cycle, and reducing the impact of climate change on human activities.

2.2. Sampling and Water Quality Determination

River waters were sampled from March to December in 2021 (10-month study period) using WTW portable water collector from Jiyun River (JY1-JY9), Chaobai River (CB1-CB4), and Yongding River (YD1-YD4), respectively (Figure 1). The study area is a typical temperate East Asian monsoon climate zone with four distinctive seasons: windy spring and autumn with little rain, hot summer with abundant precipitation, and cold winter with little snow. March to May was classified as spring, June to August was classified as summer, September to November was classified as autumn, and December to the next February as winter. The total of 170 samples were collected during the entire research period. Samples were collected in brown polyethylene (PE) bottles (Thermo Scientific Nalgene, Wyman Street, Waltham, MA, USA), transported to the laboratory, and then filtered through 0.45 µm glass fiber filter membrane after being cauterized at 450 °C for 5 h. To avoid sample contamination, all polyethylene sample bottles were acid washed with 10% HNO3 for 48 h and rinsed four times with distilled water. This procedure was repeated for each sampling series. All collected water samples were stored at 4 °C and returned to the laboratory in time to complete the analysis. Water temperature (T, ℃), pH, dissolved oxygen (DO, mg·L−1), and electrical conductivity (EC/ms·cm−1) of the samples were measured in situ using a portable water quality parameter instrument (USA, In-situ Aqua TROLL 600).
After the samples were returned to the laboratory, the water was titrated with 0.02 mol/L dilute hydrochloric acid (HCl) for alkalinity measurement and the average value was determined after 2 repetitions. The water sample for DOC concentration analysis was determined by high-temperature catalytic oxidation with a TOC analyzer (OI Analytical Aurora 1030 W). Microporous ultrapure water (18.2 MΩ∙cm) was obtained from the microporous ultrapure water system. A series of gradient concentrations of potassium hydrogen phthalate solution was used as the standard reagent for plotting calibration curve for DOC measurement. The detection limit for blanks and replicates was 0.5 mg·L−1 and the precision was 5% at a concentration of 4 mg·L−1.

2.3. Optical Analysis

CDOM samples were measured primarily with T9cs UV spectrophotometer (Persee Company, Beijing, China) by scanning wavelength of 200–600 nm, slit width 0.5 nm. The UV-Vis spectra were determined using a UV spectrophotometer with a 1 cm quartz cuvette, a measurement range of 200~700 nm, and a measurement interval of 1 nm, using Milli-Q (18.2 MΩ) water as blank. The absorbance of the measured water samples was converted to the uncorrected absorption coefficient a(λ′) by Equation (1), and the absorption coefficient a(700) at 700 nm was corrected (Equation (2)) to obtain the actual absorption coefficient a (λ) [20]:
a(λ′) = 2.303A(λ)/L
a(λ) = a(λ′) − a (700) × λ/700
where A(λ) is the absorbance at wavelength λ and L is the optical path (m). a(λ′) is the uncorrected CDOM absorption coefficient at wavelength λ (m−1) and a(λ) is the corrected CDOM absorption coefficient at wavelength λ (m−1).
The absorption coefficient at a certain wavelength (a355) is usually used to express a relative concentration (unit: m−1) of CDOM [21], and a260 is used to characterize the content of hydrophobic CDOM containing the aromatic C fraction [22]. The spectral slope ratio SR in this study is obtained between the wavelengths of 275–295 nm and 350–400 nm to reflect the molecular weight, origin, and mineralization of CDOM [23]. SR values increase when molecular weights decrease; both exhibited an inverse relationship.
In addition, the specific absorbance at 254 nm (SUVA254, L mg C−1 m−1) obtained from the DOC concentration of this sample is commonly used by researchers to indicate aromaticity information (SUVA254: absorption coefficients at 254 nm divided by DOC concentration) [24]; the higher value of SUVA254 indicates the stronger the aromaticity. E2/E3 (a250/a365) reflects the condensation degree and molecular weight of natural organic matter; it was considered a humic acid source (complex structure) when E2/E3 was less than 3.5, and a fulvic acid and protein-like source (smaller molecular weight) when higher than 3.5 [25]. E2/E3 is based on the absorption ratio at the two wavelengths. In order to extract spectral information more scientifically, a calculation based on spectral slope was adopted to reflect more spectral information (S275–295 and S350–400).
The fluorescence spectra of the water samples were measured using a Hitachi F-7000 fluorescence spectrophotometer (Hitachi, Ltd., Tokyo, Japan). The excitation wavelength was scanned from 220 to 450 nm at increments of 5 nm; the emission wavelength was scanned from 280 to 550 nm with an increment of 1 nm; the scanning speed was 1200 nm/min. The fluorescence data were calibrated using ultrapure water (Millipore-Q, 18.2 MΩ∙cm) as a blank; the cuvette was 1 cm in length. The fluorescence intensity of quinine sulfate standard (1 μg·L−1 dissolved in 0.05 mol·L−1H2SO4) at Ex/Em = 350/450 nm (i.e., 1 μg·L−1 =1 QSU) was used to calibrate the fluorescence intensity of the samples [26]. To eliminate reabsorption and internal filtering effects, the sample requires dilution using a 1 cm cuvette before fluorescence detection once the absorbance is greater than 0.3 at 254 nm or 0.02 at 370 nm [27]. For Raman effect correction, Milli-Q water needs to be measured on the day of measurement. Then, the blank of Milli-Q water is manually deduced from the original fluorescence intensity of sample water. To eliminate the effect of Rayleigh scattering, the fluorescent intensity after deduction were substituted with null in two specific spectral regions from 250 nm to 450 nm (excitation wavelength) and 430 nm to 550 nm (emission wavelength).
After removing the internal filtering of fluorescence and Rayleigh scattering effects, PARAFAC was performed using the N-way toolbox in MATLAB. The fluorescence index (FI) (as the ratio of fluorescence intensity at emission wavelengths of 450 nm to 500 nm at excitation wavelength of 370 nm) was used to distinguish the relative contribution of DOM from terrestrial and biogenic sources [28]. The humification index (HIX) is the integrated intensity ratio at excitation wavelength 254 nm and emission wavelengths between 435 and 480 nm to between 300 and 345 nm. HIX value represents high or low degree of DOM humification [29]. The autogenic index (BIX) is the ratio of fluorescence intensity at emission wavelengths of 380 nm to 430 nm for an excitation wavelength of 310 nm [30].

2.4. Land Use Classification

Remote sensing image data were selected from ETM remote-sensing images covering the study area in the spring of 2021 without clouds. The pre-processing included steps of geometric correction, mosaic, and cropping, maximum likelihood supervised classification. Finally, land use type data were obtained. The land use types were divided into five major categories attributed to classification principles and practical exploitation, namely, watershed, forest land, arable land (including paddy land and dry land), industrial land, and construction land. The land use situation in the study area in 2021 is shown in Figure 1.
The buffer zones in the study area were divided into strips with different distances from the sampling sites on both sides of the river, distributing at the trunk stream and the principal tributary regions. The operation uses ArcGIS software to add the sampling points as the geographic center. Five buffering zones were set by taking each sampling site as the center. Both sides of river were fixed at 1 km long along the bank line and variable with 100, 200, 500, 900, and 1500 m of widths perpendicular to the bank line.

2.5. Statistical Analysis

SPSS statistical software was used to analyze the correlation between the percentage of the area of land use types in the buffer zone and water quality indices at different scales, respectively. SPSS was used for data outlier removal and screening before the analysis, and to determine the characteristics of water quality changes in time and space.
CANOCO software was used for further analysis of the relationship between land use and river water quality. According to the calculated results of the maximum gradient value of the ranking, the axis was less than three, and the linear ranking model redundancy analysis (RDA) was selected for explaining why water quality changes with seasons in different water regions surrounded by types of land uses.

3. Results

3.1. Water Quality Parameters Measured in the Field

The main water quality parameters (pH, conductivity, temperature, and dissolved oxygen) of the surface waters in the study area are shown in Table 1. During the sampling period of this study, the average water temperature was higher than 25 °C in summer, between 14–17 °C in spring and autumn, and dropped to about 4 °C in winter. The pH values in the TNRs watershed ranged from 7.65–9.53, with a mean value of 8.53 ± 0.41 and a variable coefficient of 4.8%, without fluctuations. Conductivity ranged from 24.31–581.91 μs·cm−1, with no significant difference between the upstream and downstream waters (ANOVA, r = 0.32, p > 0.05). The highest and lowest conductivity values were found in summer and winter, demonstrating a general pattern of summer > spring > autumn > winter. Spatially, the mean value of conductivity was higher downstream than upstream. Dissolved oxygen (DO) ranged from 0.98–20.39 mg·L−1 throughout the study period, with significant differences among the 3 rivers (ANOVA, r = 0.58, p < 0.05). This demonstrates the characteristic of higher values upstream than downstream, but the differences between upstream and downstream were not significant in each river (ANOVA, r = −0.39, p > 0.05). The seasonal distribution ranked as winter > spring and autumn > summer. EC showed the highest value (192.20 ± 135.78 ms·cm−1) in summer, whereas pH and DO were lowest in this season (8.40 ± 0.49, 7.64 ± 2.83 mg·L−1).

3.2. Content and Properties of DOM in the Waters

DOC concentrations in these rivers varied from 1.28 to 25.85 mg·L−1. It was higher in downstream than in upstream, but the difference wasn’t significant (ANOVA, r = 0.29, p > 0.05). The seasonal distribution of DOC was generally highest in spring, followed by summer, and lowest in autumn and winter, with significant seasonal variation (ANOVA, r = −0.68, p < 0.001). The absorption coefficient a355 in the watershed ranged from 0.01–9.78 m−1. CDOM concentration in each season in the upstream and downstream are shown in Figure 2. a355 in water samples from different rivers had significant differences (ANOVA, r = 0.52, p < 0.05). SUVA254 was strongly correlated with CDOM (r = 0.31, p < 0.01) in water samples from the TNRs watershed. a260 was more variable, ranging from 7.48–38.23 m−1 with a mean value of 22.02 m−1. The variation of E250:365 values in all river samples ranged from 4.50–49.13 with a mean value of 7.88; SR values varied from 0.7 to 1.64 and SUVA254 values varied from 0.82 to 9.23 L mg C−1 m−1. SUVA254 was strongly correlated with CDOM (r = 0.31, p < 0.01) in water samples from the TNRs basin.
The absorption indexes E250:365 (ANOVA, r = −0.47, p < 0.01), SUVA254 (ANOVA, r = 0.41, p < 0.05), a355 (ANOVA, r = 0.52, p < 0.01), a260 (ANOVA, r = 0.48, p < 0.05) and SR (ANOVA, r = 0.53, p < 0.01) of CDOM in the TNRs watershed showed significant seasonal differences (ANOVA, r = −0.47, p < 0.001). As can be seen from Figure 2, the mean a355 showed a variation trend of summer > autumn > winter > spring. The mean E250:365 trend showed a pattern of spring > autumn > winter > summer. The averages of SUVA254 showed a trend of autumn > summer > winter > spring. The average a260 ranked as the order of summer > autumn > spring > winter. The average SR variation trend ranked as the order of winter > summer > spring > autumn.
Figure 3 shows the fluorescent components in the TNRs catchment. C1 (peak Tuv, protein−like) and C3 (peak A and M, fulvic−like) fractions were observable in the FDOM of the TNRs watershed in spring, with mean fluorescence intensity values of 170.53 and 194.20 QSU, respectively, to which the fulvic acid−like fraction contributed 53.24%. C1 (peak T and Tuv, protein−like) and C2 (peak A, humic−like) fractions of FDOM were detectable in summer, with mean fluorescence intensity values of 327.36 and 260.59 QSU, respectively, of which the protein−like fraction accounted for 55.68%, the maximum proportion throughout the study period. The FDOM in autumn was at the same level as summer, with C1 (peak T/Tuv, protein−like) and C2 (peak A, humic−like) amounting to 196.46 and 202.26 QSU, respectively. The humic acid−like fraction constituted a larger portion, 50.72%. The mean values of fluorescence intensity of the three components of FDOM in winter were 189.79 (protein−like), 171.79 (humic−like), and 169.78 (fuvic−like) QSU, with a contribution of 35.72% from the protein−like component. The fluorescence intensity of DOM in the downstream water was higher than that in the upstream water in all seasons. In winter, the fluorescent components were C1 and C2 in upstream, and the fluorescent components in downstream were C1 and C3.

3.3. Correlation Analysis between Landscapes and CDOM Characteristics

DOC vs. built-up, DOC vs. industrial land had obvious positive correlations as the buffer width increased from 200 m to 1500 m, while negative correlation with cultivated land was observed as the buffer width increased from 100 m to 900 m. The correlation between DOC and built-up, industrial land increased as the buffer width increased from 200 m to 1500 m (Figure 4a). No significant correlations were found between other land use types and DOC concentrations in riparian buffer zones. Therefore, a buffering distance of 900 m was considered as the optimal width for analyzing the effects of land use types on DOM and its properties. In total, 56.80% of the riparian buffer zones were accounted by cropland, followed by 34.45% of built-up areas. The mutual relationship between areas of land use and DOM/CDOM is not significantly observed when the buffering distance was set to more than 1500 m, so 100–1500 m buffering zones were confirmed for inspecting.
The results of redundancy analysis summarized CDOM parameter values and areas of land use. The major axis of RDA for spring explained 25.51% of the CDOM features and was positively correlated with cropland (r = 0.78, p < 0.01); the minor RDA axis accounted for only 9.16% of the CDOM’s features. Cropland area proportion negatively correlated with DOC (r = −0.65, p < 0.01), a260 (r = −0.56, p < 0.05), fulvic acid-like fluorescence intensity (r = −0.51, p < 0.05), and BIX (r = −0.53 p < 0.05). The major axis of RDA for summer explained 40.61% of CDOM features and was positively correlated with cropland and forestland (r = 0.85, p < 0.01); the minor RDA axis accounted for only 7.81% of CDOM’s features. Cultivated land within the riparian buffer was positively correlated with E250:365 (r = 0.63, p < 0.01) and negatively correlated with SUVA254 (r = −0.80, p < 0.01) and SR (r = −0.45, p < 0.05). The major axis of RDA for autumn explained 36.65% of CDOM features and was positively correlated with forest land and industrial land (r = 0.64, p < 0.01); the minor RDA axis accounted for only 0.63% of CDOM features. Construction land and wetland areas’ proportion in riparian buffer zones were positively correlated with SUVA254 (r = 0.49, p < 0.05), DOC (r = 0.51, p < 0.05), a355 (r = 0.52, p < 0.05) and a260 (r = 0.50, p < 0.05), and negatively correlated with BIX (r = −0.47, p < 0.05). Construction and forested land were positively correlated with SR, protein-like fluorescence intensities. The major axis of RDA for winter explained 13.94% of CDOM features and was positively correlated with cropland (r = 0.80, p < 0.01) and negatively correlated with built-up land (r = −0.65, p < 0.01); the minor RDA axis accounted for only 5.61% of CDOM features. Cropland and forest land area proportion were positively correlated with FI (r = 0.49, p < 0.05), and negatively correlated with DOC (r = −0.51, p < 0.05), a355(r = −0.60, p < 0.05), and a260 (r = −0.66, p < 0.01).

4. Discussion

4.1. Spatiotemporal Variations of DOC Contents and Impacting Factors

There is a negative correlation between DOC and DO, which may be due to the fact that endogenous release produced DOM from POM bio-mineralization, and aerobic degradation occurred with strong demand of oxygen by aquatic organisms [1,3]. Higher water temperature and sunshine in summer also promoted microbial degradation and photodegradation of organic matter, increasing the consumption of DO [12] (Figure 2). Although oxygen-consuming, degradation behavior of DOM occurred, DO increased more quickly than DOM in water with seasons during OC cycling.
A quantity of land-sourced material accumulated in the last winter season enters into rivers with rainwater and melt water in spring, which is also the cultivating season for agriculture. As the temperature increases, the cycling rate of organic carbon accelerated. In the rainy summer, wet precipitation brings more dissolved substances from lands in the watershed. Densely populated areas and agricultural irrigation contributed greatly to DOM accumulation in rivers. Algae transformation to river DOC gradually increases with increasing temperature and prolonged duration of light [31].
The average annual precipitation in Tianjin in 2021 was 984.1 mm, which is 73.5% more than the multiyear average precipitation. This suggested the highest amount of precipitation in Tianjin since 1956 and an extra-high flow in summer. Soil erosion was strongest from the value of EC, but due to heavy rainfall and enhanced surface runoff, as well as rapid decomposition in summer, most of the DOC failed to stay in the river for a long time before it was carried to the ocean, resulting in a reduced DOC content in river water compared to spring. In autumn, when the temperature drops and light duration is shortened, DOM originating from POM photo-degradation was limited, and microbial metabolic consumption and its content was further curtailed [16,32]. In winter, the allochthonous input gradually weakened due to the decrease in precipitation and runoff. The domestic sewage input changed little and gradually dominated the DOC source. Hence, the DOC content remained at a stable level to that of autumn, with weak microbial degradation in low temperatures, based on the consumption and supply of DO in winter.
DOM concentration in rivers is influenced by human social economic activities, and by climatic and hydrological conditions in the watershed. In terms of spatial distribution, cropland and built-up land prevailed at up- and downstream regions in the watershed, respectively, with a great variability of DOC contents in each region, demonstrating the uncertain impact of anthropogenic behaviors. The variation trends of CDOM and DOC in this study are complex, without any significant correlation. This is mainly due to the fact that when waters were polluted by industrial and agricultural wastewater and domestic sewage from human activities, the water quality deteriorated, and the relationship between DOM and CDOM concentration was affected more, becoming unstable with higher levels of non-chromophore DOC in the water [33].

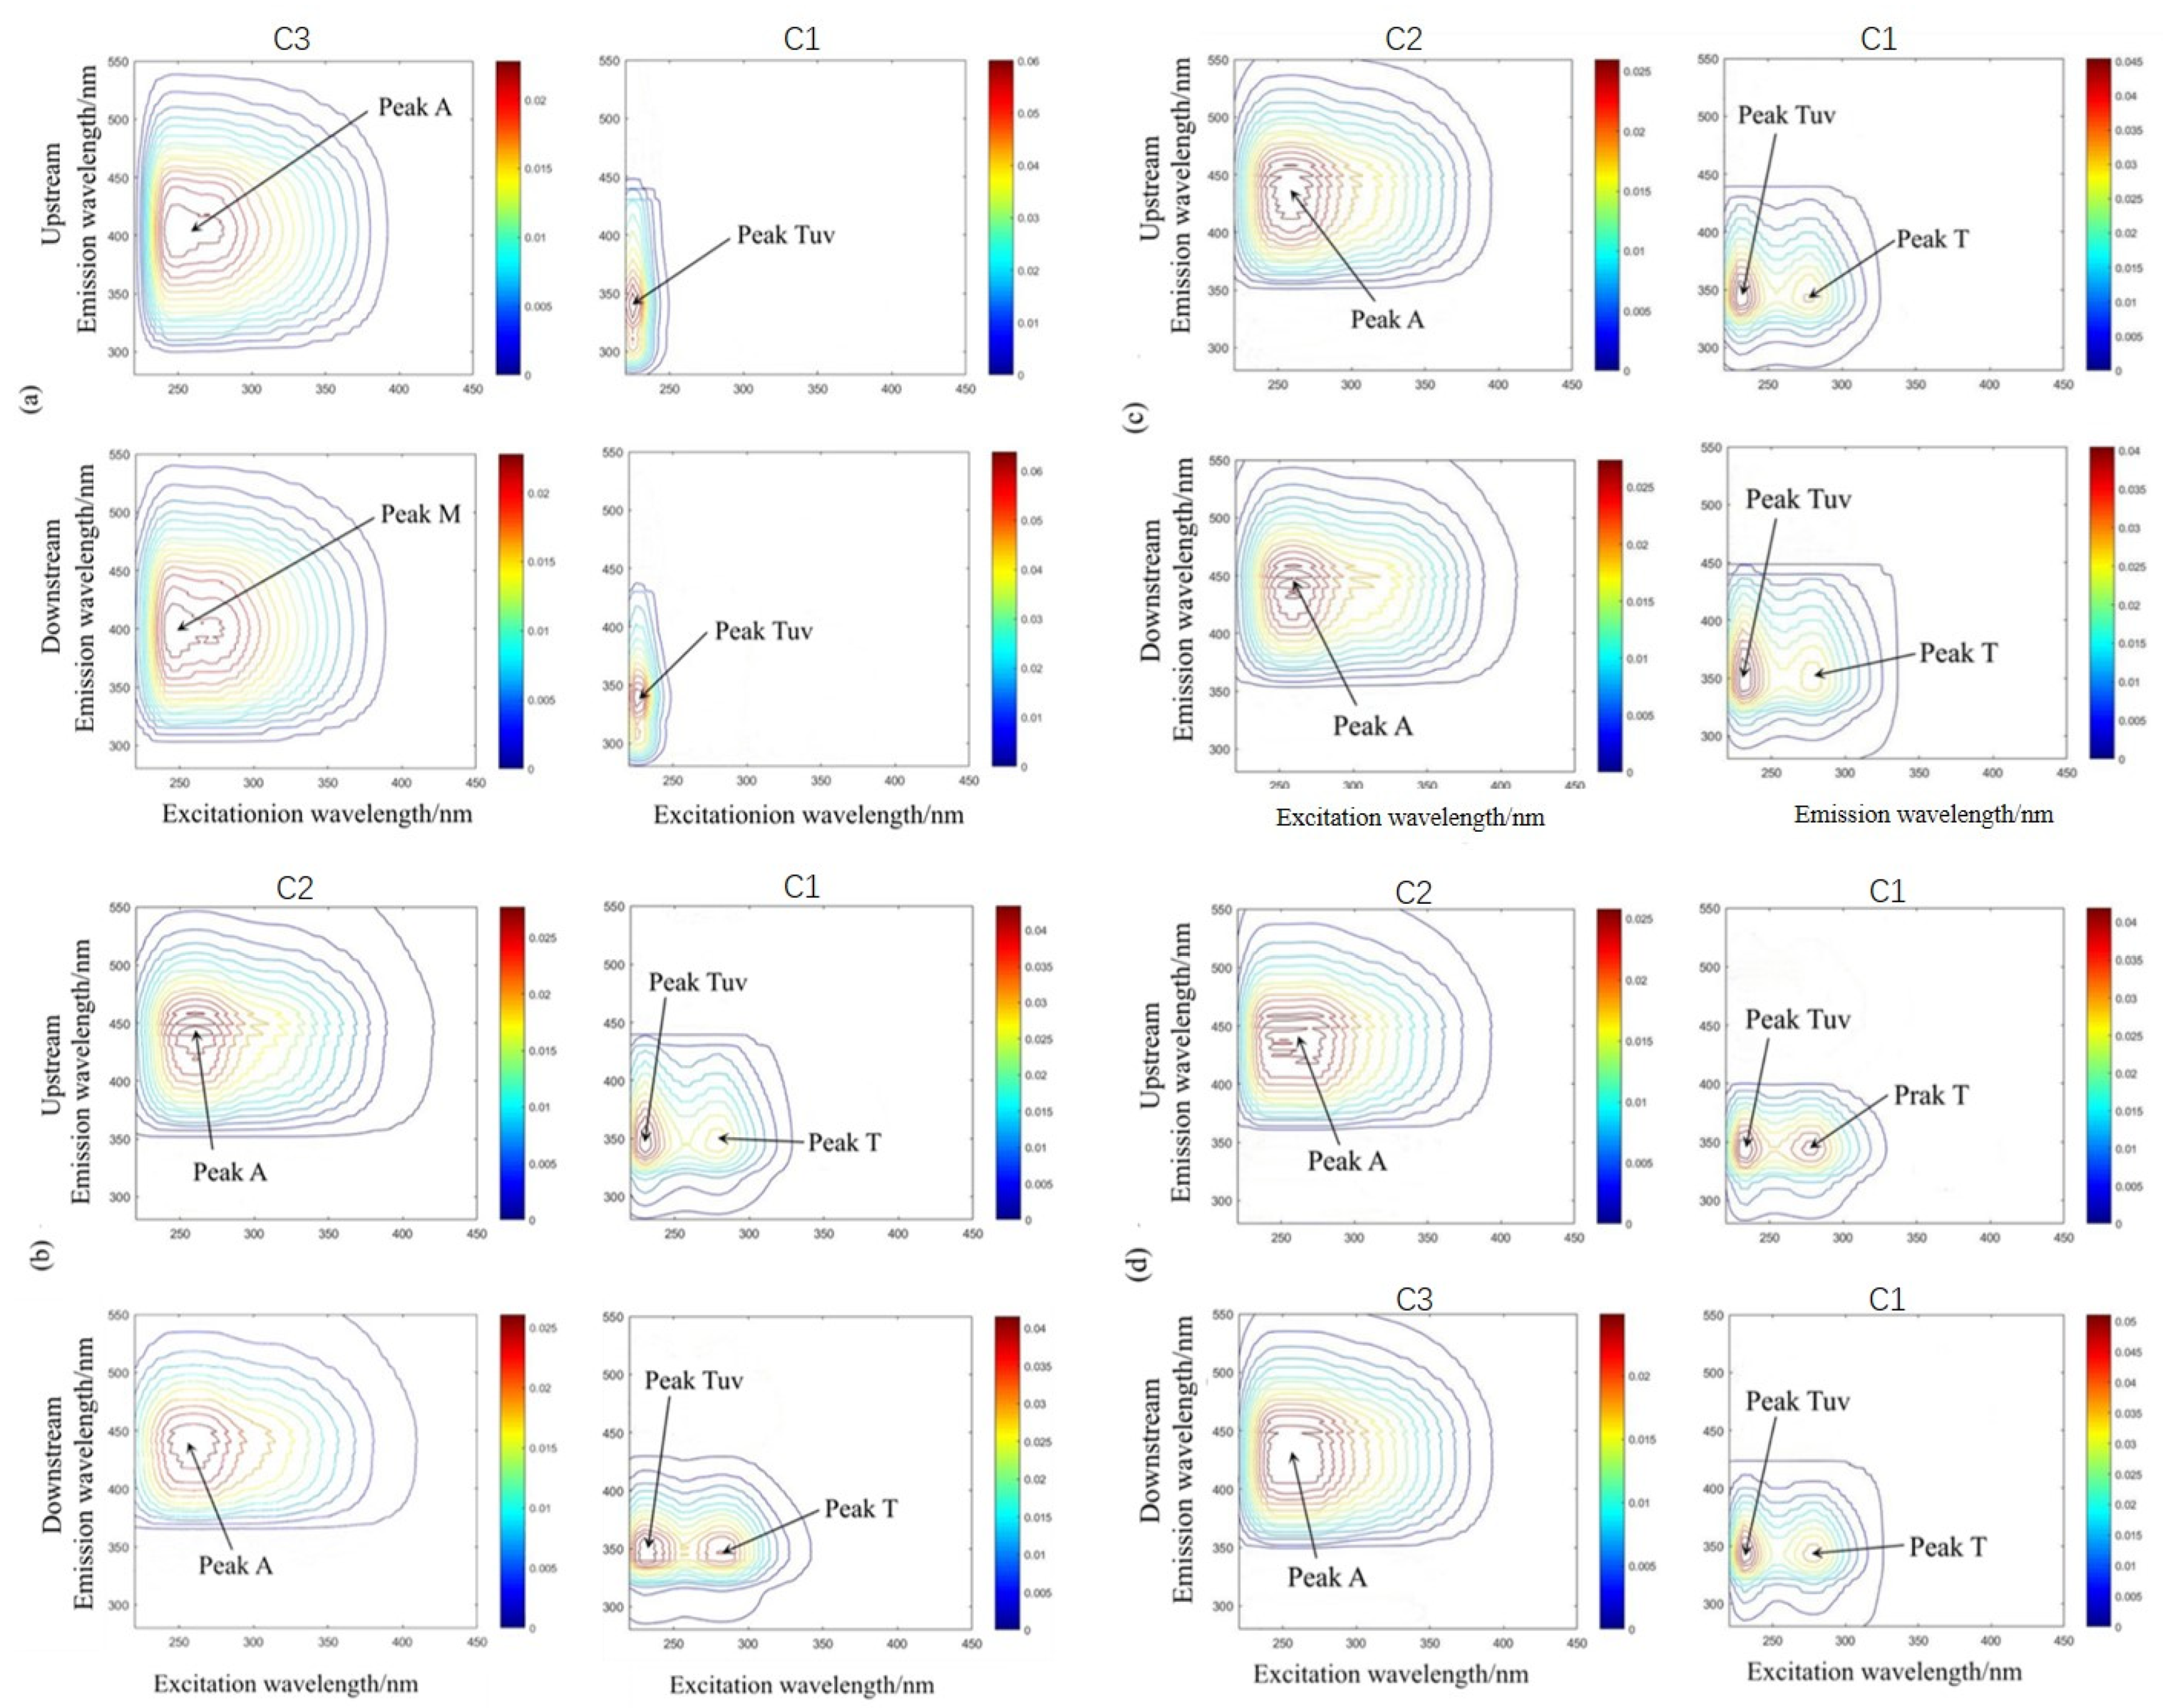
4.2. Characterization of DOM and Spatiotemporal Variations

During the sampling period of this study, the overall variation of the fluorescence index FI in the TNRs watershed was slight, ranging from 1.40 to 2.32, with a mean value of 1.91 ± 0.15. The FI (about 90% of the samples above 1.80) and E2/E3 values (100% higher than 3.5) were at a high level throughout the 10 months, indicating that the humus component in FDOM mainly originated from endogenous sources of microbial degradation; fulvic acid and protein-like moieties were the main substances, characterized by low molecular size and condensation degree.
FDOM in the TNRs basin consists mainly of one protein-like fraction and two humic-like fractions. The C1 fraction (Tuv: Ex/Em = 225~230/337~350 nm, T: Ex/Em = 275~280/337~350 nm) includes the tryptophan-like components [34,35] and contains 2 fluorescence peaks. The maximum excitation/emission of both peaks had wavelength pairs similar to the fluorescence peak of the tryptophan monomer [36]. They are identified as an autochthonous organic matter component originating from aquatic plant and microbial decomposition [37], and serve as the nutrient source for the microbial community in the estuary [38].
The C2 component (A: Ex/Em = 245~270/440~477 nm) is the humic acid-like component [1,39], located in the region of the conventional humic acid-like A peak. The C3 component (A: Ex/Em = 235~295/391~407 nm, M: Ex/Em = 235~315/391~407 nm) is assigned to the fulvic acid-like component [40]. Humic-like (peak M) fluorophores are associated with marine or anthropogenic input [41]. C2 and C3 fractions are mainly allochthonous, originating from decomposed soil organic matter and closely associated to carbonyl and carboxyl groups, etc., in the humic structure. Fulvic acid fluorescence is mainly generated by low molecular weight and high fluorescence-efficiency humic substances. Humic acid fluorescence is primarily generated by relatively stable high-molecular-weight humic fractions [42]. However, the humic- and protein-like proportion was elevated in the winter season, presumably because of lengthy microbial decomposition and wastewater input during weak hydrologic conditions.
FI values varied slightly among the three rivers and were significantly lower in spring than those in other seasons. The BIX values ranged from 0.75 to 3.95 throughout the study period, with a mean value of 1.17 ± 0.2. BIX in most samples (99%) was above 0.8, indicating a significant biological origin of FDOM. BIX values were lowest in autumn, followed by the seasonal sequence of winter < spring < summer. The humification index (HIX), varied from 0.47 to 4.92, with a mean value of 2.37 ± 0.84. HIX values in the dry reaches were low, with 97% of the samples below 4, owing to poor terrestrial input. HIX was significantly higher in summer and autumn, and significantly lower in spring.
The distribution range of HIX, BIX, and FI indices of DOM in the TNRs watershed are shown in Figure 5. The FI values ranged from 1.40 to 2.32, indicating that FDOM is influenced by terrestrial and biogenic sources [35]. Except for a few water samples in summer, HIX values were less than 4 and BIX values were mostly greater than 1 (BIX vs. HIX). Some organic moiety in spring sourced from terrestrial input was characteristic of high bio-availability (BIX vs. FI; HIX vs. FI). FDOM exhibited weak humification and was dominated by protein-like components newly produced by planktonic activities, which is consistent with the description of DOM in urban waters in northern–northeastern China [43].
Soil erosion and transportation by runoff and seepage into water directly leads to the simultaneous increase of humic-like and protein-like fluorescence [44]. The maximum values of protein-like fluorescence intensity occurred in summer, and the minimum values occurred in the spring. In spring, water temperature starts to rise, light gradually lengthens, and primary production is induced, irrespective of the auto- or allochthonous microbial activity at its primitive initiating stage; therefore, the water column is least rich in protein-like fluorescence in spring. The longer daylight hours and higher temperatures in summer stimulated the photolysis of humic acids and microbial metabolism, producing more bio-available protein-like substances [45]; therefore, the fluorescence intensity of protein-like fluorescence reached its maximum in summer. The fluorescence intensity of other fluorescent fractions in summer may be reduced due to the dilution caused by copious rainfall. In winter, DOM sources were limited and the fluorescence intensity of CDOM was reduced; this was ascribed to less precipitation, weaker rainfall scouring and leaching, and less input of terrestrial-derived organic matter [46]. Low temperature induced all life to become inert, and fluorescent components in winter could not be discerned by evident optical properties (Figure 6). Fulvic acid-like fractions were not detected in both summer and winter. The proportions of humic acid-like and protein-like DOM were significantly higher, suggesting that fulvic acid can polymerize into higher molecular and more complex structures of humic acid-like DOM or decompose into lower molecular tyrosine-like and tryptophan-like DOM (i.e., simple structured protein-like DOM) [3].
The changes in fluorescent and absorption indices indicated that CDOM had strong exogenous sources and large molecular weight in CDOM in spring, and riverine aquatic environmental systems have abundant exogenous microbial products due to plant detritus decomposition loaded with surface runoff and subsurface seepage [22]. DOM in summer, winter, and autumn also demonstrated evident endogenous characteristics with high aromaticity and hydrophobicity of DOM, but showed an increased tendency of molecular size [22,47] (Figure 2).

4.3. Impact of Land Use on DOM

The impacts of geographical factors of the catchment on elemental cycling and water quality have been attracting scientific interest. Previous studies have found that riparian buffer scale in the catchment was related to water quality [48,49,50]. The concentrations of CDOM and DOC carried by rivers flowing through different regions of typical lands are different; rivers flowing through wetlands and construction land generally have higher DOM concentrations, while rivers flowing through forest and farmland show lower concentrations of DOM, with significant variation in different study regions (Figure 6). In central Europe, DOM concentrations were higher for rivers flowing through farmland areas than for those flowing through forests [51], whereas for rivers in south-central Ontario, Canada, DOM concentrations were higher for rivers flowing through forests than for those in farmland regions [12]. Thus, the effect of land use type on river DOM concentrations and characteristics is dissimilar across regions, resulting from the input mode and influence strength of climatic conditions and anthropogenic emissions [12,52,53,54].
In order to characterize the effect of land use type on CDOM, a quantitative analysis on land use types and organic parameters was conducted. As shown in Figure 6, as the proportion of agricultural land increases, microbial-derived DOM decreases and so does the structural complexity of DOM in spring, suggesting the increased protection of soil aggregate fractions under low decomposition management of crop rotation [55]. However, the effects of agricultural land on proteins began to lessen in summer, due to a series of strategies, including scouring/leaching, crop harvesting, and straw decay, producing matter that entered into the water [56].
Soil organic matter is more likely to enter the river, which leads to higher concentrations of DOM in sub-watersheds dominated by arable land [51]. In contrast, the use of organic fertilizers in agricultural production leads to an increase in the content of soil organic matter, which in turn leads to an increase in the concentration of DOM (Figure 6). However, the opposite result was demonstrated in this study: DOM in winter and spring exhibited an opposite distribution pattern to that of cropland area proportion, due to stronger transpiration and reduced infiltration, groundwater withdrawal for irrigation, and reservoir construction [13,57,58]. It was confirmed that streams influenced by cropland show lower DOC fluxes than forested streams in northeastern China, attributed to the high extraction of surface runoff for irrigation [13].
The correlation between DOM and arable land in summer and autumn—attributed to serious dilution by heavy rain, discharge into sea gulfs, and the interception and retention of substances by buffering zones—was not significant, because soil variables had, in general, a great effect and were informative for describing the role of catchment characteristics on DOM in water [59]. We concluded that the environmental change in riparian soil, from oxidation to reduction, mineralization of organic carbon, change of metal morphology, and flood would alter the stabilizing effect of organic carbon, and then change with the distance to the river in a horizontal direction [60]. Therefore, the influence of cropland on DOM was presumably attributed to specific soil nature in the watershed.
Regions dominated by agriculture, forest, or urban areas contain some variations in the proportion of DOM components in their rivers. Built-up areas are one of the main factors that positively influence DOM at the riparian buffers (Figure 6), with CDOM content (a355), hydrophobicity, and protein-like peak fluorescence intensity increasing with the percentage of built-up land area in the watershed. This indicates that this typical area may be highly influenced by nonpoint source pollution common in urbanized areas [43,61]. Intensive anthropogenic activities in human habitats increase the input and accumulation of protein-like component (detergents) and may cause frequent water column eutrophication through nitrogen and phosphorus enrichment from domestic wastewater, promoting the activity of microbial and phytoplankton life in polluted rivers [15,32,62]. This geospatial data analysis indicated that CDOM in autumn originated from degradation of plant detritus in forest land or the urban green belt; construction and wetland accounted for DOC and CDOM quantities in the riparian buffer.

5. Conclusions

This study investigated dissolved organic carbon (DOC) concentrations. UV-Vis absorption spectroscopy and 3D fluorescence spectroscopy combined with parallel factor analysis were used to understand the composition and characteristics of DOM in urban rivers (the Jiyun, Chaobai, and Yongding rivers) in Tianjin city, northern China. The results indicated that DOC contents generally reached a high level in spring and were lowest in autumn and winter. Meanwhile, the absorption parameters of CDOM—E250:365, SUVA254, a355, a260, and SR—showed significant seasonal differences. Three major fluorescent components were identified and named humic acid-like, fulvic acid-like, and protein-like substances. CDOM in the TNRs watershed is influenced by both terrestrial and autochthonous sources; autochthonous sources predominated, especially in summer. DOM and its relationship with land use types were comprehensively analyzed by 10-month observations. Industrial and agricultural wastewater and domestic sewage from human activities caused the correlation between CDOM and DOC to be unstable or non-significant. The region of cultivated land showed a negative influence on DOC and CDOM. Construction land had a greater positive influence on DOC and CDOM in the riparian buffer, indicating that CDOM increased with the proportion of construction land area in the watershed. Human activities enhance additional DOM inputs with the fluorescence intensity of CDOM-like proteins. Geospatial data analysis indicated that CDOM in autumn originated from degradation of plant detritus in forest land or the urban green belt; construction and wet-land accounted for DOC and CDOM quantities in the riparian buffer. The results have important implications for understanding water–soil interaction across typical land use regions. This study provides a reference for the management of aquatic ecology and the prevention of water pollution in watersheds on the basis of carbon cycling. This study suggests regional nonpoint pollution control, appeals for reasonable use of land, and proposes improvement of sewage disposal systems to ensure that certain water quality criteria are met before wastewater discharge. It has significant implications for improving human habitats, environment, and drinking water security. Investigation on influence of land use on the material cycle is scarce, and this marks the first report on the TNRs watershed. Future research will be focused on the same subject in southern China; soil samples could be collected simultaneously for material and distribution analysis, providing further evidence and effectively prolonging the duration of the study.

Author Contributions

Conceptualization, M.X. and F.Y.; methodology, M.X.; software, M.X. and Z.C.C; validation, Y.W., Z.C. and W.Z.; formal analysis, Y.W. and Z.C.; investigation, M.X. and F.Y.; resources, M.X. and F.Y.; data curation, M.X.; writing—original draft preparation, Y.W.; writing—review and editing, M.X.; visualization, M.X. and Y.W.; supervision, M.X. and F.Y.; project administration, M.X. and F.Y. All authors have read and agreed to the published version of the manuscript.

Funding

This research was funded by the National Natural Science Foundation of China, grant number 42221001.

Data Availability Statement

Not applicable.

Acknowledgments

This research was funded by the National Natural Science Foundation of China (42221001) and received financial support from the Haihe Laboratory of Sustainable Chemical Transformations.

Conflicts of Interest

The authors declare no conflict of interest.

References

  1. Mostofa, K.M.G.; Yoshioka, T.; Mottaleb, A.; Vione, D. Photobiogeochemistry of Organic Matter; Springer: Berlin/Heidelberg, Germany, 2013. [Google Scholar]
  2. Zhong, J.; Li, S.L.; Ibarra, D.E.; Ding, H.; Liu, C.Q. Solute production and transport processes in Chinese monsoonal rivers: Implications for global climate change. Global Biogeochem. Cycles 2020, 34, e2020GB006541. [Google Scholar] [CrossRef]
  3. Xiao, M.; Chen, Z.; Zhang, Y.; Wen, Y.; Shang, L.; Zhong, J. The Optical Characterization and Distribution of Dissolved Organic Matter in Water Regimes of Qilian Mountains Watershed. Int. J. Environ. Res. Public Health 2022, 19, 59. [Google Scholar] [CrossRef] [PubMed]
  4. Thibault, L.; Marie, E.P. Non-conservative patterns of dissolved organic matter degradation-when and where lake water mixes. Aquat. Sci. 2019, 81, 64. [Google Scholar]
  5. Thomas, R.; Dominik, Z.; Harald, B.; Dittmar, T. Iron traps terrestrially derived dissolved organic matter at redox interfaces. Proc. Natl. Acad. Sci. USA 2013, 110, 10101–10105. [Google Scholar]
  6. Yi, Y.B.; Xiao, M.; Mostofa, K.M.G.; Xu, S.; Wang, Z.L. Spatial variations of trace metals and their complexation behavior with DOM in the water of Dianchi Lake, China. Int. J. Environ. Res. Public Health 2019, 16, 4919. [Google Scholar] [CrossRef] [Green Version]
  7. Ierodiaconou, D.; Laurenson, L.; Leblanc, M.; Stagnitti, F.; Duff, G.; Salzman, S.; Versace, V. The consequences of land use change on nutrient exports: A regional scale assessment in southwest Victoria, Australia. J. Environ. Manage. 2005, 74, 305–316. [Google Scholar] [CrossRef]
  8. Herath, I.K.; Sheng, J.W.; Mao, H.M.; Jianli, W.; Chandrajith, R. Tracing controlling factors of riverine chemistry in a headwater tributary of the Yangtze River, China, inferred from geochemical and stable isotopic signatures. Environ. Sci. Pollut. Res. 2019, 26, 23899–23922. [Google Scholar] [CrossRef]
  9. Li, S.L.; Liu, X.; Yue, F.J.; Yan, Z.F.; Wang, T.J.; Li, S.J.; Liu, C.Q. Nitrogen dynamics in the Critical Zones of China. Prog. Phys. Geog. 2022, 46, 869–888. [Google Scholar] [CrossRef]
  10. Dubois, K.D.; Lee, D.; Veizer, J. Isotopic constraints on alkalinity, dissolved organic carbon, and atmospheric carbon dioxide fluxes in the Mississippi River. J. Geophys. Res. Biogeosciences 2010, 115, G02018. [Google Scholar] [CrossRef]
  11. Li, X.; Han, G.; Liu, M.; Song, C.; Zhang, Q.; Yang, K.; Liu, J. Hydrochemistry and dissolved inorganic carbon (DIC) cycling in a tropical agricultural river, Mun River Basin, Northeast Thailand. Int. J. Env. Res. Pub. Health 2019, 16, 3410. [Google Scholar]
  12. Wilson, H.F.; Xenopoulos, M.A. Ecosystem and seasonal control of stream dissolved organic carbon along a gradient of land use. Ecosystems 2008, 11, 555–568. [Google Scholar] [CrossRef]
  13. Sun, H.; Han, J.; Li, D.; Lu, X.; Zhang, H.; Zhao, W. Organic carbon transport in the Songhua River, NE China: Influence of land use. Hydrol. Process. 2017, 31, 2062–2075. [Google Scholar] [CrossRef]
  14. Hur, J.; Nguyen, H.V.M.; Lee, B.M. Influence of upstream land use on dissolved organic matter and trihalomethane formation potential in watersheds for two different seasons. Environ. Sci. Pollut. R. 2014, 21, 7489–7500. [Google Scholar] [CrossRef] [PubMed]
  15. Shi, Y.; Zhang, L.; Li, Y.; Zhou, L.; Zhou, Y.; Zhang, Y.; Huang, C.; Li, H.; Zhu, G. Influence of land use and rainfall on the optical properties of dissolved organic matter in a key drinking water reservoir in China. Sci. Total Environ. 2020, 699, 134301. [Google Scholar] [PubMed]
  16. Yin, H.L.; Wang, Y.; Huang, J.S. Photodegradation-induced biological degradation of treated wastewater effluent organic matter in receiving waters. Water Res. 2021, 204, 117567. [Google Scholar]
  17. Ling, M.H.; Guo, X.M.; Shi, X.L.; Han, H.B. Temporal and spatial evolution of drought in Haihe River Basin from 1960 to 2020. Ecol. Indic. 2022, 138, 108809. [Google Scholar] [CrossRef]
  18. Pan, Y.; Zhang, C.; Gong, H.; Yeh, P.J.F.; Shen, Y.; Guo, Y.; Huang, Z.; Li, X. Detection of human-induced evapotranspiration using GRACE satellite observations in the Haihe River basin of China. Geophys. Res. Lett. 2017, 44, 190–199. [Google Scholar]
  19. Jia, Z.; Liu, S.; Xu, Z.; Chen, Y.; Zhu, M. Validation of remotely sensed evapotranspiration over the Hai River Basin, China. J. Geophys. Res. Atmos. 2012, 117, D13113. [Google Scholar] [CrossRef]
  20. Rochelle-Newall, E.J.; Fisher, T.R. Chromophoric dissolved organic matter and dissolved organic carbon in Chesapeake Bay. Mar. Chem. 2002, 77, 23–41. [Google Scholar]
  21. Dilling, J.; Kaiser, K. Estimation of the hydrophobic fraction of dissolved organic matter in water samples using UV photometry. Water Res. 2002, 36, 5037–5044. [Google Scholar] [CrossRef]
  22. Helms, J.R.; Stubbins, A.; Ritchie, J.D.; Minor, E.C.; Kieber, D.J.; Mopper, K. Absorption spectral slopes and slope ratios as indicators of molecular weight, source, and photobleaching of chromophoric dissolved organic matter. Limnol. Oceanogr. 2008, 53, 955–969. [Google Scholar] [CrossRef] [Green Version]
  23. Barreto, S.R.G.; Nozaki, J.; Barreto, W.J. Origin of Dissolved Organic Carbon Studied by UV-vis Spectroscopy. Acta Hydroch. Hydrob. 2003, 31, 513–518. [Google Scholar] [CrossRef]
  24. Weishaar, J.L.; Aiken, G.R.; Bergamaschi, B.A.; Fram, M.; Fujii, R.; Mopper, K. Evaluation of specific ultraviolet absorbance as an indicator of the chemical composition and reactivity of dissolved organic carbon. Environ. Sci. Technol. 2003, 37, 4702–4708. [Google Scholar] [CrossRef]
  25. Minero, C.; Lauri, V.; Falletti, G.; Maurino, V.; Pelizzetti, E.; Vione, D. Spectrophotometric characterization of surface lake water samples: Implications for the quantification of nitrate and properties of dissolved organic matter. Ann. Di Chim. J. Anal. Environ. Cult. Herit. Chem. 2007, 97, 1007–1116. [Google Scholar]
  26. Ohno, T. Fluorescence inner-filtering correction for determining the humification index of dissolved organic matter. Environ. Sci. Technol. 2002, 36, 742–746. [Google Scholar] [CrossRef]
  27. Murphy, K.R.; Butler, K.D.; Spencer, R.G.; Stedmon, C.A.; Boehme, J.R.; Aiken, G.R. Measurement of dissolved organic matter fluorescence in aquatic environments: An interlaboratory comparison. Environ. Sci. Technol. 2010, 44, 9405–9412. [Google Scholar] [CrossRef]
  28. Zsolnay, A.; Baigar, E.; Jimenez, M.; Steinweg, B.; Saccomandi, F. Differentiating with fluorescence spectroscopy the sources of dissolved organic matter in soils subjected to drying. Chemosphere 1999, 38, 45–50. [Google Scholar] [CrossRef]
  29. Tedetti, M.; Cuet, P.; Guigue, C.; Goutx, M. Characterization of dissolved organic matter in a coral reef ecosystem subjected to anthropogenic pressures (La Réunion Island, Indian Ocean) using multi-dimensional fluorescence spectroscopy. Sci. Total Environ. 2011, 409, 2198–2210. [Google Scholar] [CrossRef]
  30. Singh, S.; D’Sa, E.J.; Swenson, E.M. Chromophoric dissolved organic matter (CDOM) variability in Barataria Basin using excitation-emission matrix (EEM) fluorescence and parallel factor analysis (PARAFAC). Sci. Total Environ. 2010, 408, 3211–3222. [Google Scholar] [CrossRef]
  31. Li, S.; Zhang, J.; Mu, G.; Ju, H.; Wang, R.; Li, D.; Shabbir, A.H. Spatiotemporal characterization of chromophoric dissolved organic matter (CDOM) and CDOM-DOC relationships for highly polluted rivers. Water 2016, 8, 399. [Google Scholar] [CrossRef]
  32. Berggren, M.; Gudasz, C.; Guillemette, F.; Hensgens, G.; Ye, L.L.; Karlsson, J. Systematic microbial production of optically active dissolved organic matter in subarctic lake water. Limnol. Oceanogr. 2019, 65, 951–961. [Google Scholar] [CrossRef]
  33. Brezonik, P.L.; Olmanson, L.G.; Finlay, J.C.; Bauer, M.E. Factors affecting the measurement of CDOM by remote sensing of optically complex inland waters. Remote Sens. Environ. 2015, 157, 199–215. [Google Scholar] [CrossRef]
  34. Romera-Castillo, C.; Sarmento, H.; Alvarez-Salgado, X.A.; Gasol, J.M.; Marrase, C. Net production and consumption of fluorescent colored dissolved organic matter by natural bacterial assemblages growing on marine phytoplankton exudates. Appl. Environ. Microbiol. 2011, 77, 7490–7498. [Google Scholar] [CrossRef] [PubMed] [Green Version]
  35. McKnight, D.M.; Boyer, E.W.; Westerhoff, P.K.; Doran, P.T.; Kulbe, T.; Andersen, D.T. Spectrofluorometric characterization of dissolved organic matter for indication of precursor organic material and aromaticity. Limnol. Oceanogr. 2001, 46, 38–48. [Google Scholar] [CrossRef]
  36. Coble, P.G. Characterization of marine and terrestrial DOM in seawater using excitation-emission matrix spectroscopy. Mar. Chem. 1996, 51, 325–346. [Google Scholar] [CrossRef]
  37. He, Q.F.; Xiao, Q.; Fan, J.X.; Zhao, H.J.; Cao, M.; Zhang, C.; Jiang, Y.J. Excitation-emission matrix fluorescence spectra of chromophoric dissolved organic matter reflected the composition and origination of dissolved organic carbon in Lijiang River, Southwest China. J. Hydrol. 2021, 598, 126240. [Google Scholar] [CrossRef]
  38. Ma, Y.M.; Mao, R.; Li, S.Y. Hydrological seasonality largely contributes to riverine dissolved organic matter chemical composition: Insights from EEM-PARAFAC and optical indicators. J. Hydrol. 2021, 595, 125993. [Google Scholar] [CrossRef]
  39. Mostofa, K.M.G.; Li, W.; Wu, F.C.; Liu, C.Q.; Liao, H.; Zeng, L.; Xiao, M. Environmental characteristics and microbial changes of sediment pore water dissolved organic matter in four Chinese. Environ. Sci. Pollut. Res. 2018, 25, 2783–2804. [Google Scholar] [CrossRef]
  40. Zhang, Y.; Liu, X.; Wang, M.; Qin, B. Compositional differences of chromophoric dissolved organic matter derived from phytoplankton and macrophytes. Org. Geochem. 2013, 55, 26–37. [Google Scholar] [CrossRef]
  41. Fellman, J.B.; Hood, E.; Spencer, R.G.M. Fluorescence spectroscopy opens new windows into dissolved organic matter dynamics in freshwater ecosystems: A review. Limnol. Oceanogr. 2010, 55, 2452–2462. [Google Scholar] [CrossRef]
  42. Hassouna, M.; Theraulaz, F.; Massiani, C. Production and elimination of water extractable organic matter in a calcareous soil as assessed by UV/Vis absorption and fluorescence spectroscopy of its fractions isolated on XAD-8/4 resins. Geoderma 2012, 189–190, 404–414. [Google Scholar] [CrossRef]
  43. Zhao, Y.; Song, K.; Li, S.; Ma, J.; Wen, Z. Characterization of CDOM from urban waters in Northern-Northeastern China using excitation-emission matrix fluorescence and parallel factor analysis. Environ. Sci. Pollut. Res. 2016, 23, 15381–15394. [Google Scholar] [CrossRef] [PubMed]
  44. Kawahigashi, M.; Sumida, H.; Yamamoto, K. Seasonal changes in organic compounds in soil solutions obtained from volcanic ash soils under different land uses. Geoderma 2003, 113, 381–396. [Google Scholar] [CrossRef]
  45. Yang, X.; Yuan, J.; Yue, F.J.; Li, S.-L.; Wang, B.; Mohinuzzaman, M.; Liu, Y.; Senesi, N.; Lao, X.; Li, L.; et al. New insights into mechanisms of sunlight- and dark-mediated high-temperature accelerated diurnal production-degradation of fluorescent DOM in lake waters. Sci. Total Environ. 2021, 760, 143377. [Google Scholar] [CrossRef] [PubMed]
  46. Fellman, J.B.; Hood, E.; D’Amore, D.V.; Edwards, R.T.; White, D. Seasonal changes in the chemical quality and biodegradability of dissolved organic matter exported from soils to streams in coastal temperate rainforest watersheds. Biogeochemistry 2009, 95, 277–293. [Google Scholar] [CrossRef]
  47. Wen, Z.D.; Song, K.S.; Zhao, Y.; Du, J.; Ma, J.H. Influence of environmental factors on spectral characteristics of chromophoric dissolved organic matter (CDOM) in Inner Mongolia Plateau, China. Hydrol. Earth Syst. Sci. 2016, 20, 787–801. [Google Scholar] [CrossRef] [Green Version]
  48. Lecomte, K.L.; Garcia, M.G.; Formica, S.M.; Depetris, P.J. Influence of geomorphological variables on mountainous stream water chemistry (Sierras Pampeanas, Cordoba, Argentina). Geomorphology. 2009, 110, 195–202. [Google Scholar] [CrossRef]
  49. Varanka, S.; Hjort, J.; Luoto, M. Geomorphological factors predict water quality in boreal rivers. Earth. Surf. Process. Landf. 2015, 40, 1989–1999. [Google Scholar] [CrossRef]
  50. Xu, S.; Li, S.L.; Zhong, J.; Li, C. Spatial scale effects of the variable relationships between landscape pattern and water quality: Example from an agricultural karst river basin, Southwestern China. Agric. Ecosyst. Environ. 2020, 300, 106999. [Google Scholar] [CrossRef]
  51. Graeber, D.; Gelbrecht, J.; Pusch, M.T.; Anlanger, C.; von Schiller, D. Agriculture has changed the amount and composition of dissolved organic matter in Central European headwater streams. Sci. Total Environ. 2012, 438, 435–446. [Google Scholar] [CrossRef]
  52. Sobek, S.; Tranvik, L.J.; Prairie, Y.T.; Kortelainen, P.; Cole, J.J. Patterns and regulation of dissolved organic carbon: An Analysis of 7,500 widely distributed lakes. Limnol. Oceanogr. 2007, 52, 1208–1219. [Google Scholar] [CrossRef] [Green Version]
  53. Spencer, R.G.M.; Butler, K.D.; Aiken, G.R. Dissolved organic carbon and chromophoric dissolved organic matter properties of rivers in the USA. J. Geophys. Res. 2012, 117, G03001. [Google Scholar] [CrossRef]
  54. Griffin, C.G.; Frey, K.E.; Rogan, J.; Holmes, R.M. Spatial and interannual variability of dissolved organic matter in the Kolyma River, East Siberia, observed using satellite imagery. J. Geophys. Res. 2011, 116, G03018. [Google Scholar] [CrossRef] [Green Version]
  55. Angeletti, C.; Monaci, E.; Giannetta, B.; Polverigiani, S.; Vischetti, C. Soil organic matter content and chemical composition under two rotation management systems in a Mediterranean climate. Pedosphere 2021, 31, 903–911. [Google Scholar] [CrossRef]
  56. Chen, S.; Du, Y.X.; Das, P.; Lamore, A.F.; Dimova, N.T.; Elliott, M.; Broadbent, E.N.; Roebuck, J.A.; Jaffe, R.; Lu, Y.H. Agricultural land use changes stream dissolved organic matter via altering soil inputs to streams. Sci. Total Environ. 2021, 796, 148968. [Google Scholar] [CrossRef]
  57. Doll, P.; Fiedler, K.; Zhang, J. Hydrology and earth system sciences global-scale analysis of river flow alterations due to water withdrawals and reservoirs. Hydrol. Earth Syst. Sci. 2009, 13, 2413–2432. [Google Scholar] [CrossRef] [Green Version]
  58. Stanley, E.H.; Powers, S.M.; Lottig, N.R.; Buffam, I.; Crawford, J.T. Contemporary changes in dissolved organic carbon (DOC) in human-dominated rivers: Is there a role for DOC management? Freshw. Biol. 2012, 57, 26–42. [Google Scholar] [CrossRef]
  59. Sepp, M.; Koiv, T.; Noges, P.; Noges, T. The role of catchment soils and land cover on dissolved organic matter (DOM) properties in temperate lakes. J. Hydrol. 2019, 570, 281–291. [Google Scholar] [CrossRef]
  60. Ma, Y.Y.; Wang, Z.Q.; Ma, T.; Chen, S.X. Spatial distribution characteristics and influencing factors of organic carbon in sediments of Tongshun River riparian zone. Chemosphere 2020, 252, 126322. [Google Scholar] [CrossRef]
  61. Sliva, L.; Williams, D.D. Buffer zone versus whole catchment approaches to studying land use impact on river water quality. Water Res. 2001, 35, 3462–3472. [Google Scholar] [CrossRef]
  62. Shao, T.T.; Wang, T.; Liang, X.W.; Xu, H.; Li, L. Characterization of DOC and CDOM and their relationship in turbid waters of a high-altitude area on the western Loess Plateau, China. Water Sci. Technol. 2019, 80, 1796–1806. [Google Scholar] [CrossRef] [PubMed]
Figure 1. (a) The TNRs catchment in China; (b) sampling sites and land use types in the TNRs catchment based on Landsat satellite data in 2021; (c) buffer zones of different river areas.
Land 12 00273 g001
Figure 2. Box plot of DOC concentrations and seasonal absorption indexes in three rivers. The solid line inside the box represents the median. The horizontal edges of the boxes denote the 25th and 75th percentiles. ** was sig. at the confidence level of 0.01.
Land 12 00273 g002
Figure 3. Identification of fluorescent components in water in the TNRs watershed. (a) Shows the fluorescent components in spring (C1 + C3); (b) shows fluorescent components in summer (C1 + C2); (c) shows fluorescent components in autumn (C1 + C2); and (d) shows fluorescent components in winter (C1 + C2 for upstream; C1 + C3 for downstream).
Land 12 00273 g003
Figure 4. Correlation between DOC, chromophore dissolved organic matter (CDOM) content (a355), and land use types in different riparian buffer scales. * sig. at the level of 0.05; ** sig. at the level of 0.01.
Land 12 00273 g004
Figure 5. Seasonal variation of the humification index (HIX), biological index (BIX), and fluorescence index (FI) in the water samples of TNRs; a indicates BIX vs. HIX; b indicates BIX vs. FI; c indicates HIX vs. FI.
Land 12 00273 g005
Figure 6. Redundancy analysis (RDA) of the correlation between multiple land use types and CDOM−specific UV absorption coefficient, and the fluorescence peak intensity in the riparian buffer zones of 900 m.
Land 12 00273 g006
Table 1. Characteristics of water quality parameters in different seasons in the TNRs watershed.
Sampling
Sites
Parameter
Values
pHEC
ms·cm−1
T
°C
DO
mg·L−1
Seasons
Upstream
(JY5-JY9,
CB3-CB4,
YD3-YD4)
SpringRange7.93–9.5348.09–177.229.57–23.706.15–16.77
Mean ± Std8.77 ± 0.3895.87 ± 38.5017.29 ± 4.6011.32 ± 3.65
SummerRange7.68–9.2847.38–266.2127.69–30.800.98–16.29
Mean ± Std8.40 ± 0.49106.23 ± 62.5429.27 ± 0.978.02 ± 4.38
AutumnRange7.92–9.4826.74–220.107.94–28.864.00–16.25
Mean ± Std8.51 ± 0.3879.29 ± 50.1616.33 ± 6.9111.36 ± 3.90
WinterRange8.16–9.0724.31–52.763.41–5.5412.89–19.65
Mean ± Std8.44 ± 0.2833.73 ± 7.624.31 ± 0.7715.32 ± 1.89
Downstream
(JY1-JY4,
CB1-CB2,
YD1-YD2)
SpringRange7.88–9.12108.23–310.888.37–20.067.02–13.98
Mean ± Std8.72 ± 0.30160.40 ± 57.9614.17 ± 4.0210.21 ± 2.02
SummerRange7.79–9.3275.78–581.9122.50–30.472.92–13.20
Mean ± Std8.44 ± 0.48192.20 ± 135.7827.61 ± 2.117.64 ± 2.83
AutumnRange7.72–9.2539.83–206.217.91–26.825.50–13.79
Mean ± Std8.45 ± 0.31109.81 ± 48.2117.35 ± 6.569.79 ± 2.40
WinterRange7.85–8.7035.61–66.322.42–5.9711.55–16.45
Mean ± Std8.40 ± 0.2650.74 ± 12.264.18 ± 1.0014.04 ± 1.76
Disclaimer/Publisher’s Note: The statements, opinions and data contained in all publications are solely those of the individual author(s) and contributor(s) and not of MDPI and/or the editor(s). MDPI and/or the editor(s) disclaim responsibility for any injury to people or property resulting from any ideas, methods, instructions or products referred to in the content.

