
Quality Index Approach for Analysis of Urban Green Infrastructure in Himalayan Cities


1
Spatial Analysis and Informatics Lab (SAIL), School of Environmental Sciences, Jawaharlal Nehru University, New Delhi 110067, India
2
UFZ—Helmholtz Centre for Environmental Research, Department of Urban and Environmental Sociology, 04318 Leipzig, Germany
3
Department of Urban Studies and Planning, University of Sheffield, Western Bank, Sheffield S10 2TN, UK
4
Special Centre for Disaster Research, Jawaharlal Nehru University, New Delhi 110067, India
*
Author to whom correspondence should be addressed.
Land 2023, 12(2), 279; https://doi.org/10.3390/land12020279
Submission received: 7 December 2022
/
Revised: 7 January 2023
/
Accepted: 9 January 2023
/
Published: 18 January 2023
(This article belongs to the Special Issue Recent Progress in Urbanisation Dynamics Research Ⅱ)
Abstract
:In fast urbanizing cities, fragmentation of urban green infrastructure (UGI) commonly arises due to lack of efficient planning to maintain the quantity and improve their quality. As ecological processes and landscape patterns are closely intertwined, it is a prerequisite to investigate landscape structure when aiming at better provision of ecosystem services. This study integrates remote sensing, geographic information system, combination of landscape metrics, and multi-variated statistics to delineate structural attributes influencing UGI Quality (UGIQ). We exemplify our methodology in three capital cities of Indian Himalayan states at administrative ward level. The UGIQ is derived by comparing landscape characters defined by nine metrics denoting area, shape, and aggregation attributes. By employing principal component analysis (PCA) and multi-collinearity diagnosis, a set of quality defining metrics are obtained for each city. Further, to gain insightful spatial basis for improving connectivity, Morphological Spatial Pattern Analysis (MSPA) is used to visualize and classify patches into seven morphological classes. Landscape characterization highlights a pattern of low-quality wards having a limited number and area of UGI patches in urban centers, and high-quality wards with complex and aggregated patches towards fringes. PCA identifies the positive influence of area (LPI, AREA_MN) and shape (LSI, FRAC_AM, CONTIG) metrics and negative influence of patch distance (ENN_MN) and fragmentation (PD) on UGIQ in different combinations across the cities. Higher shares of morphological core and edge classes are recognized for overall UGIQ improvement. The results provide quantitative measures to develop integrated spatial planning strategies.
1. Introduction
Urban Green Infrastructure (UGI) is recognized to contribute towards sustainable urban development by improving environmental quality [1] and providing a fair quality of life in cities [2,3]. These advantages are driven by a wide variety of multifunctional ecosystem services (ESs) that UGI provides, and its flexible incorporation in urban planning [4]. UGI is defined as strategically planned networks of green and blue spaces with focus on multifunctionality and connectivity between and among them to improve the delivery of a wide variety of ES [5,6,7]. In terms of land use planning, UGI is evaluated as spatio-ecological concept which can be utilized to reconnect habitats and plan new ones to improve the environmental quality of cities [8]. By doing so, the UGI approach incorporates the importance of ecosystem functions and linkages [9], and provides a scope to reverse habitat fragmentation [10]. As a planning tool, UGI provides a holistic solution for improving ES delivery by building a comprehensive association between ecological and social viewpoints [11] and thus aids ‘smart conservation’ [8].
The benefits of a planning tool such as UGI are underutilized in developing countries due to the lack of expertise and resources [12]. Rapid urbanization also adds extensive pressure on the capability of UGI in providing ES and acts as a strong driver to disrupt ecological functioning. Urban growth results in both fragmentation and reduction in UGI, which in turn negatively affects habitat connectivity [11] and the spatial urban structure [13]. This can lead to environmentally degraded spaces in the city [14]. In developing countries, fast urbanizing cities have limited UGI areas and restricted planning measures that can strategically improve their ES delivery. In these cities, the distribution of existing UGI is a combination of naturally remaining tree-clad areas and designed green spaces, without integrating an ecological and social cohesion perspective. Previous studies on UGI have largely focused on various aspects such as their distribution in different land uses [15], impacts of urbanization [16], accessibility and usage [11,17], and visual and amenity benefits [18]. However, beyond the measure of human perceived size and shape, we also need to consider the landscape characteristics and ecological processes affecting their quality.
An important factor to enhance ES delivery is to improve UGI quality (UGIQ). Due to the subjective nature and diverse urban development contexts of the UGIQ, it can be interpreted from different lenses [15] such as social-ecological, ecological, economic, and cultural services. In the present study, we consider the primary attributes that evaluate UGIQ from a landscape ecological perspective by focusing on their structural attributes such as size, shape, distance, relative positioning, and combination of other fractal geometric measures. Thus, the quality of UGI refers to a network of urban interconnection with natural settings, semi-natural patches, and green and blue spaces, which provide ESs that support human well-being and quality of life of its residents, and which are crucial for sustainable urban growth. Herein, a study of structural attributes plays an important role in examining changes in spatial patterns and interpreting their reciprocal effect on ecological functions [19,20]. As an innovative approach to quantify the quality of UGI, we combine landscape metrics (structural indices) and Morphological Spatial Pattern Analysis (MSPA) (morphological algorithm) to deepen the understanding of UGI. The structure of UGI is most effectively quantified with the use of landscape metrics, which delineates the structure through geometric and spatial properties of different mosaics of patches [21]. This also allows comparisons across different landscapes with the same set of metrics. However, additional tools such as MSPA are proven to deduce the structural links of UGI patches at a pixel level and thus provide enhanced classification and visualization required for implementing UGI planning measures in urban areas. This spatial basis is lacking in landscape metrics analysis [11,22]. Thus, we use the combined approach to gain advantages of both, and generate conveniently applicable planning indicators. This paper responds to the prominent loss of UGI in the Himalayan cities, and the lack of information on their status, by developing a novel two-step identification tool for prioritizing urban greening efforts in cities that often lack ecological reasoning. Thus, our study also aims at filling the significant knowledge gap about Himalayan cities with respect to UGI.
In the present study, we analyze landscape characteristics and morphological patterns of UGI, which conjointly provide a deeper understanding of their structure. This in turn highlights the key ecological processes that are more restricted in urban settings. As a study area, we selected three Himalayan capital cities of India, considering that (i) they are significantly functioning urban areas in the economic, socio-ecological, and cultural dimensions with a strong demand for efficient UGI planning and management strategies, and (ii) they can represent the different status of UGI due to varying topography and urbanization processes. Based on this, we hypothesize that limited quantity and restricted patterns of UGI in densely urbanized wards of these cities would lead to a reduced UGIQ, while expanding urban fringe wards would show differential patterns influenced by topographically conditioned land use. Along with computing UGIQ at the ward level, our objectives are: (a) to analyze variations in composition and configuration of UGI within each selected city and among them; (b) to assess spatial variations in UGIQ and their contributing landscape characteristics; and (c) to improve understanding of the landscape structures to foster urban planning by exploiting morphological patterns of UGI.
2. Materials and Methods
2.1. Study Area
Three main urban centers in the Western Himalayan region of India comprise the study area: Srinagar, Shimla, and Dehradun (Figure 1). Each of these cities is the most populous and urbanized in the respective states and is the hub for economic activities tourism, urban planning, and management, respectively. However, these cities differ in their altitude, topography, population number and density, and factors that steer urban growth (Table S1). The three cities are intensely developed urban landscapes, and population dynamics as well as related land use changes put diverse levels of pressure on UGI. We choose to elaborate the methodological concept in these diverse urbanized areas to allow further transferability in rapidly urbanizing cities of developing countries.
2.2. Mapping Satellite Images
To carry out a detailed Land Use Land Cover (LULC) classification of the study sites for the year 2019, we undertake a three-step method (Figure S1): (1) satellite image (Sentinel-2) processing and extraction of major classes; (2) image fusion and vegetation index-based extraction; (3) and image classification, post-classification analysis, and accuracy assessment. A detailed description of these steps is provided in Supplementary Section S1. These mapped (Figure 2) UGI classes (see Table S5 for city-specific classes) are further used to conduct landscape characterization.
2.3. Landscape Metrics Analysis
Since landscape metrics reflect the spatial heterogeneity and simultaneously imply the UGIQ, we undertook a site-specific landscape assessment of UGI and selected a set of nine class-level metrics (see Table S3 for measured attribute and description and Table S6 for formula and range). This selection is based on (1) the literature [23,24,25] and (2) compatibility of metrics to be used independent of the size. The selected metrics are proven to delineate the landscape characteristics of UGI in terms of composition and configuration by analyzing their size, shape, and aggregation [24]. These metrics synergistically help in translating spatial patterns to ecologically relevant processes such as fragmentation, proximity, and edge effect [26] which have a profound impact on UGIQ. The administrative wards of the three cities were used as the units for analysis in FRAGSTATS v.4.2.
2.4. Establishing the UGIQ Index
2.4.1. Selection of Metrics and Index Development
To identify the most important landscape metrics that contribute to the variation in UGIQ, we carried out a multivariate statistical analysis [15]. All the derived metrics values were standardized using a standard deviation model. SPSS v.27 was used to undertake the Principal Component Analysis (PCA). The Varimax rotation was employed to convert the selected metrics into a set of linear uncorrelated components in order to obtain the eigenvalue weights for each metric. All the components with an eigenvalue greater than 1 were retained. For each ward in each city w, the index was obtained by multiplying the weights (Ei) of each component by the loading values (li) of the corresponding standardized metrics (mi) (Equation (1)). Only loading values above 0.6 were selected [13,15].
2.4.2. Model Validation Using Collinearity Diagnosis and Final Index
In order to avoid high correlation and redundancy between the metrics and validate the selection of the core set of metrics, we carried out a stepwise regression with multicollinearity diagnosis. The model includes or removes independent variables at the respective steps based on their p-value. The selection of the core set of metrics for each city was based on a generally accepted value of 10 as a variance inflation factor (VIF) [13]. Based on this, metrics with VIF < 10 and valid loading value > 0.6 were selected for each city. Equation (1) was thus modified:
2.5. Morphological Analysis
The MSPA tool grounds on a morphological image processing at pixel level by applying mathematical morphology to carry out the spatial pattern analysis [27]. We conducted our analysis using the GuidosToolbox 2.9 (https://forest.jrc.ec.europa.eu (accessed on 21 September 2022)). On the basis of geometric arrangements and spatial patterns, MSPA was used to classify UGI into seven predefined mutually exclusive classes: core, edge, perforation, bridge, loop, branch, and islet (Table 1). To undertake this analysis, the produced LULC maps were converted into binary images: (1) the foreground includes all classes enclosing the UGI (Table S5); and (2) the background includes all the other classes. We performed MSPA at the ward level by batch clipping in ArcGIS 10.7, followed by batch processing in the MSPA toolbox. For this refined classification, we set three parameters according to the requirements of the analysis: (1) connectivity, i.e., foreground pixels were classified using eight-neighbor connectivity; (2) edge width of 1 was selected after testing to obtain a representative result, which determines the minimum size of core which increases with width; (3) transition, which allows the inclusion or exclusion of connecting elements (bridge and loop) to the core area. To retain important transition features near the core, we included transition pixels into the process.
To understand the significance of morphological spatial patterns on UGI quality, MSPA was applied at both the city level and ward level, i.e., a subset of wards selected according to high and low UGIQ obtained from the PCA analysis.
3. Results
3.1. Landscape Characteristics—Intracity and Intercity Gradients
Figure 3, Figure 4 and Figure 5 show the spatial patterns of UGI landscape characteristics at ward level for the three cities.
In Srinagar, the aggregation metrics PD showed the highest value among the southern and northern wards adjacent to the urban center, indicating increased fragmentation and heterogeneity. These wards also have a significantly smaller UGI area with a low AREA_MN and LPI value, correlating with the urbanized areas. While the city center wards have low PD values, but also a lower AREA_MN value, thus, highlighting the critical condition, i.e., small and limited UGI in the dense urban areas. Wards with the largest UGI patches are the ones covering Dal lake with very high AREA_MN and LPI and lower PD (ward 58 and 59), resulting mainly from the homogenous marshy vegetation. The majority of other wards with a high UGI cover and low fragmentation have a greater share of agroforestry (north) and human-maintained UGI such as golf course (northeast) with significantly low-density settlements. In terms of shape complexity, higher ED, LSI, and FRAC_AM values in the fringe wards indicate an increased complexity in the shape of UGI patches. This can be mainly attributed to the irregular shape of agroforestry patches and fragmented agricultural land, both interspersed with settlements and uncultivated land. In the urban center, limited availability of UGI (low AREA_MN) and regular shapes with lower shape complexity are observed due to greater human management in which parks and roadside vegetation are considered. This is also shown through lower FRAC_AM values which tend closer to 1 in the case of simpler shapes based on the perimeter–area relationship across varied patch sizes. CONTIG, which measures the spatial connectedness of patches depending on their shape, is found to be very high only in wards with higher connections. Wards with interconnected parks also have a higher value (such as ward 21 and 56), while those with higher LPI have lower values. The aggregation of patches is one of the most important characteristics to interpret fragmentation. MESH shows large-size aggregated patches in the north and northwest wards while the majority of built-up dominated wards have an effective mesh size of <39 ha (including some fringe wards with agriculture dominance). ENN_MN highlights high variation within cities. Higher patch isolation is observed in urbanized wards concentrated in and around the urban center, while most of the fringe wards have a comparatively shorter distance to the nearest UGI patch.
In Shimla, PD values indicate the highest number of isolated UGI patches in the main urban centers of the city, i.e., touristic (ward 12 and 13) and commercial wards (ward 16 and 19). Low AREA_MN and LPI values correlate with this pattern and emphasize the presence of small UGI with a high level of fragmentation among existing patches. The majority of the other wards have large intact UGI patches (mean patch size > 2.5 ha) resulting from limited urban expansion in unfavorable topography. In shape complexity, the existence of intact patches also leads to reduced ED and LSI in such wards with high LPI and AREA_MN values (ward 4, 5, 8, and 15). These wards with simpler shapes differ from urban center wards showing similarly low LSI and FRAC_AM values; however, having a higher ED value. This is due to higher fragmentation and intense human management resulting in simpler shapes but with more edges [15]. The spatial connectedness shows complex patterns across the wards. High CONTIG values are observed in some wards along with low LPI and AREA_MN, indicating the probable effect of topography in maintaining connections despite urban growth (ward 11, 12, and 14). The low MESH value reaffirms the lack of aggregated UGI patches in the highly urbanized urban center wards. The western wards of the city, in general, have a higher MESH (>54 ha) correlated with a lower fragmentation (low PD). ENN_MN distribution shows very low variations among all the wards, with most of the UGI patches in close proximity (<30 m).
In Dehradun, PD values are found the highest in isolated wards outside the urban center and in the southern ward with a sparse built-up space in a once agriculturally dominated area (ward 35), indicating high fragmentation. The urban center is majorly devoid of large UGI patches, and thus has a low PD. The northern wards, situated at the foothills have the least PD with high LPI and AREA_MN. Other wards with similar features are dominated by institutional green areas (large gardens, parks, and golf courses under the control of enclosed institutions) (ward 8 and 60) and forests (ward 30 and 51). The shape complexity of the urban center is observed to be lowest with low ED and LSI values, corresponding with low area metrics. The highest shape complexity (high ED, LSI, and FRAC_AM) is found in two sets, (1) northern wards with both natural entities (such as river bed, reserved forest, and foothill forest patches) and, (2) southern agriculture-dominated wards (but low mean patch area of agriculture patches lead to comparatively lower FRAC_AM owing to perimeter–area relationship). CONTIG values are higher in southern wards due to the development of new residential colonies, which convert out agricultural land with complex shapes but higher connectivity among them. Higher MESH values (>29 ha) with low PD indicate non-fragmented UGI patches are found in the northern and isolated western wards. Higher ENN_MN values in urban center wards highlight the farther distance between patches, indicating the least availability to residents.
The comparison of the three cities provides interesting insights into their landscape characteristics. As larger cities, Srinagar and Dehradun have similar UGI characteristics to some extent, but the former distributes better. Shimla is smaller, less urbanized, and holds a less fragmented proportion of UGI. The area metrics highlight that Srinagar and Dehradun are quite similar in their distribution and size, while Shimla has larger UGI patches (Figure 6). From low to high, the order of AREA_MN values are: Dehradun (~0.34 ha) < Srinagar (~0.88 ha) < Shimla (~3.5 ha). Similarly, the average LPI value of Shimla (57 ha) is significantly higher than in Srinagar (14 ha) and Dehradun (13 ha). Thus, the majority of the patches are small sized in larger cities. The shape complexity of these cities (with the dominance of agroforestry, agriculture, and remaining natural UGI patches in the fringes) differs from Shimla, where there is presence of large patches of UGI (intact forest area without human interventions). In all cities, the aggregation metrics have clear trends as this characteristic is directly influenced by the urbanization level. Dehradun has a higher PD (90/ha) compared with Srinagar (~51/ha), indicating a higher fragmentation. However, patch distance on average is lower in Dehradun (37 m) compared with Srinagar (41 m), while Shimla has the shortest distance (25 m) between patches overall.
3.2. Urban Green Infrastructure Quality
Tables S7–S9 show the multicollinearity statistics of the core set of metrics selected for Srinagar, Shimla, and Dehradun, respectively. Table 2 shows the principal components (PCs) selected for all the cities, with their Eigen values and individual and cumulative variance explained by the components. The loading values of the selected components for all the cities are shown in Table 3.
In Srinagar, PC1 and PC2 explained 80.90% of the total variation. PC1 (ED, LSI, FRAC_AM and ENN_MN) explained 50.19% of the data variance. Except for ENN_MN, all of them play positive roles and represent important factors for the shape complexity and patch distance. PC2 (PD, LPI and AREA_MN) explains 30.70% of the remaining variation. Both the area metrics influence UGIQ positively while PD has a negative influence and describes the effect of increased fragmentation in lowering quality.
In Shimla, PC1 and PC2 explained 84.60% of the variation. PC1 (accounting for 60.72% of variance) is represented by the positive influence of LPI, AREA_MN and the negative influence of ENN_MN and ED on UGIQ. This describes the role of large intact UGI in Shimla that dominates the city, having comparatively lower shape complexity and patch distance. PC2 (accounting for 23.88% of variance) is represented by the positive effect of FRAC_AM, describing the role of the perimeter–area ratio-based complexity of the patch shapes.
In Dehradun, PC1 and PC2 explained 83.49% of the variation. PC1 (accounting for 60.71% of variance) is represented by the positive influence of LPI, AREA_MN, and FRAC_AM. This describes the important role of large UGI with higher shape complexity in UGIQ of the city. PC2 (accounting for 22.78% of variance) is represented by the positive effect of LSI and CONTIG which indicates the further role of shape and connectivity originating from the shape of the patches.
Figure 7 and Figure 8 show the distribution of UGIQ across the cities. In each city, the variation in UGIQ categories (Table 4) is dependent on the derived valid metrics and based on the dominant landscape characteristics. In all cities, high UGIQ wards are concentrated in the fringe wards with different levels of agroforestry, forest patches (mostly in Shimla), and agriculture. Medium- and low-quality wards are concentrated in the urban core and adjoining areas which are rapidly urbanizing.
3.3. Morphological Spatial Pattern Analysis (MSPA)
3.3.1. City-Level Analysis
The spatial variation in the identified structural classes in each city along with their percentage distribution is shown in Figure 9. The dominance of the core class is observed in all the cities. However, in comparison to the larger two cities, Shimla shows a higher core class coverage (75.07%). This can be attributed to the presence of intact reserved and protected forest areas in this city. However, perforation class, which exists within UGI core is also higher (7.71%) in Shimla, mostly in proximity to the central part of the city. Due to the presence of large wetlands and agricultural land within the city, Srinagar has a comparatively higher (64.46%) core class UGI compared with Dehradun (48.01%). Next to the core class, the most contributing is the edge class in all the cities. Dehradun has the highest edge class percentage (27.43%) attributed to the mix of sparse built-up growth in agriculture-dominated land in the south, which offers higher interaction with GI. However, this does not ensure higher interaction in the future considering predicted agricultural land loss [28]. In Srinagar, islet class is prominently seen in the southern fringe, mostly in areas interspersed with sparse built-up land. While in the case of Dehradun, this class is found throughout the city and indicates high fragmentation.
3.3.2. Ward-Level Analysis
To gain finer spatial information on the distribution of UGI in the three cities through MSPA, five wards were selected each for low and high quality. Figure 10 and Figure 11 show the percentage distribution and spatial variation in the seven classes, respectively. In all the cities, low UGIQ wards are predictably dominated by built-up land. In these wards, UGI forms <5% and <4% of the total ward area in Srinagar and Dehradun, respectively; however in the case of Shimla, it is between 20 and 46%. Thus, even low UGIQ wards in Shimla hold a better UGI in terms of absolute land cover. Regarding the classes of the available UGI area, most of the wards in Srinagar and Dehradun are characterized by a very poor core class coverage and are dominated by either islet (out of the selected 5 wards, 2 wards in Srinagar and 3 wards in Dehradun have 100% islet class cover) or edge class. This indicates the fragmentation into smaller patches and increased transition between vegetated and non-vegetated areas. However, in the case of Shimla, a significant percentage of UGI is composed of the core and edge classes (average 31%). This is followed by the branch class (average 17%). The bridge and loop classes are very limited in all the cities, while the perforation class is absent in all cities due to the low coverage of the core class. The spatial basis provided by Figure 10 allows for strategic intervention on the ground depending on the nearest class type, for example, increasing connectivity between core and branch class or increasing area of the islet class in these low-quality wards.
In high UGIQ wards, the percentage of areas covered by UGI varies greatly (ranging between 49–93% in Srinagar, 52–67% in Dehradun, and 79–92% in Shimla). The results in Figure 10 show that the high percentage of core areas (Shimla > Srinagar > Dehradun) substantially contribute to their respective UGIQ. What is important is the predominance of core followed by edge class, which is a good evidence of high quality UGI, as the combination of these two classes ensures higher interaction with large natural patches. The perforation class is higher in the case of Srinagar and Shimla followed by the branch. In Dehradun, the branch class has a higher contribution followed by equal contributions of the islet and bridge classes. Loop is the least contributing class in all cities.
4. Discussion
In an urban area, the prevailing land use is mostly the result of human activities which consequently play an important role in shaping the urban structure and development. By doing so, they influence the resulting spatial patterns of UGI. Similar to natural processes, the dynamics of human activities shape the secondary landscape structure resulting the urban landscape to be composed of mosaic patterns of natural and anthropogenic elements, yet constrained by the primary landscape structure (naturally prevailing conditions such as topology, soil, vegetation composition, etc.) [29].
4.1. UGI and Management Strategies
In the highly urbanized cities of Srinagar and Dehradun, the landscape patterns follow the general urbanization trend of dense urban center and radiating outward urban growth. This essentially leads to a parallel trend of smaller, simpler, and fragmented UGI patches in the center, and larger, complex, and aggregated patches towards the fringes. This is a clear indication that larger cities did not accommodate UGI in their urban planning of the central wards and are far from fulfilling the ecological quality. Similar trends are also reported in other Asian cities such as Hong Kong, where highly compact areas of the city observed high PD and low AREA_MN and LPI values [15]. Fast growing cities such as Singapore have also reported likely spatial patterns with smaller, fragmented, and complex-shaped green spaces with increasing urbanization [30]. Liu et al., [31] carried out an empirical evaluation of 16 cities around the world to understand the relationship between habitat fragmentation and landscape metrics. Correlating the changes in metrics such as PD, AREA_MN, ED, LSI, and ENN_MN, our results also point toward the observed habitat loss in urbanizing landscapes.
Srinagar, the largest city in the study area, has a high degree of fragmentation due to a number of isolated parks across the city [32]. This demands well-planned measures to increase the connectivity of these existing parks. This benefits residents and improves ecological connectivity for biodiversity and ES provisions simultaneously [33]. In the fringe, considerable agricultural land (combined with agroforestry) adds to sufficient UGI area and shape complexity. As the increased complexity is due to human-managed UGI categories, this also indicates towards an interspersed built-up area that in future has potential to reduce UGI. Thus, new policies should carefully restrict built-up growth that may lead to discontinuity in UGI. The presence of wetland and associated marshy vegetation plays an important role in low fragmentation levels and enhanced UGIQ across a large area adjacent to the center. Dehradun, situated on the foothills, has a combination of highly urbanized, agriculturally dominated, and institutional areas. Considering their landscape characteristics, different urban management strategies would be required to improve their UGIQ. Urban center wards have critically low levels of UGI and planting on available lands such as roadsides and public open spaces are recommended, but this is in general considered a difficult option in low-income neighborhoods [4]. The wards with expanding built-up areas on agricultural land (in south) do not have provisions for UGI other than currently surrounded agricultural patches. Future growth is expected to overtake such land [28] and thus lead to critically low UGI. Thus, large-scale planning that considers future growth is necessary and urgent to conserve the quality of UGI. Being a smaller city situated in a terrain with considerable challenges for urban expansion, Shimla has a different urbanization pattern and shows better UGI patch characteristics. Urban growth here is not continuous and thus only concentrated on the major tourism and commercial centers of the city. UGI patches need current levels of protection in the future to maintain the status quo. Thus, in all the cities, to realize the full potential of the UGI concept, it is beneficial to focus on improving connectivity, maintaining larger core areas [17] and allowing growth in natural shapes that provide protection [34].
4.2. Landscape Characteristics and Its Ecological Effects
Ecological stability of UGI and the urban ES provided for human well-being are highly dependent on the composition and configuration of the UGI [35]. The physical structures of the UGI patches are known to influence ecological processes, which in turn, shape the landscape structure by influencing the primary productivity, flow of energy, nutrient and material cycling, biodiversity distribution, etc. [36]. In terms of biodiversity distribution and habitat quality, the shape, size, and connectivity of patches play differential roles for a wide variety of organisms [21]. In this study, fragmentation and the smaller size of patches stand out as an easily identified consequences of urban growth and sprawl. Area metrics are known to contribute to the survivability of species and larger size helps maintain higher species richness and relative abundance [37]. Furthermore, large-size patches also offer morphological cores [11] which provide higher resilience to external disturbances [16]. The limited patch size of UGI, especially in the urban center also exposes species to a contrasting urban environment [26]. The edge and shape of the patches have important ecological significance as they have implications on the interaction of species with the outside “matrix” according to the patch matrix corridor model on which landscape metrics are based. Increased complexity and edges of patches allow better stability in the interiors for some species; however, such fragmented patches can also increase the spread of invasive species and predation [38]. Proximity and connectedness of patches to a natural area can help in improving biodiversity [39] and its recreational value [18]. Lower ENN_MN values in wards closer to the urban fringe is beneficial. A key concept that summarizes most of the above ecological effects is fragmentation. In the studied larger cities, fragmentation is severe and indicates poor habitat quality [25] and resulting ES. Priorities in landscape planning should be provided to wards with very high PD and ENN_MN values. The present study proposes and relies on the land metrics wherein landscape mosaic is the primary paradigm of landscape analysis. However, newer research recommends landscape configurational entropy (commonly known as Boltzmann entropy) to analyze the entropy of landscape gradients [40,41,42]. Similarly, the entropy weights method (EWM) is commonly used in decision making including the assessment of the sustainability of cities [43]. Such information-weighting methods in decision making need a higher degree of care for reporting and correct calculations in such studies [44].
4.3. Role of Morphological Analysis
MSPA enhances our understanding of UGI in intuitive structural classes. While landscape metrics are more quantifiable in nature, MSPA provides a spatial basis for understanding the role of connectivity (Figure 10). It is proven to be efficient in assessing the connectivity of UGI which is one of the most recognized UGI planning principles [6,7]. A detailed analysis of each ward can highlight areas that should be prioritized for connectivity by local authorities. Morphological patterns can also help in optimizing scarce land availability and facilitate UGI uses such as roadside plantations, parks, and water to improve the connectivity of UGI.
In the present study, the lack of core class in low UGIQ wards highlights the deprived state of urban center wards. The presence of UGI core class has a significant effect on reducing the occurrence of the urban heat island phenomenon [45] and improving biodiversity [46]. This class contributes to all types of ES provisions, both in urban and agriculturally dominated areas [27]. Compared with a single value of AREA_MN for a ward, MSPA classes are spatially identifiable as demonstrated in the Section 3.3, thus providing the spatially explicit information for increasing the protection status of any existing core patches. The highest priority should be provided to convert islet classes into core regions by increasing their area, followed by increasing the connectivity between core classes through bridge class. This class also provides simultaneous benefits to residents who are at a further distance from the UGI core [11] toward a fair quality of life.
5. Conclusions
This study analyzed the landscape characteristics and morphological attributes of UGI in three Himalayan cities and highlighted the important role played by their structural features. In each city, being mountainous urban landscapes, a combination of (1) land use planning measures (mostly in the urban center), (2) human-caused landscape heterogeneity of UGI patches resulting from unplanned urbanization (mostly in the urban fringe), and (3) topographic characteristics are observed to influence the UGI attributes. Although these three factors are shared across the cities, specific differences in the urbanization level and topography have resulted in varied UGI characteristics and thus highlight the need for strategic intervention in each city.
By conducting a landscape characterization analysis at the ward level, a clear distinction can be seen in the structural features of UGI in urban centers and fringe wards, highlighting the role of urbanization, implemented land use policy, and topography. This is in tune with our stated hypothesis. We were able to identify a combination of structural components unique to each city that influence the quality of UGI. In larger cities, better UGIQ are observed in fringes with higher complexity of patches that are interspersed with built-up areas, whereas in the case of Shimla, this is observed in areas with intact patches of forest with the least population pressure. As a significant result, we identified three categories of UGIQ classes, which require site-specific planning approaches in Himalayan cities. In addition, a morphological analysis provides a spatial base for identifying weaker structural features of any selected landscape and thus contributes to efficient urban planning. This study is expected to generate an ecological viewpoint on urban planning in developing countries, where the UGI concept is not yet absorbed. Future studies should delineate an understanding of the structure–function relationship of UGI to better understand interlinkages between ecological processes and landscape patterns.
Supplementary Materials
The following supporting information can be downloaded at: https://www.mdpi.com/article/10.3390/land12020279/s1, Figure S1 Image classification methodology flow diagram. Table S1 Description of the selected cities. Table S2 Details of satellite data used. Table S3 Selected landscape metrics and their description after McGarial and Marks, 1995; McGarigal, 2015. For formula and range, see Supplementary Table S4. Table S4 Details of Sentinel-2 bands used in the study (European Space Agency, 2015). Table S5 LULC classes of each city and their respective accuracy assessment (producer’s and user’s accuracy in %), overall accuracy (in %) and kappa coefficient. Table S6 Details of landscape metrics selected in the study, after McGarigal and Marks, 1995; McGarigal, 2015. Table S7 Stepwise regression with multicollinearity test for Srinagar. UGIQ is the dependent variable. Table S8 Stepwise regression with multicollinearity test for Shimla. UGIQ is the dependent variable. Table S9 Stepwise regression with multicollinearity test for Dehradun. UGIQ is the dependent variable.
Author Contributions
Conceptualization, M.M.A., E.B. and P.K.J.; methodology, M.M.A. and E.B. software, M.M.A.; validation, M.M.A.; formal analysis, M.M.A. and J.W.; investigation, M.M.A. and J.W.; resources, E.B.; data curation, M.M.A.; writing—original draft preparation, M.M.A.; writing—review and editing, M.M.A., E.B., J.W. and P.K.J.; visualization, M.M.A. and J.W.; supervision, E.B. and P.K.J.; project administration, E.B. and P.K.J. All authors have read and agreed to the published version of the manuscript.
Funding
This research was funded by the Deutscher Akademischer Austauschdienst (DAAD), Germany, and the Senior Research Fellowship (SRF), University Grants Commission (UGC), India.
Data Availability Statement
The data presented in this study are available on request from the corresponding author. The data are not publicly available due to privacy reasons.
Acknowledgments
M.M.A. would like to express his gratitude for the research support from University Grants Commission (UGC) for Senior Research Fellowship (SRF) and DAAD (Deutscher Akademischer Austauschdienst). P.K.J. is thankful to the Department of Science and Technology—Promotion at University Research and Scientific Excellence (DST-PURSE) of Jawaharlal Nehru University (JNU), New Delhi for research support.
Conflicts of Interest
The authors declare no conflict of interest.
References
- Larondelle, N.; Haase, D.; Kabisch, N. Mapping the diversity of regulating ecosystem services in European cities. Glob. Environ. Chang. 2014, 26, 119–129. [Google Scholar] [CrossRef]
- Banzhaf, E.; Reyes-Paecke, S.M.; De La Barrera, F. What Really Matters in Green Infrastructure for the Urban Quality of Life? Santiago de Chile as a Showcase City Ellen. In Urban Transformations—Sustainable Urban Development through Resource Effciency, Quality of Life and Resilience; Springer: Berlin/Heidelberg, Germany, 2018; Volume 203, p. 402. [Google Scholar] [CrossRef]
- Kabisch, N.; Haase, D. Green justice or just green? Provision of urban green spaces in Berlin, Germany. Landsc. Urban Plan. 2014, 122, 129–139. [Google Scholar] [CrossRef]
- De La Barrera, F.; Henríquez, C. Vegetation cover change in growing urban agglomerations in Chile. Ecol. Indic. 2017, 81, 265–273. [Google Scholar] [CrossRef]
- Naumann, S.; Rayment, M.; Nolan, P.; Forest, T.M.; Gill, S.; Infrastructure, G.; Forest, M. Design, Implementation and Cost Elements of Green Infrastructure Projects; Final report to the European Commission, DG Environment, Contract no. 070307/2010/577182/ETU/F.1; Ecologic Institute and GHK Consulting: Brussels, Belgium, 2011. [Google Scholar]
- Pauleit, S.; Ambrose-Oji, B.; Andersson, E.; Anton, B.; Buijs, A.; Haase, D.; Elands, B.; Hansen, R.; Kowarik, I.; Kronenberg, J.; et al. Advancing urban green infrastructure in Europe: Outcomes and reflections from the GREEN SURGE project. Urban For. Urban Green. 2019, 40, 4–16. [Google Scholar] [CrossRef]
- Wang, K.; Li, Z.; Zhang, J.; Wu, X.; Jia, M.; Wu, L. Built-up land expansion and its impacts on optimizing green infrastructure networks in a resource-dependent city. Sustain. Cities Soc. 2020, 55, 102026. [Google Scholar] [CrossRef]
- EEA. Spatial Analysis of Green Infrastructure in Europe; EEA Technical Report; Eurpean Environmenatal Agency: Copenhagen, Denmark, 2014. [Google Scholar] [CrossRef]
- Tzoulas, K.; Korpela, K.; Venn, S.; Yli-Pelkonen, V.; Kaźmierczak, A.; Niemela, J.; James, P. Promoting ecosystem and human health in urban areas using Green Infrastructure: A literature review. Landsc. Urban Plan. 2007, 81, 167–178. [Google Scholar] [CrossRef] [Green Version]
- Lafortezza, R.; Davies, C.; Sanesi, G.; Konijnendijk, C.C. Green infrastructure as a tool to support spatial planning in European urban regions. iForest 2013, 6, 102–108. [Google Scholar] [CrossRef] [Green Version]
- Wang, J.; Xu, C.; Pauleit, S.; Kindler, A.; Banzhaf, E. Spatial patterns of urban green infrastructure for equity: A novel exploration. J. Clean. Prod. 2019, 238, 117858. [Google Scholar] [CrossRef]
- Mabon, L.; Shih, W.Y. Urban greenspace as a climate change adaptation strategy for subtropical Asian cities: A comparative study across cities in three countries. Glob. Environ. Chang. 2021, 68, 102248. [Google Scholar] [CrossRef]
- Tian, Y.; Jim, C.Y.; Tao, Y.; Shi, T. Landscape ecological assessment of green space fragmentation in Hong Kong. Urban For. Urban Green. 2011, 10, 79–86. [Google Scholar] [CrossRef]
- Banzhaf, E.; Reyes-Paecke, S.; Müller, A.; Kindler, A. Do demographic and land-use changes contrast urban and suburban dynamics? A sophisticated reflection on Santiago de Chile. Habitat Int. 2013, 39, 179–191. [Google Scholar] [CrossRef]
- Tian, Y.; Jim, C.Y.; Wang, H. Assessing the landscape and ecological quality of urban green spaces in a compact city. Landsc. Urban Plan. 2014, 121, 97–108. [Google Scholar] [CrossRef]
- Chan, K.M.; Vu, T.T. A landscape ecological perspective of the impacts of urbanization on urban green spaces in the Klang Valley. Appl. Geogr. 2017, 85, 89–100. [Google Scholar] [CrossRef]
- Wang, J. Urban Green Infrastructure Planning: Multifunctional Networks for Sustainable Urban Development; Technical University of Munich: Munich, Germany, 2020. [Google Scholar]
- Collins, R.M.; Spake, R.; Brown, K.A.; Ogutu, B.O.; Smith, D.; Eigenbrod, F. A systematic map of research exploring the effect of greenspace on mental health. Landsc. Urban Plan. 2020, 201, 103823. [Google Scholar] [CrossRef]
- Picketts, S.T.A.; Cadenasso, M.L. Landscape ecology: Spatial heterogeneity in ecological systems. Science 1995, 269, 331–334. [Google Scholar] [CrossRef]
- Wu, J. Landscape Ecology. In Ecological Systems. Selected Entries from the Encyclopedia of Sustainability Science and Technology; Springer: New York, NY, USA, 2013; pp. 272–273. [Google Scholar] [CrossRef]
- Uuemaa, E.; Mander, Ü.; Marja, R. Trends in the use of landscape spatial metrics as landscape indicators: A review. Ecol. Indic. 2013, 28, 100–106. [Google Scholar] [CrossRef]
- Wang, J.; Banzhaf, E. Derive an understanding of Green Infrastructure for the quality of life in cities by means of integrated RS mapping tools. In Proceedings of the 2017 Joint Urban Remote Sensing Event (JURSE), Dubai, United Arab Emirates, 6–8 March 2017; pp. 1–4. [Google Scholar] [CrossRef]
- Botequilha Leitão, A.; Ahern, J. Applying landscape ecological concepts and metrics in sustainable landscape planning. Landsc. Urban Plan. 2002, 59, 65–93. [Google Scholar] [CrossRef]
- Triantakonstantis, D.; Stathakis, D. Examining urban sprawl in Europe using spatial metrics. Geocarto Int. 2015, 30, 1092–1112. [Google Scholar] [CrossRef]
- Wang, X.; Blanchet, F.G.; Koper, N. Measuring habitat fragmentation: An evaluation of landscape pattern metrics. Methods Ecol. Evol. 2014, 5, 634–646. [Google Scholar] [CrossRef]
- Haas, J.; Furberg, D.; Ban, Y. Satellite monitoring of urbanization and environmental impacts—A comparison of Stockholm and Shanghai. Int. J. Appl. Earth Obs. Geoinf. 2015, 38, 138–149. [Google Scholar] [CrossRef]
- Vogt, P.; Riitters, K.H.; Estreguil, C.; Kozak, J.; Wade, T.G.; Wickham, J.D. Mapping spatial patterns with morphological image processing. Landsc. Ecol. 2007, 22, 171–177. [Google Scholar] [CrossRef]
- MDDA (Mussoorie Dehradun Development Authority). Zonal Development Plan; MDDA: Dehradun, India, 2015. [Google Scholar]
- Lausch, A.; Blaschke, T.; Haase, D.; Herzog, F.; Syrbe, R.U.; Tischendorf, L.; Walz, U. Understanding and quantifying landscape structure—A review on relevant process characteristics, data models and landscape metrics. Ecol. Model. 2015, 295, 31–41. [Google Scholar] [CrossRef]
- Masoudi, M.; Tan, P.Y. Multi-year comparison of the effects of spatial pattern of urban green spaces on urban land surface temperature. Landsc. Urban Plan. 2019, 184, 44–58. [Google Scholar] [CrossRef]
- Liu, Z.; He, C.; Wu, J. The relationship between habitat loss and fragmentation during urbanization: An empirical evaluation from 16 World Cities. PLoS ONE 2016, 11, e0154613. [Google Scholar] [CrossRef] [PubMed] [Green Version]
- Anees, M.M.; Mann, D.; Sharma, M.; Banzhaf, E.; Joshi, P.K. Assessment of urban dynamics to understand spatiotemporal differentiation at various scales using remote sensing and geospatial tools. Remote Sens. 2020, 12, 1306. [Google Scholar] [CrossRef] [Green Version]
- Rusche, K.; Reimer, M.; Stichmann, R. Mapping and assessing green infrastructure connectivity in European city regions. Sustainability 2019, 11, 1819. [Google Scholar] [CrossRef]
- Schewenius, M.; McPhearson, T.; Elmqvist, T. Opportunities for increasing resilience and sustainability of urban social-ecological systems: Insights from the URBES and the cities and biodiversity outlook projects. Ambio 2014, 43, 434–444. [Google Scholar] [CrossRef] [PubMed] [Green Version]
- Grafius, D.R.; Corstanje, R.; Harris, J.A. Linking ecosystem services, urban form and green space configuration using multivariate landscape metric analysis. Landsc. Ecol. 2018, 33, 557–573. [Google Scholar] [CrossRef] [Green Version]
- Alberti, M. The Effects of Urban Patterns on Ecosystem Function. Int. Reg. Sci. Rev. 2005, 28, 168–192. [Google Scholar] [CrossRef]
- Chase, J.M.; Blowes, S.A.; Knight, T.M.; Gerstner, K.; May, F. Ecosystem decay exacerbates biodiversity loss with habitat loss. Nature 2020, 584, 238–243. [Google Scholar] [CrossRef]
- McWilliams, C.; Lurgi, M.; Montoya, J.M.; Sauve, A.; Montoya, D. The stability of multitrophic communities under habitat loss. Nat. Commun. 2019, 10, 2322. [Google Scholar] [CrossRef] [PubMed] [Green Version]
- McGarigal, K. FRAGSTATS Help; University of Massachusetts: Amherst, MA, USA, 2015. [Google Scholar] [CrossRef]
- Gao, P.; Zhang, H.; Li, Z. A Hierarchy-Based Solution to Calculate the Configurational Entropy of Landscape Gradients. Landsc. Ecol. 2017, 32, 1133–1146. [Google Scholar] [CrossRef]
- Gao, P.; Zhang, H.; Li, Z. An efficient analytical method for computing the Boltzmann entropy of a landscape gradient. Trans. GIS 2018, 22, 1046–1063. [Google Scholar] [CrossRef]
- Nowosad, J.; Gao, P. belg: A Tool for Calculating Boltzmann Entropy of Landscape Gradients. Entropy 2020, 22, 937. [Google Scholar] [CrossRef]
- Shen, L.Y.; Zhou, J.Y.; Skitmore, M.; Xia, B. Application of hybrid entropy-McKinsey Matrix method in evaluating sustainable urbanization: A China case study. Cities 2015, 42, 186–194. [Google Scholar] [CrossRef]
- Gao, P.; Wang, X.; Want, H.; Cheng, C. Viewpoint: A correction to the entropy weight coefficient method by Shen et al. for accessing urban sustainability. Cities 2020, 103, 102742. [Google Scholar] [CrossRef]
- Gunawardena, K.R.; Wells, M.J.; Kershaw, T. Utilising green and bluespace to mitigate urban heat island intensity. Sci. Total Environ. 2017, 584–585, 1040–1055. [Google Scholar] [CrossRef]
- Connop, S.; Vandergert, P.; Eisenberg, B.; Collier, M.J.; Nash, C.; Clough, J.; Newport, D. Renaturing cities using a regionally-focused biodiversity-led multifunctional benefits approach to urban green infrastructure. Environ. Sci. Policy 2016, 62, 99–111. [Google Scholar] [CrossRef]
Figure 1.
Location of capital cities of states in Indian Himalaya. The inset provides the ward boundary of these cities.
Figure 1.
Location of capital cities of states in Indian Himalaya. The inset provides the ward boundary of these cities.

Figure 2.
Distribution of UGI in three cities.

Figure 3.
Spatial variation in landscape metrics by wards in Srinagar.
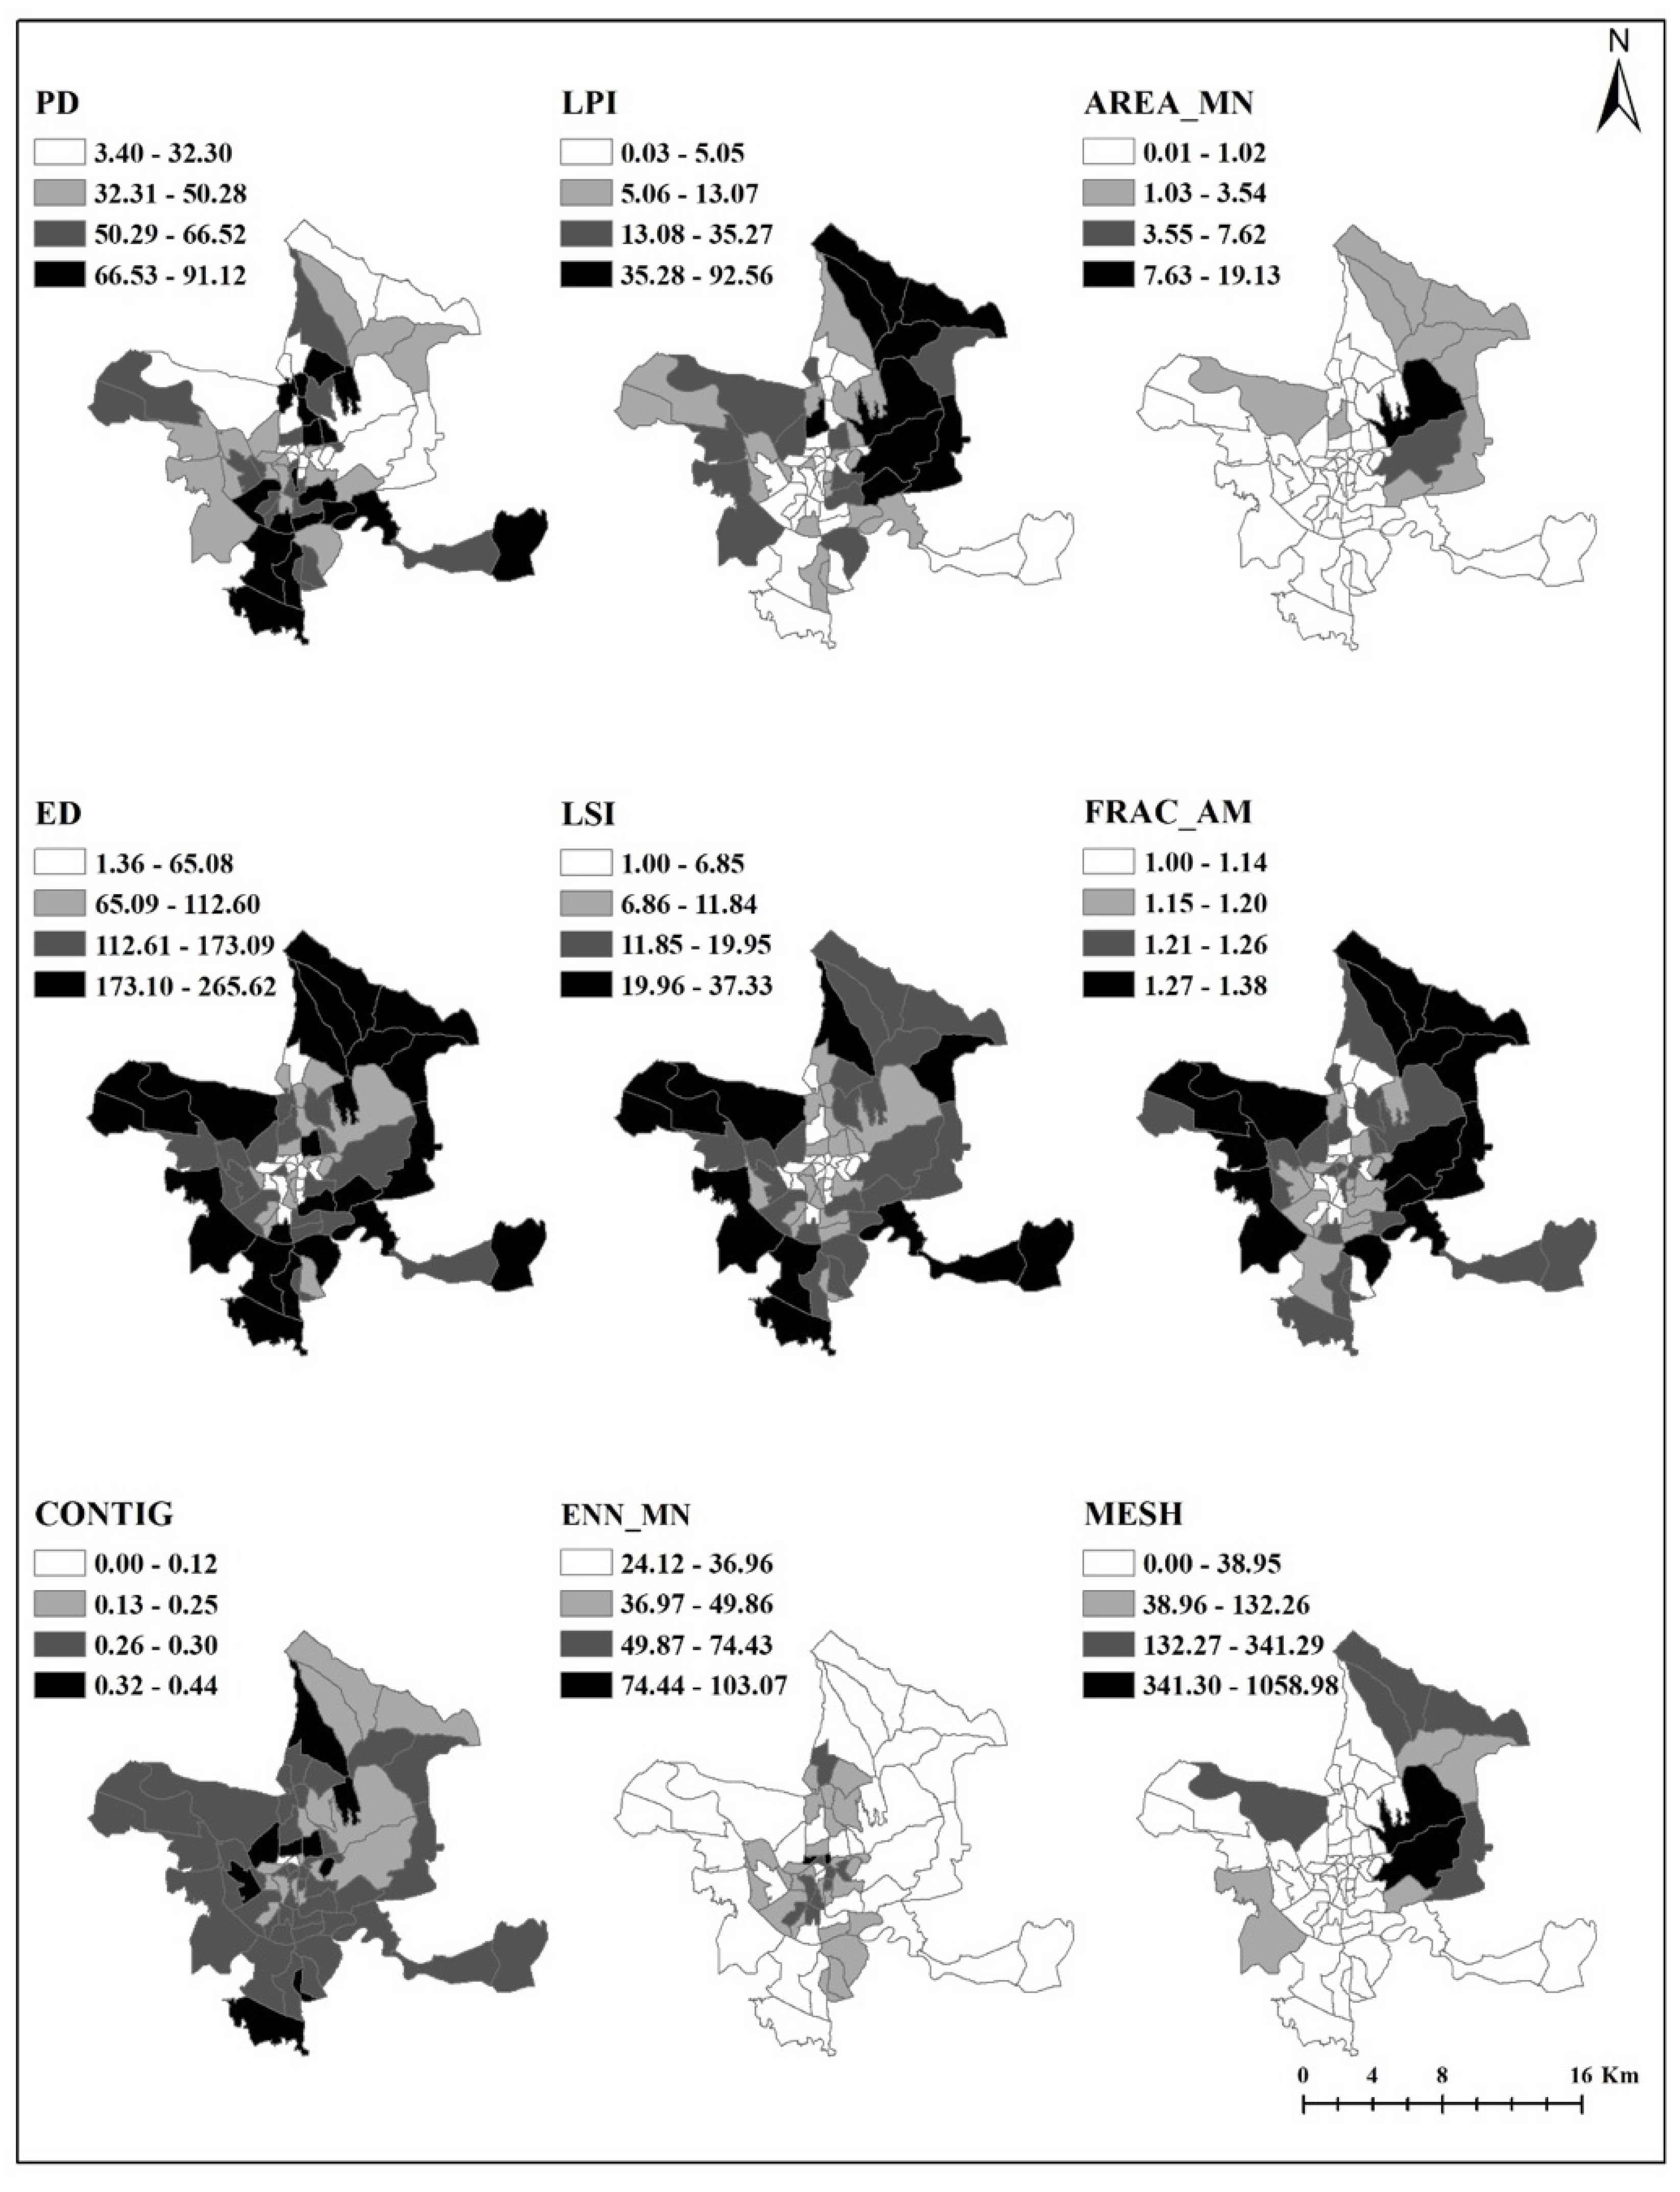
Figure 4.
Spatial variation in landscape metrics by wards in Shimla.

Figure 5.
Spatial variation in landscape metrics by wards in Dehradun.

Figure 6.
Boxplot showing the variation in landscape metrics among the three cities.

Figure 7.
UGIQ variation at ward level in three cities.
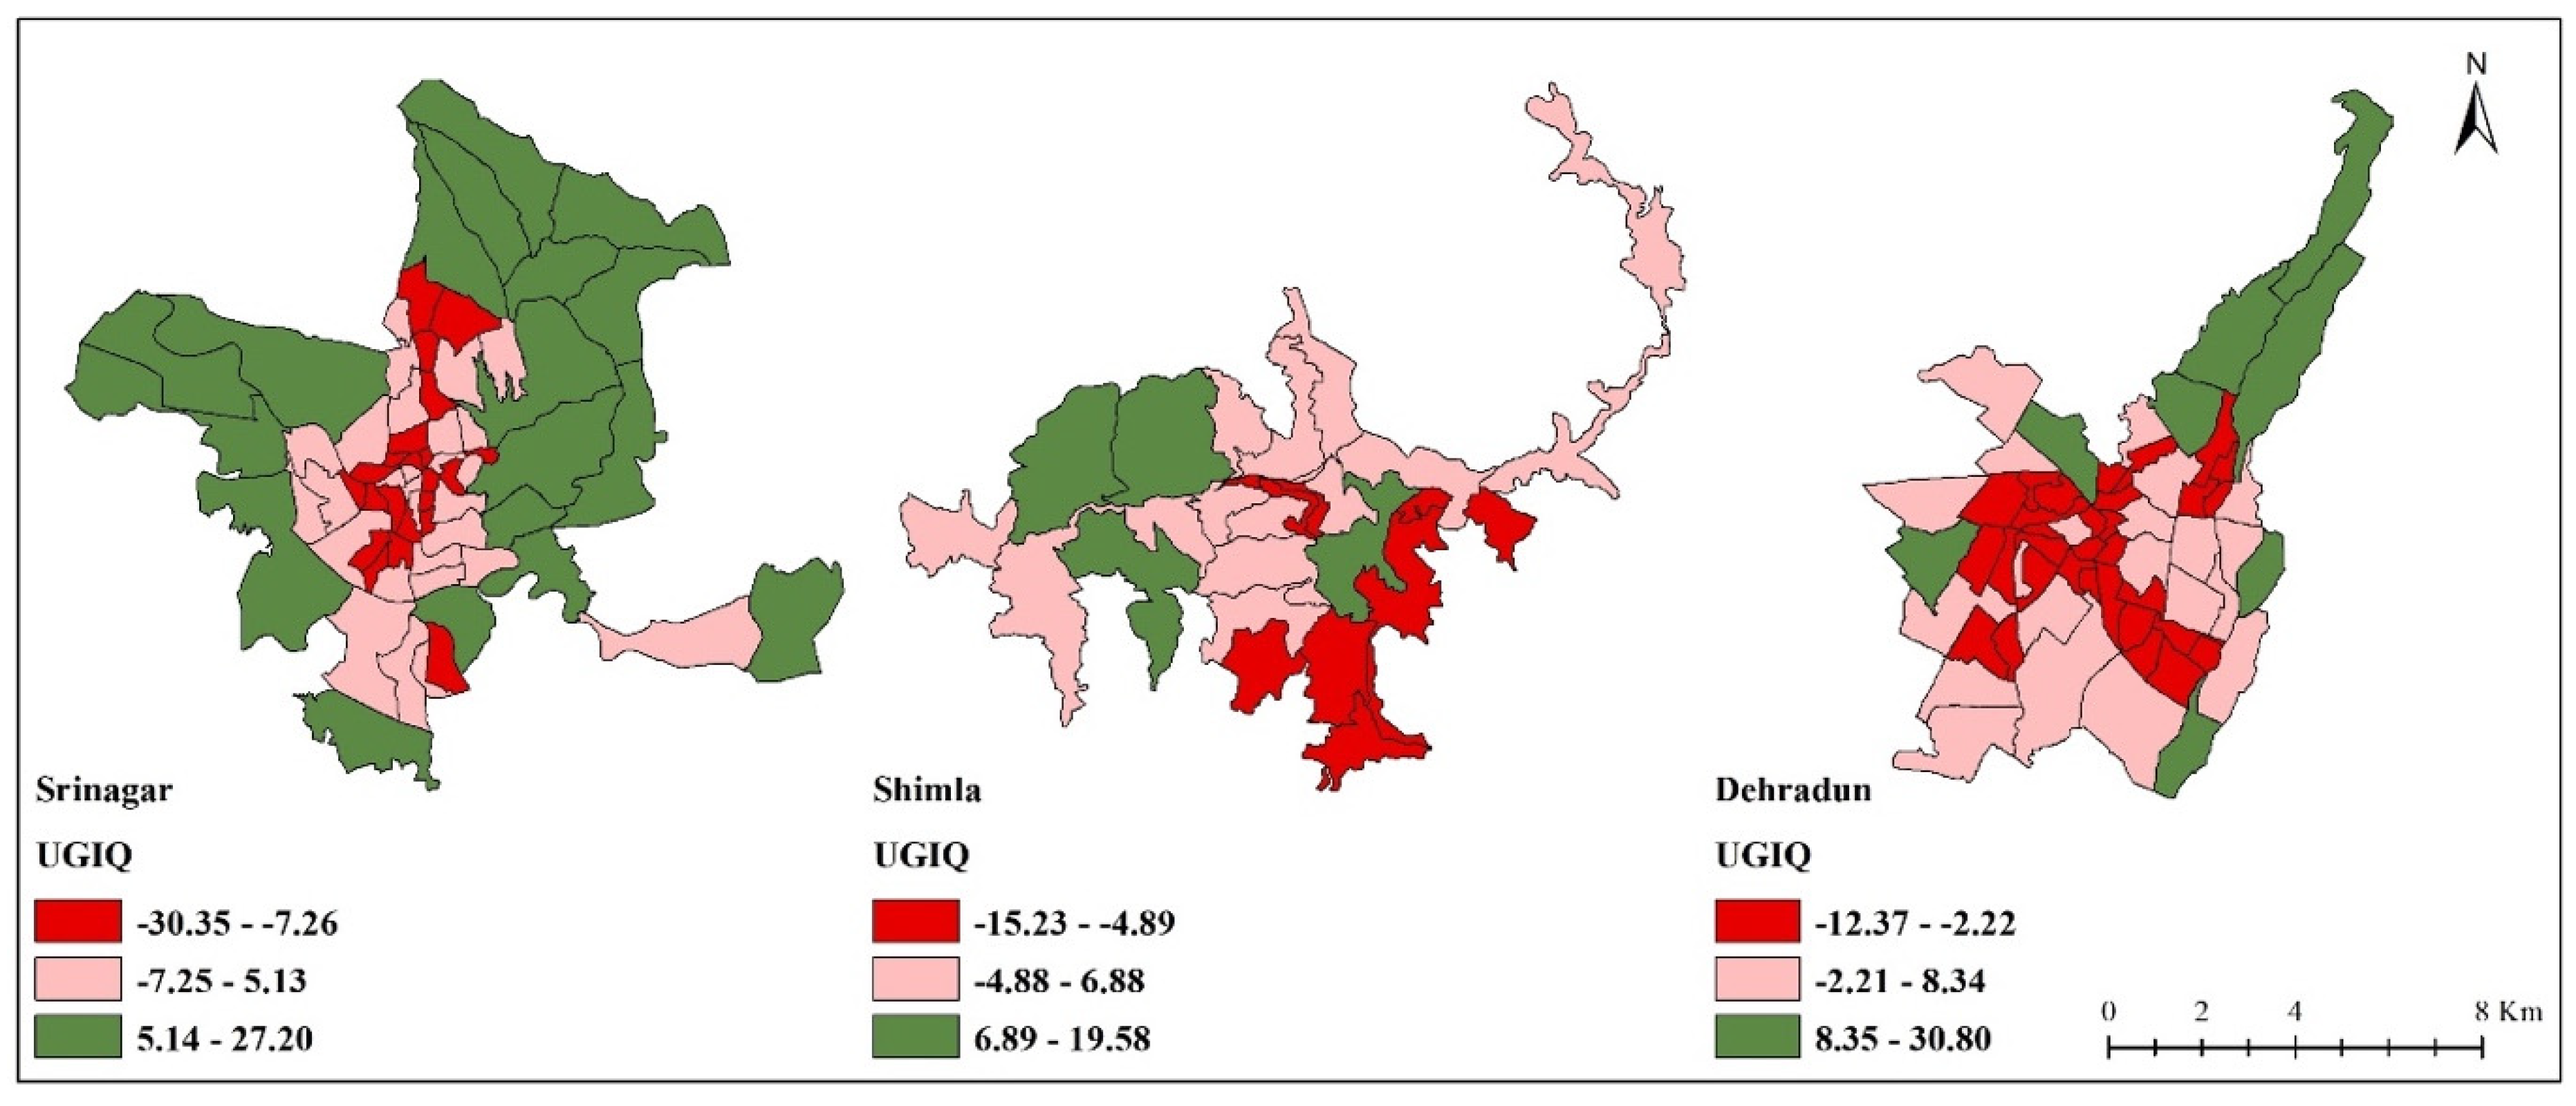
Figure 8.
UGIQ variation and distribution of UGI according to ward number in three cities.

Figure 9.
Spatial distribution of MSPA classes for (a) Dehradun, (b) Srinagar, and (c) Shimla and (d) their percentage distribution.
Figure 9.
Spatial distribution of MSPA classes for (a) Dehradun, (b) Srinagar, and (c) Shimla and (d) their percentage distribution.

Figure 10.
Distribution of MSPA classes in selected wards (low and high quality) in the three cities.
Figure 10.
Distribution of MSPA classes in selected wards (low and high quality) in the three cities.

Figure 11.
Spatial variation in MSPA classes in selected low and high UGIQ wards of the three cities.
Figure 11.
Spatial variation in MSPA classes in selected low and high UGIQ wards of the three cities.


Table 1.
Definition of morphological spatial patterns (source: Wang et al. [11,17]; adapted from Vogt [27]).
| MSPA Classes | Definitions |
|---|---|
| Core | GI surrounded by all sides (8-connectivity) by GI |
| Bridge | GI that connects two or more disjunctive areas of GI cores |
| Loop | GI that connects an area of GI core to itself |
| Branch | GI that extends from one area of core, but does not connect to another area of core |
| Perforation | Transition zone between GI and gray infrastructure areas for the interior regions of GI and has the shape of a doughnut in which a group of GI types are shaped by perforations (inner edges) |
| Edge | Transition zone between GI and gray infrastructure (built-up types) |
| Islet | Unconnected class without core |
Table 2.
PCA with Varimax rotation shows the amount of variance explained by principal components (PC) with above 1 Eigen value (in bold) for the three cities.
Table 2.
PCA with Varimax rotation shows the amount of variance explained by principal components (PC) with above 1 Eigen value (in bold) for the three cities.
| PC | Initial Eigenvalues | Extraction Sums of Squared Loadings | Rotation Sums of Squared Loadings | ||||||
|---|---|---|---|---|---|---|---|---|---|
| Srinagar | Total | % of Variance | Cumulative % | Total | % of Variance | Cumulative % | Total | % of Variance | Cumulative % |
| 1 | 3.514 | 50.194 | 50.194 | 3.514 | 50.194 | 50.194 | 3.356 | 47.939 | 47.939 |
| 2 | 2.150 | 30.707 | 80.902 | 2.150 | 30.707 | 80.902 | 2.307 | 32.963 | 80.902 |
| 3 | 0.609 | 8.706 | 89.607 | ||||||
| 4 | 0.387 | 5.534 | 95.141 | ||||||
| 5 | 0.186 | 2.651 | 97.792 | ||||||
| 6 | 0.088 | 1.260 | 99.052 | ||||||
| 7 | 0.066 | 0.948 | 100.00 | ||||||
| Shimla | |||||||||
| 1 | 3.036 | 60.725 | 60.725 | 3.036 | 60.725 | 60.725 | 3.032 | 60.632 | 60.632 |
| 2 | 1.194 | 23.884 | 84.609 | 1.194 | 23.884 | 84.609 | 1.199 | 23.977 | 84.609 |
| 3 | 0.455 | 9.105 | 93.715 | ||||||
| 4 | 0.262 | 5.230 | 98.945 | ||||||
| 5 | 0.053 | 1.055 | 100.00 | ||||||
| Dehradun | |||||||||
| 1 | 3.036 | 60.713 | 60.713 | 3.036 | 60.713 | 60.713 | 2.553 | 51.050 | 51.050 |
| 2 | 1.139 | 22.781 | 83.495 | 1.139 | 22.781 | 83.495 | 1.622 | 32.444 | 83.495 |
| 3 | 0.558 | 11.163 | 94.657 | ||||||
| 4 | 0.206 | 4.123 | 98.780 | ||||||
| 5 | 0.061 | 1.220 | 100.00 | ||||||
Table 3.
Loading factors of selected components (in bold) for each city.
| Rotated Component Matrix a | ||
|---|---|---|
| Component | ||
| 1 | 2 | |
| Srinagar | ||
| PD | 0.394 | −0.771 |
| LPI | 0.366 | 0.882 |
| ED | 0.951 | −0.067 |
| LSI | 0.850 | −0.104 |
| AREA_MN | 0.118 | 0.857 |
| FRAC_AM | 0.820 | 0.397 |
| ENN_MN | −0.868 | −0.164 |
| Shimla | ||
| LPI | 0.917 | 0.285 |
| ED | −0.878 | 0.331 |
| AREA_MN | 0.889 | −0.093 |
| FRAC_AM | 0.035 | 0.976 |
| ENN_MN | −0.793 | −0.215 |
| Dehradun | ||
| LPI | 0.965 | 0.079 |
| LSI | 0.326 | 0.815 |
| AREA_MN | 0.945 | 0.135 |
| FRAC_AM | 0.788 | 0.416 |
| CONTIG_MN | 0.033 | 0.872 |
a Rotation converged in two iterations.
Table 4.
UGIQ variation in categories across cities.
| UGIQ Value | UGIQ Category | Dominant LULC of the Wards | ||
|---|---|---|---|---|
| Srinagar | Shimla | Dehradun | ||
| −30.35 to −7.26 | −15.23 to −4.89 | −12.37 to −2.22 | Low | Centre wards with high urbanization level leading to fragmented and smaller UGIQ patches. Require immediate large-scale intervention to improve the status of quality. |
| −7.25 to 5.13 | −4.88 to 6.88 | −2.21 to 8.34 | Medium | Wards with expanding built-up area, generally interspersed with remaining agricultural land (in case of Srinagar and Dehradun). Require efforts to conserve remaining patches and maintain a sustainable balance of green and grey infrastructure. |
| 5.14 to 27.20 | 6.89 to 19.58 | 8.35 to 30.80 | High | Wards with large intact UGI patches such as wetland, agroforestry, and forest patches. Require efforts to maintain status quo and reduce human intervention in the future. |
Disclaimer/Publisher’s Note: The statements, opinions and data contained in all publications are solely those of the individual author(s) and contributor(s) and not of MDPI and/or the editor(s). MDPI and/or the editor(s) disclaim responsibility for any injury to people or property resulting from any ideas, methods, instructions or products referred to in the content. |
© 2023 by the authors. Licensee MDPI, Basel, Switzerland. This article is an open access article distributed under the terms and conditions of the Creative Commons Attribution (CC BY) license (https://creativecommons.org/licenses/by/4.0/).
Share and Cite
MDPI and ACS Style
Anees, M.M.; Banzhaf, E.; Wang, J.; Joshi, P.K. Quality Index Approach for Analysis of Urban Green Infrastructure in Himalayan Cities. Land 2023, 12, 279. https://doi.org/10.3390/land12020279
AMA Style
Anees MM, Banzhaf E, Wang J, Joshi PK. Quality Index Approach for Analysis of Urban Green Infrastructure in Himalayan Cities. Land. 2023; 12(2):279. https://doi.org/10.3390/land12020279
Chicago/Turabian StyleAnees, Mangalasseril Mohammad, Ellen Banzhaf, Jingxia Wang, and Pawan Kumar Joshi. 2023. "Quality Index Approach for Analysis of Urban Green Infrastructure in Himalayan Cities" Land 12, no. 2: 279. https://doi.org/10.3390/land12020279
Note that from the first issue of 2016, this journal uses article numbers instead of page numbers. See further details here.