Article

Interactions between Climate and Land Cover Change over West Africa

by
Eric Mensah Mortey
1,2,*,
Thompson Annor
3,
Joël Arnault
4,5,
Maman Maarouhi Inoussa
6,
Saïdou Madougou
7,
Harald Kunstmann
4,5 and
Emmanuel Kwesi Nyantakyi
2
1
Doctoral Research Program in Climate Change and Energy (DRP-CCE) of the West African Science Service Center on Climate Change and Adapted Land Use (WASCAL), Université Abdou Moumouni, Niamey P.O. Box 10662, Niger
2
Earth Observation Research and Innovation Centre (EORIC), University of Energy and Natural Resources, Sunyani P.O. Box 214, Ghana
3
Department Meteorology and Climate Science, Private Mail Bag, University Post Office, Kwame Nkrumah University of Science and Technology (KNUST), Kumasi P.O. Box PMB, Ghana
4
Karlsruhe Institute of Technology, Institute of Meteorology and Climate Research, 82467 Garmisch-Partenkirchen, Germany
5
Institute of Geography, University of Augsburg, 86135 Augsburg, Germany
6
Faculty of Sciences and Technics, Université Abdou Moumouni, Niamey P.O. Box 10662, Niger
7
Ecole Normale Superieure, Université Abdou Moumouni, Niamey P.O. Box 10963, Niger
*
Author to whom correspondence should be addressed.
Land 2023, 12(2), 355; https://doi.org/10.3390/land12020355
Submission received: 3 December 2022 / Revised: 19 January 2023 / Accepted: 21 January 2023 / Published: 28 January 2023
(This article belongs to the Section Land–Climate Interactions)

Abstract

:
Climate–land interaction over West Africa has often been assessed using climate simulations, although the model-based approach suffers from the limitations of climate models for the region. In this paper, an alternative method based on the analysis of historical land cover data and standardized climatic indices is used to investigate climate–land interactions, in order to establish climatic conditions and their corresponding land cover area changes. The annual variation in land cover area changes and climatic changes are first estimated separately and then linked using various spatiotemporal scales. The results show that incidences of land cover change result from abrupt changes in climatic conditions. Interannual changes of −1.0–1.0 °C, 0–1.5 °C, and −0.5–0.5 °C, and up to ± 50 mm changes in precipitation and climatic water balance, lead to 45,039–52,133 km2, 20,935–22,127 km2, and approximately 32,000 km2 changes, respectively, while a ± 0.5 °C and ± 20 mm change represents normal climate conditions with changes below 20,000 km2. Conversely, conversions of cropland, forest, grassland, and shrubland are the main land cover change types affecting the climate. The results offer a basis for the re-evaluation of land cover change and climate information used in regional climate models simulating land–climate interactions over West Africa.

1. Introduction

Climate change and land cover change are the two most important drivers of global environmental change. On the one hand, land cover changes can induce local cooling or warming by changing the earth’s surface reflectance (albedo), with increasing albedo resulting in temperature decreases. On the other hand, climate change influences land cover changes that result in changes in agroecological zones or bioclimatic zones in the long term. Quantifying the interactions between land cover change and climate change is challenging owing to the complex and mutual interaction between climate and land cover change [1,2]. The challenges range from determining the driver(s) of land cover change, the timescale of investigating climate–land cover interactions, the quality of the land cover dataset used, and the approaches used to quantify the climate–land cover change.
In West Africa, population growth and climate change are the main drivers of land cover change [3]. Population size and growth, on the one hand, are the major human activities leading to land cover change, while climate change on the other hand is the most dynamic natural force affecting land cover change at annual and decadal timescales [3]. Herrmann et al. 2020 [4] note that, while land cover change intensities provide evidence to support the role of population pressure as a force of change, the spatial distribution patterns of human footprint suggest that not only population pressure but also changing policies and socioeconomic conditions determine the complexity of land cover outcomes. In effect, investigating the interactions between climate change and land cover change in West Africa requires consideration of both the climatic components, population growth, and changing socioeconomic conditions and policies. In general, the interactions of all these components are made possible with climate models that have economic models which calculate the land cover demand driven by economic activities and a land surface model which calculate vegetation change driven by climate change [5]. The latter is prominent with the Regional Climate Model (RegCM) and the Weather Research and Forecasting Model (WRF) that have often been used to simulate the effects of land cover types or conditions on temperature, precipitation, radiation, and dew point, amongst others, over the region [6,7,8]. With these models, climate–land cover interaction research has improved over West Africa in the past few decades.
Despite the improvements in land–climate interaction research across the region using climate models, some problems remain. Typical are the methods of quantifying land–climate interactions, the spatial and temporal resolution of land cover datasets used in such studies, and the cost involved. Climate models are the preferred method of investigating land–climate interactions, but that is expensive and impossible without a high-performance computing infrastructure, causing the need for a cheaper approach. Secondly, most climate models investigating land–climate interactions use one year of historical land cover data, keeping it constant throughout the simulation period and neglecting the dynamic nature of climate–land interactions. Where dynamic land cover data are available, they are often very coarse, limiting their ability to capture important land cover features. The problems above are also significant challenges for the climate-modeling community in West Africa. Fortunately, the release of the European Space Agency (ESA) Climate Change Initiative (CCI) annual 300 m land cover (LC) maps are useful to improve the spatial and temporal resolution of land cover data used in climate models. The cost-effective approach for investigating climate–land interactions is, however, still lacking. The objective of this study is, therefore, to provide an alternative means of investigating land–climate interactions by quantifying the changes in land cover (using land cover trajectory analysis) and climatic changes (using the standardized temperature index (STI), standardized precipitation index (SPI), and standardized precipitation evapotranspiration index (SPEI)), and linking the two at comparable timescales. The need for this research is driven by the need to understand climate–land interactions in West Africa based on the prevailing land–climate interaction research questions. For instance, what kind of land cover change information could be learnt from the high-resolution ESA LC maps or any other land cover data? How could this information be a basis for parameterizing land cover changes to be fed into regional climate models in West Africa? Is there any link between the interannual climatic changes and the interannual land cover changes? Each research question provides a scientific contribution outlined below. Firstly, by studying the land cover information in the ESA LC maps, we determined through trajectory and transition analysis the major land cover conversions over West Africa to inform the climate modeling community what land cover changes were possible to simulate with the ESA LC maps. Secondly, the changes present in the ESA LC maps are also the changes ideally possible to use for parameterizing land cover changes in West Africa. Finally, in linking land cover changes to climatic changes, this work provides an alternative, less expensive method of investigating links between land cover changes and climatic changes without a climate modeling framework. While this work is in no way an alternative to robust climate modeling, we are optimistic that the outcome will provide important information on land cover changes and transitions for consideration by the climate modeling community in West Africa, specifically for parametrizing land cover changes to simulate their effects on regional climate (temperatures, rainfall, etc.). The proposed method could also be adapted and improved by the scientific community. This work is organized into three main sections. First, the interannual land cover changes were extracted from ESA LC maps from 1992 to 2019, followed by the computation of 12-monthly standardized climatic indices (STI, SPI, and SPEI) between 1980 and 2020. Finally, the links between land cover changes and climatic changes were determined.

2. Data and Methods

2.1. Study Area

West Africa lies between 18° W−18° E and 4° N−20° N with five bioclimatic zones, namely the Guineo–Congolia, Guinea, Sudan, Sahel, and Sahara zones (Figure 1) [3]. In terms of climate, some research divides West Africa into four zones from South to North: the Guinean zone (18° W–18° E, 4° N–8° N), the Sudano–Sahel zone (18° W–18° E, 8° N–12° N), the Sahelian zone (18° W–18° E, 12° N–16° N), and the Saharan zone (18° W–18° E, 16° N–20° N) [9,10]. Guinea–Congolia is the wettest region in West Africa, with average annual rainfall ranging from 2200 mm to 5000 mm [3]. It has two major rainy seasons and a short dry season. The land cover types are mostly forest, which keeps degrading with time. The Guinea region is a seasonally wet-and-dry deciduous or semi-deciduous forest, characterized by annual rainfall of 1200–2200 mm with a 7- to 8-month distinct dry season. The Sudanian region is majorly open woodland, open tree savannas, and wooded savannas with annual rainfall between 600 and 1200 mm and a 5–7-month dry season. The Sahelian region is characterized by a mixture of steppe and short grass savanna (open herbaceous types), woody plants, and an average rainfall of between 150 and 600 mm with 8 to 9 months of dry season. The annual average rainfall of the Saharan region ranges from 0 to 150 mm with vegetation varying from sparse to absent except in wadis, oases, and depressions, where water is present at or below the surface. The West African climate is related to the advanced north-to-south retreat of the intertropical front, which is associated with rainfall migration between the south and north latitudes. Maximum temperatures and temperature ranges vary little in the south and from 0 to over 45 °C in the arid north [3]. The West African land surface is complexly influenced by topography, climate, vegetation, geology, hydrography, and human activities that together determine land cover and land use changes in the region. Rapid population growth has led to the transformation of forests, woodlands, steppes, and savanna into agricultural lands to feed the growing population. In this paper, five bioclimatic regions defined by the intersection of the climatic zones [3] and the bioclimatic zones [9,10] described above have been used.

2.2. Data

2.2.1. Land Cover Data

The ESA CCI LC dataset is a timeseries of globally generated annual land cover maps at 300 m × 300 m spatial resolution, initially covering 1992 to 2015 and with yearly updates [11,12,13,14]. The ESA CCI dataset was produced by classifying the MERIS (Medium Resolution Imaging Spectrometer) full- and reduced-resolution data archive from 2003 to 2012 into a unique 10-year baseline LC, and by updating and backdating the baseline maps to produce 24 annual LC maps. The overall weighted-area accuracy is about 71.1% [15], with an overall thematic accuracy of 74.4% based on 2010 maps [16]. The CCI was found to have high spatial correspondence with Globcover, MODIS, and Globcover30 land cover datasets. For West Africa, a high correspondence of about 1 was found in the Saharan region and lower correspondence of less than 0.5 was found in the dry Savanna and Sahel regions [17]. The CCI maps are based on the United Nations Food and Agriculture Organization (UN FAO) land cover classification scheme (LCCS) available in TIFF format with 37 classes at http://maps.elie.ucl.ac.be/CCI/viewer/ (accessed on 10 February 2022) or as 22 classes NetCDF format at https://cds.climate.copernicus.eu/cdsapp#!/dataset/satellite-land-cover?tab=overview (accessed on 10 February 2022), recommended for use by the climate modeling community [18]. All analyses in this work used the land cover dataset in its original resolution.

2.2.2. Climate Data

Temperature (T), precipitation (P), and potential evapotranspiration (PET) datasets between 1980 and 2020 were used for this study. Table 1 summarizes the data products, spatial resolution, period analyzed, links to the datasets, and publications containing technical validation reports. For consistency and to ease comparison, only data products that have all three variables were used. With CHIRPS data which has no PET, the Global Land Evaporation Amsterdam Model (GLEAM) [19] and CHIRPS precipitation datasets were used to derive a high-resolution SPEI dataset for the West Africa region, similar to the high-resolution SPEI for Africa, available at https://data.ceda.ac.uk/neodc/spei_africa/data (accessed on 19 April 2022). The climate datasets were re-gridded to a 0.25° spatial resolution to enhance comparison between the datasets.

2.3. Methods

The method for investigating the climate–land relationship in this work is categorised into data preprocessing, initial, and final stages (Figure 2). In the data preprocessing stage, a timeseries of the annual CCI land cover dataset (1992 to 2019) over the West African domain was extracted from the global CCI datasets. At the initial stage, each pixel of the land cover dataset that was generated from the data preprocessing stage was analysed to determine the total number of classes as well as the total number of changes per pixel (one-time changes, two-times change, and three-times changes). The land cover trajectory analysis described above is the basis for identifying changed pixels and computing their respective area and interannual changes. To link land cover change area with climatic conditions, years with similar land cover change area were analysed considering the standardized temperature index (STI), standardized precipitation index (SPI), and standardized precipitation evapotranspiration index (SPEI) for those years. This final stage also evaluates relative changes in climatic conditions (temperature, precipitation, and climatic water balance) and their corresponding changes in the land cover area to establish climatic conditions and their corresponding land cover area changes. Climatic changes leading to abrupt land cover changes were compared to normal climate with no abrupt changes in the land cover area to establish their relative impacts. Finally, we compute the Sen’s slope of temperature, precipitation, and climatic water balance to determine the annual rate of change of the climate indices over West Africa. Similarly, the occurrence frequency and their probabilities are used to determine the frequency and probability of occurrence of the various STI, SPI, and SPEI indices. Further details of the method are presented below.

2.3.1. Data Preprocessing

The ESA CCI LC maps available from 1992 to 2019 were used for all land cover change analyses in this work. Version 4.3 http://maps.elie.ucl.ac.be/CCI/viewer/download.php (accessed 10 February 2022) of the ESA CCI user tool was used to subset the global annual CCI maps (1992–2019) to the West Africa domain. The Climate Data Operator (CDO) function “merge” was used to concatenate the annual maps into a single file containing the individual map layers.

2.3.2. Trajectory Analysis, Changed Pixels, and Number of Changes Per Pixel

To identify land cover changes in West Africa, a trajectory analysis [15,27] was performed on the preprocessed land cover data. A trajectory analysis analyses each pixel in the land cover timeseries dataset to determine changes over a specific period. In this work, the trajectory analysis investigates changes from 1992 to 2019, including the total number of land cover classes and the total number of changes within each pixel. The number of changes in a specific pixel is mathematically one less than the total number of unique classes in that pixel. Thus, a pixel with four unique classes from 1992 to 2019 must have changed three times (3×) from the initial class. Similar pixels containing three and two unique classes must have changed two times (2×) and one time (1×), respectively. Finally, a pixel with one unique class must have no changes. The changed pixels were differentiated from each other by their unique coordinate information (longitude and latitude values). The coordinate information, number of classes, and number of changes for each pixel were exported to R software for further analysis. The total changed pixels figure was obtained by aggregating all changed pixels in the land cover dataset. The total number of 1×, 2× and 3× changes were obtained by aggregating the one-time, two-times and three-times changes, respectively. To assess how the changes vary along the latitudes we aggregate all changes in each unique latitude from 4° N to 20° N.

2.3.3. Land Cover Area Changes

Trajectory analysis was used primarily to identify the changed pixels in the CCI land cover data over West Africa. The area corresponding to the total changed pixels was calculated by multiplying the total changed pixels by 0.09, which is the area equivalent of the 300 m × 300 m pixel in square kilometers. To quantify how the land cover area change varies along the latitudes we aggregate all changed pixels for each unique latitude from 4° N to 20° N and multiply the results by 0.09. The cumulative area change for each bioclimatic zone was computed by aggregating the area change for each respective zone in Figure 1 above. To account for latitudinal variation for the one-time, two-times, and three-times area changes, each was aggregated separately along the latitude.

2.3.4. Standardized Climatic Indices

The standardized temperature index (STI), standardized precipitation index (SPI), and standardized precipitation and evapotranspiration index (SPEI) are the main climatic indices used to assess the links between land cover changes and climatic changes. A 12-monthly timescale was chosen for the computation of the climatic indices as the land cover data used has an annual temporal resolution.
The standardized precipitation index (SPI) developed by [28] and updated by [29] is the most widely used drought indicator to measure meteorological drought at different timescales. SPI-n is a statistical indicator comparing the total precipitation received at a particular location during n months with the long-term rainfall distribution for the same period at that location. The SPI values range from −3 to +3 inclusively and can be interpreted as the number of standard deviations by which observed precipitation deviated from the climatological mean. Since SPI values are in units of standard deviation from the long-term mean, the indicator can be used to compare precipitation anomalies for any geographic location and for any number of time scales. The different timescales make SPI applicable to characterize different types of droughts. McKee et al., 1993 [28] proposed an incomplete gamma probability density function, which is first fitted to a given frequency distribution of precipitation series:
g ( x ) = 1 β α Γ ( a ) x α 1 e x β , x 0
where α is a parameter about the shape, β is a parameter about scale, x is the amount of precipitation, and the gamma function is presented as:
Γ ( α ) = 0 x α 1 e x d x
The best values of α and β are estimated by the maximum likelihood method:
α ^ = 1 4 A   1 + 4 A 3  
β ^ = x ¯ α ^  
A = ln ( x ¯ ) ln ( x ) n  
where n is the number of precipitation series. The cumulative probability for a given month can be obtained using the equation:
G ( x ) = 0 x g ( x ) d x = 1 β α Γ ( α ) 0 x x α 1 e x / β d x  
The SPI is then calculated as follows:
S P I = S t ( c 2 t + c 10 ) + c 0 [ ( d 3 t + d 2 ) t + d 1 ] t + 1.0  
t = ln 1 G ( x ) 2  
where x is the amount of precipitation and G(x) is Γ function-related precipitation probability distribution, S is the positive and negative coefficient of cumulative probability distribution, when G(x) > 0.5, S = 1 and when G(x) 0.5, S = −1, c 0 = 2.5155 ,   c 1 = 0.8028 ,   c 2 = 0.0103 ,   d 1 = 1 . 4327 ,   d 2 = 0 . 1892 ,   d 3 = 0 . 0013 . For this work, we employ the SPEI package in R software to compute the SPI.
The computation of the standardized precipitation evapotranspiration index (SPEI) uses a similar procedure as SPI except that instead of using precipitation, the difference between precipitation and potential evapotranspiration (climatic water balance) is used. The climatic water balance (CWB) allows accounting for the temperature factor, which is often neglected in the computation of SPI. The inclusion of temperature also introduces the influence of surface evaporation changes, which is more sensitive to the drought reaction caused by global temperature rise. To estimate the SPEI value, the climatic water balance is normalized as the log-logistic probability distribution. The probability density function is expressed by:
f ( x ) = β α x γ α 1 + x γ α 2
where α , β , and γ parameters represent the scale, shape, and origin, respectively. The probability distribution is thus expressed as:
F ( x ) = 1 + α x γ β 1
Vicente-Serrano et al., 2010 [30] calculate the SPEI as follows:
S P E I = W C 0 + C 1 W + C 2 W 2 1 + d 1 W + d 2 W 2 + d 3 W 3
When P 0.5 , W = 2 ln ( P ) ,   and   when   P > 0.5 , W = 2 ln ( 1 P )   ,   C 0 = 2.5155 ,   C 1 = 0.8028 , C 2 = 0.0203 , d 1 = 1.4327 , d 2 = 0.1892 , d 3 = 0.0013 . For the mathematical formulation and computation of SPEI, refer to [30]. The procedure for SPEI computation is also presented by [31] and https://spei.csic.es/home.html (accessed on 15 November 2022). In this work, the SPEI package in R Software is employed for all SPEI computations. The cumulative probabilities for various SPI, SPEI, and their interpretation are summarized in Table 2 below.
The STI is the temperature equivalent of the SPI and is closely related to the principles described above and originally presented by [28]. In this work the STI package in R was employed to compute the STI. The STI various values, their cumulative probabilities, interpretation, classification, and probability of occurrence are summarized in Table 3 below.

2.3.5. Linking Land–Climate Changes

To link land changes to climatic changes, the annual variation in land cover change area were used to distinguish years with abrupt land cover changes from years with non-abrupt land cover changes. The climatic conditions for the former become the climatic thresholds leading to abrupt land cover changes, while the climatic conditions for the latter became the basis for identifying climatic conditions leading to non-abrupt changes in land cover area (normal climate). The normal climatic condition was also used as the basis to access (validate) if indeed abrupt changes in the land cover area resulted from abrupt changes in climatic conditions.

2.3.6. Average Rate of Climatic Change

To compute the rate of climatic change, the slope of the Mann–Kendall trend test for each of the climatic indices was computed. The Mann–Kendall test is a widely used non-parametric test used to identify if a monotonic trend exists within a time series and has been employed in many SPI-related studies [31,32]. The mathematical background is also presented in detail by several studies [33,34]. For this work, we performed a spatial Mann–Kendall trend test using the “spatialEco” package in R and extracted the slope attribute to show, on average, how much the climate of West Africa is changing each year based on the STI, SPI, and SPEI.

2.3.7. Climatic Indices Frequency and Probability of Occurrence

The occurrence frequency of the STI, SPI, and SPEI at 12-monthly time scales was estimated using the range of values that defines their classification (Table 2 and Table 3). Thus, the occurrence frequency of an extremely hot (extremely dry) climate is a count of all STI (SPI/SPEI) values greater than or equal to 2 within the period of investigation. The probability of occurrence of the extremely hot (extremely dry) climate is the count of all such occurrences divided by the total period (in months). Thus, if extremely hot (extremely dry) conditions occur 67 times from 1980 to 2020 (492 months) at a location, then the occurrence frequency is 67 at that location, and the probability of occurrence is 67/492~0.14. The probability of occurrence defines the risk of exposure of a specific location to the various climatic condition defined by the STI, SPI, and SPEI conditions.

3. Results

A trajectory analysis of the ESA LC maps from 1992 to 2019 shows 5,433,127 pixels have changed out of about 2.086 billion pixels (74.5 million pixels per year × 28 years) analyzed over the West Africa domain (Figure 3). The changed pixels represent approximately 7.28% (488,981 km2) of the entire domain and consist of one-time changes (97.989%), two-times changes (2.097%), and three-times changes (0.005%). The remaining 92.92% (~5048,462 km2) is stable (unchanged).

3.1. Latitudinal Change Occurrence Frequency

The total land cover area change along the latitudes is shown in Figure 4a and the cumulative change per bioclimate zone is also shown in Figure 4b. The Guineo–Congolia zone registers the smallest land cover change area of approximately 47,303 km2, whilst the Sahel zone records the highest land cover area change of about 145,483 km2 (Figure 4b). The land cover change area increased nearly monotonically along the latitude in the Guinea zone into the Sudan zone until about 9° N (Figure 4a). Within the Sudan zone, land cover decreased generally with latitude, but this decrease exhibits fluctuations towards the Sahel zone (Figure 4a). The Sudan zone experienced the greatest land cover area change after the Sahel zone, with a total land cover change area reaching 144,121 km2 (Figure 4b). The total area changes peak at about 17° N and declines thereafter to 20° N. The overlapping of the total changes (in blue) and the one-time changes (in yellow) shows that the majority of the land cover changes occurred just once (Figure 4a). The two-time and three-time changes lie almost along the zero line from the Guineo–Congolia to Sahara, also implying they are very minimal compared to the one-time changes. The comparable heights of the blue and yellow bar charts in Figure 4b also emphasize one-time changes are dominant for each climatic zone. The two-time changes are prominent from the mid-Sahel to near 18° N and explain the temporal separation of the blue and yellow lines in Figure 4a. The increase of the two-time changes from 16° N to 18° N is responsible for the increased land cover change area along the same latitudes.

3.2. Land Cover Transition

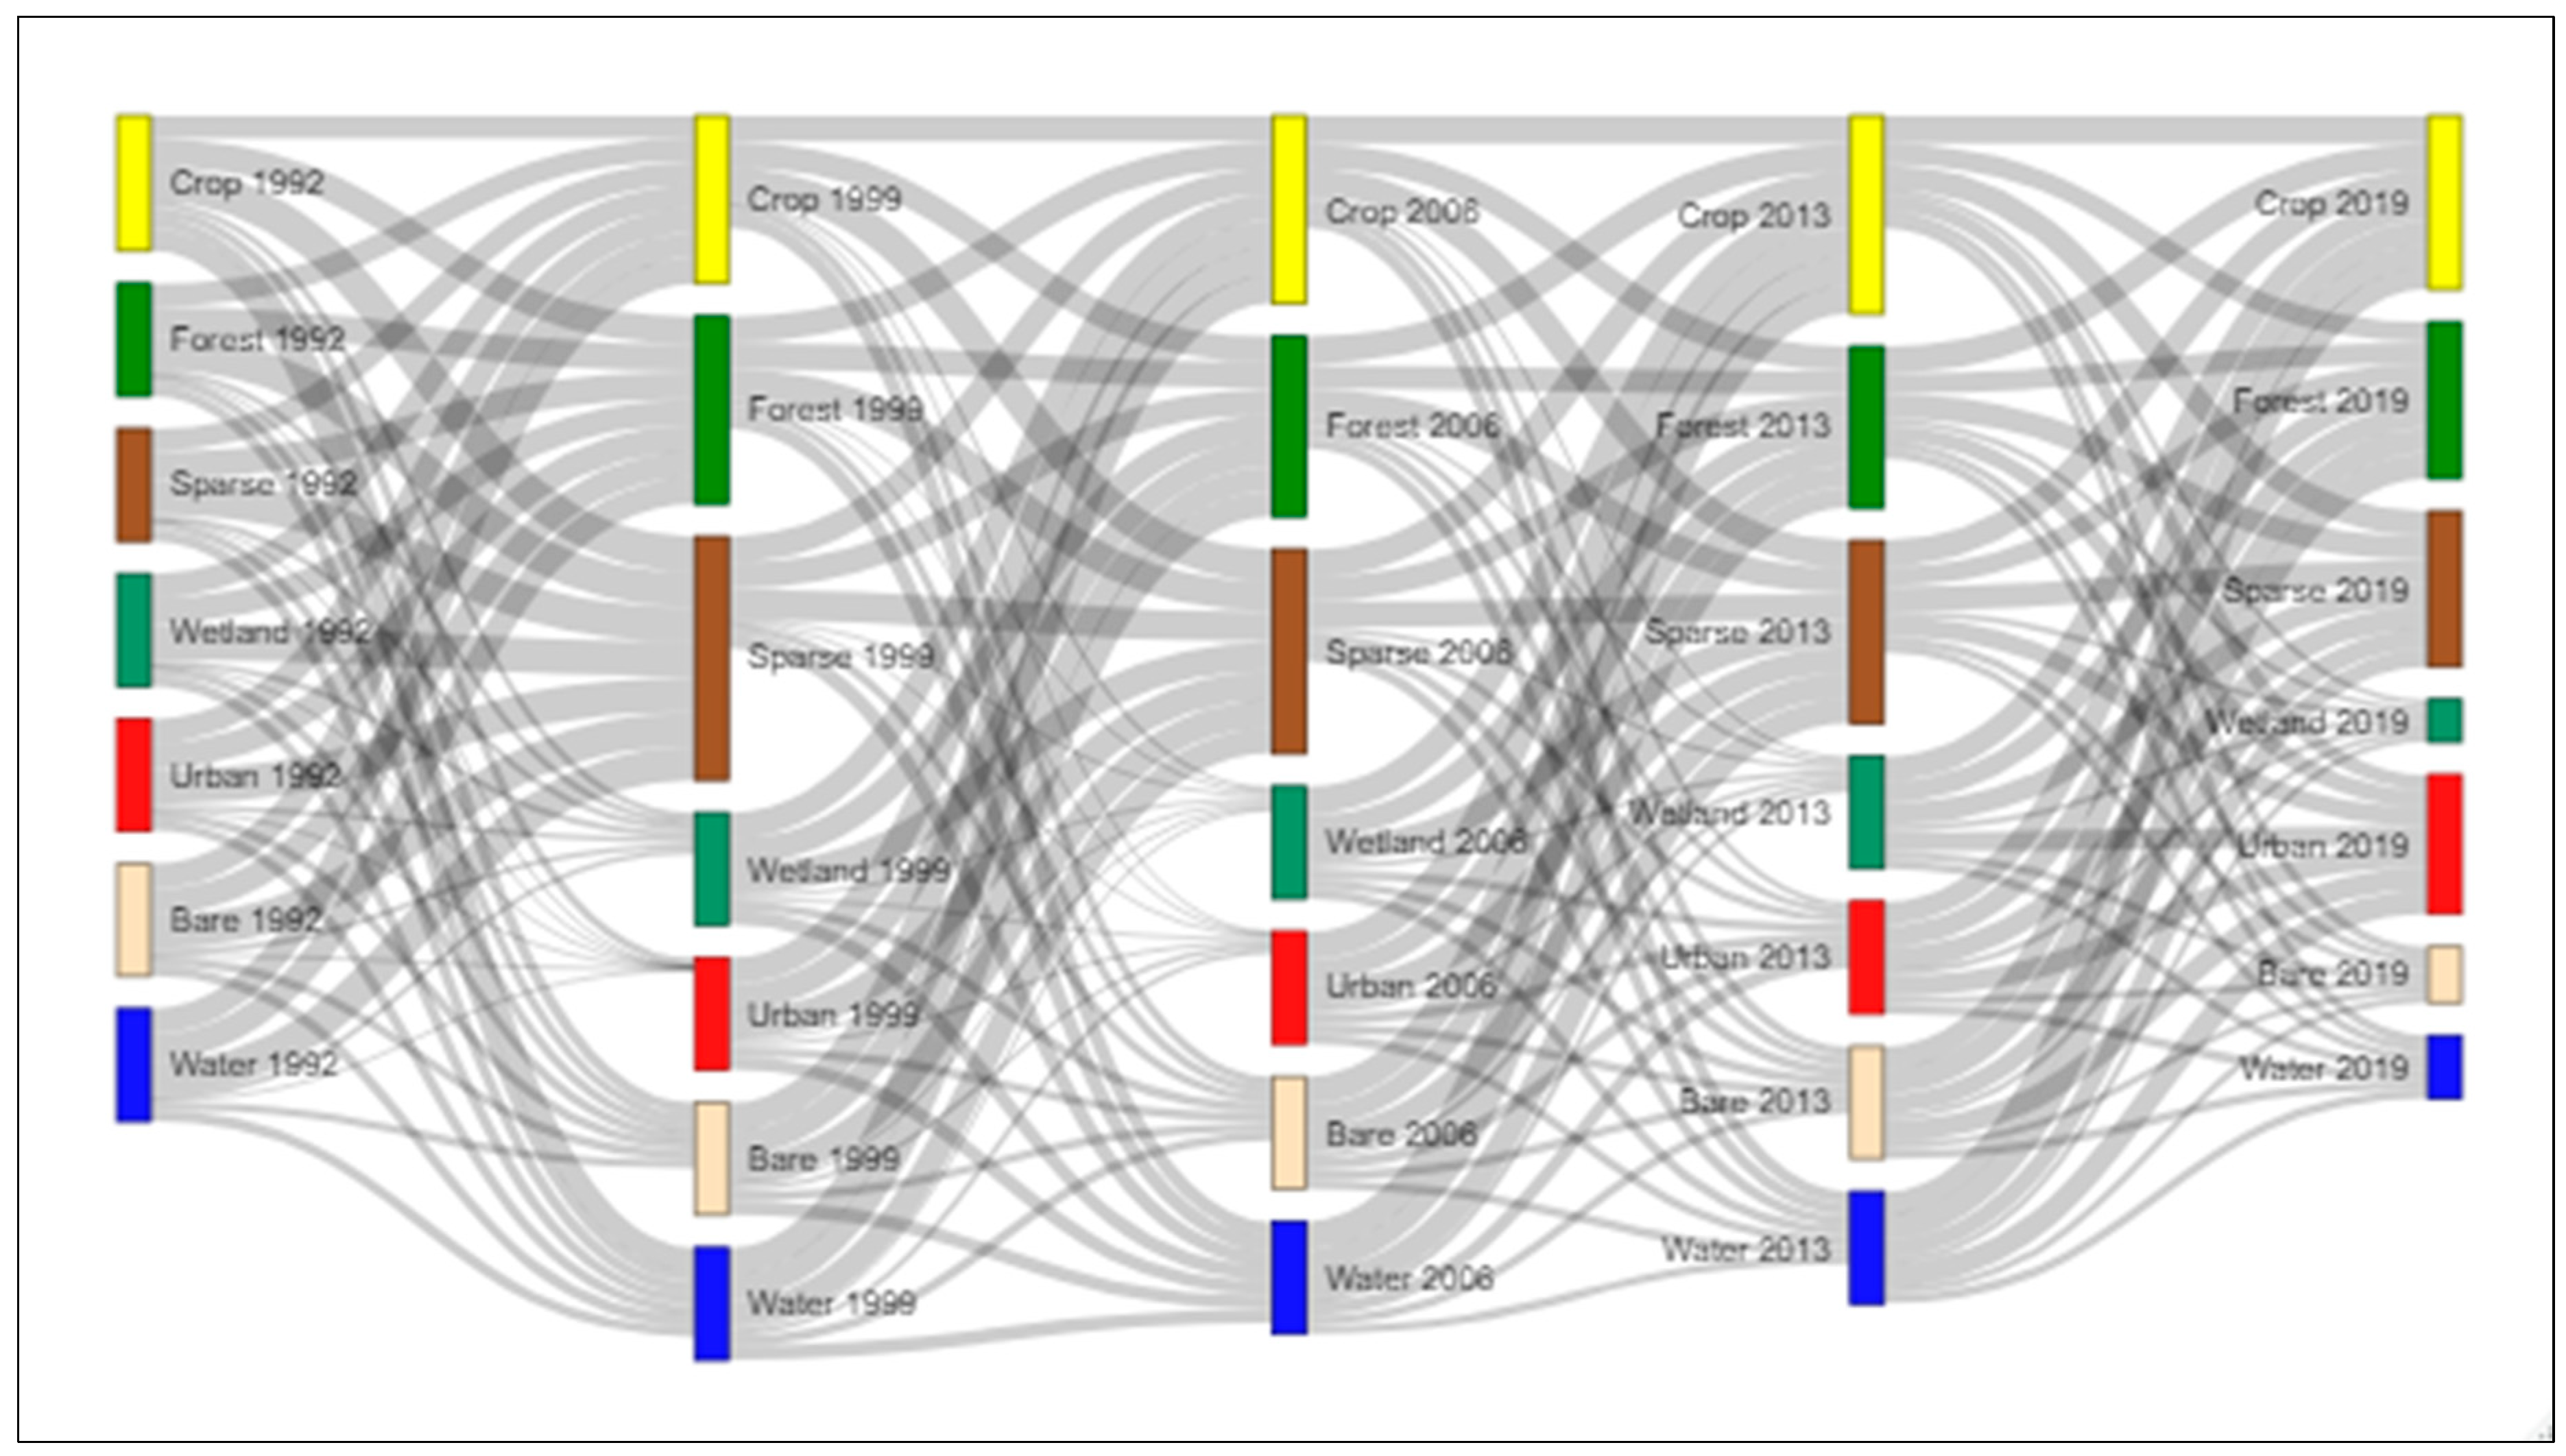
Figure 5 summarizes the land cover transition from 1992 to 2019 over West Africa using the IPCC land cover classification scheme. For simplicity, the transitions were aggregated at seven-year intervals, such that only the total transitions from 1992 to 1999, 1999 to 2006, 2006 to 2013, and 2013 to 2019 are shown in Figure 5. Wetland, urban, bare, and water have equivalent area changes for all transition periods except 2016 to 2019 (see interactive Sankey diagrams, online version), because it is only a six-year period. Since changes in wetland, urban, bare, and water remain constant (1992 to 2016), the ESA LC map does not capture changes related to these classes and so hinders their use for detecting changes related to these four land cover classes. Only cropland, forest, and sparse vegetation show variation in area changes and are therefore naturally the realistic classes to investigate the climatic links to land cover changes over West Africa. Our analysis of how climatic changes relates to land cover changes will thus be restricted to cropland, forest, and sparse land (grassland, shrubland, and sparse vegetation).

3.3. Annualized Changes in Land Cover over West Africa

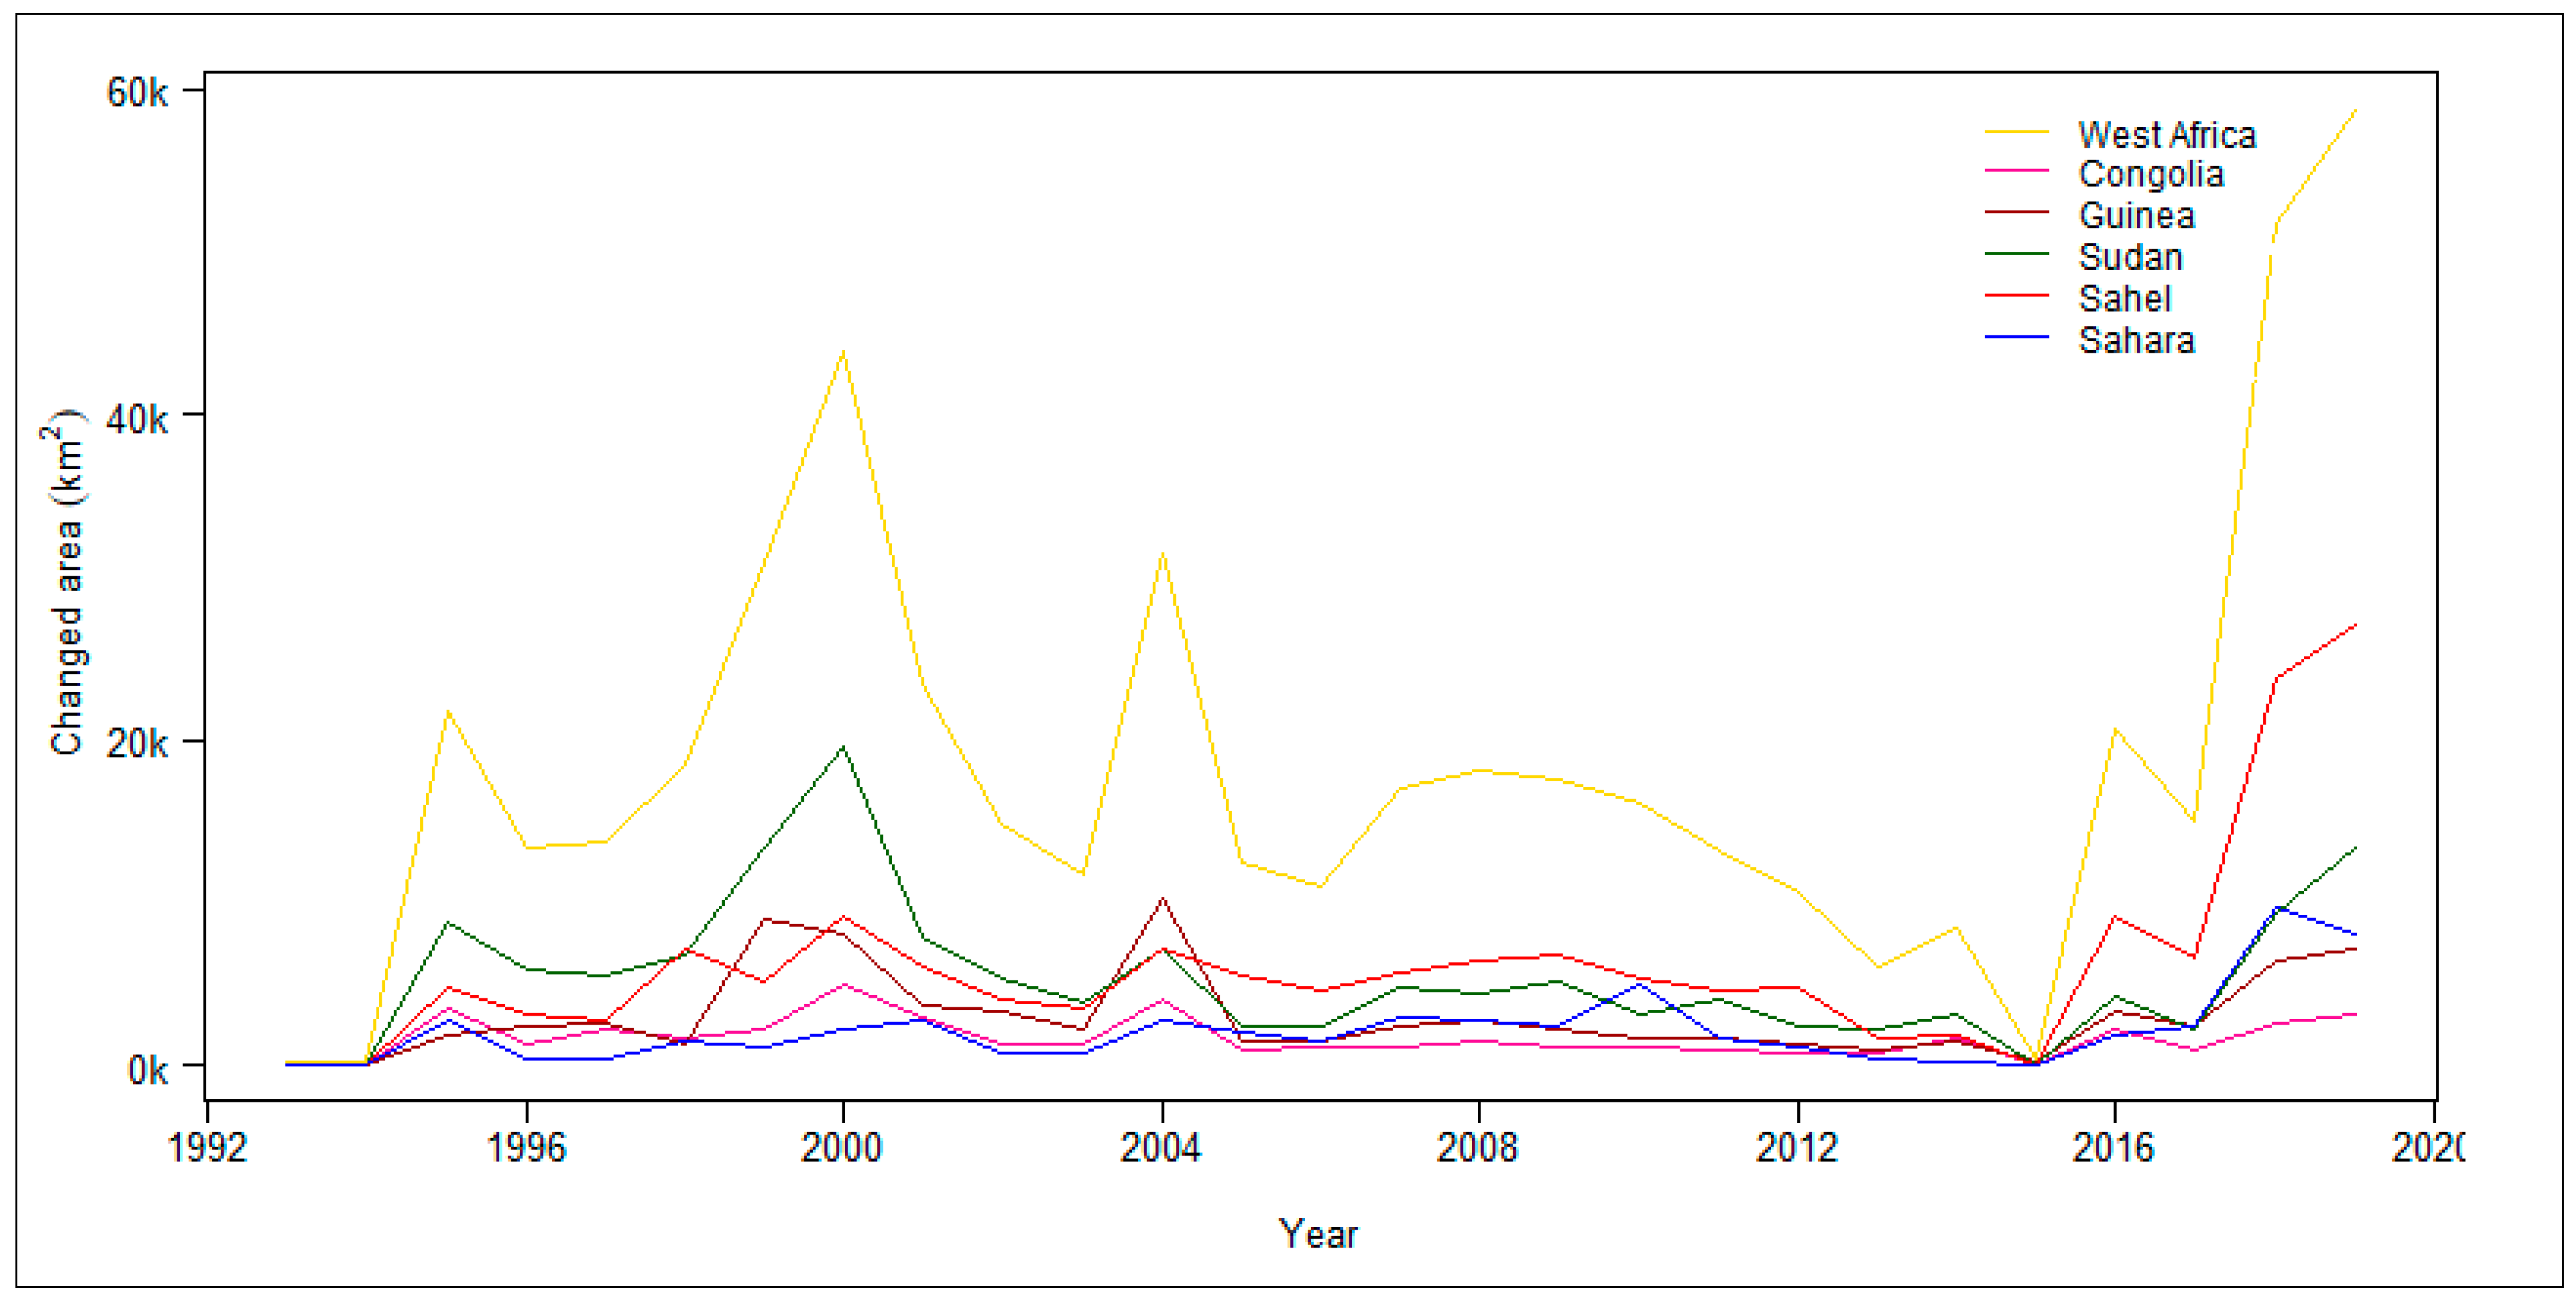
The land cover change area varies from one year to another with spikes in 1995, 2000, 2004, and 2016, 2018 (Figure 6). For each of these years, the spikes observed are consistent for each of the climatic zones, showing that it is not a localized event restricted to any of the climatic zones. Instead, it could be more related to a more regional event such as annual climatic conditions. In the next sections, the standardized precipitation index (SPI), standardized precipitation and evapotranspiration index (SPEI), and the standardized temperature index (STI) are employed to investigate climatic conditions leading to these spikes in land cover change area.

3.4. Climatic Conditions Leading to Significant Land Cover Change Area

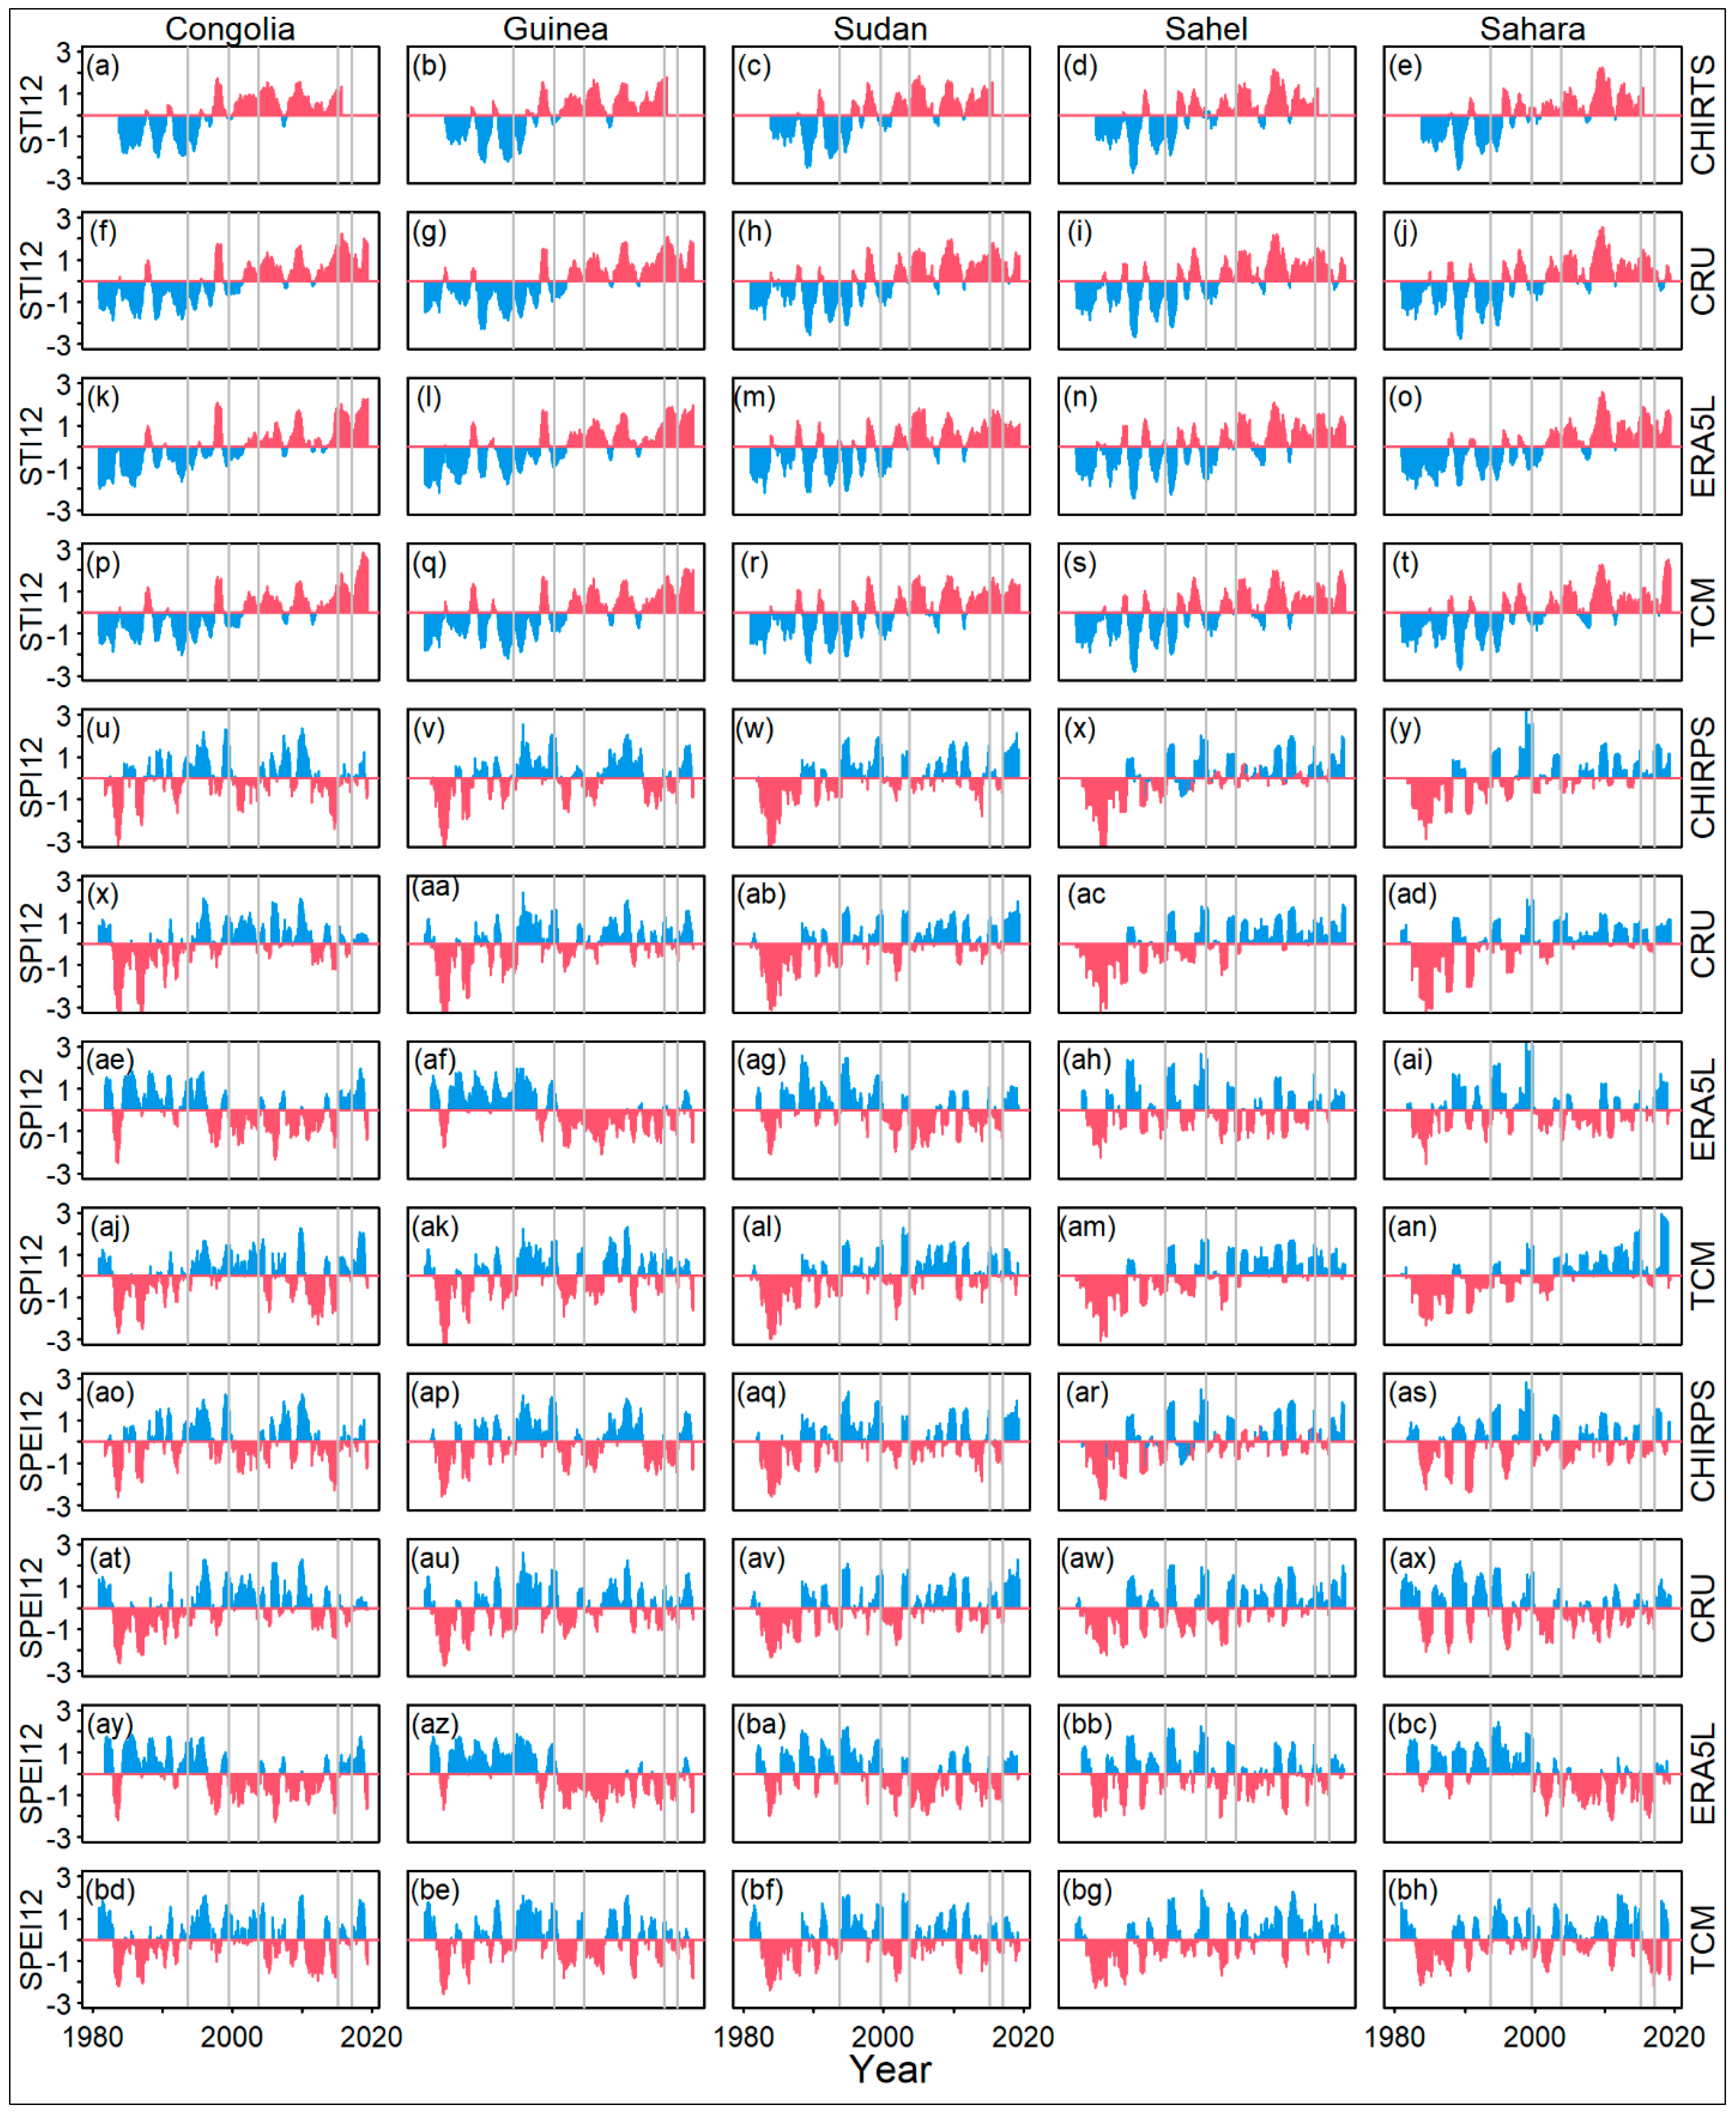
The STI, SPI, and SPEI values for CRU, CHIRPS, CHIRTS, and TerraClimate datasets at a 12-month timescale are shown in Figure 7 below. While the climate analysis covers 1980 to 2020, the land cover change analysis covers only 1992 to 2019. Consequently, the period for investigating the climatic links with land cover changes was also restricted to the overlapping period of the two datasets (1992 to 2019).
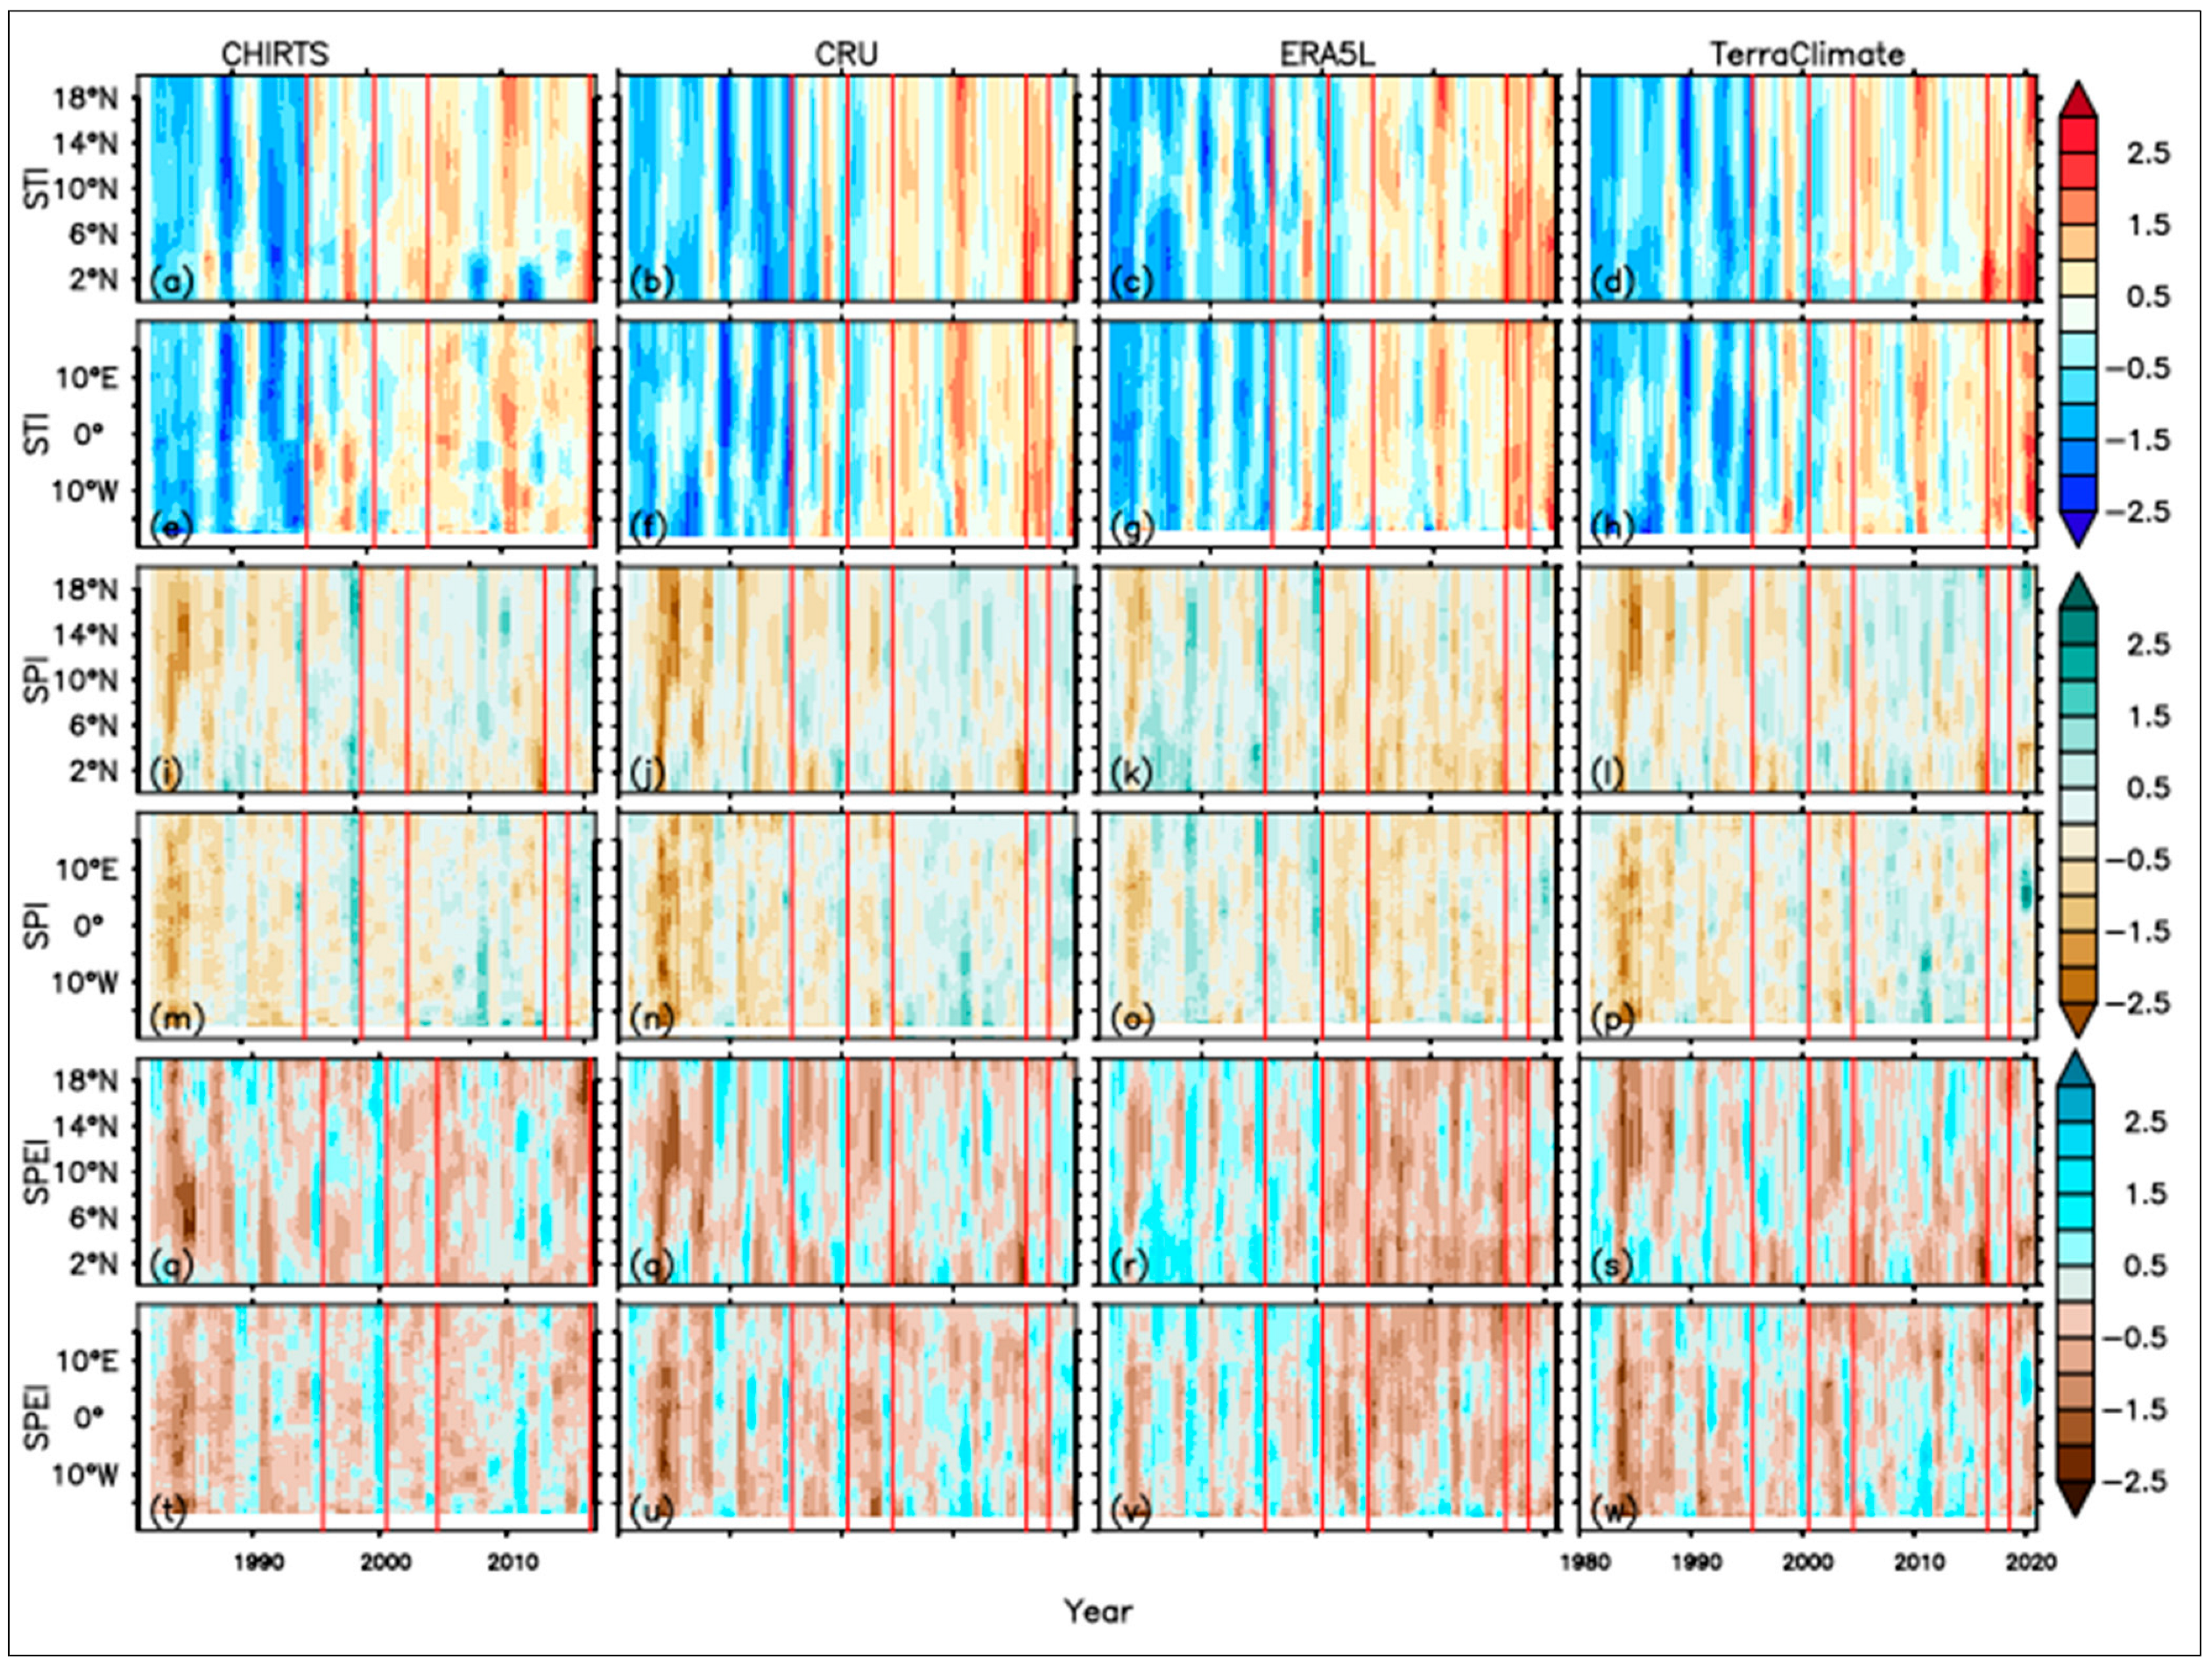
The vertical lines (in grey) are the years for which abrupt land cover changes (Figure 7) have been experienced. The STI values of the CHIRTS, CRU, ERA5-Land, and TerraClimate datasets show the climate of West Africa from 1980 to 2020 may be divided into two episodes; a relatively cold episode which is between 1980 and 2000, and a relatively warm episode from 2000 to 2020, with minor breaks in between these episodes for all three datasets. Within the cold episode, the highest land cover change area occurs: (a) when there is an abrupt change from extremely cold or very cold climatic conditions to moderately cold or near-normal climatic conditions with an increase in STI values, as in 1995 (Figure 7a–p); and (b) when there is a change from a hot climate with a positive STI value to a cold climate with negative STI values, as seen in 2000. During the hot episode, the highest land cover change area occurs: (a) when there is a sudden change from a nearly normal climate to a hot climate with an increase in STI values, as shown in 2004 and 2018 (Figure 7a–p); and (b) when the STI increase from near-normal climate attains a maximum, as seen in 2016 (Figure 7a–p). In terms of the SPI, the conditions for abrupt land cover changes occur: (a) when there is an abrupt change from extremely dry to near normal as in 1995 (Figure 7q–af); (b) when the SPI value attains a peak (maxima) in changing from a wetter climate (with positive SPI value) to a drier climate (with negative SPI value); and (c) when the SPI value attains a peak (maxima) value in changing from a drier climate (with negative SPI value) to a wetter climate (with positive SPI value). From the analysis of the STI and SPI, the temperature and precipitation conditions leading to abrupt land cover changes can be summarized as: (a) a condition of increasing temperature and increasing precipitation; (b) contrasting temperatures and increasing precipitation; and (c) critical precipitation and temperature changes. Figure 7ag–av show the SPEI response to the temperature and precipitation changes discussed above. The contrasting temperatures for 1994 to 1995 and for 2015 to 2016, respectively, with a general increase in rainfall, resulted in increased SPEI with a corresponding increase in the land cover area change for 1994 and 2016. The contrasting changes in temperature and precipitation from 1999 to 2000 and from 2003 to 2004 led to an increase in SPEI and total land cover change area in 2000 and 2004. It is worth mentioning that the contrasting temperature changes for 1994–1995 and 2015–2016 have similar effects of increased land cover area change between 20,935–22,127 km2 over West Africa. The time-latitude and time-longitude Hovmoller plots below (Figure 8) show that most abrupt land cover changes (in red vertical lines) occur mostly with increasing SPI and SPEI, sandwiched on both sides by low SPI and SPEI values along the latitudes and longitudes, respectively. Figure 8a–h shows how STI values varies with time along the latitude and longitude respectively for CHIRTS, CRU, ERA5-Land, and TerraClimate datasets. Figure 8i–w show similar information as Figure 8a–h but for SPI and SPEI respectively. The STI re-emphasized the migration from a relatively cold climate to a warm climate from 1980 to 2020, with the most abrupt land cover changes (in red) occurring with increasing or decreasing STI values. Thus, irrespective of the dataset used, the STI, SPI, and SPEI indicate that the most abrupt land cover changes coincide with abrupt changes in climatic conditions.

3.5. Quantifying Climatic Changes Leading to Abrupt Land Use and Cover Changes

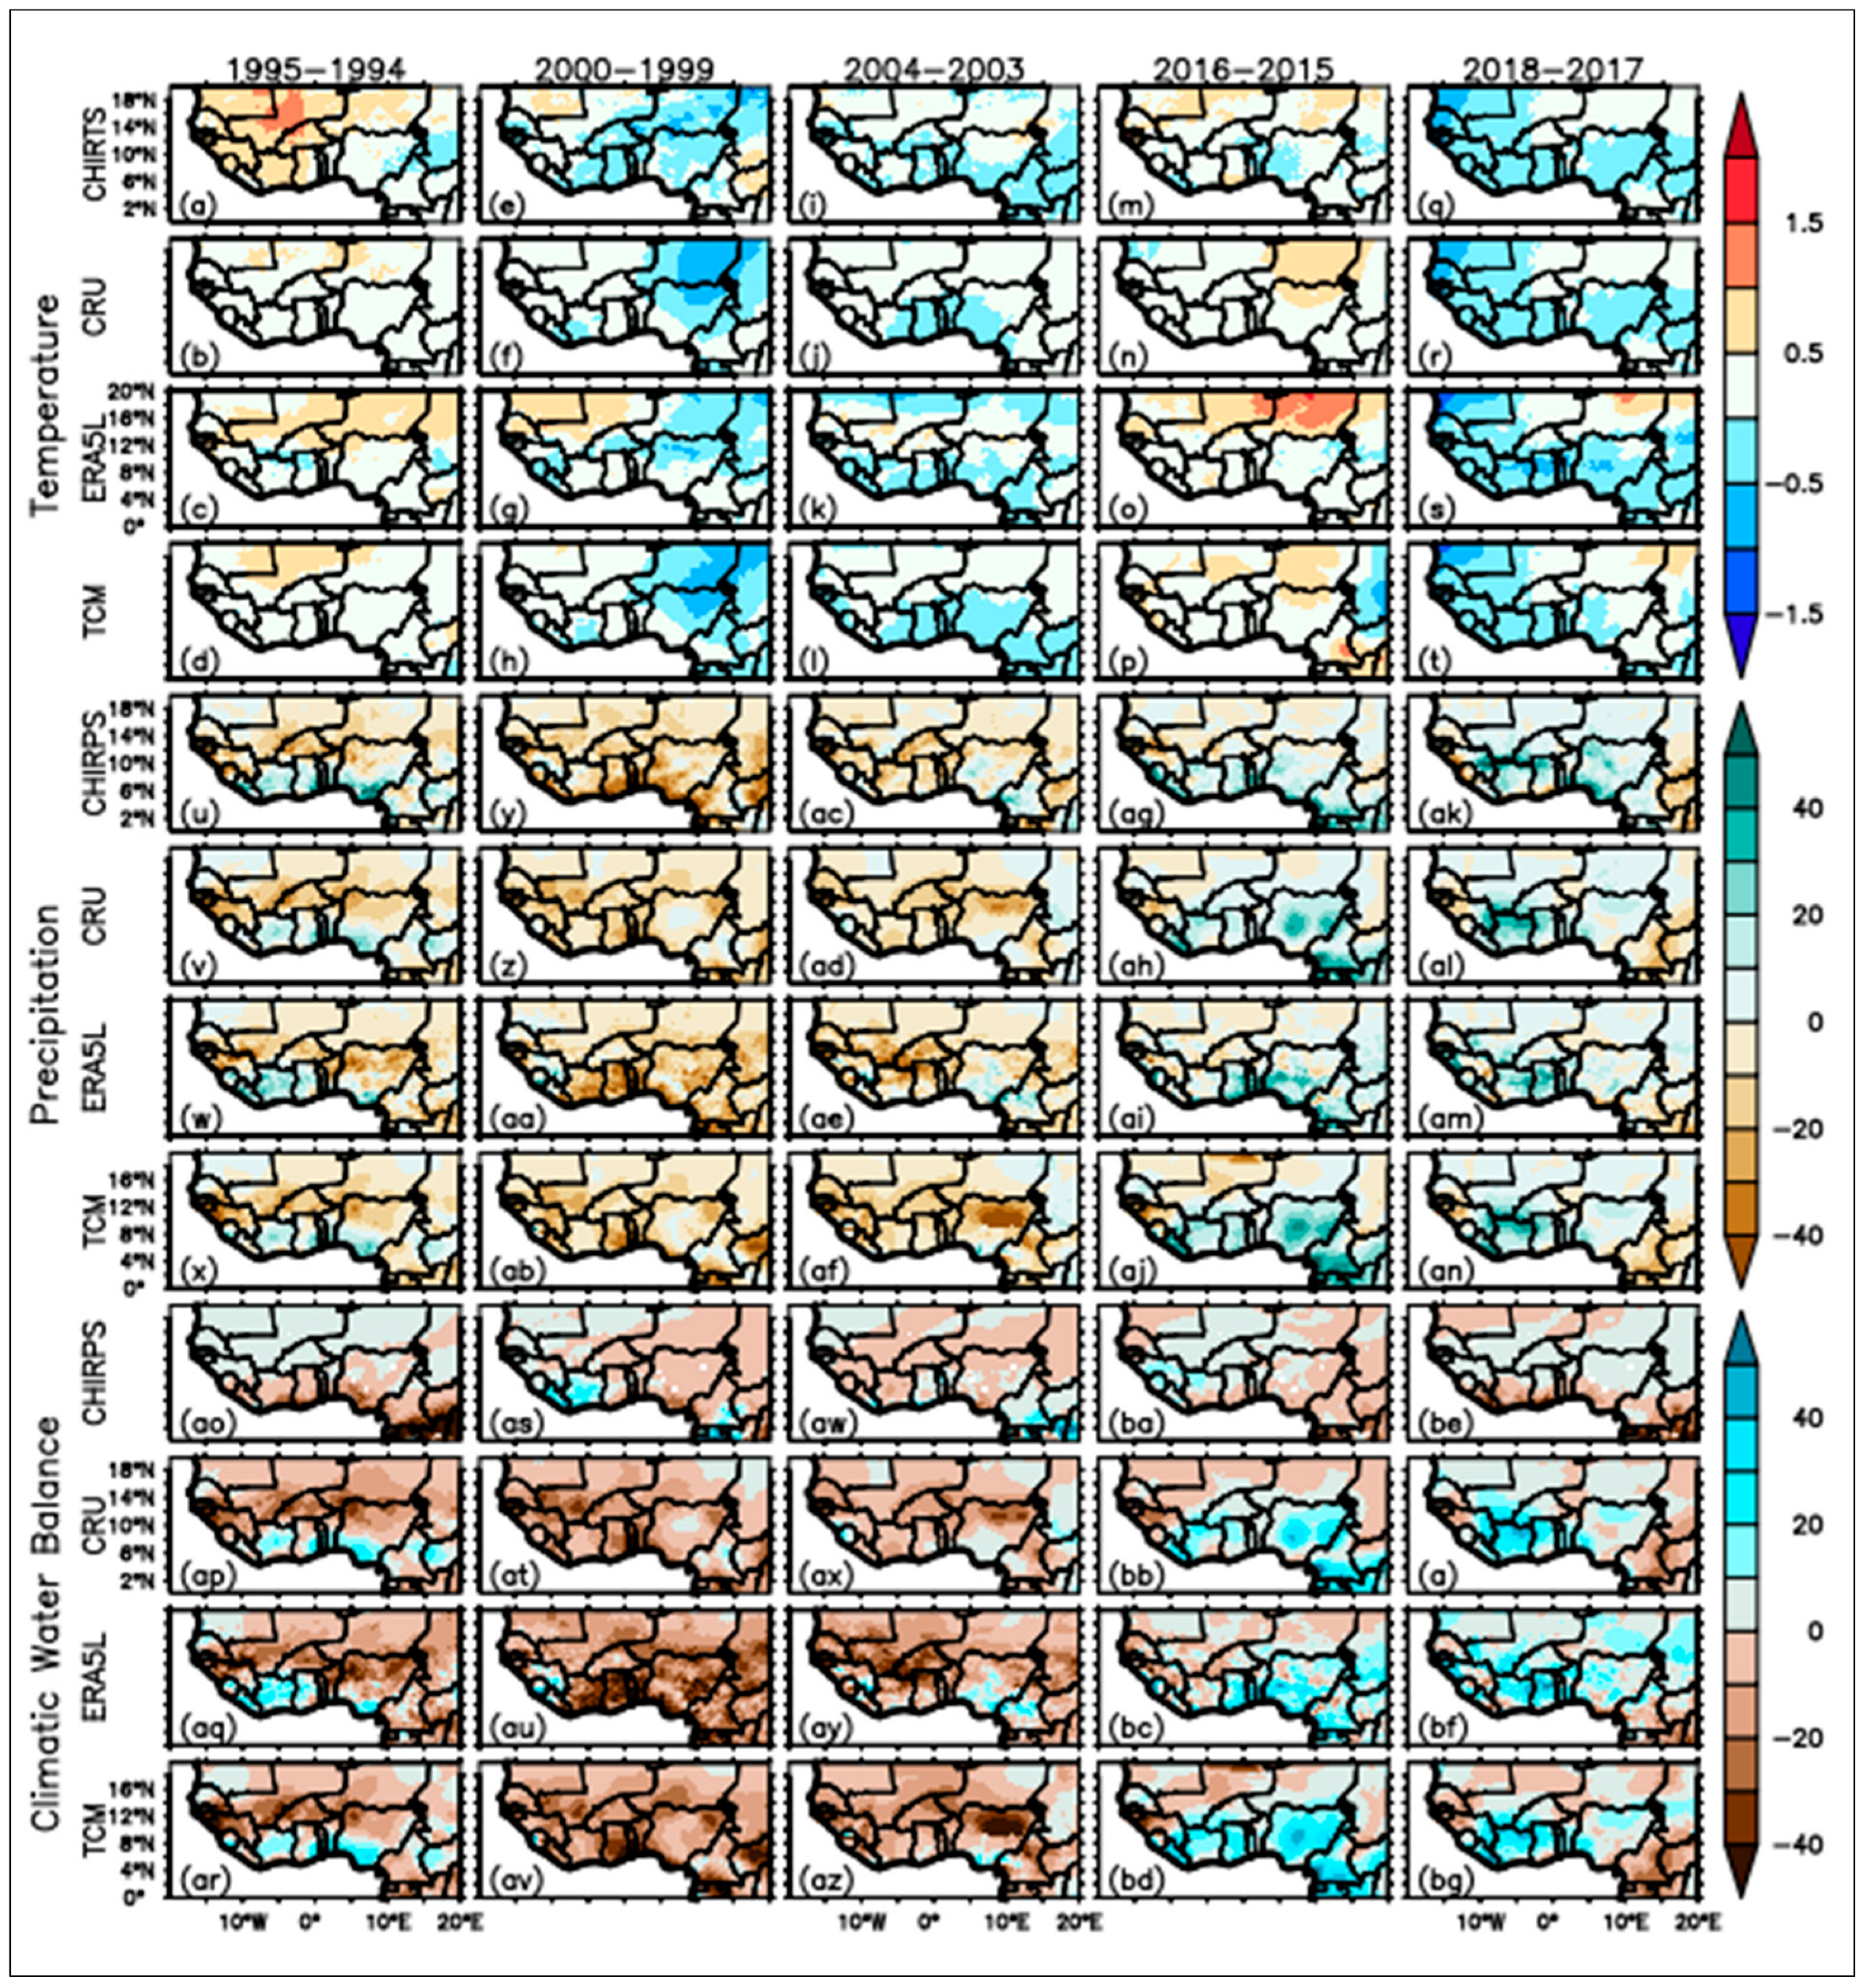
The general conditions leading to land cover changes in West Africa have been presented. The changes in temperature, precipitation, and climatic water balance leading to these observed changes are quantified in this section. From Figure 6 and Figure 9, changes of up to (0 to 1.5) °C (1995–1994, 2016–2015) are identified, with a total land cover area change ranging from 20,935 to 22,127 km2 over West Africa, with variation between one climatic zone and another.
Changes from −1.0 to 1.0 °C (Figure 9e–h,q–t) relate to land cover area changes ranging from 45,039 to 52,133 km2 of the West African domain (see 2000–1999, 2018–2017). Finally, a change within −0.5 and 0.5 °C (Figure 9i–l) correlates with land cover area change of up to 31,843 km2. The precipitation and climatic water balance changes are similar for each of the periods and within −50 to 50 mm in most cases, with a few areas below and above −50 and +50 mm, respectively. Within the dry regime (1980 to ~2004), most of the land cover changes were experienced when at least 80% of the West African space was dominated by deficits in precipitation and climatic water balance up to −50 mm (Figure 9u–af). Within the wet regime (2000–2020), most of the region was dominated by an increase (recovery) of rainfall and a climatic water balance of up to about 40 mm, covering at least 35% of the entire West African domain (Figure 9ag–an). From the foregoing, the plausible climatic condition relating to significant land cover changes in West Africa can be summarized as follows (Table 4).
The wet and dry conditions in Table 4 are presented in this way to emphasize that similar temperature changes with contrasting precipitation and water balance (Figure 9; 1995–1994, 2016–2015) effects have similar effects on land cover area change (Figure 6; 1995, 2016). The results also reveal that a positive increase in temperature everywhere in the region may have less impact on total land cover area change than contrasting changes with a decrease in some regions and increases in others, or a change in temperature from cold (hot) conditions to hot (cold) conditions across a region. This is evident in Figure 9 and explains why a change of 0 to 1.5 °C has less impact on land cover area changes (20,935–22,127 km2) than −0.5 to 0.5 °C changes (31,843 km2). A change of −1.0 to 1.0 °C, however, relates to a greater land cover area change than −0.5 to 0.5 °C. The climatic conditions before and during abrupt land cover changes are shown in Figure A1 and Figure A2 respectively in the appendix section of the manuscript.

3.6. Quantifying Climatic Changes and Corresponding Land Cover Changes under Normal Climatic Conditions

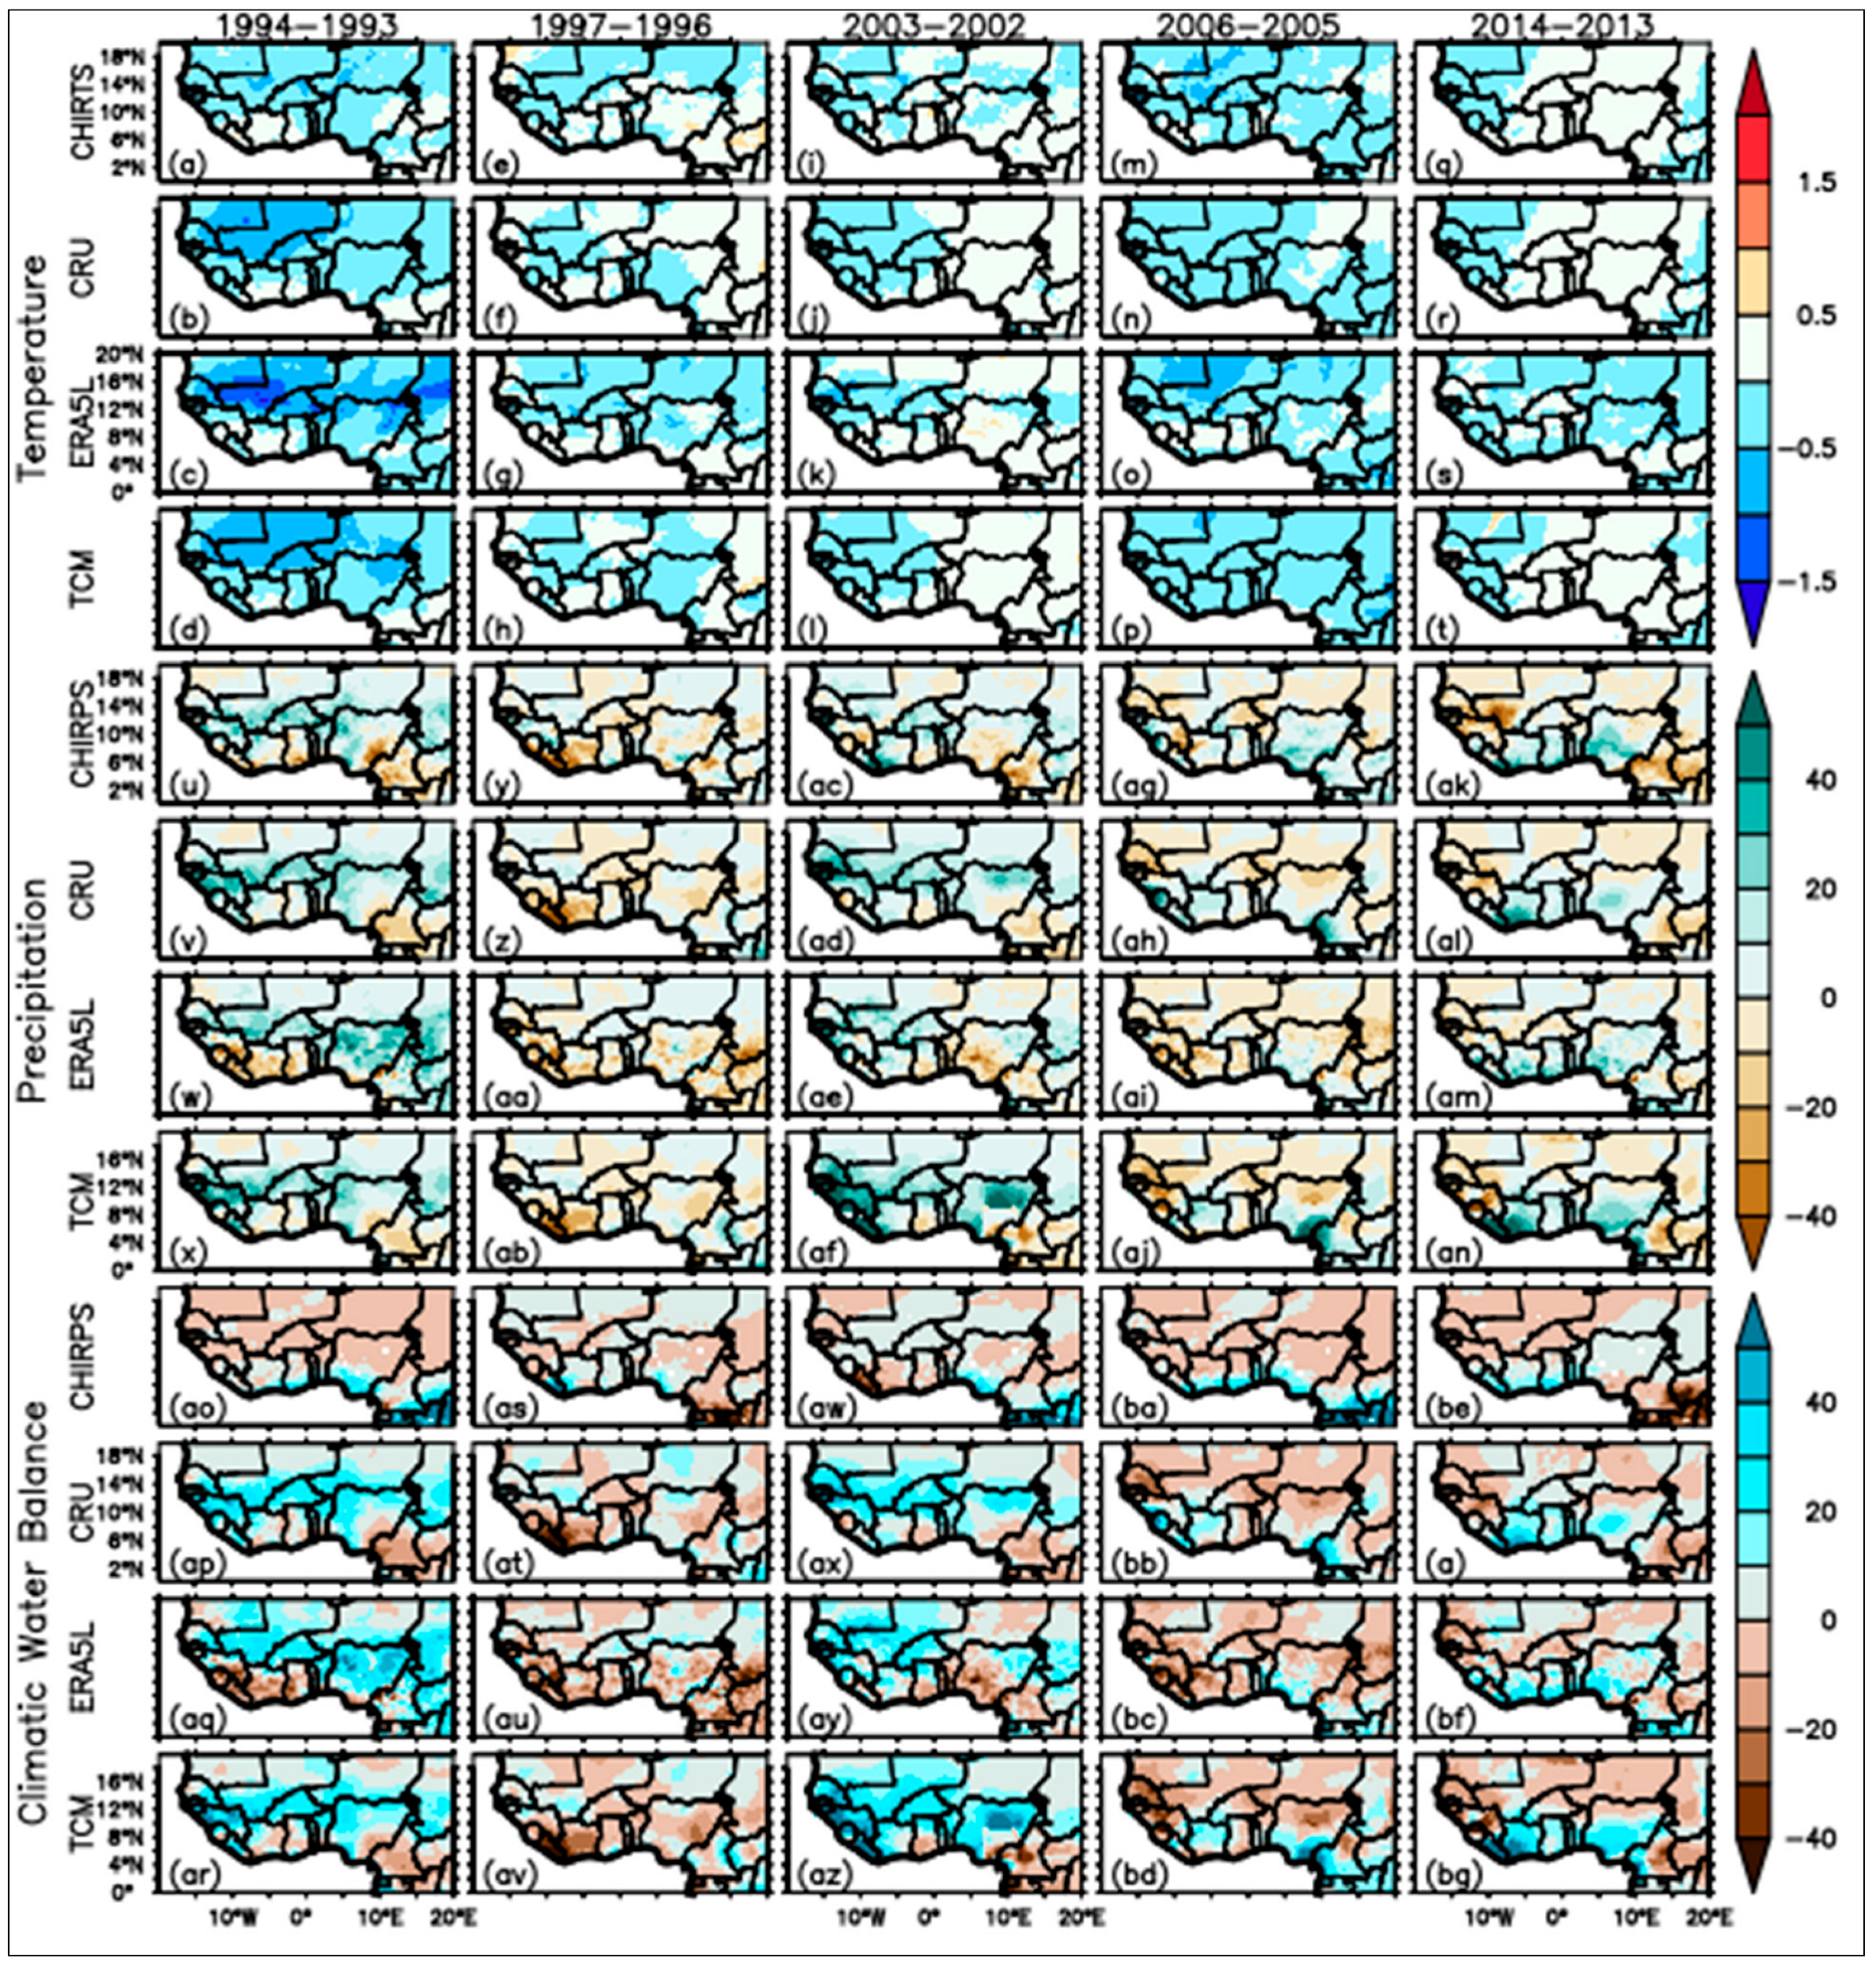
In Figure 10 below, we quantify the climatic conditions in normal years to verify if indeed abrupt changes in climatic conditions, as asserted above, lead to abrupt land cover changes. In general, the temperature change ranged mostly between ± 0.5   covering 50 to 90% under normal climatic conditions (Figure 10a–t) for CHIRTS, CRU, ERA5-Land and CRU datasets. Similarly, changes in precipitation (Figure 10u–an) and climatic water balance (Figure 10ao–bg) ranged between −20 and +20 mm covering over 80% of the West African domain for CHIRPS, CRU, ERA5-Land and TerraClimate datasets. These climatic conditions are well below the conditions for which abrupt land cover changes were experienced, with a total land cover area change of less than 20,000 km2.

3.7. Climatic Risks of West Africa: Average Climatic Change

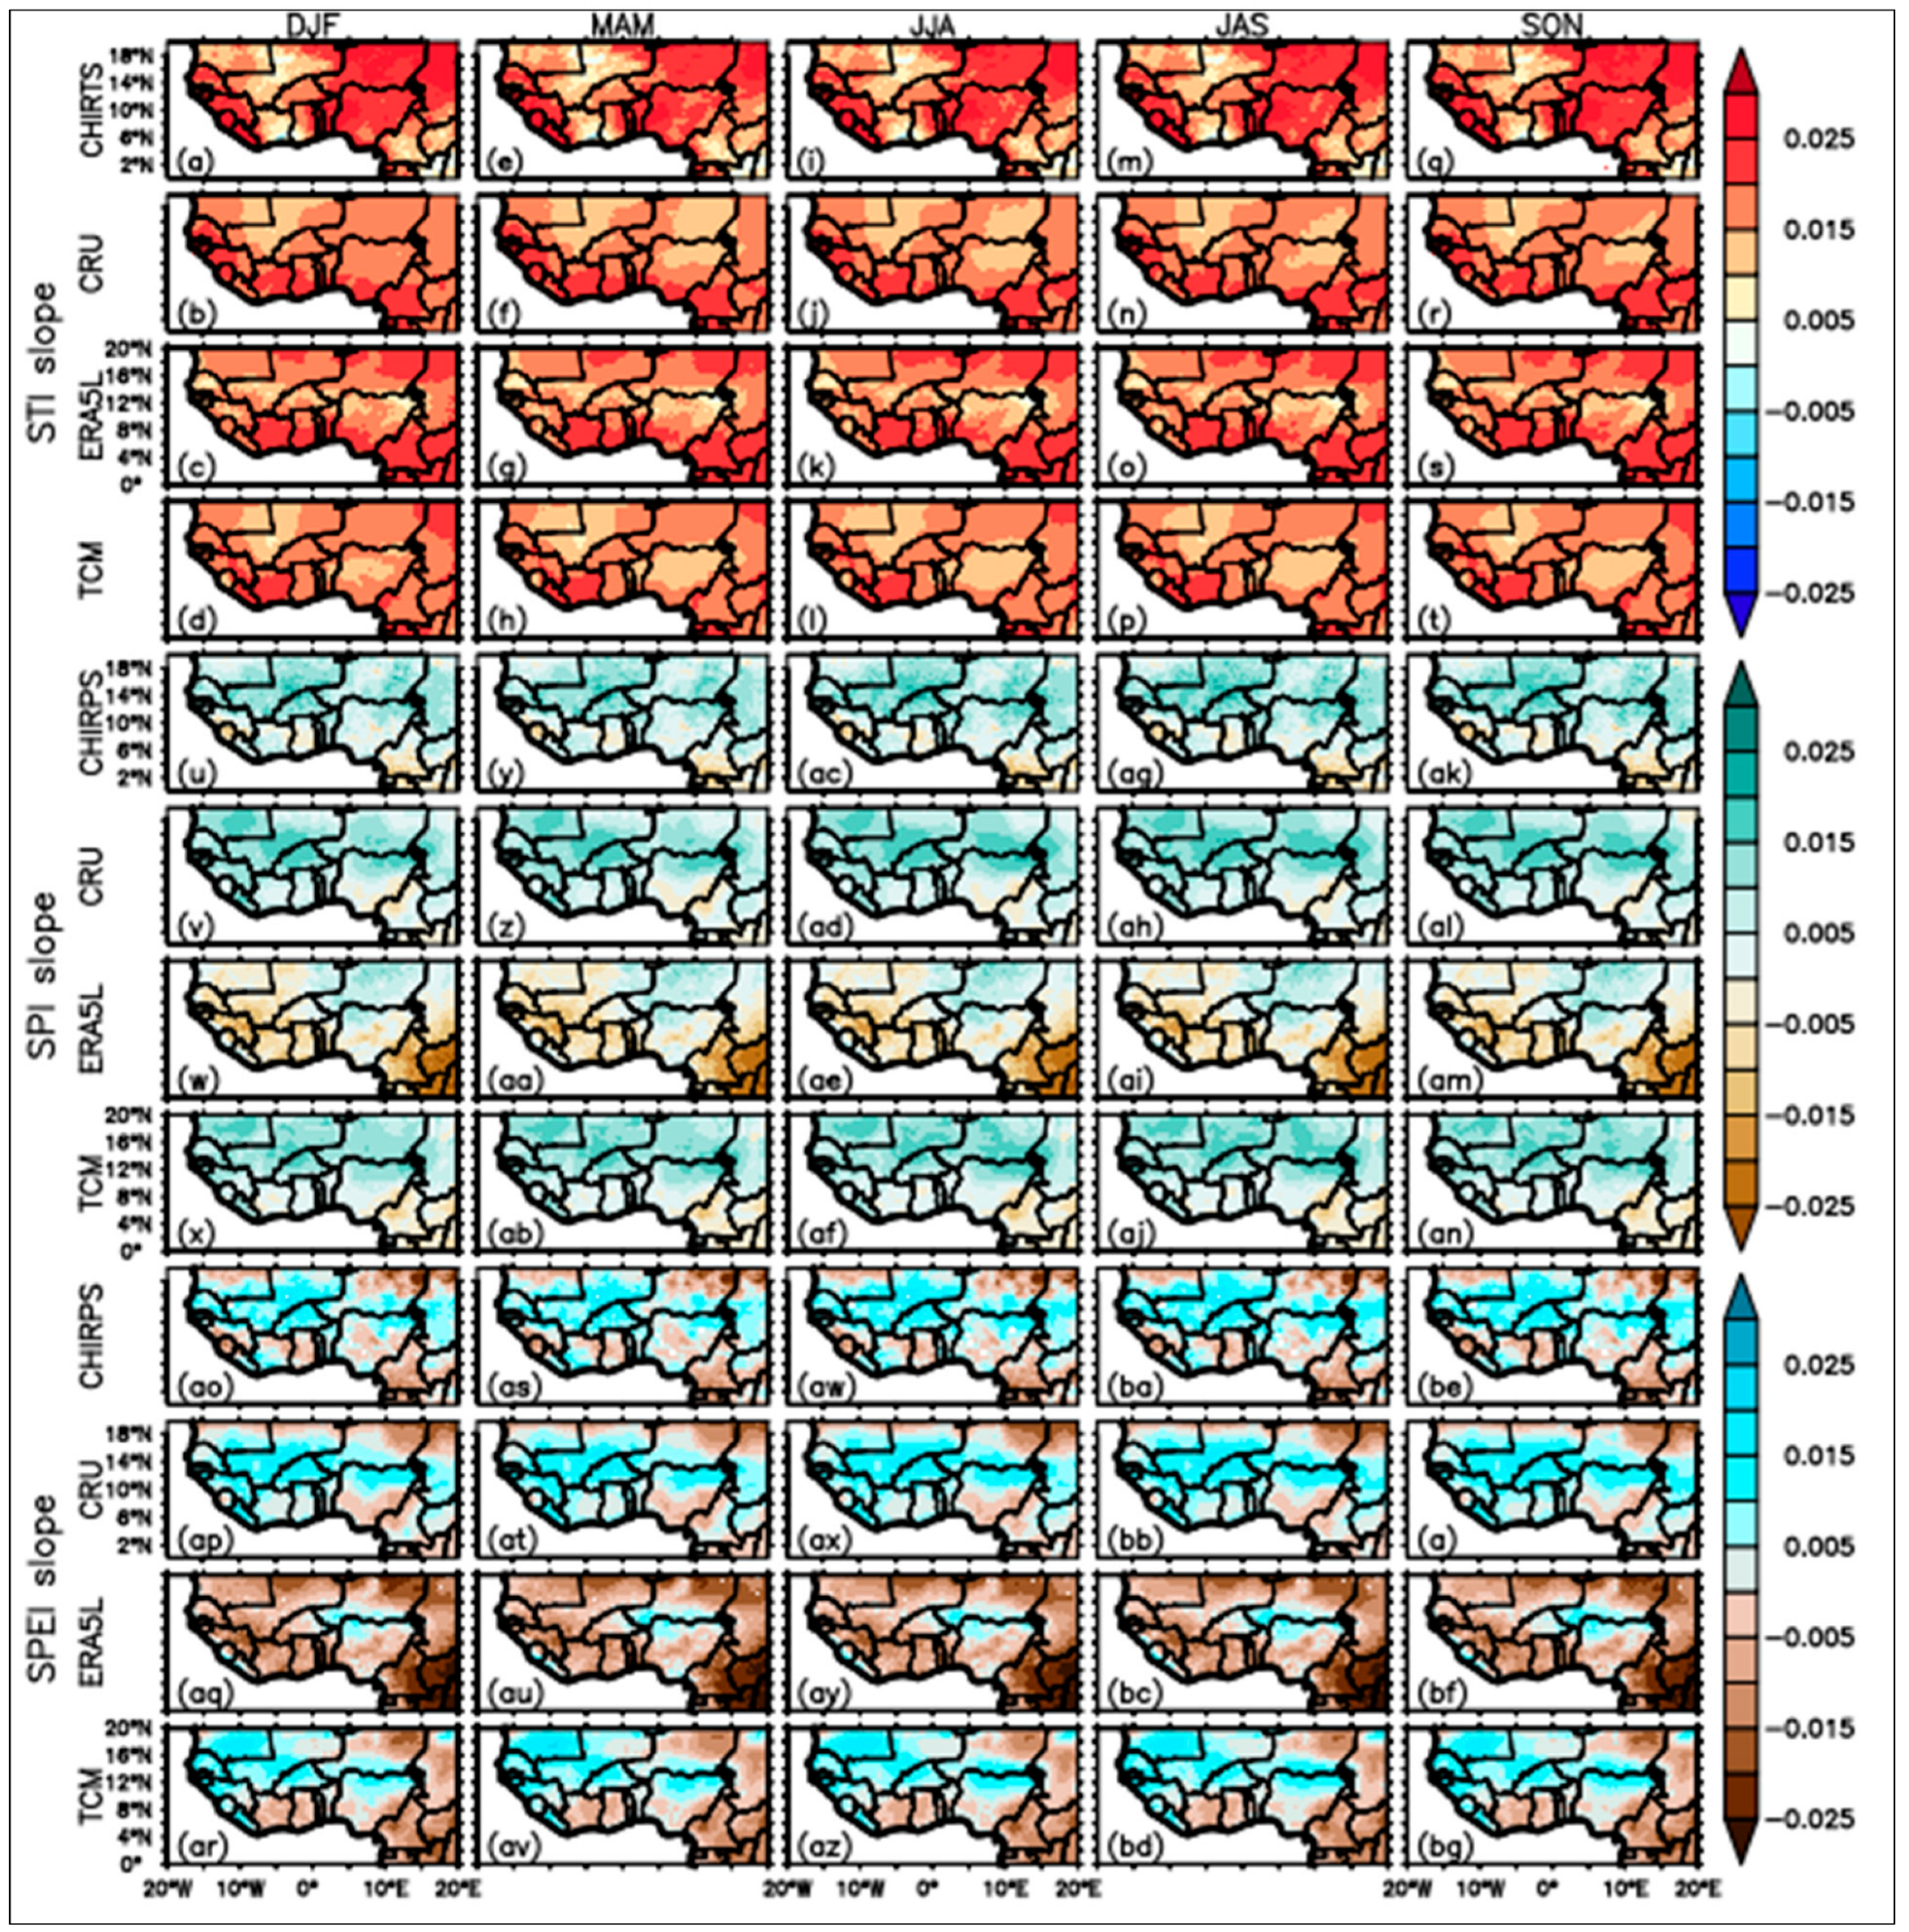
The seasonal Mann–Kendall slope (Figure 11) suggests that the climatic indices are changing at a rate that varies from −0.025 to 0.025 per year between one region and another. For STI the changes are positive (0 to 0.025) everywhere for all the datasets, and suggest that temperature is increasing everywhere within West Africa from 1980 to 2020 and also for all seasons (Figure 11a–t). The SPI (Figure 11u–an) and SPEI indices (Figure 11ao–bg), on the other hand, suggest an increase in precipitation mostly in the Sudan and Sahel zone, with few changes in the Guinean and the Sahara zones. Three datasets (CHIRTS/CHIRPS, CRU, TCM) show similar decreases based on their SPEI values, except that the decrease is much greater than seen for the SPI. ERA5-Land, however, shows significant decreases based on the SPI and SPEI values.

3.8. Climatic Risk of West Africa: Occurrence Frequency and Probability of Occurrence

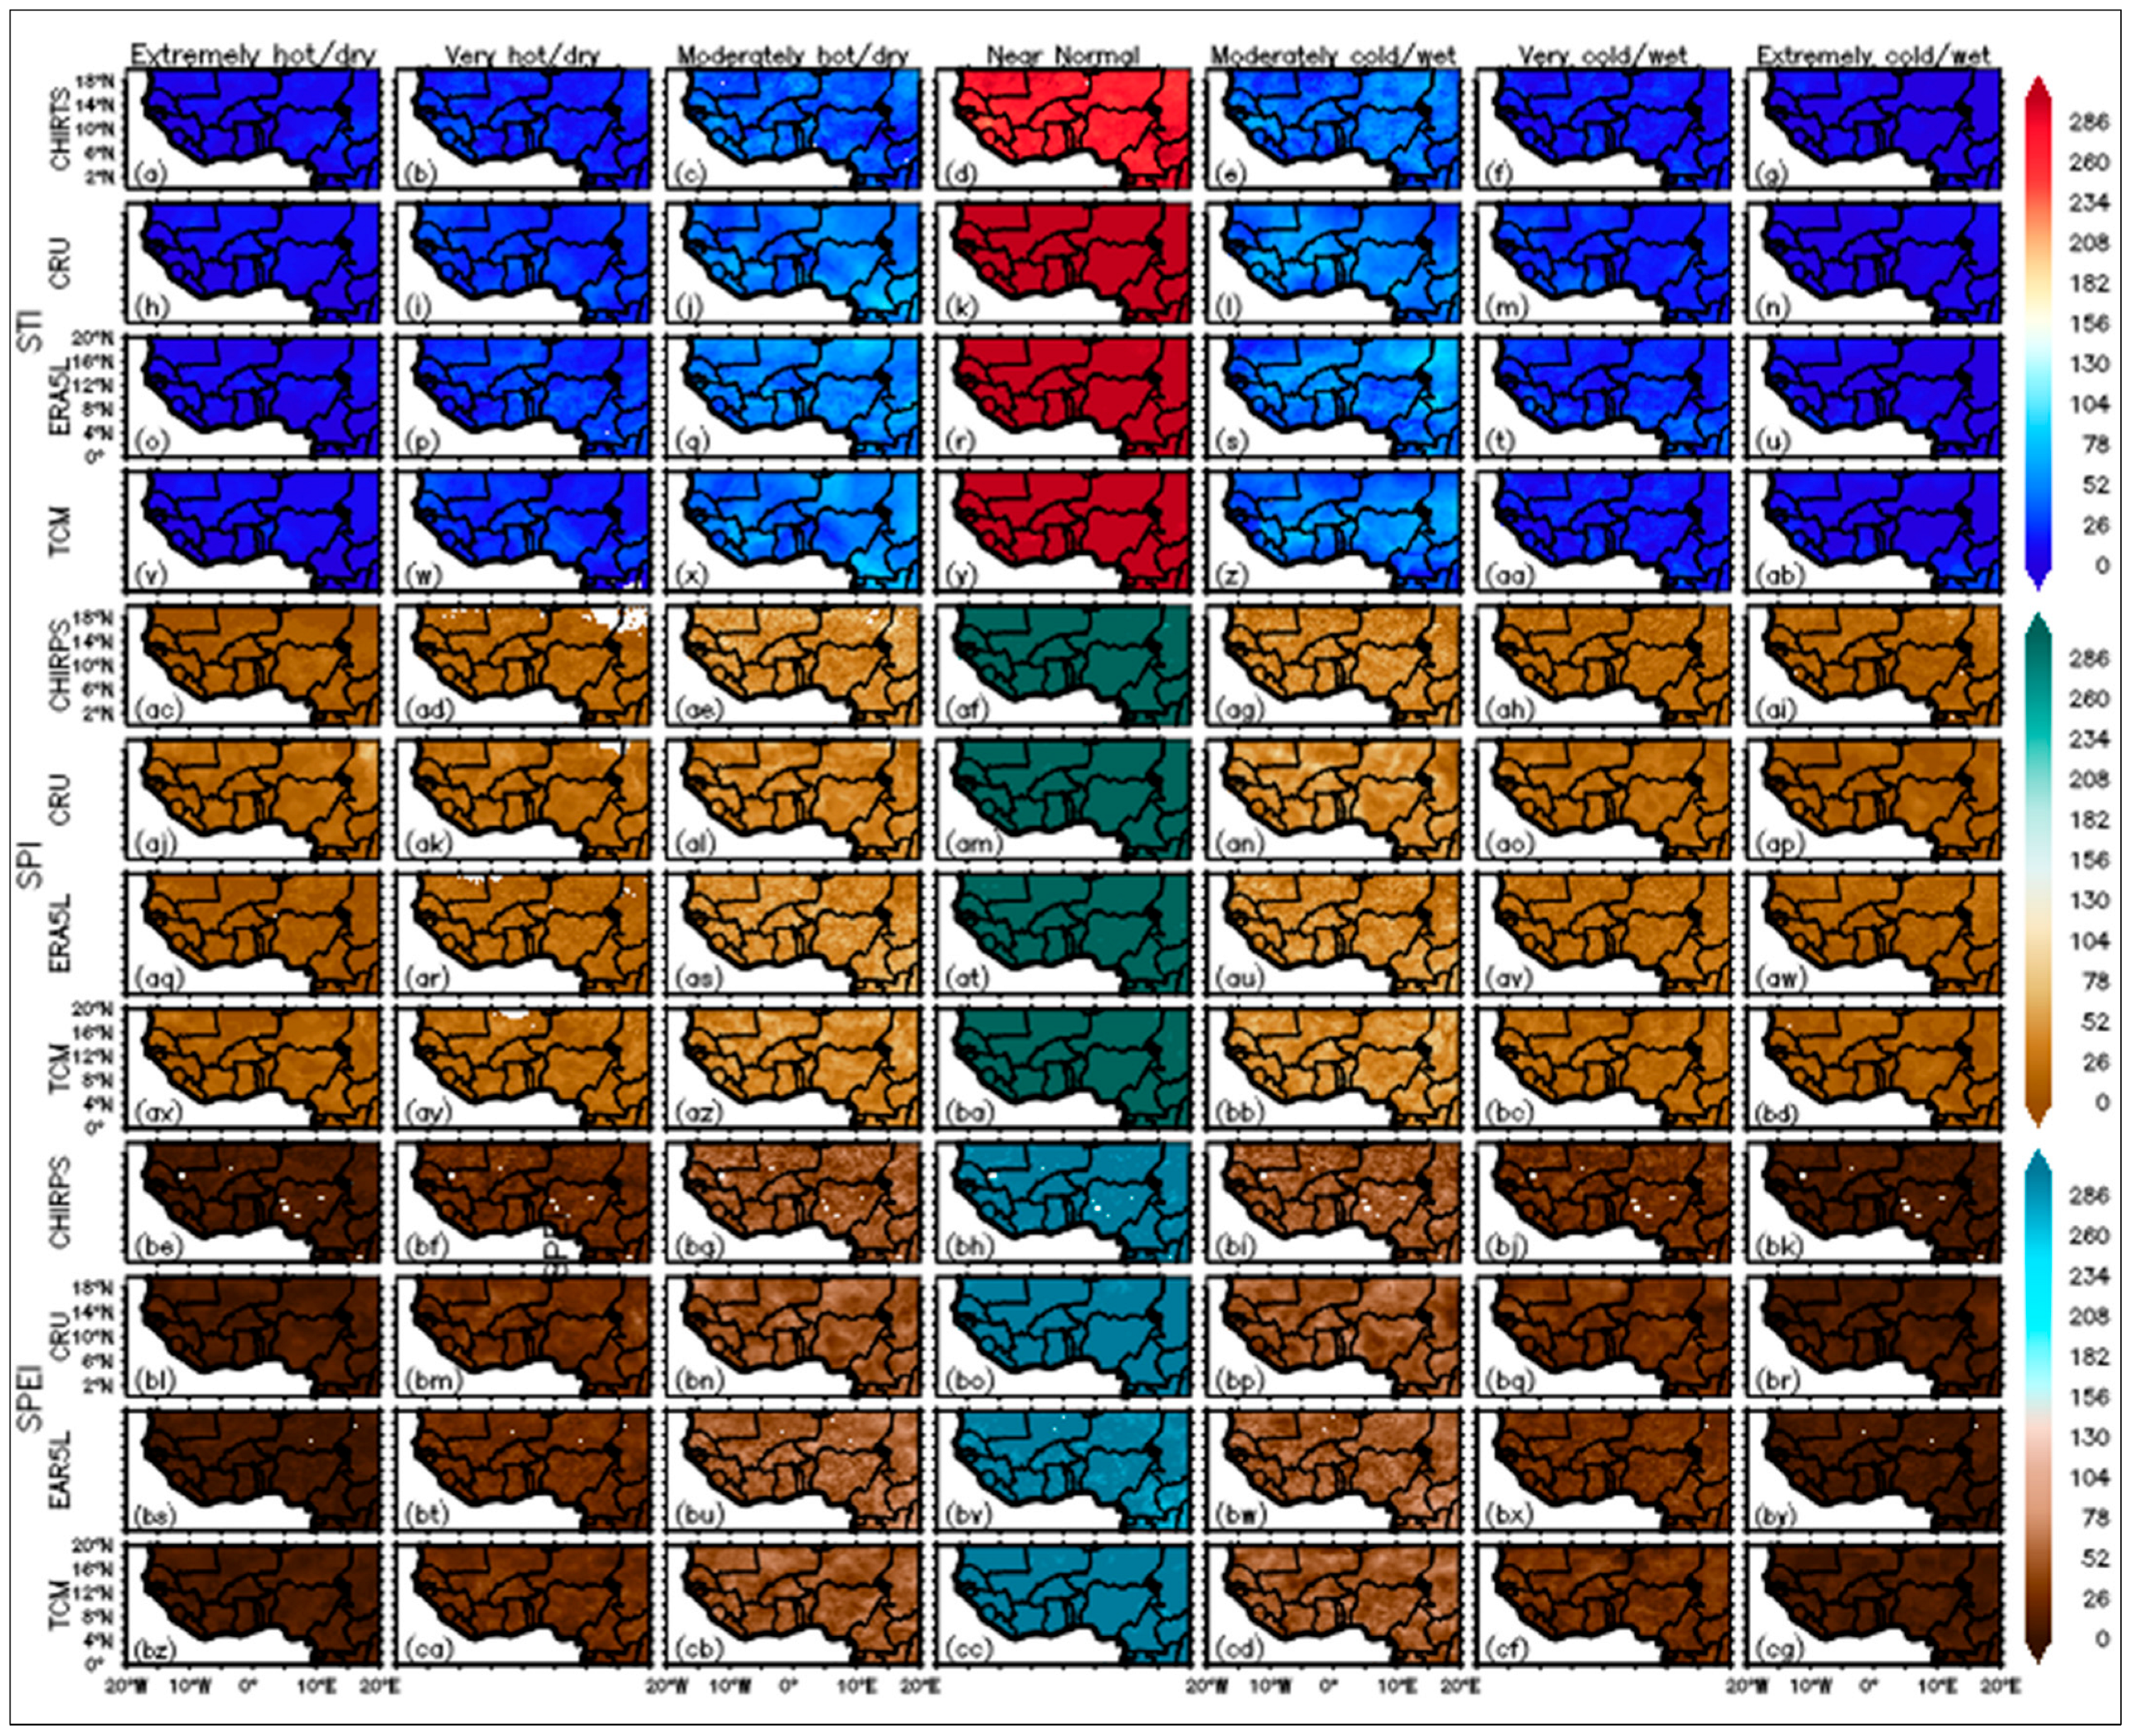
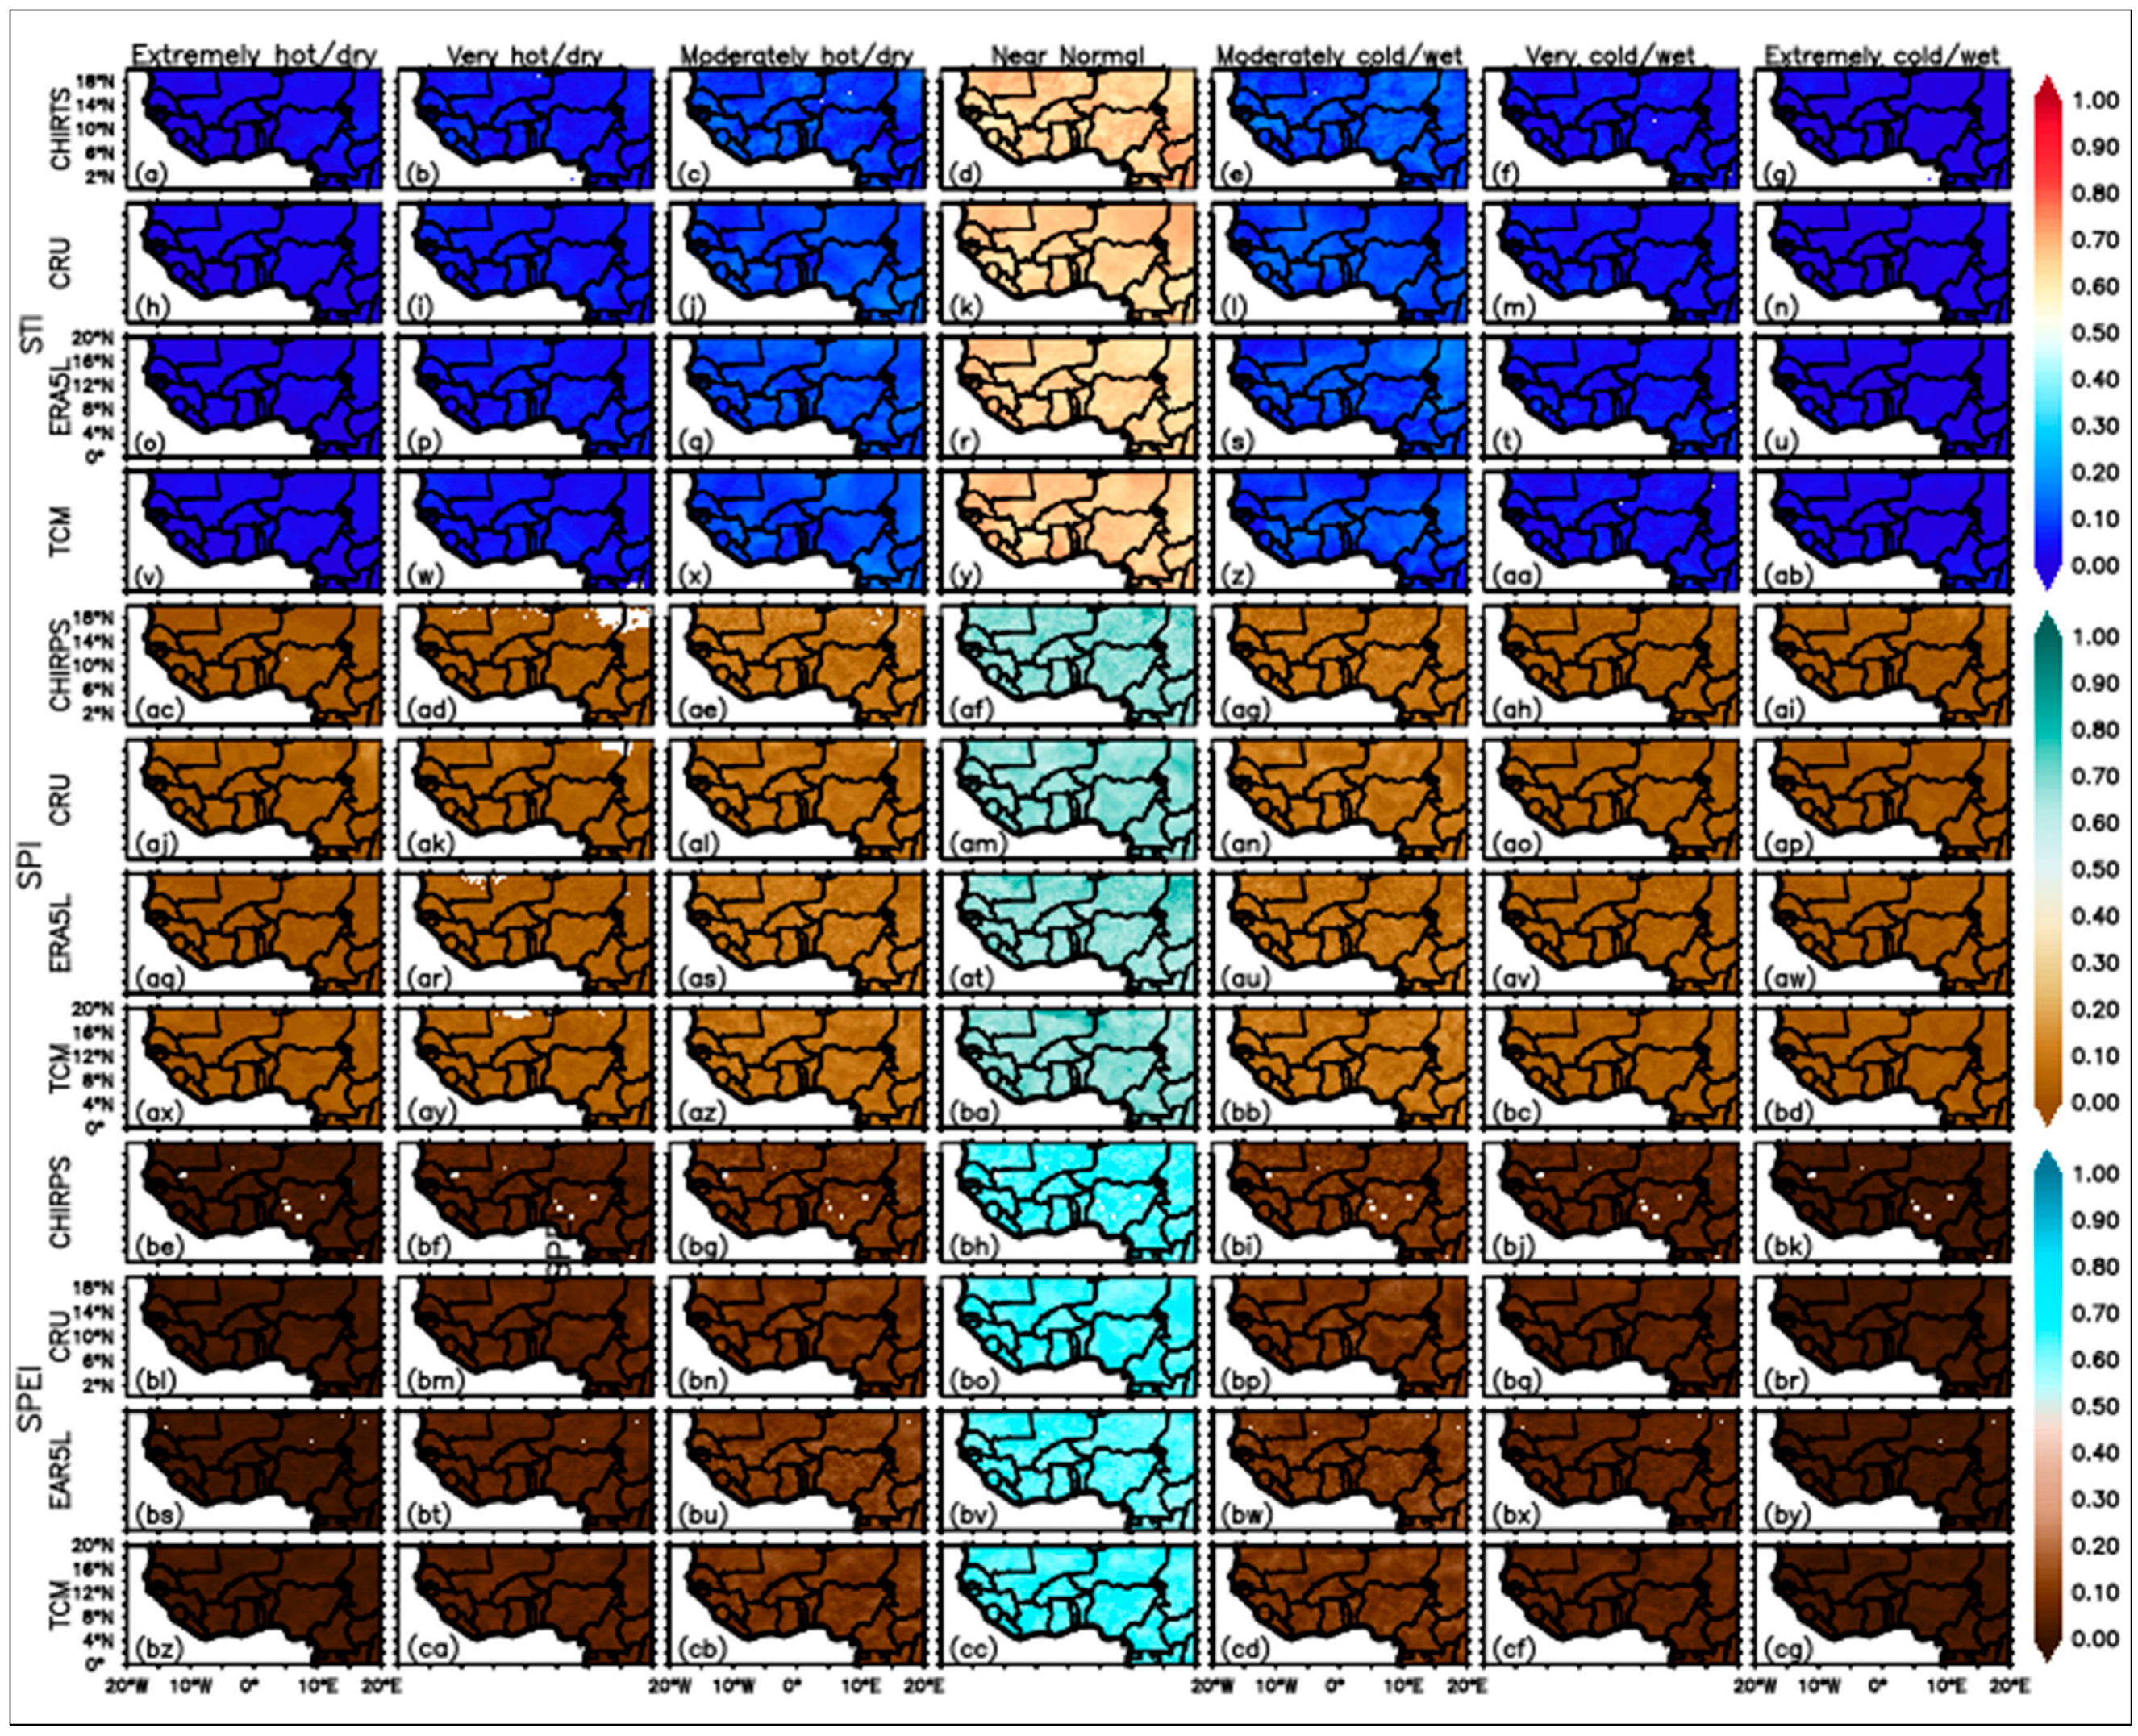
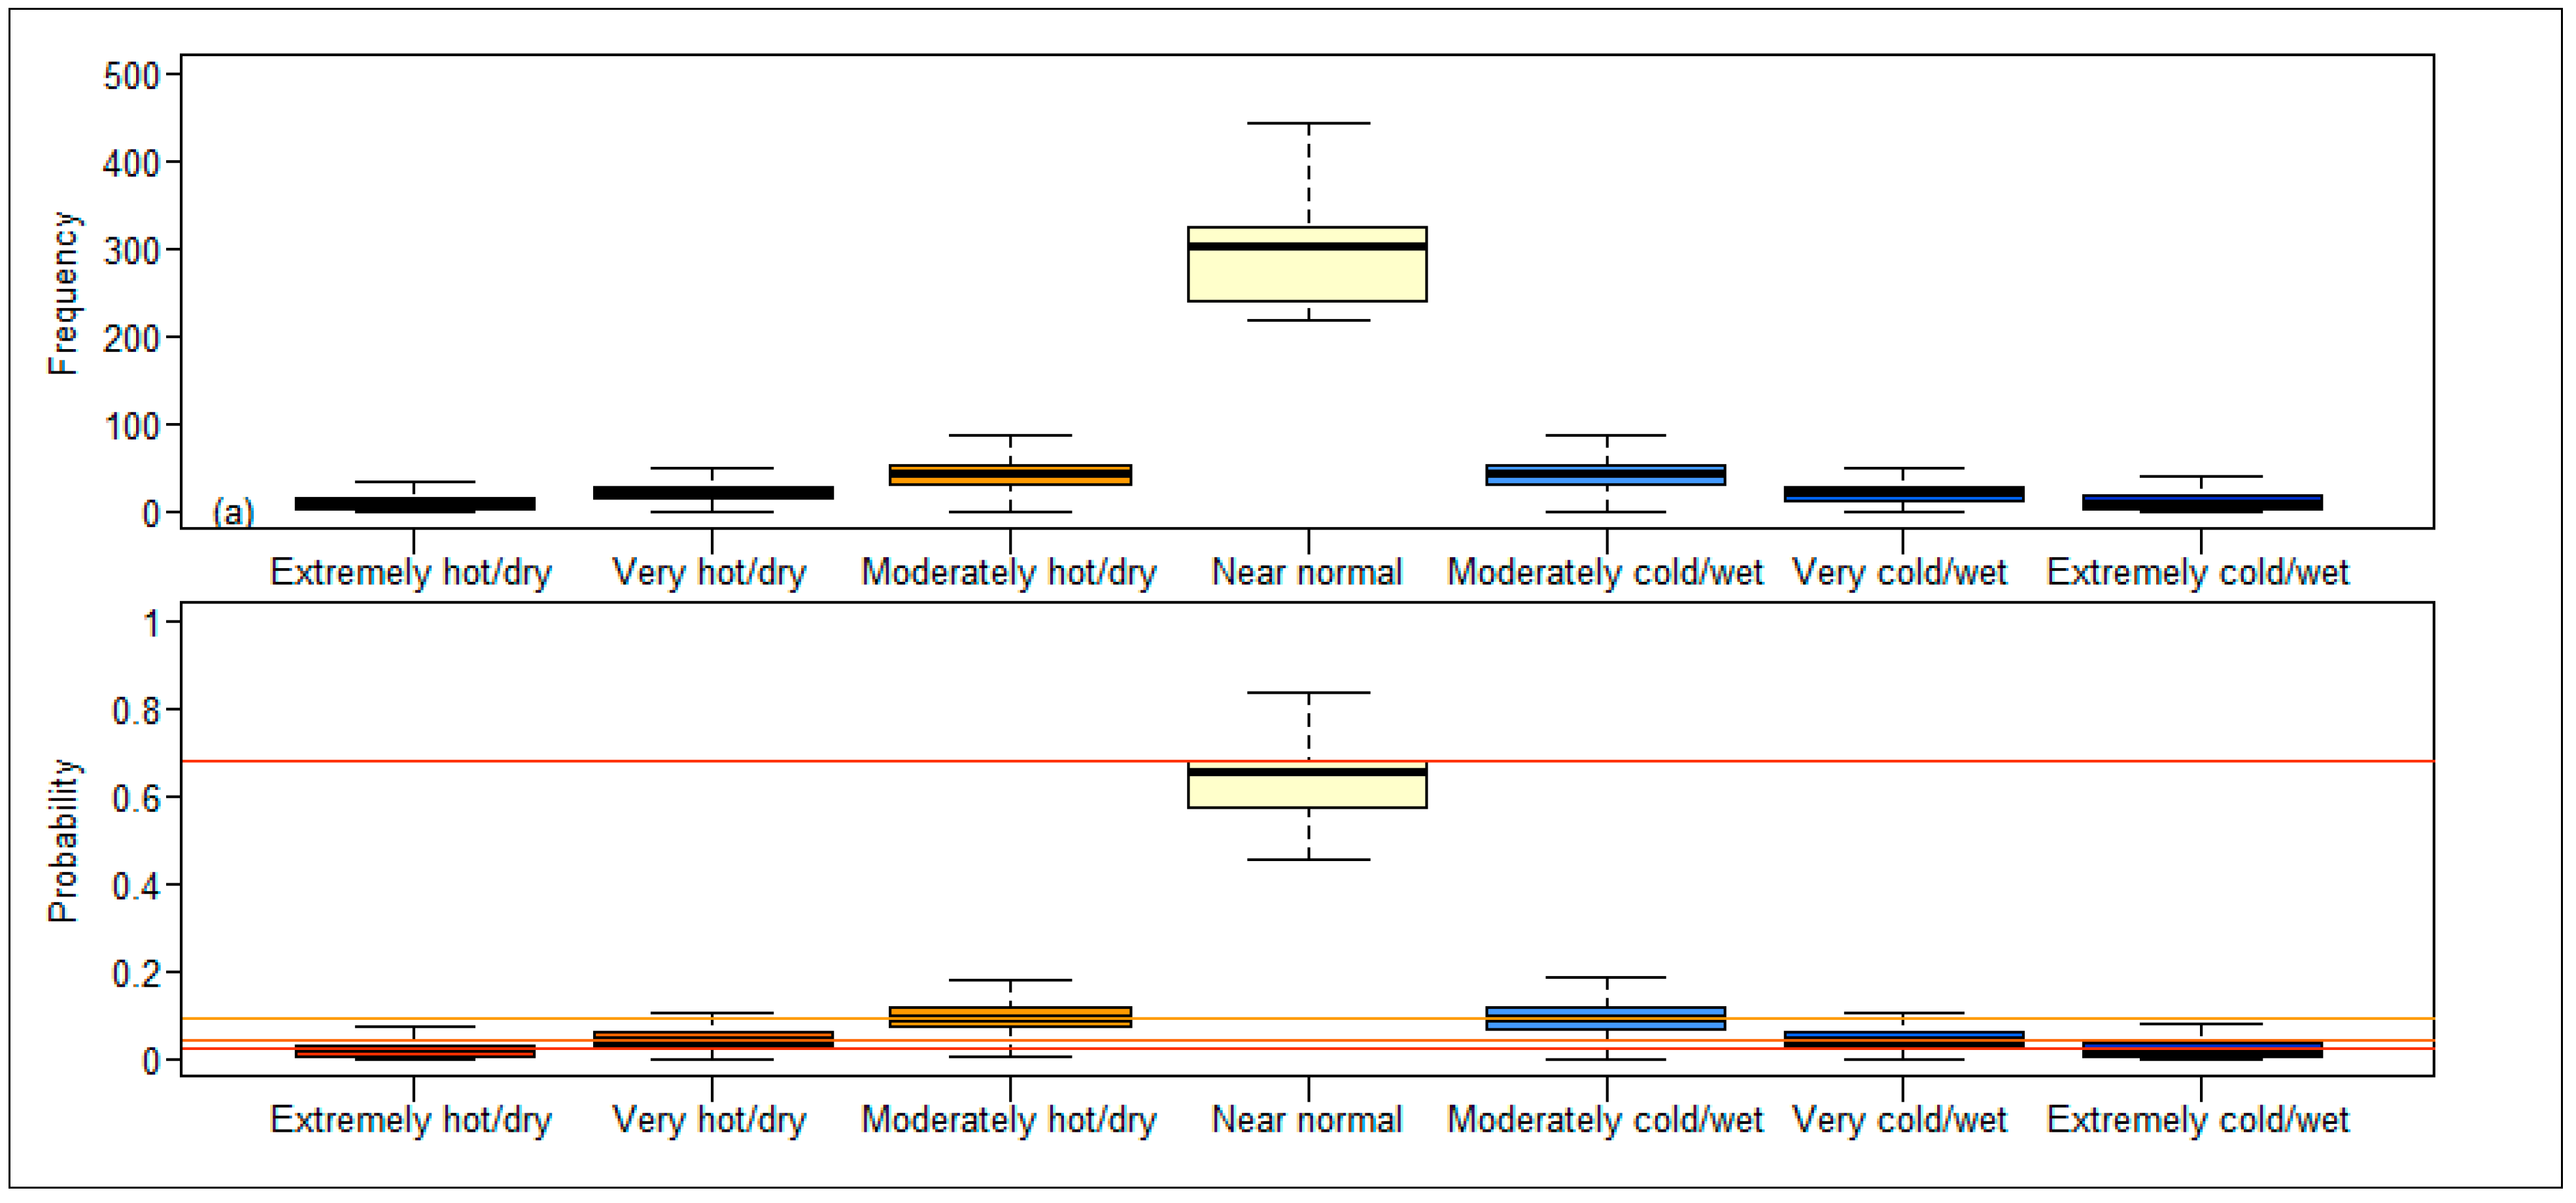
The occurrence frequency and probability of occurrence of the various climatic conditions are shown in Figure 12 and Figure 13, respectively, below. Based on both parameters, the West African region is subjected mainly to a normal climate with an average probability of occurrence of about 0.6 for all the datasets. The occurrence frequencies and probability of occurrence both decrease further with a departure from the normal climate consistent with theoretical values in Table 2 and Table 3. We summarize here the probability of occurrence and the occurrence frequency of the climatic conditions for all three climatic indices using boxplots (Figure 14), where the horizontal lines in Figure 14b are the theoretical probability of occurrence. The spatial representation of these frequencies and probabilities for the various indices over West Africa are also shown in Figure 12 and Figure 13.

4. Discussion

4.1. Spatiotemporal Land Cover Changes

Analysis of the spatiotemporal land cover changes over West Africa reveal changes from the Guineo–Congolia zone to the Sahara zone. Out of about 74.7 million pixels analyzed per year from 1992 to 2019, only 5433,127 pixels, representing 7.28% of the entire West African space, have changed. Of these, 97.989%, 2.097%, and 0.005% of the pixels changed one time, two times, and three times, respectively. According to [15,35] the number of times a pixel changes is an indication of a quality flag, such that one-time changes are more reasonable, whilst three-times changes represent more unreasonable changes. The fact that over about 98% of the total changes are one-time changes indicates that the ESA LC maps can capture changes in West Africa and may be useful for land cover change analysis over the region. The result obtained in this work is comparable to [11] who found one-time changes from 1992 to 2015 to be 98% at the global continental scale. Cotillon & Tappan, 2016 [3], investigating the drivers of land cover changes in West Africa, noted that the myriad of factors responsible for land cover changes may be categorized into human activities and natural factors acting on the earth. One the one hand, population size and growth are the major human activities leading to changes in land use and land cover, while climate change is the most dynamic natural force affecting land cover changes on annual and decadal timescales [3]. On the other hand, [4] noted that, while land cover change intensities provide evidence to support the role of population pressure as a force of change, the spatial distribution patterns of human footprint suggest that not only population pressure but also changing policies and socioeconomic conditions determine the complexity of land cover outcomes. In the midst of unaccounted impacts of changing socioeconomic conditions and population growth, our findings show incidences of correlations between land cover changes and climatic changes, detectable at annual timescales. Under the same uncertainties, our classification and transitional analysis of the changed pixels based on the IPCC classification scheme suggests the major land cover changes over West Africa are in forests, cropland, grassland and shrubland land cover types. Thus, from the perspective of our transitional analysis of the ESA land cover data, forests, cropland, grassland and shrubland changes are arguably the dominant land cover types affecting the West African climate. It will be useful for the climate modeling community in West Africa to evaluate the ability of ESA land cover data to reproduce the West African land cover.

4.2. Land Cover Transitions

The land cover transitions in the ESA LC maps reveal two major striking pieces of information. On the one hand, cropland, forest, and sparse vegetation, including grass and shrub land cover types, exhibit changes in land cover change area and automatically are the land cover types possible in ESA LC maps for investigating the impact of West African land surface on regional climate. This is also consistent with [35], i.e., that the change detection in the CCI maps is based on six IPCC land categories, namely cropland, forest, grassland, wetland, settlement, and other land (shrubland, sparse vegetation, bare, water). While this was intended to meet the needs expressed by the climate modeling community to avoid false change detection between LC classes that are semantically close [35], our transitional analysis of the changed pixels shows wetland and urban cover remains constant and in addition to bare areas and water, even though there are interannual changes of these classes in the ESA LC maps. This piece of information reveals limitations in the ESA LC maps’ capability to capture changes related to wetland, urban, bare, and water coverage over the region. It could, however, result from the fact that three out of four of these classes are obtained from external data sources, and that their area coverage is also small (<7% in total). For instance, wetland, as used here, is “tree cover, flooded, saline water” based on the global mangrove atlas; “urban areas” relies on both the Global Urban Footprint and the Global Human Settlement Layer; and water results from a compilation of static CCI global maps of open water bodies, originally at 150 m resolution, resampled to 300 m using an average algorithm [35]. The fact that these classes remain constant in the transition from 1992 to 2019 implies that the ESA CCI maps have limited applicability in detecting changes in wetland and urban cover over West Africa, and need region-specific evaluation for climate applications, as expressed by [18].

4.3. Annualized Land Cover Change Intensities

In this work, both spatiotemporal land cover change analysis and land cover change intensity analysis were used. While spatiotemporal land cover change analysis allows identifying changed pixels, the annualized land cover intensity analysis is the unique analysis employed to identify years where possible links between climate variation and land cover changes do exist. Specifically, the annualized land cover change intensities reveal abrupt large changes in some years and smaller changes in others, allowing us to select the specific years and investigate the climatic conditions related to the different land cover changes. For instance, while a general increase in the land cover change area results from a greater increase in temperature with a corresponding increase in precipitation and climatic water balance in 1995, the change in land cover area in 2016 results from a minimal increase in temperature with similar precipitation and climatic water balance increase. Temperature changes are thus critical to the abruptness of increase in land cover change area, while regional decreases in precipitation are hardly associated with significant changes in land cover area. The annualized land cover change intensities under normal climate conditions also help to justify why abrupt climatic changes are indeed related to abrupt land cover changes.

4.4. Climatic Conditions Leading to Significant Land Cover Changes

Temperature, precipitation, and climatic water balance conditions were linked to abrupt land cover changes using the standardized climatic indices (STI, SPI, and SPEI) over a 12-month timescale. A 12-month timescale was chosen primarily because the land cover dataset for which we intended to establish a relation with climate had a temporal resolution of one year, making a comparison with climatic indices at an annual timescale reasonable. Consequently, by comparing land–climate information at the same timescales, we delineate those climatic conditions contributing to the observed land cover changes. In general, the climate of West Africa from 1980 to 2020 may be divided into two episodes: a relatively cold (dry) episode between 1980 and 2000, and a relatively warm (wet) episode from 2000 to 2020. This is consistent with [36] who investigated how aridity had changed over West Africa over four decades, and found the 1979–1998 period to be driest and less warm than the 2000–2019 period, with expansion in wet areas and more intense warming. It has been also been shown that changes in land use and land cover have effects on climate through various pathways that modulate land surface temperature and rainfall [37], but very few studies have established links over West Africa. Our analysis of multiple climate datasets shows that within the colder climate regime (1980–2000), the most intense land cover area changes were observed at the peak between two successive colder climate regimes, and for abrupt changes from a hotter climate to a colder climate. Conversely, for a hotter climate, the most significant land cover changes occurred at the peaks between two successive hot climatic conditions, or during a sharp change from a cold to a hot climate. The observed climate–land relations described above involve critical points (maximum, minimum, and points of inflection) which can be delineated by the critical point theory of the fundamental rules of calculus. We recall that the slope (first derivative) is 0 at maximum and minimum turning points (extrema), and the second derivative is 0 and goes through a concavity change (points of inflection) [38]. Thus, the peak conditions are turning points where the differential (slope) of the climatic indices equals zero irrespective of the climate episode (hot or cold). On the other hand, migration from hot (cold) to cold (hot) is designated by events where the slope of the climatic indices is negative (positive). From the above analysis, we suggest that Sen’s slope be used primarily for delineating the average climatic condition that a region is exposed to in a long term. Secondly, the climatic conditions coincidental with significant land cover changes in specific years could be delineated using the changes in climatic conditions before and during those years. Finally, the probability of occurrence of STI, SPI, and SPEI is recommended to characterize the relative exposure of different regions to different climatic impacts. Sen’s slope approach used in this work suggests an annual rate of change between 0.015 and 0.025 over West Africa, which is consistent with [36], who found an annual rate of change of 0.018 over West Africa using only the CRU dataset. The second approach shows that an interannual temperature change of −1.0 to 1.0 °C, about 50 mm change in precipitation, and a 40–50 mm change in climatic water balance over West Africa could lead to an annual land cover change area of 45,039 to 52,133 km2, while a temperature change of 0 to +1.5 °C with the same precipitation and climatic water balance conditions over the region could result in a land cover change area of 20,935 to 22,127 km2. A temperature change of −0.5 to 0.5 °C, about 50 mm change in precipitation, and a 40–50 mm change in climatic water balance over the region could result in a land cover change area of about 31,834 km2. Finally, the probability of occurrence of the various climatic conditions of West Africa using the four different datasets is consistent with the well-known values in the literature, with the normal climate at approximately 0.6 and decreasing with departure from the normal climate.
The limitation of this work is that it is purely an analysis that considers land cover data and climatic data to establish a climate–land cover change relationship. While we believe that our approach is systematic and that the findings could be useful, we also emphasize that many factors like socioeconomic conditions and policies were not taken into account. This work thus has room for improvement and can be considered an initial analysis that identifies incidences where climatic changes correlate with land cover changes in West Africa. We encourage the scientific community, mostly climate modeling experts in West Africa, to use the ESA LC maps, assess their usefulness and report their findings. Important research can focus on developing a suitable classification scheme for West Africa based on the ESA LC maps, which will improve land cover classification over the current scheme used in the ESA LC maps.

5. Conclusions

Climate–land interaction is an active field of research and forms the basis for improving climate models and land surface models for regional studies. This study adopts a timeseries analysis of ESA LC maps from 1992 to 2019 and of the standardized temperature, standardized precipitation, and standardized precipitation evapotranspiration indices to establish links between land cover changes and climatic changes over West Africa. While the ESA LC maps prove efficient for capturing land cover changes, they are limited in their ability to capture changes related to wetlands and urban cover, and in addition to bare and water-covered areas, which may be of interest to other climate-related studies. The ESA LC maps essentially capture changes related to cropland, forest, grassland, and shrubland conversions. Spatiotemporal analysis of climatic indices and annualized land change intensities shows that the main climatic impact on land cover changes in West Africa results mostly from abrupt changes from one climatic condition to another, or from changes in temperature with increases in precipitation and climatic water balance. Conversely, the conversion of cropland, forest, shrubland, and grassland are the major land cover changes affecting the climate of West Africa. With abrupt changes in the climate condition, the level of land cover change, which is normally below 20,000 km2 in a typical year, could be twice as high. The scientific contributions and innovation of this work are outlined below. First, the links between climate and land cover changes had been understood using climate models, which remain the best method but are expensive. In this work, we demonstrate the possibility of assessing the links between climatic changes and land cover changes by analysing land cover changes and historical climate data. Our proposed method is less expensive because it can be used without a high-performance computing infrastructure. We encourage the scientific community to adapt, critique, and improve the technique. Second, the use of multi-year land cover datasets is yet another valuable inclusion of this research, which is difficult even for the climate modeling community, owing to computation costs and the lack of globally consistent land cover data. Finally, this work primarily informs the scientific and climate modeling community in West Africa of the usefulness of the ESA land cover data to capture changes in forests, grasslands, shrubland, and sparse vegetation changes, and its limitation to detect other changes such as wetland, urban, bare and water cover. This work is thus the first regional evaluation of the land cover changes captured by the ESA LC maps in the West African space. Ultimately, this research provides historical evidence for the land cover conversion types impacting the West African climate, and also establishes a basis for regional climate modelers to re-evaluate the climate and land cover information when using the ESA LC maps over the region. Future works should focus on developing an alternative classification scheme based on the ESA 300 m land cover data to improve the land cover classification of West Africa. We also recommend that future research should include population growth and changing socioeconomic conditions, which are missing in this research because of the lack of data.

Author Contributions

Conceptualization, E.M.M., T.A., J.A. and E.K.N.; Methodology, E.M.M., J.A. and H.K.; Formal analysis, E.M.M. and M.M.I.; Investigation, E.M.M.; Data curation, S.M. and E.K.N.; Writing—original draft, E.M.M.; Writing—review & editing, E.M.M., T.A., J.A., M.M.I., S.M., H.K. and E.K.N.; Supervision, T.A., J.A., M.M.I., S.M., H.K. and E.K.N. All authors have read and agreed to the published version of the manuscript.

Funding

The authors acknowledge with thanks the scholarship and financial support provided by BMBF, the Federal Ministry of Education and Research of Germany, and the West African Science Service Center on Climate Change and Adapted Land Use (WASCAL).

Institutional Review Board Statement

Not applicable.

Informed Consent Statement

Not applicable.

Data Availability Statement

Not applicable.

Conflicts of Interest

The authors have no competing interests to declare that are relevant to the content of this article.

Appendix

Figure A1 and Figure A2 compares the climatic conditions before abrupt land cover changes and climatic conditions during abrupt land cover changes respectively. Figure A1a–t, Figure A1u–an, and Figure A1ao–bg represent STI, SPI and SPEI conditions before the abrupt land cover changes were experienced. Similarly, Figure A1a–t, Figure A1u-an, and Figure A1ao-bg represent STI, SPI and SPEI conditions during which the abrupt land cover changes were experienced.
Figure A1. (abg) Climatic conditions before abrupt land cover changes.
Land 12 00355 g0a1
Figure A2. (abg) Climatic conditions during abrupt land cover changes.
Land 12 00355 g0a2

References

  1. Dale, V.H. The Relationship between Land-use Change and Climate Change. Ecol. Appl. 1997, 7, 753–769. [Google Scholar] [CrossRef]
  2. Gao, J.; Liu, Y. Climate Warming and Land Use Change in Heilongjiang Province, Northeast China. Appl. Geogr. 2011, 31, 476–482. [Google Scholar] [CrossRef]
  3. Cotillon, S.E.; Tappan, G.G. Landscapes of West Africa: A Window on a Changing World; United States Geological Survey: Garretson, SD, USA, 2016. [Google Scholar]
  4. Herrmann, S.M.; Brandt, M.; Rasmussen, K.; Fensholt, R. Accelerating Land Cover Change in West Africa over Four Decades as Population Pressure Increased. Commun. Earth Environ. 2020, 1, 53. [Google Scholar] [CrossRef]
  5. Deng, X.; Zhan, J.; Su, H. Land Use Impacts on Climate; Springer: Cham, Switzerland, 2014. [Google Scholar] [CrossRef]
  6. Sylla, M.B.; Pal, J.S.; Wang, G.L.; Lawrence, P.J. Impact of Land Cover Characterization on Regional Climate Modeling over West Africa. Clim. Dyn. 2016, 46, 637–650. [Google Scholar] [CrossRef]
  7. Diba, I.; Camara, M.; Sarr, A.B.; Diedhiou, A. Potential Impacts of Land Cover Change on the Interannual Variability of Rainfall and Surface Temperature over West Africa. Atmosphere 2018, 9, 376. [Google Scholar] [CrossRef] [Green Version]
  8. Achugbu, I.C.; Olufayo, A.A.; Balogun, I.A.; Adefisan, E.A.; Dudhia, J.; Naabil, E. Modeling the Spatiotemporal Response of Dew Point Temperature, Air Temperature and Rainfall to Land Use Land Cover Change over West Africa. Model Earth Syst. Environ. 2021, 8, 173–198. [Google Scholar] [CrossRef]
  9. Sawadogo, W.; Abiodun, B.J.; Okogbue, E.C. Projected Changes in Wind Energy Potential over West Africa under the Global Warming of 1.5 °C and Above. Theor. Appl. Climatol. 2019, 138, 321–333. [Google Scholar] [CrossRef]
  10. Annor, T.; Lamptey, B.; Washington, R. Assessment of the Unified Model in Reproducing West African Precipitation and Temperature Climatology. Theor. Appl. Climatol. 2022, 148, 779–794. [Google Scholar] [CrossRef]
  11. Liu, X.; Yu, L.; Li, W.; Peng, D.; Zhong, L.; Li, L.; Lu, H.; Yu, C.; Gong, P. Comparison of Country-Level Cropland Areas between ESA-CCI Land Cover Maps and FAOSTAT Data. Int. J. Remote Sens. 2018, 39, 6631–6645. [Google Scholar] [CrossRef]
  12. Jiang, L.; Yu, L. Analyzing Land Use Intensity Changes within and Outside Protected Areas Using ESA CCI-LC Datasets. Glob. Ecol. Conserv. 2019, 20, e00789. [Google Scholar] [CrossRef]
  13. Li, W.; Macbean, N.; Ciais, P.; Defourny, P.; Lamarche, C.; Bontemps, S.; Houghton, R.A.; Peng, S. Gross and Net Land Cover Changes in the Main Plant Functional Types Derived from the Annual ESA CCI Land Cover Maps (1992–2015). Earth Syst. Sci. Data 2018, 10, 219–234. [Google Scholar] [CrossRef] [Green Version]
  14. Liu, S.; Liu, X.; Yu, L.; Wang, Y.; Zhang, G.J.; Gong, P.; Huang, W.; Wang, B. Climate Response to Introduction of the ESA CCI Land Cover Data to the NCAR CESM. Clim. Dyn. 2021, 56, 4109–4127. [Google Scholar] [CrossRef]
  15. Liu, X.; Yu, L.; Sia, Y.; Zhang, C.; Lu, H.; Yu, C.; Gong, P. Identifying Patterns and Hotspots of Global Land Cover Transitions Using the ESA CCI Land Cover Dataset. Remote Sens. Lett. 2018, 9, 972–981. [Google Scholar] [CrossRef]
  16. Guidigan, M.L.G.; Sanou, C.L.; Ragatoa, D.S.; Fafa, C.O.; Mishra, V.N. Assessing Land Use/Land Cover Dynamic and Its Impact in Benin Republic Using Land Change Model and CCI-LC Products. Earth Syst. Environ. 2019, 3, 127–137. [Google Scholar] [CrossRef]
  17. Tsendbazar, N.E.; de Bruin, S.; Fritz, S.; Herold, M. Spatial Accuracy Assessment and Integration of Global Land Cover Datasets. Remote Sens. 2015, 7, 15804–15821. [Google Scholar] [CrossRef] [Green Version]
  18. Reinhart, V.; Fonte, C.C.; Hoffmann, P.; Bechtel, B.; Rechid, D.; Boehner, J. Comparison of ESA Climate Change Initiative Land Cover to CORINE Land Cover over Eastern Europe and the Baltic States from a Regional Climate Modeling Perspective. Int. J. Appl. Earth Obs. Geoinf. 2021, 94, 102221. [Google Scholar] [CrossRef]
  19. Peng, J.; Dadson, S.; Hirpa, F.; Dyer, E.; Lees, T.; Miralles, D.G.; Vicente-Serrano, S.M.; Funk, C. A Pan-African High-Resolution Drought Index Dataset. Earth Syst. Sci. Data 2020, 12, 753–769. [Google Scholar] [CrossRef] [Green Version]
  20. Harris, I.; Osborn, T.J.; Jones, P.; Lister, D. Version 4 of the CRU TS Monthly High-Resolution Gridded Multivariate Climate Dataset. Sci. Data 2020, 7, 109. [Google Scholar] [CrossRef] [Green Version]
  21. Muñoz-sabater, J.; Dutra, E.; Agustí-panareda, A.; Albergel, C.; Hersbach, H.; Martens, B.; Miralles, D.G.; Piles, M.; Rodríguez-fernández, N.J. ERA5-Land: A State-of-the-Art Global Reanalysis Dataset for Land Applications. Earth Syst. Sci. Data 2021, 13, 4349–4383. [Google Scholar] [CrossRef]
  22. Abatzoglou, J.T.; Dobrowski, S.Z.; Parks, S.A.; Hegewisch, K.C. TerraClimate, a High-Resolution Global Dataset of Monthly Climate and Climatic Water Balance from 1958–2015. Sci. Data 2018, 5, 170191. [Google Scholar] [CrossRef] [Green Version]
  23. Verdin, A.; Funk, C.; Peterson, P.; Landsfeld, M.; Tuholske, C.; Grace, K. Development and Validation of the CHIRTS-Daily Quasi-Global High-Resolution Daily Temperature Data Set. Sci. Data 2020, 7, 303. [Google Scholar] [CrossRef] [PubMed]
  24. Funk, C.; Peterson, P.; Landsfeld, M.; Pedreros, D.; Verdin, J.; Shukla, S.; Husak, G.; Rowland, J.; Harrison, L.; Hoell, A.; et al. The Climate Hazards Infrared Precipitation with Stations—a New Environmental Record for Monitoring Extremes. Sci Data 2015, 2, 150066. [Google Scholar] [CrossRef] [PubMed] [Green Version]
  25. Singer, M.B.; Asfaw, D.T.; Rosolem, R.; Cuthbert, M.O.; Miralles, D.G.; MacLeod, D.; Quichimbo, E.A.; Michaelides, K. Hourly Potential Evapotranspiration at 0.1° Resolution for the Global Land Surface from 1981-Present. Sci. Data 2021, 8, 1–13. [Google Scholar] [CrossRef] [PubMed]
  26. Martens, B.; Miralles, D.G.; Lievens, H.; van der Schalie, R.; de Jeu, R.A.M.; Fernández-Prieto, D.; Beck, H.E.; Dorigo, W.A.; Verhoest, N.E.C. GLEAM v3: Satellite-Based Land Evaporation and Root-Zone Soil Moisture. Geosci. Model Dev. 2017, 10, 1903–1925. [Google Scholar] [CrossRef] [Green Version]
  27. Zhou, Q.; Li, B.; Kurban, A.; Kowloon, H.K.; Kong, H. Trajectory Analysis of Land Cover Change in Arid Environment of China. Int. J. Remote Sens. 2008, 29, 1093–1107. [Google Scholar] [CrossRef]
  28. McKee, T.B.; Doesken, N.J.; Kleist, J. The Relationship of Drought Frequency and Duration to Time Scales. In Proceedings of the 8th Conference on Applied Climatology; American Meteorological Society: Boston, MA, USA, 1993; Volume 17, pp. 179–183. [Google Scholar] [CrossRef]
  29. Edwards, D.C.; McKee, T.B. Characteristics of 20th Century Drought in the United States at Multiple Time Scales; Air Force Institute of Technology: Wright-Patterson AFB, OH, USA, 1997; p. 298. [Google Scholar]
  30. Vicente-Serrano, S.M.; Beguería, S.; López-Moreno, J.I. A Multiscalar Drought Index Sensitive to Global Warming: The Standardized Precipitation Evapotranspiration Index. J. Clim. 2010, 23, 1696–1718. [Google Scholar] [CrossRef] [Green Version]
  31. Liu, C.; Yang, C.; Yang, Q.; Wang, J. Spatiotemporal Drought Analysis by the Standardized Precipitation Index (SPI) and Standardized Precipitation Evapotranspiration Index (SPEI) in Sichuan Province. Sci. Rep. 2021, 11, 1280. [Google Scholar] [CrossRef]
  32. Danandeh Mehr, A.; Vaheddoost, B. Identification of the Trends Associated with the SPI and SPEI Indices across Ankara, Turkey. Theor. Appl. Climatol. 2020, 139, 1531–1542. [Google Scholar] [CrossRef]
  33. Yildirim, G.; Rahman, A. Homogeneity and Trend Analysis of Rainfall and Droughts over Southeast Australia. Nat. Hazards 2022, 112, 1657–1683. [Google Scholar] [CrossRef]
  34. Akpoti, K.; Antwi, E.; Kabo-bah, A. Impacts of Rainfall Variability, Land Use and Land Cover Change on Stream Flow of the Black Volta Basin, West Africa. Hydrology 2016, 3, 26. [Google Scholar] [CrossRef] [Green Version]
  35. Defourny, P.; Bontemps, S.; Lamarche, C.; Brockmann, C.; Boettcher, M.; Wevers, J.; Kirches, G. Land Cover CCI: Product User Guide Version 2.0. Available online: http://maps.elie.ucl.ac.be/CCI/viewer (accessed on 10 February 2022).
  36. Daramola, M.T.; Eresanya, E.O.; Erhabor, S.C. How Has Aridity Changed over West Africa in the Past Four Decades? J. Afr. Earth Sci. 2023, 197, 104745. [Google Scholar] [CrossRef]
  37. Gogoi, P.P.; Vinoj, V.; Swain, D.; Roberts, G.; Dash, J.; Tripathy, S. Land Use and Land Cover Change Effect on Surface Temperature over Eastern India. Sci. Rep. 2019, 9, 8859. [Google Scholar] [CrossRef] [PubMed]
  38. Wrede, R.; Spiegel, M.R. Schaum’s Outline of Advanced Calculus; McGraw Hill: New York, NY, USA, 2002. [Google Scholar]
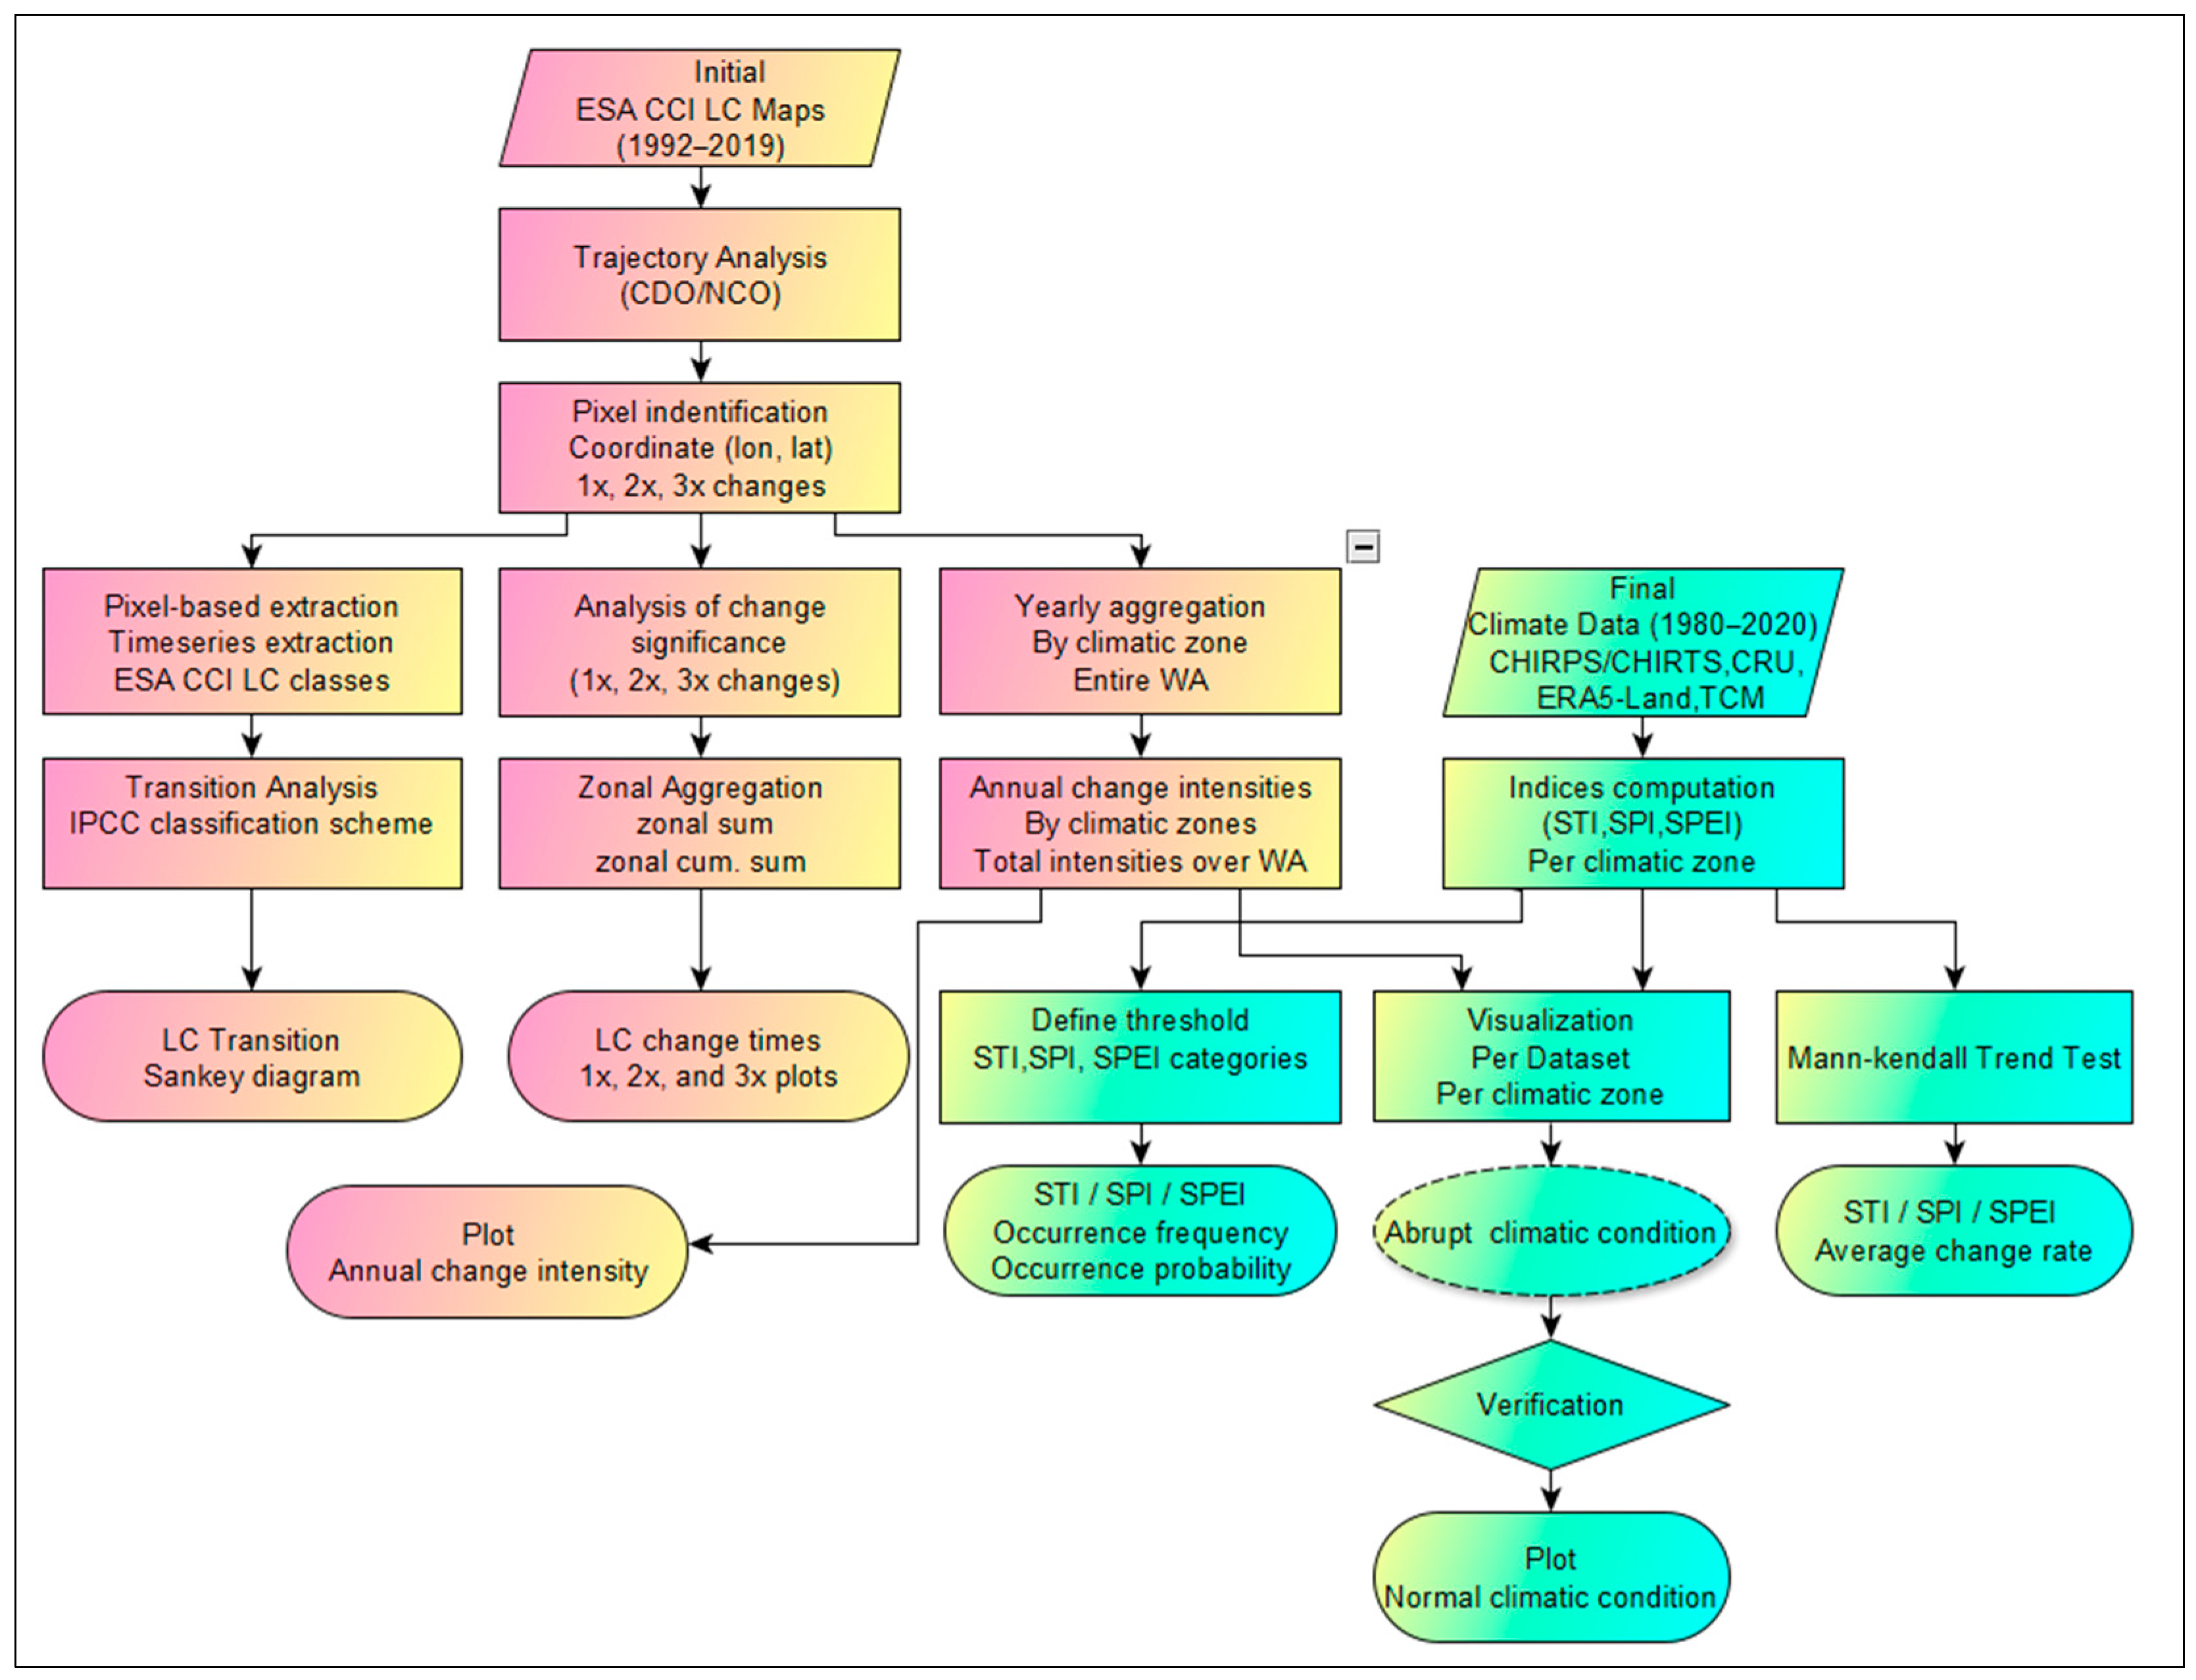
Figure 1. Map of West Africa showing five bioclimatic zones (adapted from [3,9,10]).
Land 12 00355 g001
Figure 2. Overall steps used to assess the interaction between land cover changes and climatic changes.
Land 12 00355 g002
Figure 3. ESA CCI LC changed pixels between 1992 and 2019 categorised by frequency of change.
Land 12 00355 g003
Figure 4. Land cover change area variation in West Africa categorized by (a) change frequency from 4° N to 20° N (b) cumulative change frequency per climatic zone.
Land 12 00355 g004
Figure 5. Land cover transitions from 1992–2019 over West Africa based on the IPCC classification scheme.
Land 12 00355 g005
Figure 6. Annual variation of land cover change area for the five bioclimatic zones of West Africa.
Land 12 00355 g006
Figure 7. Climatic indices showing years with spikes in land cover area (grey lines) in West Africa.
Land 12 00355 g007
Figure 8. Time-latitude and time-longitude Hovmoller diagrams over West Africa showing that land cover changes (in red) coincide with abrupt climatic changes. (ah) how STI values varies with time along the latitude and longitude respectively for CHIRTS, CRU, ERA5-Land, and TerraClimate datasets. (iw) how STI values varies with time along the latitude and longitude respectively for SPI and SPEI.
Land 12 00355 g008
Figure 9. (abg) Changes in temperature, precipitation, and climatic water balance leading to high land cover area change.
Land 12 00355 g009
Figure 10. (abg) Changes in climatic conditions in normal years with no abrupt land cover changes.
Land 12 00355 g010
Figure 11. (abg) Seasonal rate of average climatic changes over West Africa, based on Sen’s slope estimates (1980–2020).
Land 12 00355 g011
Figure 12. (acg) Occurrence frequency of various climatic conditions in West Africa.
Land 12 00355 g012
Figure 13. (acg) Probability of occurrence of various climatic conditions in West Africa.
Land 12 00355 g013
Figure 14. Occurrence frequency of climatic conditions over West Africa (1980–2020).
Land 12 00355 g014
Table 1. Temperature, precipitation, potential evaporation, and potential evapotranspiration datasets used.
DatasetsVariableSpatial ResolutionPeriod UsedLink to Dataset/Technical Validation Report
CRU TST0.5 ° × 0.5 ° 1980–2020https://crudata.uea.ac.uk/cru/data/hrg/cru_ts_4.05/ (accessed on 19 April 2022) [20]
ERA5-LT0.1 ° × 0.1 ° 1980–2020https://cds.climate.copernicus.eu/cdsapp#!/dataset/reanalysis-era5-land-monthly-means?tab=overview/ (accessed on 19 April 2022) [21]
TCMT1/24°~4 km1980–2020http://thredds.northwestknowledge.net:8080/thredds/terraclimate_aggregated.html (accessed on 19 April 2022) [22]
CHIRTST0.05 ° ~ 5   km 1983–2016http://data.chc.ucsb.edu/products/CHIRTSdaily/v1.0/africa_netcdf_p05/ (accessed 19 April 2022) [23]
CHIRPSP0.05 ° ~ 5   km 1981–2020https://data.chc.ucsb.edu/products/CHIRPS2.0/global_daily/netcdf/p05/ (accessed 19 April 2022) [24]
CRU TSP0.5 ° × 0.5 ° 1980–2020https://crudata.uea.ac.uk/cru/data/hrg/cru_ts_4.05/ (accessed on 19 April 2022) [20]
TCMP1/24°~4 km1980–2020http://thredds.northwestknowledge.net:8080/thredds/terraclimate_aggregated.html (accessed on 19 April 2022) [22]
CRU TSPET0.5 ° × 0.5 ° 1980–2020https://crudata.uea.ac.uk/cru/data/hrg/cru_ts_4.05/ (accessed on 19 April 2022) [20]
ERA5-LPET0. 1 ° ~   11.1   km 1981–2020https://data.bristol.ac.uk/data/en_GB/dataset/ (accessed on 19 April 2022) [25]
TCMPET1/24°~4-km1980–2020http://thredds.northwestknowledge.net:8080/thredds/terraclimate_aggregated.html (accessed on 19 April 2022) [22]
GLEAMPE0.25 ° ~ 27 km 1981–2020Hosted on sftp://hydras.ugent.be with username, password, and port/ (accessed on 19 April 2022) [26]
CRU TS—Climatic Research Unit gridded Time Series; ERA5-L—ERA5-Land; ERA5—ECMWF ReAnalysis fifth-generation; ECMWF—European Centre for Medium-Range Weather Forecasts; CHIRPS—Climate Hazards Group Infrared Precipitation with Stations; TCM—TerraClimate; GLEAM—Global Land Evaporation Amsterdam Model.
Table 2. SPI- and SPEI-based classification for the various drought categories.
SPI/SPEICumulative
Probability
InterpretationClassificationProbability
of Occurrence
+2.00.9772Extremely wetSPI/SPEI +2.00.023
+1.50.9332Very wet+1.5 SPI/SPEI < +2.00.044
+1.00.8413Moderately wet+1.0 SPI/SPEI < +1.50.092
0.00.5000Near normal−1.0 > SPI/SPEI < +1.00.682
−1.00.1587Moderately dry−1.0   SPI/SPEI > −1.50.092
−1.50.0668Very dry−1.5   SPI/SPEI > −2.00.044
−2.00.0228Extremely dry−2.0 SPI/SPEI0.023
Table 3. Classification of heat categories based on STI values.
STICumulative
Probability
InterpretationClassificationProbability
of Occurrence
+2.00.9772Extremely hotSTI +2.00.023
+1.50.9332Very hot+1.5 STI < +2.00.044
+1.00.8413Moderately hot+1.0 STI < +1.50.092
0.00.5000Near normal−1.0 > STI < +1.00.682
−1.00.1587Moderately cold−1.0 STI > −1.50.092
−1.50.0668Very cold−1.5 STI > −2.00.044
−2.00.0228Extremely cold−2.0 STI0.023
Table 4. Climatic conditions leading to abrupt land cover area changes.
ScenarioConditionT/°C∆T/°CP/mmy−1∆P/mmyr−1CWB/mmy−1∆CWB/mm∆Area/km2
Wetchange−1.0–1.020–+50up to 500–+50up to 5045,039–52,133
increase0–1.51.50–+50up to 500–+50up to 5020,935–22,127
change−0.5– 0.51.00–+50 up to 500–+50up to 5031,843
Drychange−1.0–1.02.0−50–0up to −50−50–0up to −5045,039–52,133
increase0–1.51.5−50–0up to −50−50–0up to −5020,935–22,127
change−0.5–0.51.0−50–0up to −50−50–0up to −5031,843
Disclaimer/Publisher’s Note: The statements, opinions and data contained in all publications are solely those of the individual author(s) and contributor(s) and not of MDPI and/or the editor(s). MDPI and/or the editor(s) disclaim responsibility for any injury to people or property resulting from any ideas, methods, instructions or products referred to in the content.