1. Introduction
Over the course of history, a series of edifices had been built as a result of certain strategic, economic, social, or religious requirements, edifices that nowadays are included in the national or world heritage. The value of these sites is given by a certain combination of their architectural features, notoriety, uniqueness, greatness, and legends [
1,
2,
3,
4]. Often, cultural, historical, and archaeological sites have been used as the nucleus of cities’ growth, extending to the present period [
5,
6,
7,
8]. Changes, even contemporaneous ones, were added along with the urban development and are responsible for disturbances to the natural environmental balance with different responses from the historical edifices. Urban development (new constructions, sewage systems, and urban water supply systems), a growing number of inhabitants, and urban tourists generate different responses from the natural environment prone to the instability phenomena nearby cultural heritage sites as a result of the increasing impact on heritage sites [
9,
10,
11,
12,
13]. The subject of extensive reconstruction and consolidation, many historical and archaeological sites (such as Sighisoara and Rethymo) are still currently threatened by specific natural hazards driven by climatic, hydrodynamic, and gravitational factors [
14,
15,
16,
17,
18,
19,
20].
Multiple and involved concerns for risk mitigation and the preservation of cultural heritage sites are emphasized through various scientific approaches with direct regard to a wide range of climate change [
21], hydrometeorological [
22], hydrogeological hazards [
14], sea level change [
23], geomorphological [
16,
24], and anthropogenic hazards or combined hazards [
25,
26], as there is great interest in continuous improvement and increased efficiency in the implementation of risk management plans [
27,
28].
Our paper focuses on one of these fragile sites that has a high exposure to natural and human-induced threats. The Roman Edifice with Mosaic of Constanta (II-IV A.D.), an ancient spot facing urban environmental changes, is located in the Dobrogea Region, in the eastern part of Romania. This heritage site was accidentally discovered in 1959, precisely due to the urban sprawl of Constanta town, as a result of engineering work carried out on residential building blocks [
29,
30,
31,
32]. The remains and mosaic degradations were not only caused by the damages through the centuries and by the passage of time when they were buried, but also by the works carried out in the modern period to develop the Constanta residential area and harbor, which overlap the ancient port of Tomis [
29,
30,
31,
32,
33,
34,
35]. This example underlines the importance of effectively preserving archaeological vestiges, especially in such dynamic environments as urban ones [
36,
37]. The Roman Edifice with Mosaic is covered by a protective structure of reinforced concrete and glass, built in the 1970s. It is equipped with two-level walkways for tourists and designed to maintain a semi-artificial microclimate without thermal or humidity extremes, but with the possibility to use natural ventilation when needed.
Therefore, our approach to assessing the current and local vulnerability of the Roman Edifice with Mosaic consists of the analysis of hydrogeological, geomorphological, and anthropogenic components likely to cause instability of the relict front cliff, which is the geomorphological support for the Roman Edifice with Mosaic, starting from the hypothesis that the main factors that induce that instability of mosaic pavement are anthropogenic ones.
The interdisciplinary approach, combining geophysical methods with topographical measurements and geomorphological mapping, helps to identify and assess geomorphological hazards, responsible for the reshaping of the land surface, with rapid impact on ancient vestige conditions [
38,
39,
40,
41,
42,
43,
44].
The main aims of this work are: (1) to inventory the spatial vulnerabilities of the Roman Edifice with Mosaic from Constanța as a result of the relation between the heritage monument and the geomorphological environment in its capacity of support; (2) to identify the anthropogenic impact sources that human changes have on it in order to assess the current unsteady state and to analyze the types and scale of instability in the monument; and (3) to provide valuable informational inputs in order to improve the environmental rehabilitation of the surroundings of this cultural heritage.
Regional Settings
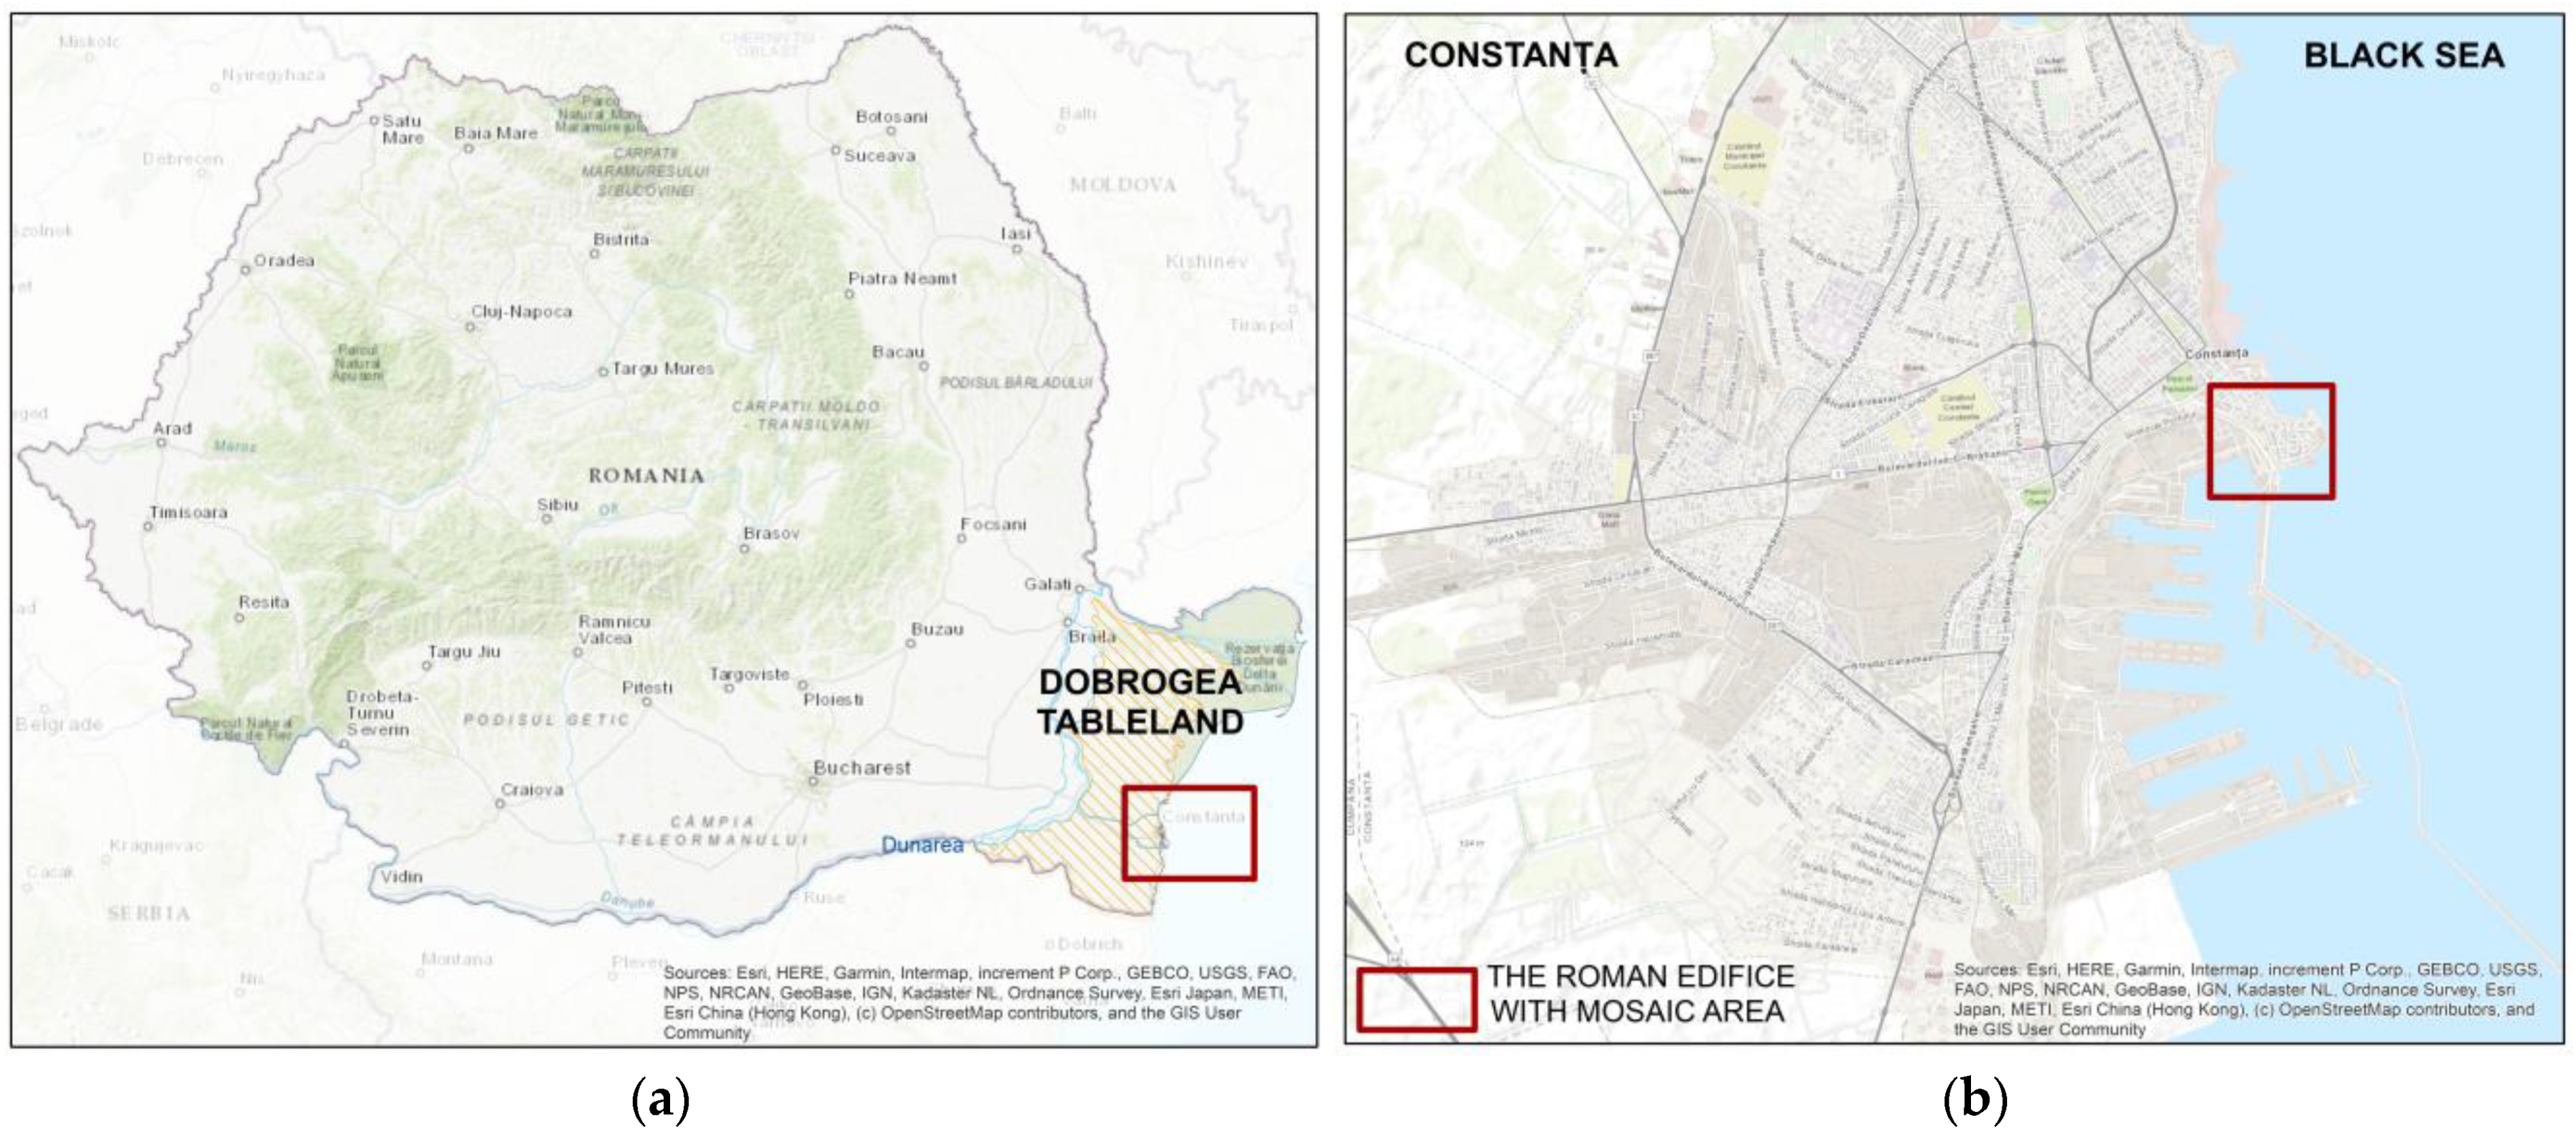
Among the historical tourist attractions from the south-east side of Romania, there is a cultural heritage known as the Roman Edifice with Mosaic assembly from Constanta (IV A.D.), located on the east side of the low tableland of South Dobrogea (
Figure 1a), along the Black Sea front cliff shaped as an abrasion terrace in the south-western side of a peninsula, situated between the harbor of Constanta and the tourist port of Tomis (
Figure 1b).
As a result of the smooth relief of the tableland, the low elevations (25–200 m) (
Figure 2a), and especially the vicinity of the Black Sea shore, the Dobrogea Plateau, which was part of the historical Roman province Scythia Minor, represents one of the old Geto-Dacian dwelling areas on the territory of Romania, knowing throughout history different influences (Scythian, Slavic, Bulgarian, etc.) and colonizations (Greek, Roman, Ottoman). Among the vestiges of the fortress cities built in Dobrogea along the Danube and the Black Sea shore and, which remained testimonies to historical transformations and commercial and defensive military strategies, there is also the fortress and port of Tomis.
It was built over the Sarmatian limestone deposits and Quaternary loess deposits of the peninsula of Constanța [
45] (
Figure 2b).
Its south-western side has been anthropogenically reshaped since the first centuries AD by the construction of a few anthropogenic terraces used for ancient civil constructions and the harbor of Tomis. The Roman Mosaic Edifice housed the storage and commercial spaces related to the ancient port.
The Roman Edifice with Mosaic was built on four anthropic terraces on the Black Sea front cliff, including one terrace below actual ground level. The upper terrace is the level of the ancient town Tomis, the second terrace with mosaic pavement was built on a loess sedimentary layer, the third terrace, an indoor hall with an ancient wall soldering cliff (L = 100) and vaulted warehouses, was erected on a thin loess sedimentary layer and limestone, and the lowest terrace with commercial pavilions, built on limestone, nowadays being an underground level [
45] (
Figure 3). Under the lowest terrace, there are a few segments of a Roman gallery.
It was an important public, commercial, political, and cultural place in the ancient city of Tomis [
46] (
Figure 4), being the largest archeological complex with mosaic pavement (2040 m
2) from the southeast of Europe, and until nowadays, only about 820 m
2 have been preserved and protected by a concrete hall [
33]. Nowadays, public and residential buildings were constructed to the north and north-eastern parts of the ancient edifice.
The abrasion terrace and front cliff are outcropping in Quaternary loess deposits and Sarmatian limestones (
Figure 2b) with thin intercalations of clay, marl, and marine sand layers. Subsequently, as a result of the expansion of the built environment, anthropogenic deposits (fillings) were added. The tectonostratigraphic structure of these deposits is tabular, tending toward monocline, discordant, and faulted [
47].
Climatic conditions generate a severe deficit of air humidity due to low rainfall (300–450 mm/year), related to high values of temperature (annual average is 10.0–11.5 °C) and, as result, 600–700 mm/year evapotranspiration values are recorded [
48].
Large fluctuations of moisture values in sedimentary deposits are not strongly correlated with meteorological conditions but may be interdependent with the efficiency of municipal sewage networks, yielding a slowly but continuously damaged status of the mosaic pavement. The municipal sewage and water supply networks of Constanta provide other moistening sources for the ground foundation of the interest site through leakages and water seepages.
As a consequence, the Roman Edifice with Mosaic was damaged due to geomorphological and hydrogeological processes through the slow sliding movements of a quite large sector of the relict abrasion cliff (
Figure 5a,b).
Therefore, the mosaic pavement, the ancient wall, and the retaining walls were affected by leakages, local failures, suffosion, erosion, and differential settlements.
2. Materials and Methods
The study is the result of interdisciplinary research that consisted of topographic measurements, geophysical surveys, mapping, and geomorphological analysis, all methods applied in this study are non-invasive as a safeguarding measure for ancient heritage sites and their surroundings.
In order to determine the causes of instability in the vicinity of the Roman Edifice with Mosaic, archaeological plans, geographical and geological maps, and ortho-plans were included in the GIS analysis, and the results were correlated with the geophysical assessment (
Table 1).
Field surveys were made in 2008 and 2019, with the purpose of inventorying, mapping, and analyzing the natural and anthropogenic factors of the wide degradation degree of roman mosaic during the last decades. The field surveys had been conducted in the summertime when the moisture gradient usually reflects a high amplitude of variations of air humidity.
There are important implications of variations in climate parameters in the geoelectrical survey readings. Thus, in order to reduce the gaps determined by these variations, we chose that the geophysical measurements be carried out at similar time intervals from a meteorological standpoint over the course of two years. Comparing the meteorological data such as temperature, relative humidity, and air pressure during the days when geoelectrical surveys were done, it follows that the meteorological parameters considered were rather stable without wide variations throughout surveys in ten years’ rank: the values of air temperature varied between 24 and 31 °C, the low range of air pressure was between 1006 mbar and 1014 mbar, and the range of relative humidity was between 40% and 55%.
Field investigations carried out: topographical survey, to map the recent shape of the morphological surface, using the Sokkia 660 Total Station; geoelectrical survey, such as vertical electrical sound (VES) and self-potential (SP) (
Figure 6a,b), to highlight the natural ground moisture and leakages; geomorphological mapping, to inventory the natural and anthropic features, and to assess the geomorphic hazards issues of the Roman Edifice with Mosaic (
Table 2).
Topographic measurements along with older topographical maps (
Table 1) had been used to collect accurate elevation data and to generate a large-scale digital elevation model (DEM) to reassemble the actual detailed shape of terrain that supports the mosaic edifice, man-made landforms included, in order to map microrelief, shallow deposits, and active geomorphic processes (gravitational and hydrodynamic).
Geoelectrical surveys consist of two methods: vertical electric soundings (VES) and self-potential (SP) to establish lithological features, ground water levels and depths, water source categories, infiltrations and exfiltrations, and furthermore, to assess the related geomorphic hazards.
The geoelectrical measurement point network was designed taking into account two criteria: the relatively uniform spatial distribution of measurement points so that the geoelectrical images would have the same accuracy of information, and the correspondence between measurement points and known vulnerable points of the edifice.
The vertical electric soundings (VES) were made using Schlumberger array (AMNB) Super Sting R1 IP AGI down the cliff from the edifice with mosaic in 2008 (17 VES) and repeated in 2019 and above the Roman edifice in 2019 (34 VES). The survey depth of vertical electric soundings was 12 m in 2008 and 20 m in 2019, with a view to intercepting the lower terrace of the edifice and the hydrostatic levels (
Table 2 and
Figure 7).
Specific calculation methods of resistivity were imposed by field conditions in non-homogeneous sedimentary geological structures, in non-cohesive and porous rocks, respectively, and by the low altitude of the relict cliff. As a result, the maximum penetration depth specific to this technique is AB/3, where A and B are the current electrodes, and AB is the maximum distance between the current electrodes.:
k is the Schlumberger geometric factor related to the distance coefficient AB (electrodes),
and ΔV measured at MN slot and I
AB, is the electrical current injected into the ground.
The self-potential (SP) method emphasizes underground water flow. The self-potential (SP) network survey consists of 1 m
2 cells and was applied only on mosaic pavement and vaulted rooms, the ancient warehouses below the mosaic pavement, along three survey lines (
Figure 6b). The obtained data from the self-potential (SP) method were processed and analyzed in MATLAB and ArcMap 10.6 software. The resulting maps indicate the self-potential effect images from the surface of investigated ancient rooms and reveal the infiltrations and exfiltrations.
Data analysis using QGIS 3.4, ArcGIS 10.6, and Surfer 8 was performed to outline the dynamics of the morphological and geoelectrical parameters.
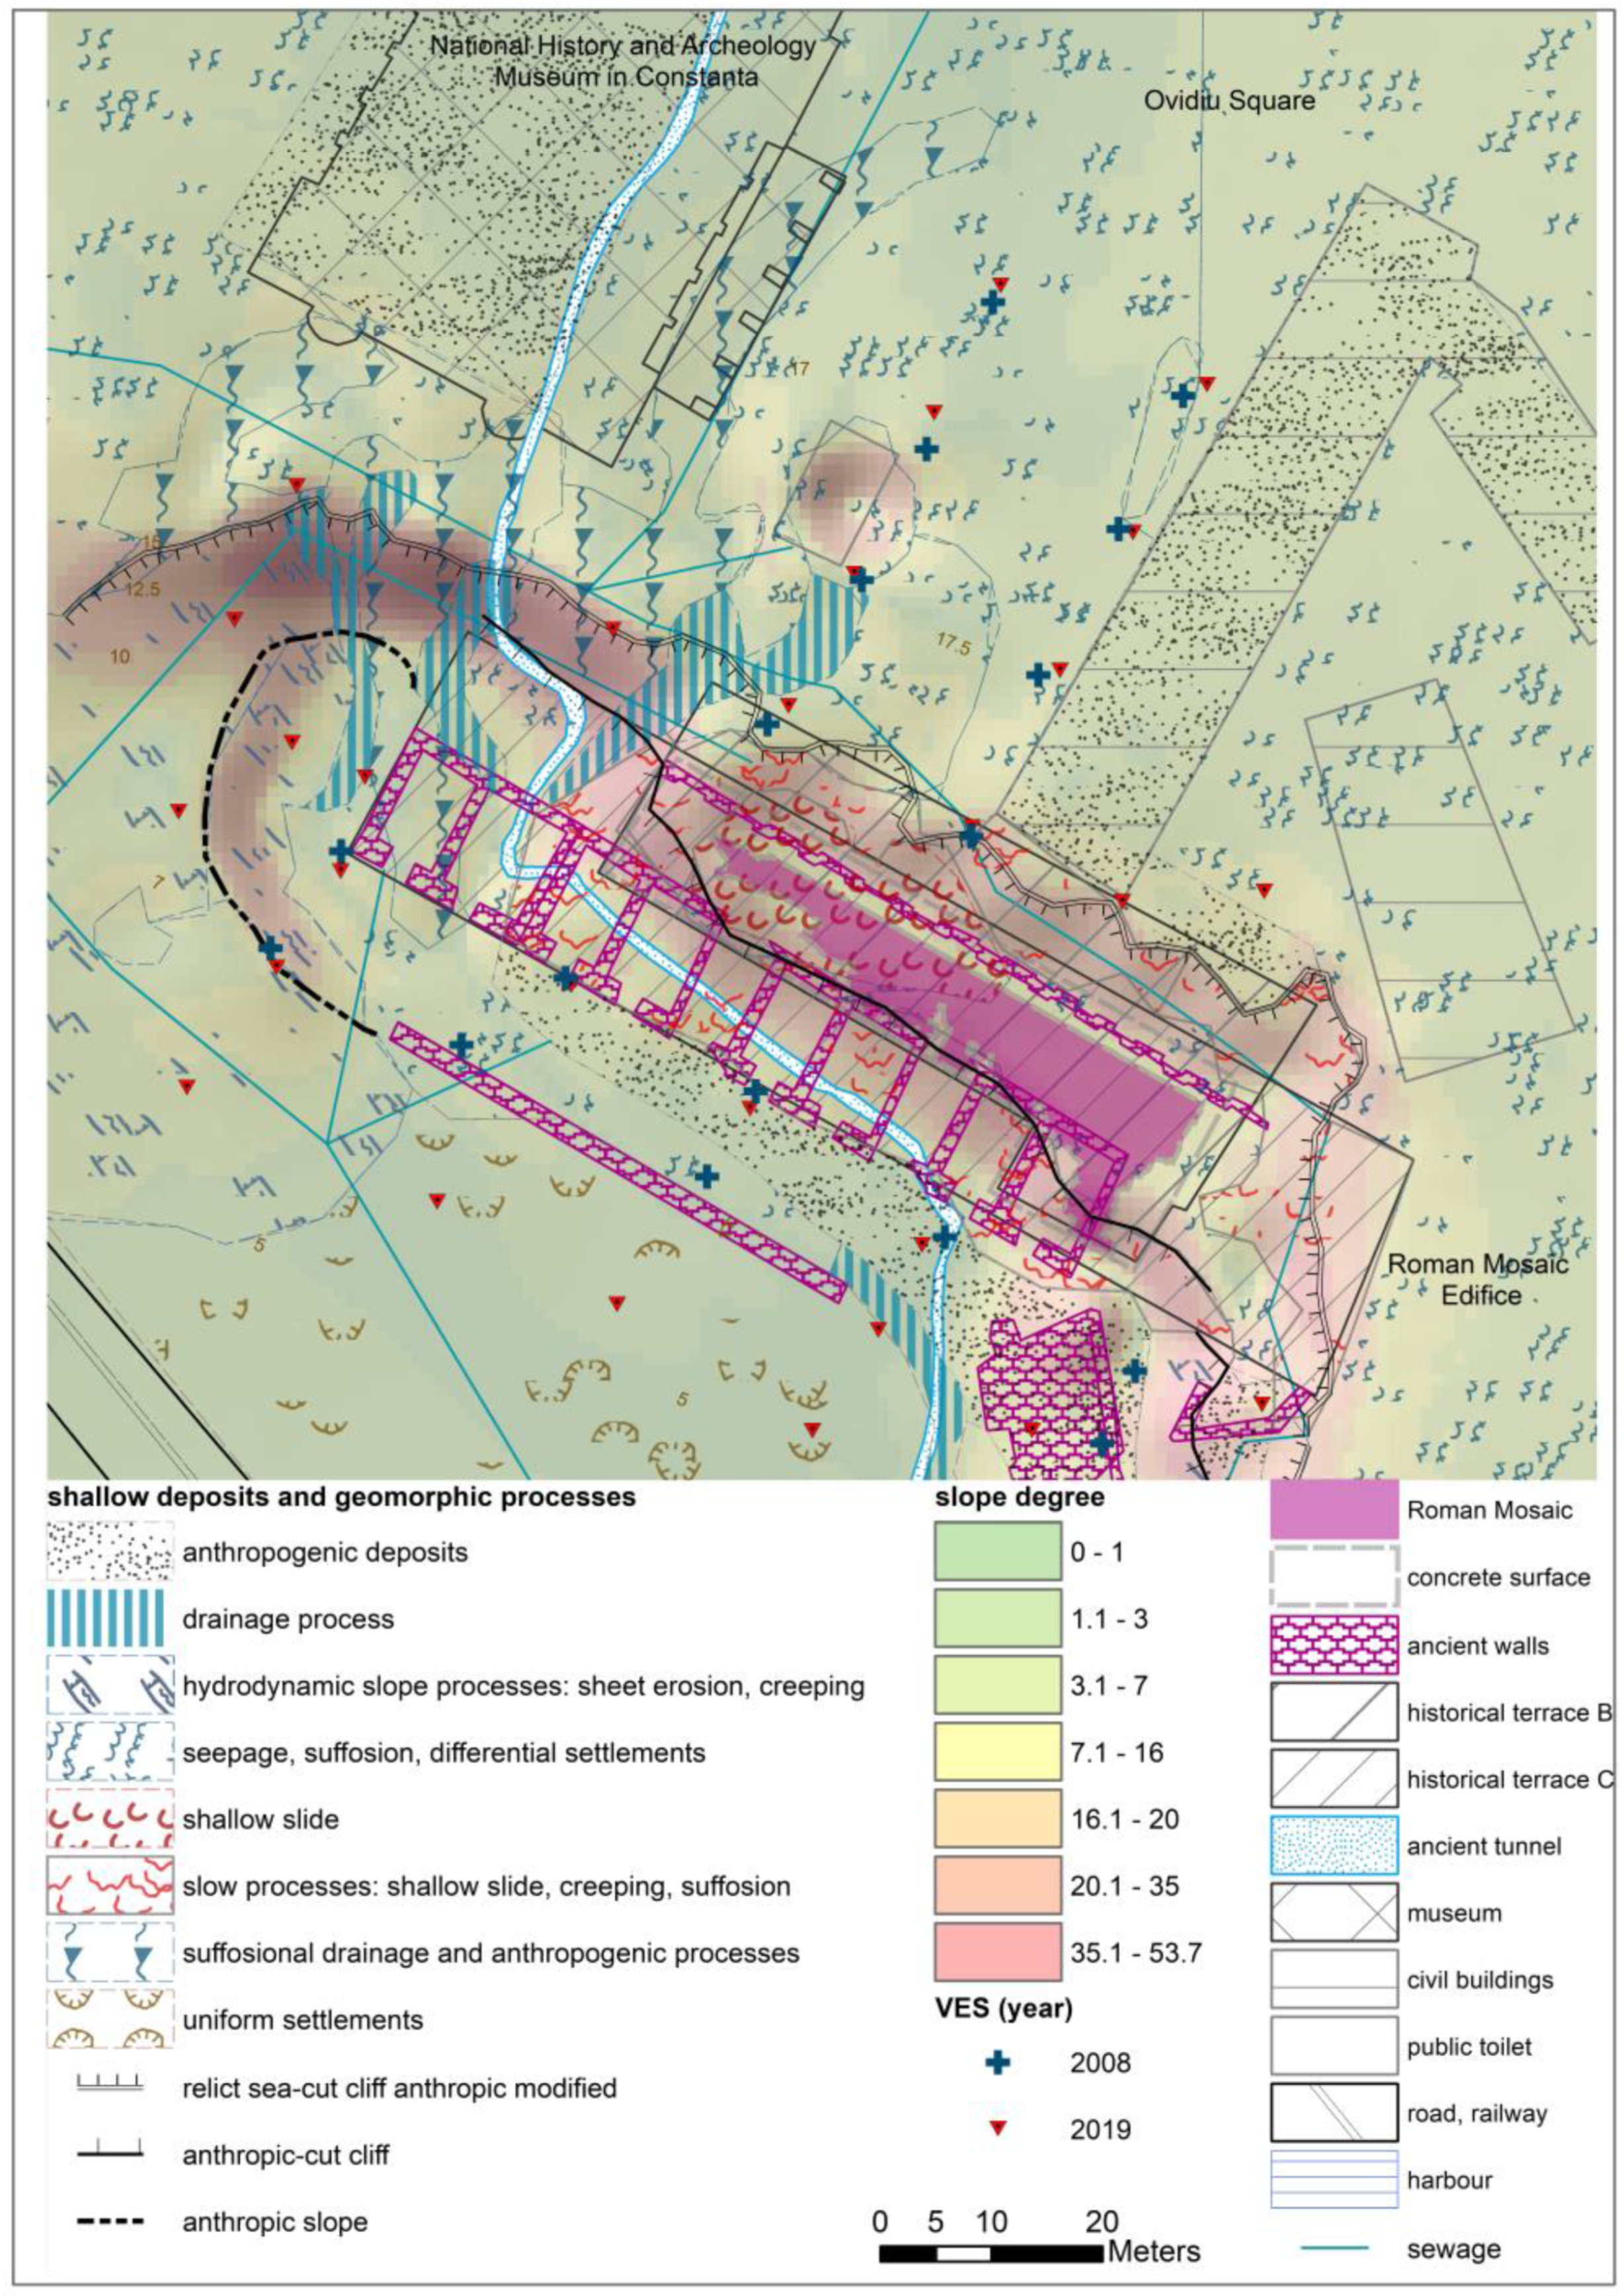
Morphometric analysis was performed by means of the spatial distribution of slope and hypsometry parameters; the maps were generated based on the contours (with 2.5 m equidistance) extracted from topographic map 1:10,000 (1975), which were corroborated with DEM obtained from interpolating points recorded by topographic measurements. The analysis of superficial deposits and geomorphological processes was carried out following detailed geomorphological mapping based on field observations and imagery at different scales.
Integrative research on vulnerability issues in cultural heritage requires a multidisciplinary approach because of the different types of endangerments. It aims to identify the areas with different susceptibilities and the types of vulnerabilities. Thus, the same area may have several vulnerabilities depending on temporal-spatial dynamics, on its exposure to different hazards that may occur, or the frequency of the hazards.
Our approach refers to the vulnerability of the Roman Edifice with Mosaic caused by the features of the geological and geomorphological environment, not excluding anthropogenic interventions.
The interpolation of geophysical, lithological, and geomorphologic parameters allows us to set up the spatial distribution of the different degrees of vulnerability of the Roman Edifice with Mosaic related to the surface’s geomorphologic and hydrogeological hazards.
The geomorphological vulnerability map depicting those areas shows that they can have various degrees of damage from the occurrence of geomorphological hazards. Accordingly, with the idea that vulnerability is the key to risk mitigation [
49], it is necessary to understand the spatial distribution of hazards-prone surfaces in order to apply scores in a multi-criteria and decision-mapping analysis.
The factors considered and analyzed are morphometric parameters (slope degrees and hypsometry), morphodynamic (geomorphological processes), anthropogenic (human activities, urban and sewer constructions), hydrogeological (moisture, infiltrational, and phreatic levels), and lithological (fillings, sedimentary deposits, porosity), which require a complex geographical approach; therefore, their classification is interpreted using functional value ranges. The classification of the value categories of each of the above parameters is based on the correlations that can be established between all the parameters in relation to the type of geomorphological process or even the multiple geomorphological processes that are mainly manifest.
The vulnerability factors preliminary identified have become attributes for the vulnerability map; they have gotten scores depending on their magnitude and their contribution (some of them having a more essential contribution than others) [
42]. Geomorphological hazards, morphometrical parameters (such as slope degrees, and hypsometry), and geophysical parameters (moisture, lithology, fillings), categorized into different classes were mapped as being considered important factors for the vulnerability assessment. The measured, calculated, and validated values of each factor considered were reclassified by assigning scores based on the geomorphological susceptibility indices (affected area and density) and the relation between factors and their influence on the mosaic pavement. Following this cross-analysis, each range of each parameter was rated from 1 to the number of its ranges, using the reverse scale, where 1 is the score for the higher degree of endangerment and thus may be highlighted as the most dangerous hazard process of all.
The parameter assessment was performed with a resolution of 1 m sq and weighted according to their variations or anomalies, the susceptibility indices, and the location and distance between each cell in relation to the mosaic pavement. Therefore, their importance and scores vary spatially. We merged the summative methods [
42,
49] with the spatial and relative importance of each interval of each parameter in mosaic damage. Using the different contribution weights of the factors in the vulnerability of the ancient edifice, the weighted average was applied and finally converted to a percentage.
V is vulnerability,
fi is considered a factor
pi is the weight of the factors in the vulnerability of an old edifice.
In this study, the cross-analysis and the weighting provided by numerical-cartographical methods highlight the interrelationship between factors that, through their consequence and context manifestation, have the potential to cause major damage to the heritage site, even if the causes are not so visible, as happens in the case of extreme events.
The modification of the summative method has taken us away from the generalization of assigning the same score to one or certain factors regardless of their variation and allowed us to centralize the analysis on their core, in this case, the Roman Edifice with Mosaic. Thus, the same factor can have variable importance depending on its influence on the core point of the analysis or whether it interferes with other factors, and thus may have different scores.
3. Results
3.1. Pattern of Moisture Deposits Dynamic Identified through Geophysical Methods
A great spatial distribution of the different statuses of deposits (limestone, clayey sandy silt, sandy loess, and fillings) related to the edge of the relict sea cliff and toe slope was highlighted through geoelectrical assessment. The moisture of mosaic foundation ground may come from different sources, such as phreatic levels, pluvial seepage, and sewage, or may be influenced by buried walls, ruined buildings, and aqueducts.
The size of the investigation area where the resistivity methods were applied has undergone changes from 2008 to 2019, in an attempt to pinpoint the sources of infiltrations and the causes of the increased morphodynamics in recent decades.
Sixteen longitudinal profiles and cross sections on the seafront cliff and mosaic pavement were made (six of them are illustrated in
Figure 8 and
Figure 9) using vertical electric sounding (VES) at 12–20 m depth with the purpose of inventorying the mosaic degradation sources.
The phreatic water levels had been identified as shallow deposits at 3–4 m depth, then at 7–8 m depth, and the ground-water level was located below 17 m at the base of loess and silty sand deposits, above some thin clay layers.
The geoelectrical survey results highlight the natural ground moisture and leakages, which are a critical issue for the surrounding area of the mosaic edifice, through the dynamics of hydro-morphological and anthropogenic processes.
The apparent resistivity values (
ρɑ) measured in 2019 are locally more than 30 times greater than the 2008 values, both in superficial layers and in depth (
Table 3). Regarding the range between the minimum and maximum values recorded, they are about 100 times higher in the two years analyzed. The ratios of the minimum and maximum values recorded on the whole study area in 2008 and 2019 vary from 1.54 to 3.8. The variations in standard deviation values that are in the hundreds (anomalies) are greater in 2019 with a ratio of 2.28 than in 2008. Consequently, we focused on anomalies since they may indicate, either supplementary moisture or natural and anthropic discharge from the hydrogeological system, both sources of mosaic damage.
To determine the variability of geoelectrical data, we designed longitudinal and transversal geomorphological and geoelectrical cross-sections on each side of the ancient mosaic pavement and through it.
The first step of our geophysical research was focused especially on the leakages from the seepage water system and water supply and on the analysis of the spatial distribution of resistivity values at different depths in order to find out inflow and outflow levels in surrounding deposits of mosaic pavement. We notice some thin layers with higher moisture variations at 1.5 m depth and at 3–4 m. The superficial water infiltration level highlighted in the cross profiles (
Figure 7,
Figure 8 and
Figure 9) at 3–4 m depth is outlined by rapid changes in direction of the apparent resistivity curves.
The hydrostatic level, located at 16–18 m, is not influenced by sewerage in 2019 compared to 2008.
We notice some isolated areas on the north side of the mosaic with high moisture degrees in deposits and fillings, highlighted by low apparent resistivity values (
Figure 8).
An interesting maximum contrast of resistivity values between 2019 and 2008 is a local anomaly area located below mz9 (
Figure 8a) and mzb9 (
Figure 8b) VES measurement points. In 2008, the resulting values of apparent resistivity had been calculated in the 8–50 Ohm·m range, proving heightened infiltrations. By comparison, in 2019, the infiltrations were lower, even though the values of apparent resistivity were still quite reduced because of the remanent moisture (50–150 Ohm·m). The shape of the apparent resistivity contours has a totally different configuration. This fact is clearly underlined by the different appearance of the apparent resistivity curves shown on the cross-sections (
Figure 8).
The infiltration and sewage groundwater (2008) generated a slide surface along the front cliff, pushing towards ancient walls, and some ripples appeared on the mosaic pavement. Both phreatic levels were affected by the leakages, then. The shape of the apparent resistivity contours obtained in 2019 reveals a significant realignment of the underground-water processes relative to the hydrogeological pattern. In fact, it is quite visible around the 500–600 Ohm·m range at one of the natural emergences at 4–5 m depth (
Figure 8).
Below the ancient edifice, at a lower altitude, the resistivity values are increasing (40–180 Ohm·m in 2008 and 100–360 Ohm·m in 2019), as a result of the effect of some gaps due to the presence of ruins of Roman galleries, fillings, and landings on the groundwater levels (
Figure 8a–d and
Figure 9b).
Two infiltration sources at 4–8 m depth still remain active in the cliff sector above the mosaic pavement (
Figure 8a,c and
Figure 9a). Regarding the nature of these sources, they are obviously linked by the museum and residential buildings, but in-depth, there are no other water sources such as water supply or water seepage. The shape of apparent resistivity curves indicates buried anthropic structure; in fact, the remains of an aqueduct and a Roman tunnel influenced the direction of underground infiltration flow directions. Moreover, between these two water sewage sources, behind the mosaic pavement, there is a sector with high porosity of the deposits, which is emphasized by over 500 Ohm·m apparent resistivity (
Figure 9a), which facilitates the high variation of moisture deposits.
The second step of the geophysical research was to identify other causes of the damage. The assessment of apparent resistivity recorded at 4 m depth reveals different statuses for those two years of investigations. The focused analysis on geophysically measured parameters in 2008 (8–200 Ohm·m), when the apparent resistivity values were from 5 to almost 40 times smaller than the values obtained through measurement in 2019 (40–900 Ohm·m), indicates a strong variation of deposits moisture unrelated to weather conditions but linked to anthropical sources. The lower values of apparent resistivity (2008) indicate high moisture in deposits characterized by aggressive chemistry of water seepage (
Figure 9a), and higher apparent resistivity values (2019) may highlight either dry deposits or underground flows with lower chemistry (
Figure 9b).
The effect of the museum foundations and residence building (remanence of leakages into the ground foundation) toward the front of the ancient edifice is outlined by a minimum resistivity (8–150 Ohm·m), on both sides of the edifice, and it is maintained until the bottom of the slope. The maximum values of the apparent resistivity, more than 300 Ohm·m, characterize the central area of the old edifice, and they are given by the influence of the concrete alley, water rainfall percolation, and rapid underground water into local deposits (
Figure 9a). This fact is obvious down the edifice, where the over 600 Ohm·m (
Figure 9b, mz 24 and mz 7) curves correspond to the “barrier” effect of the buried walls on pluvial water. A local disturbance is observed in the vicinity of the buried Roman gallery, where sandy-clay fraction remains are accumulated; some shadings of polluted underground water flows are recorded through lower apparent resistivity (100–200 Ohm·m) (
Figure 9c,d).
3.2. Inflows and Outflows from the System of Mosaic Pavement through the Self-Potential Method
The self-potential (SP) survey had been applied only on the second and third anthropic terraces cut off in the relict sea cliff (B and C). Beyond other interesting data provided by this method, the most important aspect revealed was the direction of underground water flows, meaning the location of infiltration and exfiltration areas. High underground moisture variations can be observed between the ancient wall and the edge line of the mosaic pavement (
Figure 10a). Self-potential low values show a high density of shallow cracks in the mosaic. Infiltration phenomena are identified along the edge line of the pavement. Exfiltration of water/fluids from civil buildings and infrastructure placed north-east of ancient walls (ancient terrace) is indicated by high SP values.
The exfiltration reports more moisture in relation to the absorption capacity of the mosaic pavement and loess floor (
Figure 10b). The phenomenon comes from the different granulometry/particle sizes of the mosaic infrastructure (ancient human-shaped thin layer of compacted loess).
The circulation of water and shallow slide movements from the north-east to the south-west part of the mosaic had resulted from a lot of thin cracks and ripples, which have proven the dynamic of mosaic pavement through maximum variations in self-potential values (
Figure 5 and
Figure 11).
3.3. Geomorphological Results
The results of the geoelectrical analysis facilitated the understanding of shallow geomorphic processes and even validated the results of mapping and assessing the current morphodynamics. Two different morphodynamic systems are emphasized by the spatial distribution of slope degrees: the front cliff and plateau of the peninsula, on which the archaeological site is overlaid.
The slope variation highlights the areas with different potential and kinetic energies, imposing different morphodynamics. The variation of the slopes indicates a close relationship between the geological support, the evolution of the slandscape, and the current dynamics of the landforms under natural and anthropic environmental influences. It also imposes the development of different human activities and different levels of exposure of infrastructure to hazards.
The edifice was built on a 17–25° abrasion slope with an uneven edge, but its dynamics were greatly influenced by the plateau above (2 m high than the upper edifice level).
The purpose of classifying slope values within the slope map is to identify and delimit morphological surfaces affected by different geomorphological processes with different degrees of instability.
The porous nature of the surface deposits (anthropic fillings, loess) in which the plateau is carved leads to infiltrations and active underground circulation of water. As a result, suffosion processes are widespread, and the topographic surface is affected.
The civil constructions and traffic network (roads, alleys) placed on this plateau, nearby the Roman edifice, have increased the creeping and slip processes inside the shallow deposits. This phenomenon is observed through the dense network of cracks with several centimeters step and over one-meter in length, both in the retaining wall of the first level and on the mosaic pavement (
Figure 11a).
The high density of cracks nearby the main edifice entrance is correlated with the increased moisture of the filling layers caused by the sewerage network and leakages from a public toilet located in front of the edifice.
The inventory and mapping of geomorphological processes are depicted in
Figure 12. Some of them were validated by the geoelectrical survey as geomorphological hazard processes that steadily threatened the mosaic pavement, such as suffosion and differential settlements, shallow and slow sliding, creep, and rippling of the mosaic pavement.
At the plateau level, some negative microrelief in loess (micro-depressions) with high density is mapped along the cliff edge as well as the edifice (
Figure 12). Rainwater stagnates in some of the larger micro-depressions frequently north of the above-mentioned entrance to the edifice. In this way, the moisture of the shallow deposits increases through prolonged infiltrations, and, most importantly, the surface run-off water flows towards the cliff and many rills are developed. Therefore, the erosion through concentrated currents is more pronounced on the western side of the edifice, where deep rills, arranged in the amphitheater, wiped out a sector of the front cliff. The rills expanded regressively by pushing the edge of the slope toward the northeast, which has contributed to the deterioration of the ancient walls from the III and IV levels of the edifice (
Figure 12).
The increased moisture linked with the anthropogenic sources mentioned above (sewerage, WC), combined with the intercalations of thin clays and marls, explains the shallow slides that have repeatedly damaged the western half of the edifice, being most likely the main cause of the advanced degradation of the mosaic (
Figure 12b). At the base of the steep slope, stagnant water was detected, accumulated from the rills behind the ancient wall, which maintains the permanent wetness of the walls between the ancient warehouse rooms at the lower (IV) level of the edifice.
3.4. Vulnerability Assessing Results
According to the obtained results, the natural and anthropogenic factors have different levels of involvement in the instability of the studied area and the factors were weighted due to their relative importance.
The factors considered are the lithology (see
Figure 8 and
Figure 9), correlated by its features such as porosity and cracks with moisture, measured applying electrical resistivity methods. The anthropic factor is independent, as is the lithological factor.
While the rapid morphodynamical feedbacks occur in the presence of human activities, depending on the above-mentioned and on spatial variations of slope gradient, the steady morphodynamical feedbacks follow, being predetermined by extreme values of moisture deposits even in the absence of human activities.
The significance of each considered factor for the vulnerability of mosaic pavement was evaluated for each map cell depending on its ranges, their correlation with hydrogeological and morphodynamic processes or morphometric features, and anthropogenic influences in terms of the type of surface such as constructions or land surface, but especially with respect to the Roman Edifice with Mosaic (
Table 4).
Due to the greatest variation, the most important factor with the major weight for instability and vulnerability is the moisture, which is correlated with the shortest distance to the most degraded area of the mosaic. The anthropogenic factor has been found to vary over time with long-lasting effects through the intensity and amplitude of activities. The geomorphological factor has an important weight due to the persistence and reactivation of geomorphological processes. The slope parameter is one of the generating factors of geomorphological processes, but its relatively low values require less weight in the vulnerability assessment. Low or even imperceptible variations in apparent resistivity values indicate a low susceptibility of the hydrogeological environment to morphodynamics. Geomorphic processes affect the surface of the landscape but are also manifested in depth. They emphasize not only states of instability at the topographical surface but also the deep dynamics of superficial deposits. Complementary processes such as suffosion and differential settlements indicate active circulation both vertically and at the base of porous rock deposits and gravitational dynamics. As a result of the reclassification, areas shaped by these processes with high susceptibility indices received high scores. Moreover, surfaces affected by creeping may indicate poor cohesion of the deposits due to their drying state, and the gravitational dynamics of the particles as well as low slip are rated with high scores. Depending on the widening of anthropogenic interference with mosaic pavement, polygonal areas were evaluated, taking into account the impacts determined through geoelectrical and geomorphological surveys. Thus, the greatest influence on the mosaic pavement identified through mapping and geoelectric measurements was the sewer infrastructure, which received the highest score.
Therefore, each factor implied in vulnerability assessment through cross-analysis, due to the spatial variation and influence of mosaic pavement, became a variable parameter, which provides a different value to every map cell as a consequence of variable weight.
4. Discussion
Related to the deterioration of mosaic pavement, we identified, besides natural factors, other potential sources of water leakages, such as public toilets and inappropriate maintenance of sewage systems.
We were interested in assessing those land patches with different rates of the active processes and their implications for vulnerability zoning and in providing a model of the exposure of mosaic to degradation in order to improve the stability of the Roman Edifice with Mosaic. We have focused on those natural and anthropogenic components that have recently been more dynamic, bringing the Edifice with Mosaic into a highly vulnerable range.
The sewage water, suffosion, creeping, and differential settlement hazards (depending on each other) and the occurrence of a potential slip surface of the cutting cliff behind the mosaic pavement level have defined two areas in the northwest and northeast that are more vulnerable along the mosaic pavement. Due to the lack of engineering drains (which should be located between the front cliff and Roman walls of ancient terraces), the infiltrations through the ancient walls and exfiltration flows on the mosaic pavement are permanent processes.
Figure 13, based on data from
Table 5, shows a good example of how anomalies can lead to a pretty accurate detection of leakage areas.
The shapes of the chart lines above emphasize opposite behavior regarding the response of the lithological environment to two vertical electric soundings.
In order to analyze the spatial variability of resistivity values in 2008 and 2019, from all resistivity measurements, we chose two different depths of investigation at 1.5 m depth, where fills are influenced by meteorological variations, pluvial water, and green spaces watering nearby, and at 3–4 m depth, where the damages on the ancient retaining wall and mosaic pavement are quite visible beginning from this level down (
Figure 14).
The local administrative authority was notified regarding the necessary repairs, which were done. Ten years later, the degradation of the mosaic pavement and surrounding Roman ruin buildings is still active.
In fact, in 2008, the leakages from the city sewage system on the northeast part of the edifice with mosaic were the primary sources of the infiltration into the edifice with mosaic ground, and a potential sliding surface was drawn at the discordance line between fillings and loess complex, also along the foundation of a concrete building that protects the edifice with mosaic and where stagnant water shed lies in negative microrelief. The leakages of sewage water with low resistivity are very aggressive, and the ground moisture passes through the ancient walls, which were inappropriately mended with cement, as was shown at the entire front of the edifice (
Figure 9a,c and
Figure 10a).
Eleven years later, the deposits are dryer than they were in 2008. The infiltrations and leakages from the civil seepage system are stopped by restricting and outing the service of public toilets nearby and rehabilitation of the city sewage. Therefore, there are no more leakages until 2019.
Certain residual water seepage with aggressive chemistry (polluted) remains in the geological environment. We had repeated and extended the measurements, which are over 30 times higher on average locally than the values from 2008. This means that there are no longer infiltrations and the deposits have a low moisture degree, or the moisture is given by the pluvial water (low chemistry), but still there are great variations of it. So, the question was: what is the source of the persisting degradation of mosaics? The water supply and pluvial water outflowed with high resistivity values, imposing washout of tills and generating suffosion. The infiltrations, outflows, and moisture pathways are still active.
The field survey from 2019 reveals some side-effects induced by the drying process, such as the washing out of the fine particle fraction, easily seen in the transversal geomorphological and geoelectrical cross sections (
Figure 8 and
Figure 9). Despite the high range of apparent resistivity values, which indicate dry shallow ground foundations or reduced pluvial water underground flows, the geomorphic processes continue to be active, meaning that the underground water and moisture pathways still exist.
The hypothesis is validated by removing the comparable data values from the measurements from two years ago and highlighting the extremes through ratios of the apparent resistivity values from 2019 to those from 2008. Thus, the distribution of the high values of ratios allows the identification of vulnerability points that overlap with sources of moisture and deposits, having the most pronounced dynamics.
Starting from the observation that the values of the apparent resistivity are mostly higher in 2019, reflecting reduced moisture compared to those of 2008, we calculated the values of the ratios in order to identify the anomalies of the apparent resistivity. We chose to point out the anomalies using the first cross-section S1-1, which is the most representative of the instability of mosaic pavement (
Figure 15). The spatial variation of the ratios of the 2019 to 2008 measurement values indicates anomalies through high values, identified next to VES 9 and 16, behind the mosaic pavement. The maximum values were recorded at depths of 5 m (12.5 m above sea level) and 11 m (5.5 m above sea level), indicating the points at which the fluctuations in the dynamics of underground water flows and leakages are maximal between the two repetitive measurements. Within the loess deposits, there is a thin and weak sandy layer able to increase the infiltrating water rate (elevation 12 m) and thus the mosaic vulnerability. However, the variation of ratio values can express more; namely, it can allow the delimitation, including in depth, of two areas of the superficial strata affected by that hydrogeological dynamic/instability. The shape of these two areas of shallow hydrogeological instability indicates a thinning towards inland (northeast) and an expansion towards the mosaic edifice (southwest), also in-depth, more precisely, to the mosaic pavement and the warehouse. It can be associated with the Roman gallery.
The highest values of the over unity ratios point out reduced moisture in the deposits in 2019, compared to 2008, located in the front cliff and filling layers and at the level of loess-like deposits due to their porosity and specific dynamics, thus becoming the most unstable.
The values of the subunit ratios identified only under the terrace surface of the peninsula, at 7–8 m depth, reveal in 2019 compared to 2008 higher humidity and natural circulation at the base of the loess deposit as a consequence of the repair works conducted to the wastewater collection system. Although there is a good correlation between moisture deposits and sliding movements, in this case, the issue is the connection between dry deposits and the continuously and slowly individual movements of fine particles. It points out that the morphodynamic mechanisms of creeping, suffosion is combined with differential settlements. These movements are reflecting the instability of a loess deposit from the foundation of mosaic pavement with a strong impact on it. The pluvial water outflowed with high resistivity values, just imposing washout of tills; this fine sedimentary deposit is amassed into the front cliff and below the ancient wall, generating high pressure on the mosaic pavement.
The spatial analysis of vulnerability emphasizes the critical and very high state in the upper part of the front cliff, at NW and NE of the mosaic pavement, inherited from the geometry of spatial variation of the moisture map and human-induced changes (
Figure 16).
We demonstrated that even if there are great features and changes in the environment that host the cultural heritage of the Roman Edifice with Mosaic regarding the moisture of deposits and fillings, the engineering works of the wastewater systems, and the reducing human impact, the hydrogeological and geomorphological processes continue to exert various pressures on the edifice, increasingly causing damages to the mosaic pavement.
We reviewed and corroborated survey data, and we noticed a remanence impact of the considered factors, as well as the local geomorphological hazards continuing to be active for a long time after some anthropogenic and hydrogeological factors were reduced. In the case of vulnerable components, such as fillings, loess deposits, ancient wall mosaics, sewage, and microclimate-buried walls, they were analyzed regarding their amplitude of dynamic and sequential evolution.
Comparing these results with topographical and geomorphological mapping, we noticed a very sensitive relation between cracks (density and orientation) and differential settlements (localization, elevation, and shape) on the mosaic pavement with self-potential minimum and maximum values. Even if the moisture of deposits, fillings, and buried ruined buildings became lower with time, the hydrodynamic and morphodynamic processes are slow but active, having an impact in other ways on the mosaic pavement.
Anomalies of the apparent resistivity values indicate a fragile hydrogeological environment at shallow depths that are susceptible to shallow geomorphological dynamics (
Figure 15), especially if they are located above the mosaic pavement level.
Zoning the vulnerability of the environment around the cultural heritage of the Roman Edifice with Mosaic (
Figure 16) into seven classes is a key feature of improved risk management and emphasizes clearly the sectors that still confront natural and anthropogenic geomorphological and hydrogeological hazards.
The vulnerability assessment highlights the critical condition areas that characterize the mosaic pavement and its northern, central, and eastern sides. Higher vulnerability overlaps on the mosaic pavement and its north, northwest, and east surroundings. The low vulnerability of the area from the north-east side of the mosaic pavement is because of the effect of a historical pluvial drain sewer parallel with the northeast ancient wall [
24], which provides a higher degree of protection for the mosaic pavement from its immediate environment. The other area with low vulnerabilities is located at the south, southwest, and west of the mosaic pavement and can be related to the repair works of the sewage system. As a result, the humidity variations in the Roman gallery became lower. Over the decades, improper maintenance of concrete buildings with the role of protecting the ancient mosaic has partially contributed to increasing damage to the Roman Edifice with Mosaic.
5. Conclusions
Variations of the deposits’ moisture and of the sewage water in the foundation of the Roman Edifice with Mosaic during the last decades and of the geomorphological hazards at large scale were confirmed through non-destructive geophysical and geomorphological methods. Low resistivity values of filling and loess deposits indicate leakages from the city sewage system, close to museums and civil buildings. Water seepage-induced processes are revealed by the medium resistivity values of loess and limestone deposits. High values of resistivity indicate dry deposits; the cracks in a mosaic and natural deposits can be distinguished.
The comparative analysis of the Roman Edifice with Mosaic condition between 2008 and 2019 points out multiple sources of infiltrations and exfiltrations, natural and anthropogenic, as well. Despite the decrease in leakages and anthropogenic water sources due to the engineering drain effect, the suffosion processes and differential settlements of the shallow sedimentary deposits persist. The removal of the seepage near the mosaic pavement and also the pluvial water effect led to an increase in the apparent resistivity. As a result, a more intense hydrogeological process continues to damage the mosaic pavement, such as through differential settlements of the natural and anthropic deposits underlying the mosaic. A side-effect of the high humidity degree of the microclimate in the building, which protects the mosaic, is the increase in hydrostatic pressure in the ancient walls. From this level down in depth, it is recommendable to perform engineering drains (between the cutting front and ancient walls) to collect the groundwater and moisture and to discharge them beyond the ancient edifice, at the bottom of a consolidated slope, for proper maintenance.
The interest in preserving the mosaic pavement can be expressed by: avoiding large fluctuations in moisture and maintaining a constant status of the surrounding land, especially in the northwest, west, northeast, and east of the mosaic, and carry out the maintenance of the protective building, maintaining a constant microclimate, such as a moderate thermic and humidity regime, and constant ventilation so that no excess moisture is produced at the level of the mosaic pavement or the ancient walls by condensation processes.
However, the high humidity of temporary infiltration (at least in the past 20–30 years) causes suffosion, on the one hand, and slip processes on the other hand. Such geomorphological hazards, suffosion and differential settlements, are related to hydrogeological mechanisms, which are slow but continuous and have a seasonal dynamic. The consequences reverberate through rippling mosaic pavement and the remains of ancient walls.
In addition, the high pressure of human activities (tourism included) related to the local features of the cliff magnifies the danger of degradation of the largest Roman mosaics in Eastern Europe.
The results of the geomorphological hazards analysis should increase our understanding of the behavior of cultural heritage in fragile environmental conditions with the purpose of continuously improving the risk management plan.
The findings of the study are useful at the local level to improve and update the management plan. The retrospective picture offered by this study for the last decade allows for continuous drawing in the diagnostic phase of the dynamics of this site in relation to the geological and geomorphological environment. The site’s state has come to the attention of the local authorities and museum managers, and a comprehensive plan for its conservation has been underway since the end of 2022.
The strengths of this study are as follows: identification of vulnerable hot spots where immediate and short-term preservation measures are needed to prevent further damage; cross-analysis of quantitative and qualitative data; and assignment of different weights depending on the central interest of the analysis, which allows for a more accurate assessment of vulnerability. Moreover, other factors can be considered in zoning vulnerability analysis.
The limitations of this approach arise from the method, which only allows for the overlapping of factors with different weights without identifying the effects resulting from the multiplication of causes; interpretation and cross-analysis depend on the expertise of the specialists and the continuity of the data array. This study provides only a sequential analysis, and the monitoring of the state of the heritage would provide a more accurate picture, allowing adaptation, real-time updating, and increased efficiency in risk management.
The environmental rehabilitation and protection of cultural heritage against compound natural and anthropogenic hazards reflect the care of society for historical monuments and should be of paramount concern to the local and central authorities.


 ,
, 


