Article

Dynamic Monitoring of Oxygen Supply Capacity of Urban Green Space Based on Satellite-Based Chlorophyll Fluorescence

1
School of Economics, Hangzhou Normal University, Hangzhou 311121, China
2
Lanzhou Institute of Seismology, China Seismological Bureau (CEA), Lanzhou 730000, China
3
Institute of Hydrogeology and Environment of Ningxia, Yinchuan 750026, China
4
School of Geographical Sciences, Southwest University, Chongqing 400715, China
5
Key Laboratory of Geospatial Technology for Middle and Lower Yellow River Regions (Henan University), Ministry of Education, Kaifeng 475004, China
6
Chongqing Pioneer Satellite Technology Co., Ltd., Chongqing 401420, China
*
Authors to whom correspondence should be addressed.
Land 2023, 12(2), 426; https://doi.org/10.3390/land12020426
Submission received: 14 November 2022 / Revised: 12 January 2023 / Accepted: 13 January 2023 / Published: 6 February 2023

Abstract

:
Green plants provide food, energy and oxygen sources for human beings and animals on Earth through photosynthesis, which is essential to maintain regional ecological balance. However, few studies have focused on the natural oxygen supply capacity of urban green spaces. As a companion to photosynthesis in leaves, solar-induced chlorophyll fluorescence (SIF) contains abundant photosynthetic information. Currently, satellite-based SIF observations are considered to be a rapid and nondestructive ‘indicator’ of plant photosynthesis, which provides an alternative way to quantitatively assess the spatio-temporal dynamics of oxygen supply capacity in urban green spaces. This study examined the spatial patterns, long-term trends, and environmental control factors of SIF in the nine central cities in China from 2001 to 2020 based on the time-series of the global reconstructed GOSIF-v2 SIF dataset. The results were as follows: (1) There was a contrasting spatial difference between southern and northern cities in China, and multi-year mean SIF values of the southern cities were generally higher than those of the northern cities; (2) The interannual dynamics of SIF in each city generally showed an upward trend, with fluctuations, and the intraannual seasonal differences were more significant in northern cities than those in the southern cities; (3) The spatial trend analysis showed that Beijing, Guangzhou, and Chongqing have had the most significant improvements, followed by Xi’an, Wuhan, Chengdu, and Zhengzhou, while Tianjin and Shanghai have had the least improvements; and (4) The expansion of construction land has exerted significant impacts on the dynamics of the SIF trend in several cities, but it is not the only factor. All analyses indicated that the improvement of vegetation structure and function in the area can offset its negative effect.

1. Introduction

Terrestrial vegetation is an important component of the biosphere and an important indicator of climate and ecological changes [1]. The biophysical and biochemical parameters of vegetation, such as leaf area index, chlorophyll content, leaf width, etc., can be well monitored through the satellite-based information of electromagnetic waves reflected, radiated, and scattered by vegetation [2]. Vegetation remote sensing can estimate several physical quantities related to plant photosynthesis, such as the evaporation of water from the vegetation surface, photosynthetic intensity (dry matter productivity), chlorophyll fluorescence, etc. As a by-product of plant photosynthesis, chlorophyll fluorescence is produced by the plant and represents a more refined physiological signal. Therefore, compared with the reflectance data, it has a closer connection with plant photosynthesis and can more directly reflect the dynamics of actual plant photosynthesis [3,4].
The phenomenon of chlorophyll fluorescence induction was first observed and documented by Kautsky with the naked eye in 1931, and it was found that the intensity of chlorophyll fluorescence was related to the fixation of CO2 through vegetation photosynthetic activity [5,6]. In addition, chlorophyll fluorescence gradually became a new technique well combined with the study of plant photosynthesis, and later was widely used in terrestrial carbon cycles. Solar-induced fluorescence (SIF) is generated by the excitation of photosystems I and II in plants [7], and part of the light energy from photosynthesis in plant leaves will be emitted as fluorescence [8]. The emission band of SIF ranges from 650 nm to 800 nm, and there are two emission peaks including the red band (685 nm) and the far-red band (740 nm), respectively. The former is primarily generated by photosystem II, while the latter is generated by photosystems I and II [9,10]. SIF can run through the whole photoreaction stage of photosynthesis and contains a large amount of photosynthetic information [11]. Thus, SIF is considered a fast and nondestructive ‘indicator’ that can well reflect plant photosynthesis [12].
Vegetation remote sensing, represented by vegetation index based on ‘greenness’ observation (such as the normalized difference vegetation index, NDVI), has greatly promoted the understanding of the Earth’s biosphere on the macroscopic scale in the past 30 years. Previous works have used the dynamics of NDVI to successfully understand the vegetation’s intensity in rural or urban regions, as well as urban and regional planning from an ecological aspect [13,14,15]. However, it can only detect the ‘potential photosynthesis’ of plants through ‘greenness’. Large differences existed between the greenness-based vegetation index and true vegetation photosynthetic productivity, as the optical remote sensing can only acquire the biophysical and biogeochemical information of the land surface from a few multi-spectral signatures [16]. These signals are powerless to monitor the complex vegetation structure, such as the forest ecosystems with arbor, shrub and grass layers. In recent decades, various satellite-based gross primary productivity (GPP) products have been developed to capture the large-area and long-term dynamics of terrestrial vegetation [17], whereas uncertainties in such products limited their applications. SIF remote sensing is a new technology that has developed rapidly in recent years, which can make up for the shortage of current vegetation remote sensing observation, and provide a new strategy for monitoring the carbon cycle of terrestrial ecosystems. Moreover, SIF has unique technical advantages in the detection of the photosynthetic physiology of vegetation, and it is a direct detection method of ‘actual photosynthesis’ [4]. Many studies have reported the close correlation between SIF and GPP, because both SIF and GPP rely on the incident radiation and the absorption of light by chlorophyll in the whole canopy [18,19], which also exhibits a strong link between SIF and the oxygen supply capacity of urban green space. In the early stage, SIF played an important role in the study of plant species differentiation, plant stress, pest, and disease monitoring. Furthermore, in recent years, with the improvement of data quality as well as the spatial and temporal resolutions, SIF has been applied more widely and has become an extremely important data source in ecological remote sensing research [20]. Today, there are exceptional breakthroughs on these fronts of SIF sensor technologies, retrieval algorithms, and the modelling of leaf and canopy fluorescence as well as photosynthesis.
Plants provide a wealth of ecosystem services through photosynthesis, which are crucial for most life on Earth. As an important product of plant photosynthesis, and the most important energy source for sustaining life, oxygen is consumed for respiration, combustion, and all oxidation processes (including the decay of organic matter). Plant photosynthesis is the main source of oxygen in the atmosphere. As an important part of the urban environment, green space is the heart and lung, as well as the oxygen bar, of the city. It purifies the environment and regenerates the city, and has become an indispensable part of modern urban construction [21]. A good urban ecological environment can ensure the sustainable development of the city, thereby making the ecological and social benefits achieve simultaneous development, thus realizing a virtuous cycle. The photosynthesis of plants is the most significant environmental benefit of green space, it consumes and fixes CO2 in the city, converts it into O2 necessary for human beings, maintains the carbon and oxygen balance, mitigates the greenhouse effect, and improves environmental quality. Therefore, urban green space plays an important role in improving microclimate and environmental comfort. Nevertheless, given the technical limitations, there has been a long-standing lack of research on dynamic monitoring to assess the oxygen supply capacity of urban green spaces.
Therefore, the application of long-term time series SIF remote sensing data can reflect the dynamic changes in the oxygen supply capacity of urban green space in time and space. This study carries out the spatial and temporal dynamic assessment of urban oxygen supply capacity within the national central cities in China as an example, which will provide an important scientific basis for strengthening the green construction of Chinese cities and urban spatial microclimate research.

2. Materials and Methods
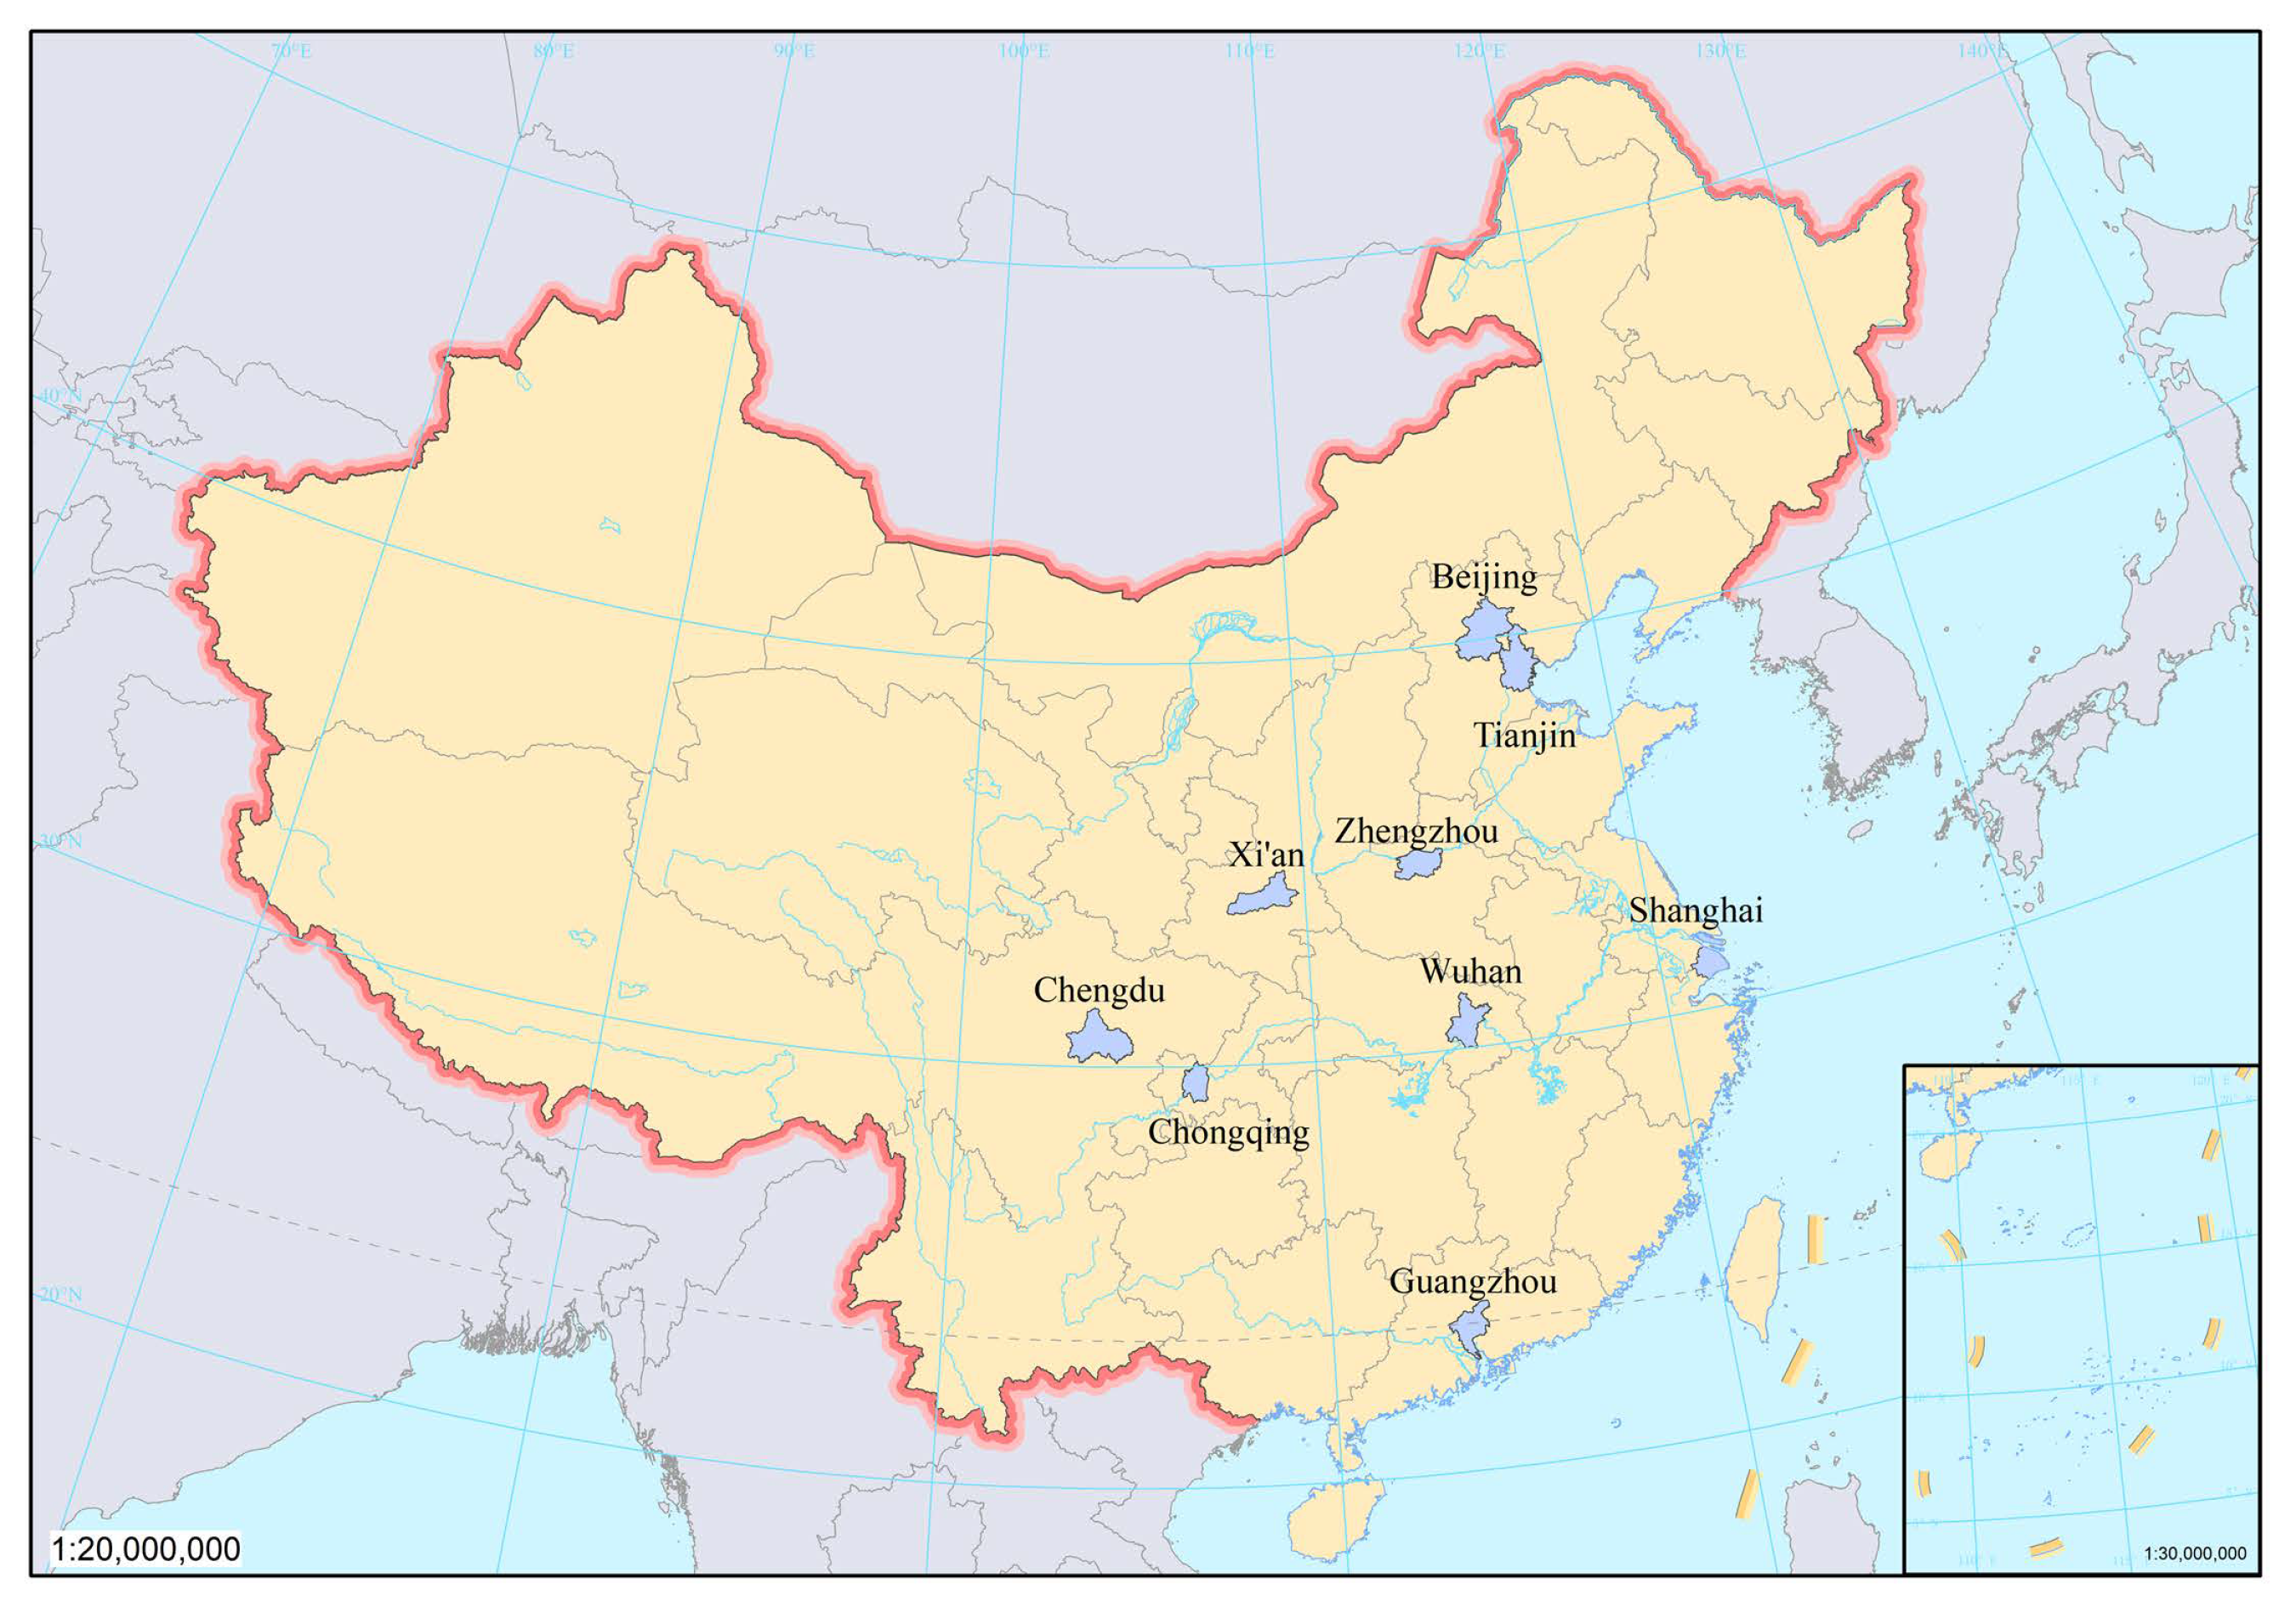
2.1. Study Area

In February 2010, the Ministry of Housing and Urban-Rural Development of China released the National Urban System Plan (2010–2020), which puts forward the planning and positioning of the five national central cities (Beijing, Tianjin, Shanghai, Guangzhou and Chongqing). From May 2016 to February 2018, the National Development and Reform Commission and the Ministry of Housing and Urban-Rural Development successively supported Chengdu, Wuhan, Zhengzhou and Xi’an in building national central cities. The national central city is the ‘tower city’ with the strongest comprehensive strength in China, which plays a leading role in China’s urban system and national economic and social development [22]. Therefore, this study takes the nine national central cities as the research object, as shown in Figure 1 and Table 1. Among these cities, Guangzhou and Shanghai lie in south and east China, respectively; Chengdu and Chongqing, and Wuhan and Zhengzhou are located in southwest and central China, respectively; Beijing and Tianjin lie in north China, and Xi’an lies in northwest China. The climate types in such cities are diverse. Generally, the vegetation is green for almost the whole year in southern China, whereas the dominant vegetation species are deciduous in northern China. The assessment of the oxygen supply capacity of urban green space for the nine central cities in China is of exemplary significance for guiding the construction and management of urban green space.

2.2. Data Source and Processing

2.2.1. Remote Sensing-Based SIF Data

SIF data can be measured by a series of space-borne satellite sensors with an ultra-high spectral resolution, for example, the GOME-2 sensor carried by the European Space Agency on the satellite MetOp-A, the OCO-2 sensor of NASA, and the CO2 monitoring satellite of China (TanSat) [20]. However, the spatially and temporally sparse nature of remote sensing-based SIF data makes it difficult for these data to be used in various applications from the ecosystem to the global scale. Fortunately, a global SIF product (GOSIF, V2) at a 0.05° spatial resolution and an 8-day interval over the period 2000–2020 has been derived from individual OCO-2 SIF soundings, MODIS data, and meteorological reanalysis data (http://globalecology.unh.edu/data/GOSIF.html; accessed on 23 August 2021). This study uses the global reconstructed GOSIF dataset, which has a finer spatial resolution, continuous global coverage, and longer time records, and provides the feasibility of dynamic monitoring of the oxygen supply capacity of urban green spaces in long time series [23]. These SIF estimates from GOSIF performed well at global 91 eddy covariance-based flux sites (R2 = 0.73, p < 0.001). In this paper, the GOSIF dataset from 2001 to 2020 was selected, with a total of 260 periods at the temporal resolution of yearly and monthly.

2.2.2. GAIA Data

Impervious surfaces are artificial surfaces, such as houses and roads, formed by human activities on the natural surface. This land use type is mostly distributed in patches except for roads, and is an important indicator for urbanization [24,25,26]. Global Artificial Impervious Areas (GAIA), as an important indicator of the world’s built areas, play a key role in controlling the flow of energy and material, and reflecting the level of human activities [27,28]. Therefore, multi-periods of GAIA data can reflect the dynamics of urban construction land [23]. The expansion of urban space will lead to a large number of impervious water surfaces replacing the natural surface landscape, dominated by vegetation, particularly in large cities, whose high proportion of impervious water surfaces affects the urban ecological quality. The GAIA dataset used to reflect the expansion of urban construction land in this study was drawn with a 30 m spatial resolution Landsat image as a base map to assist other datasets from 1985 to 2018 with annual time resolution. In this work, GAIA data from 2001, 2010 and 2018 were used to analyze the impact of urban expansion on vegetation (http://data.ess.tsinghua.edu.cn; accessed on 30 August 2021).

2.3. Statistical Analysis

2.3.1. Multi-Year Averages

The study calculated the multi-year mean annual SIF data of each central city, to reflect the spatial pattern of SIF values. The formula is as follows:
a S I F = 1 20 I = 1 20 S I F
aSIF represents multi-year mean chlorophyll fluorescence (SIF).

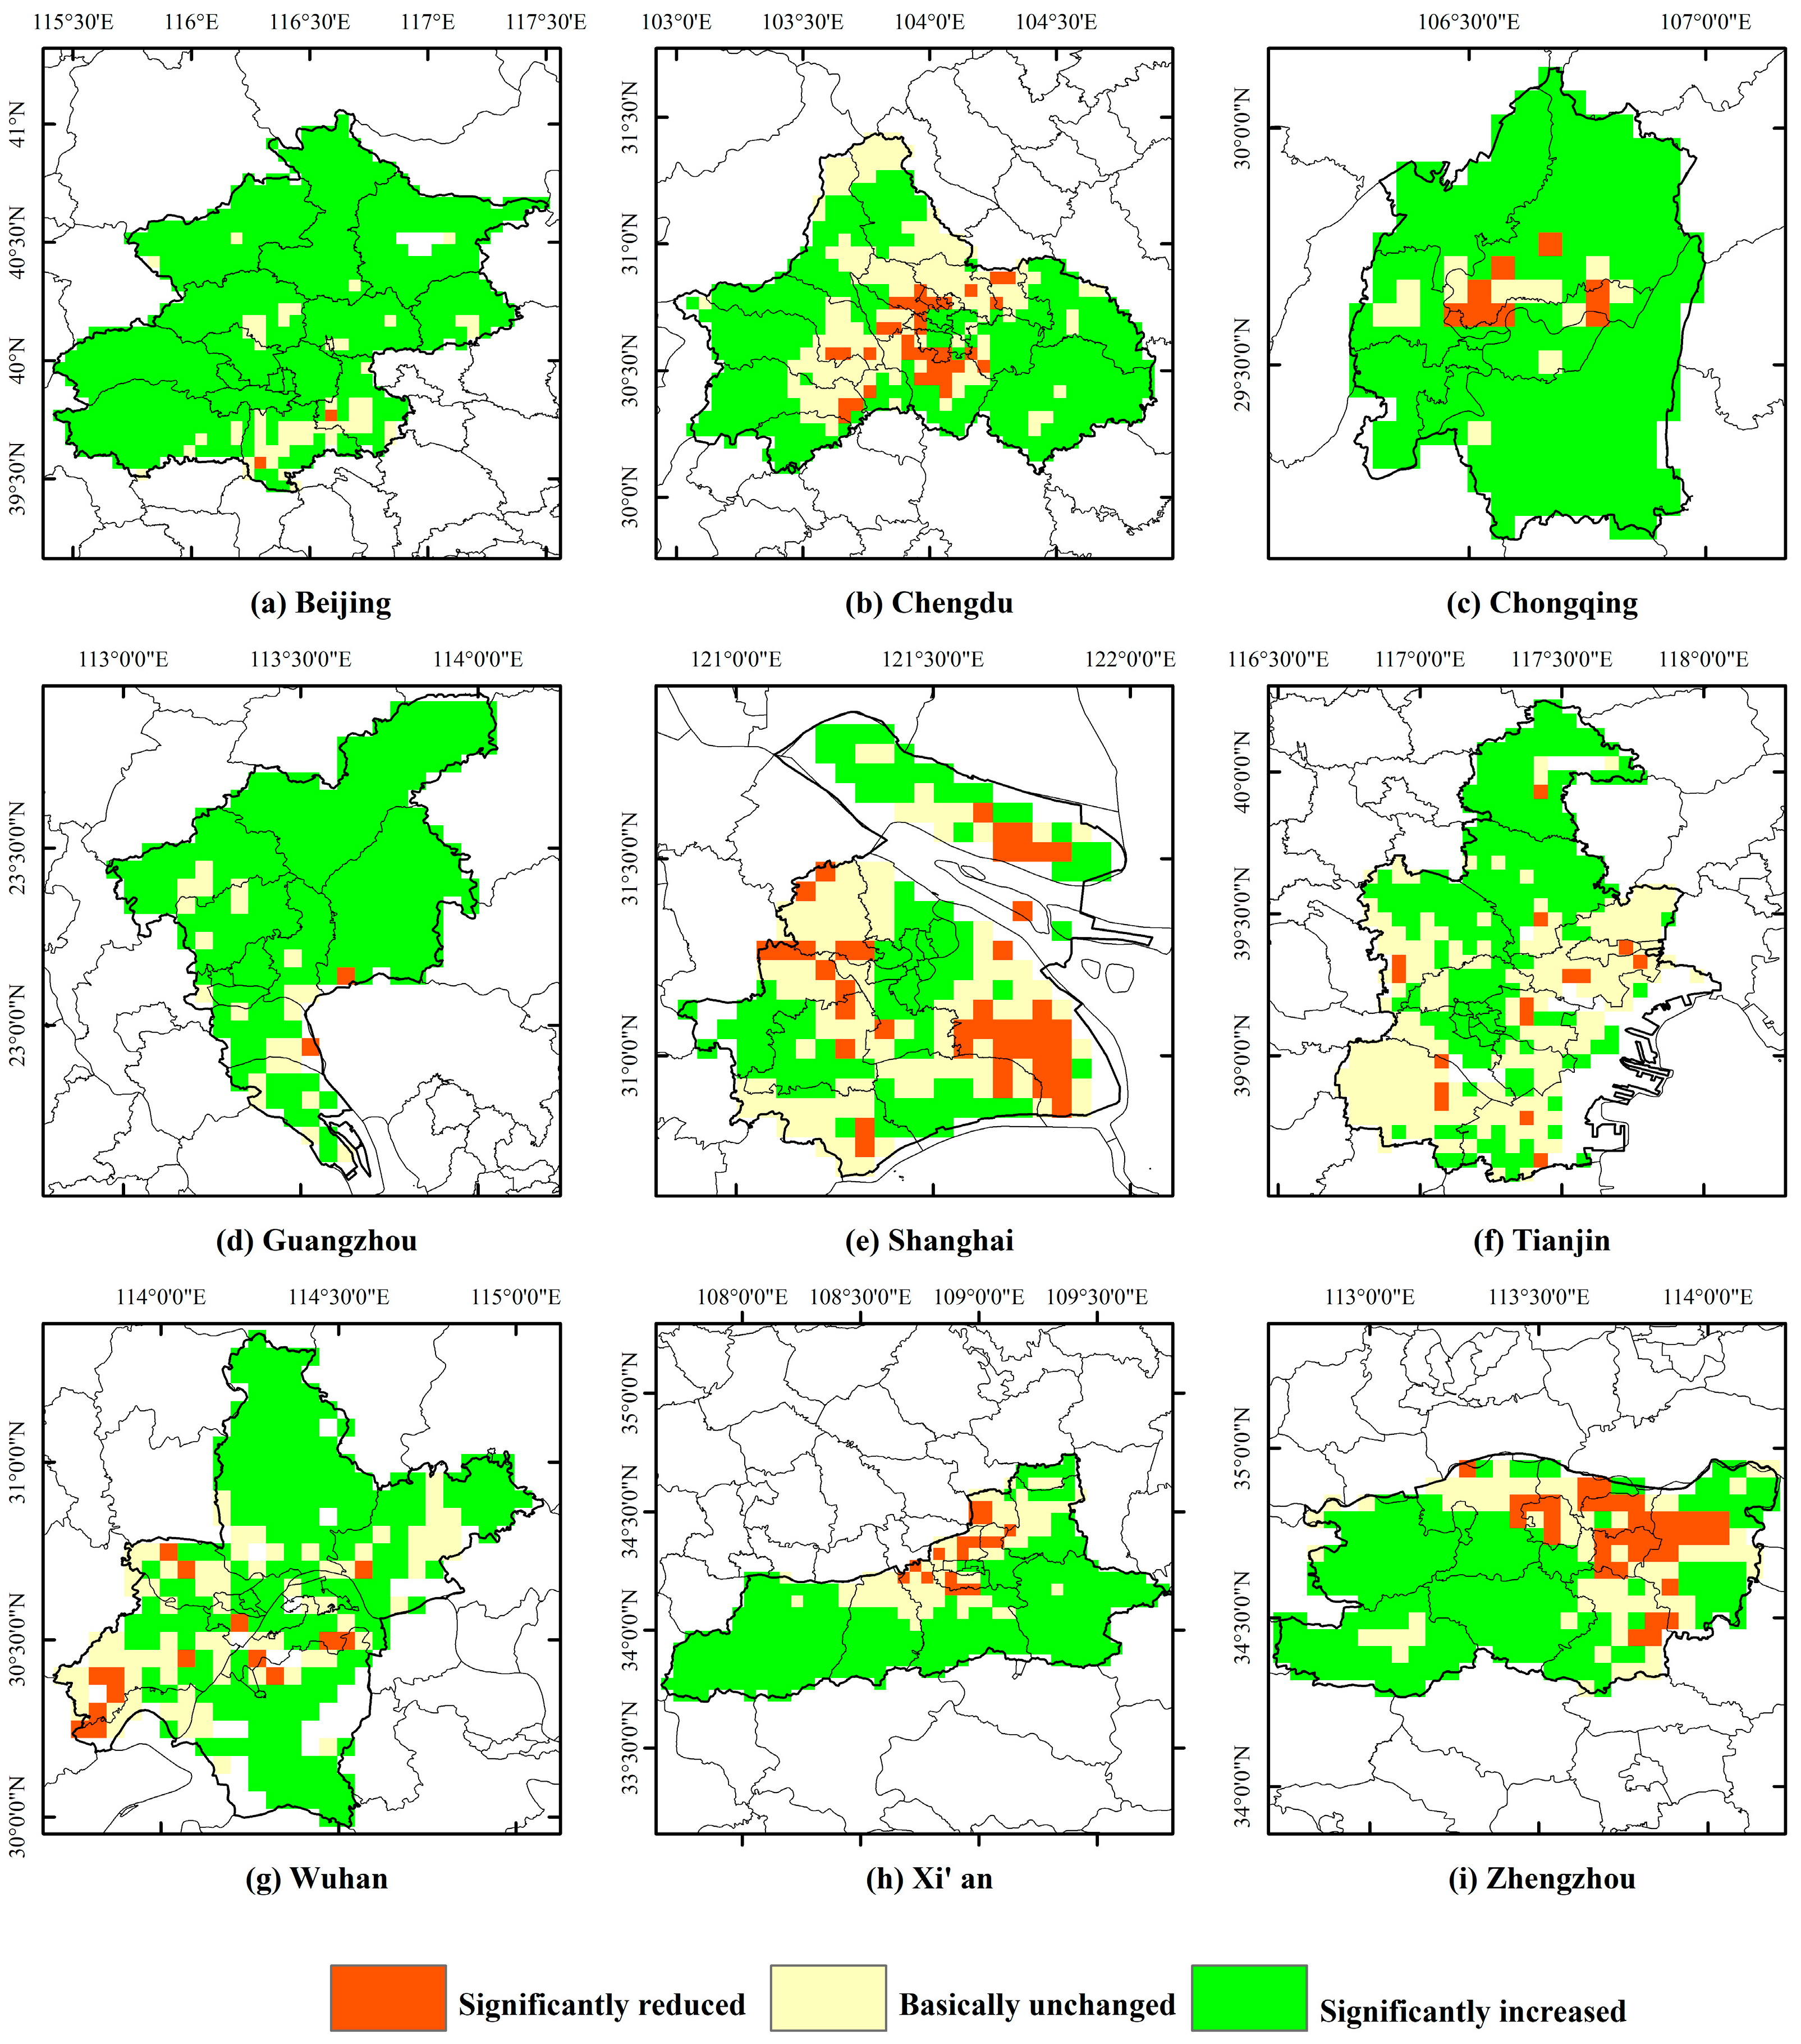
2.3.2. Spatial Trend Analysis

Based on the SIF data obtained after long-term sequence data processing of GOSIF images in 2001–2020 as a variable, a mathematical model of the temporal trend is established by the least squares method. The SIF trend is evaluated over time to reflect the overall spatial change characteristics.
Slope = n i = 1 n i P i i = 1 n i i = 1 n P i n i = 1 n i 2 i = 1 n i 2
n is the cumulative number of years, and is 20 in the present study; Pi is the SIF of the ith year and Slope is the slope of the linear regression equation. The trend and significance raster image of each grid can be obtained by iterating on a cell-by-cell basis using the MATLAB regression function, and the significance level p is 0.05 here.
This study used the Mann-Kendall test method to judge the significance of the trend analysis. It does not require the measured values to conform to a normal distribution or the trend to be linear, and it can be calculated if there are missing values or values lower than one or more detection limits [29]. According to the trend of interannual changes in SIF during the past 20 years, we obtained the frequency distributions of the significance level (p-value) of each pixel. p < 0.05 and p > 0.05 showed that the increasing or decreasing trends in SIF are significant and insignificant, respectively.
In addition, the linear regression method was used to examine the interannual variation of SIF in each city from 2001 to 2020.

2.3.3. Urban Construction Land Expansion Degree

To calculate the change ratio of urban construction land, the number of annual construction land rasters can be calculated by the following formula:
C = GAIA i GAIA j GAIA j
C represents the proportion of change; GAIAi represents the new urban construction land area, and GAIAj represents the old urban construction land area.

3. Results

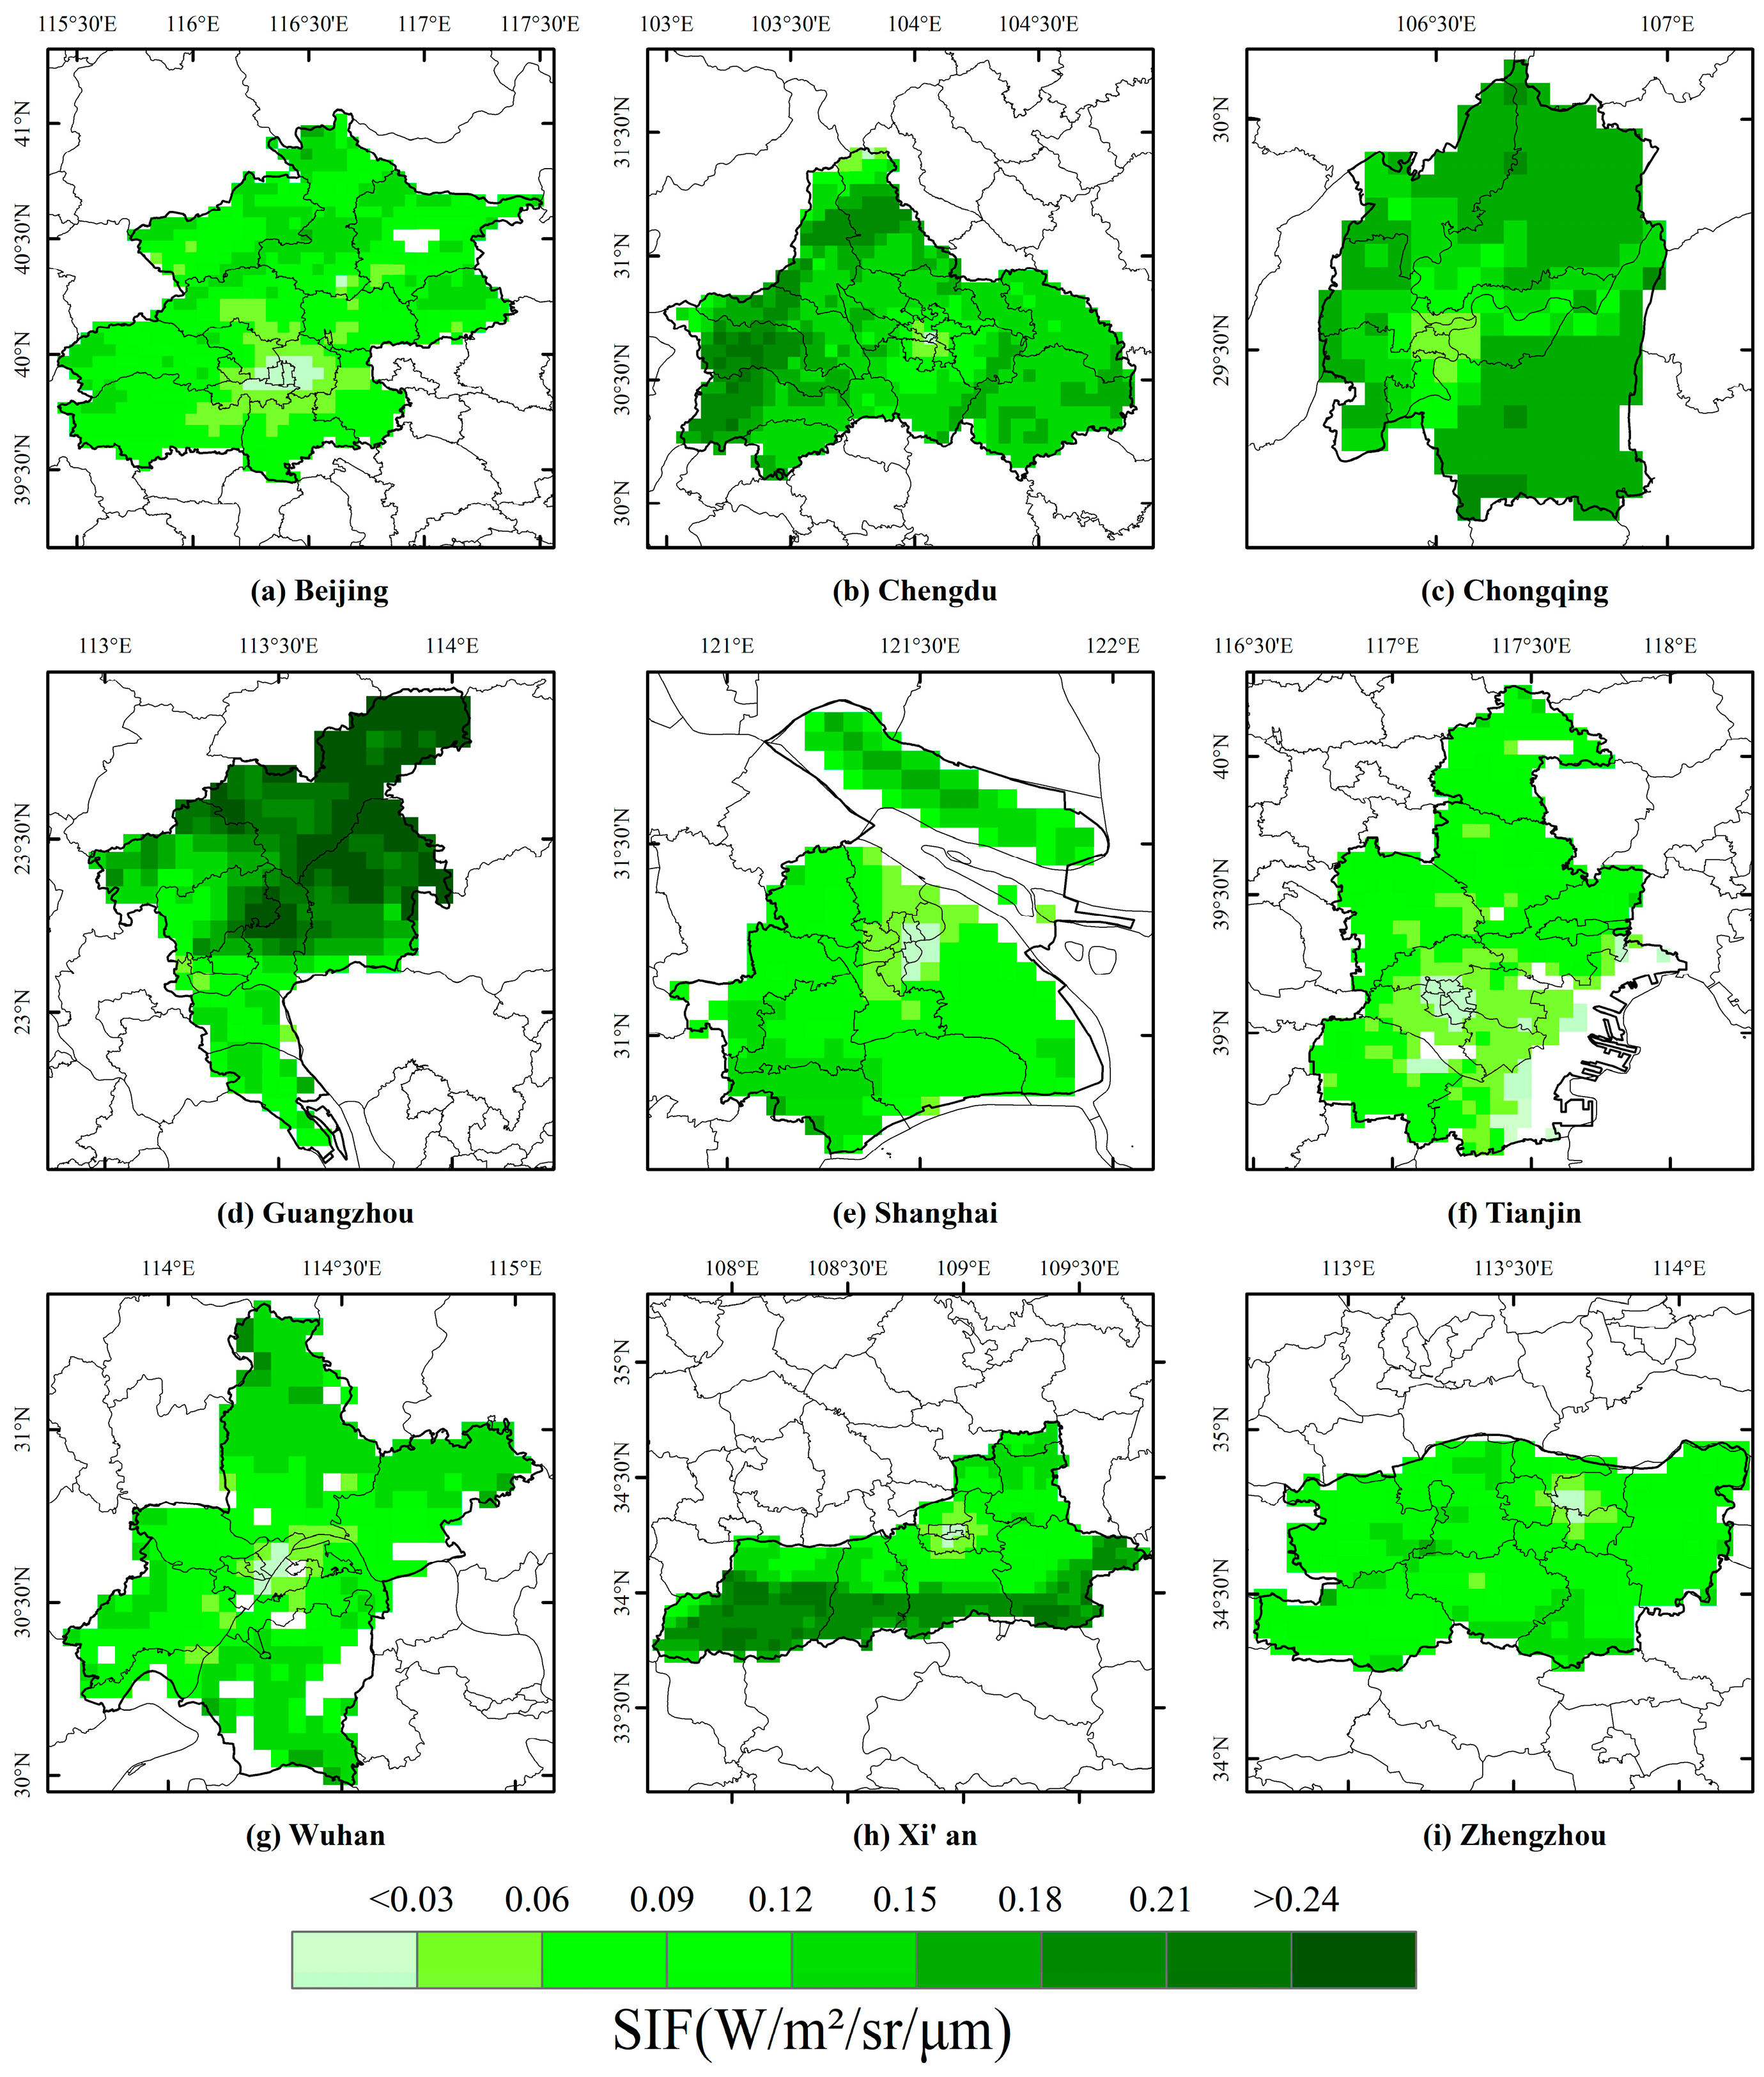
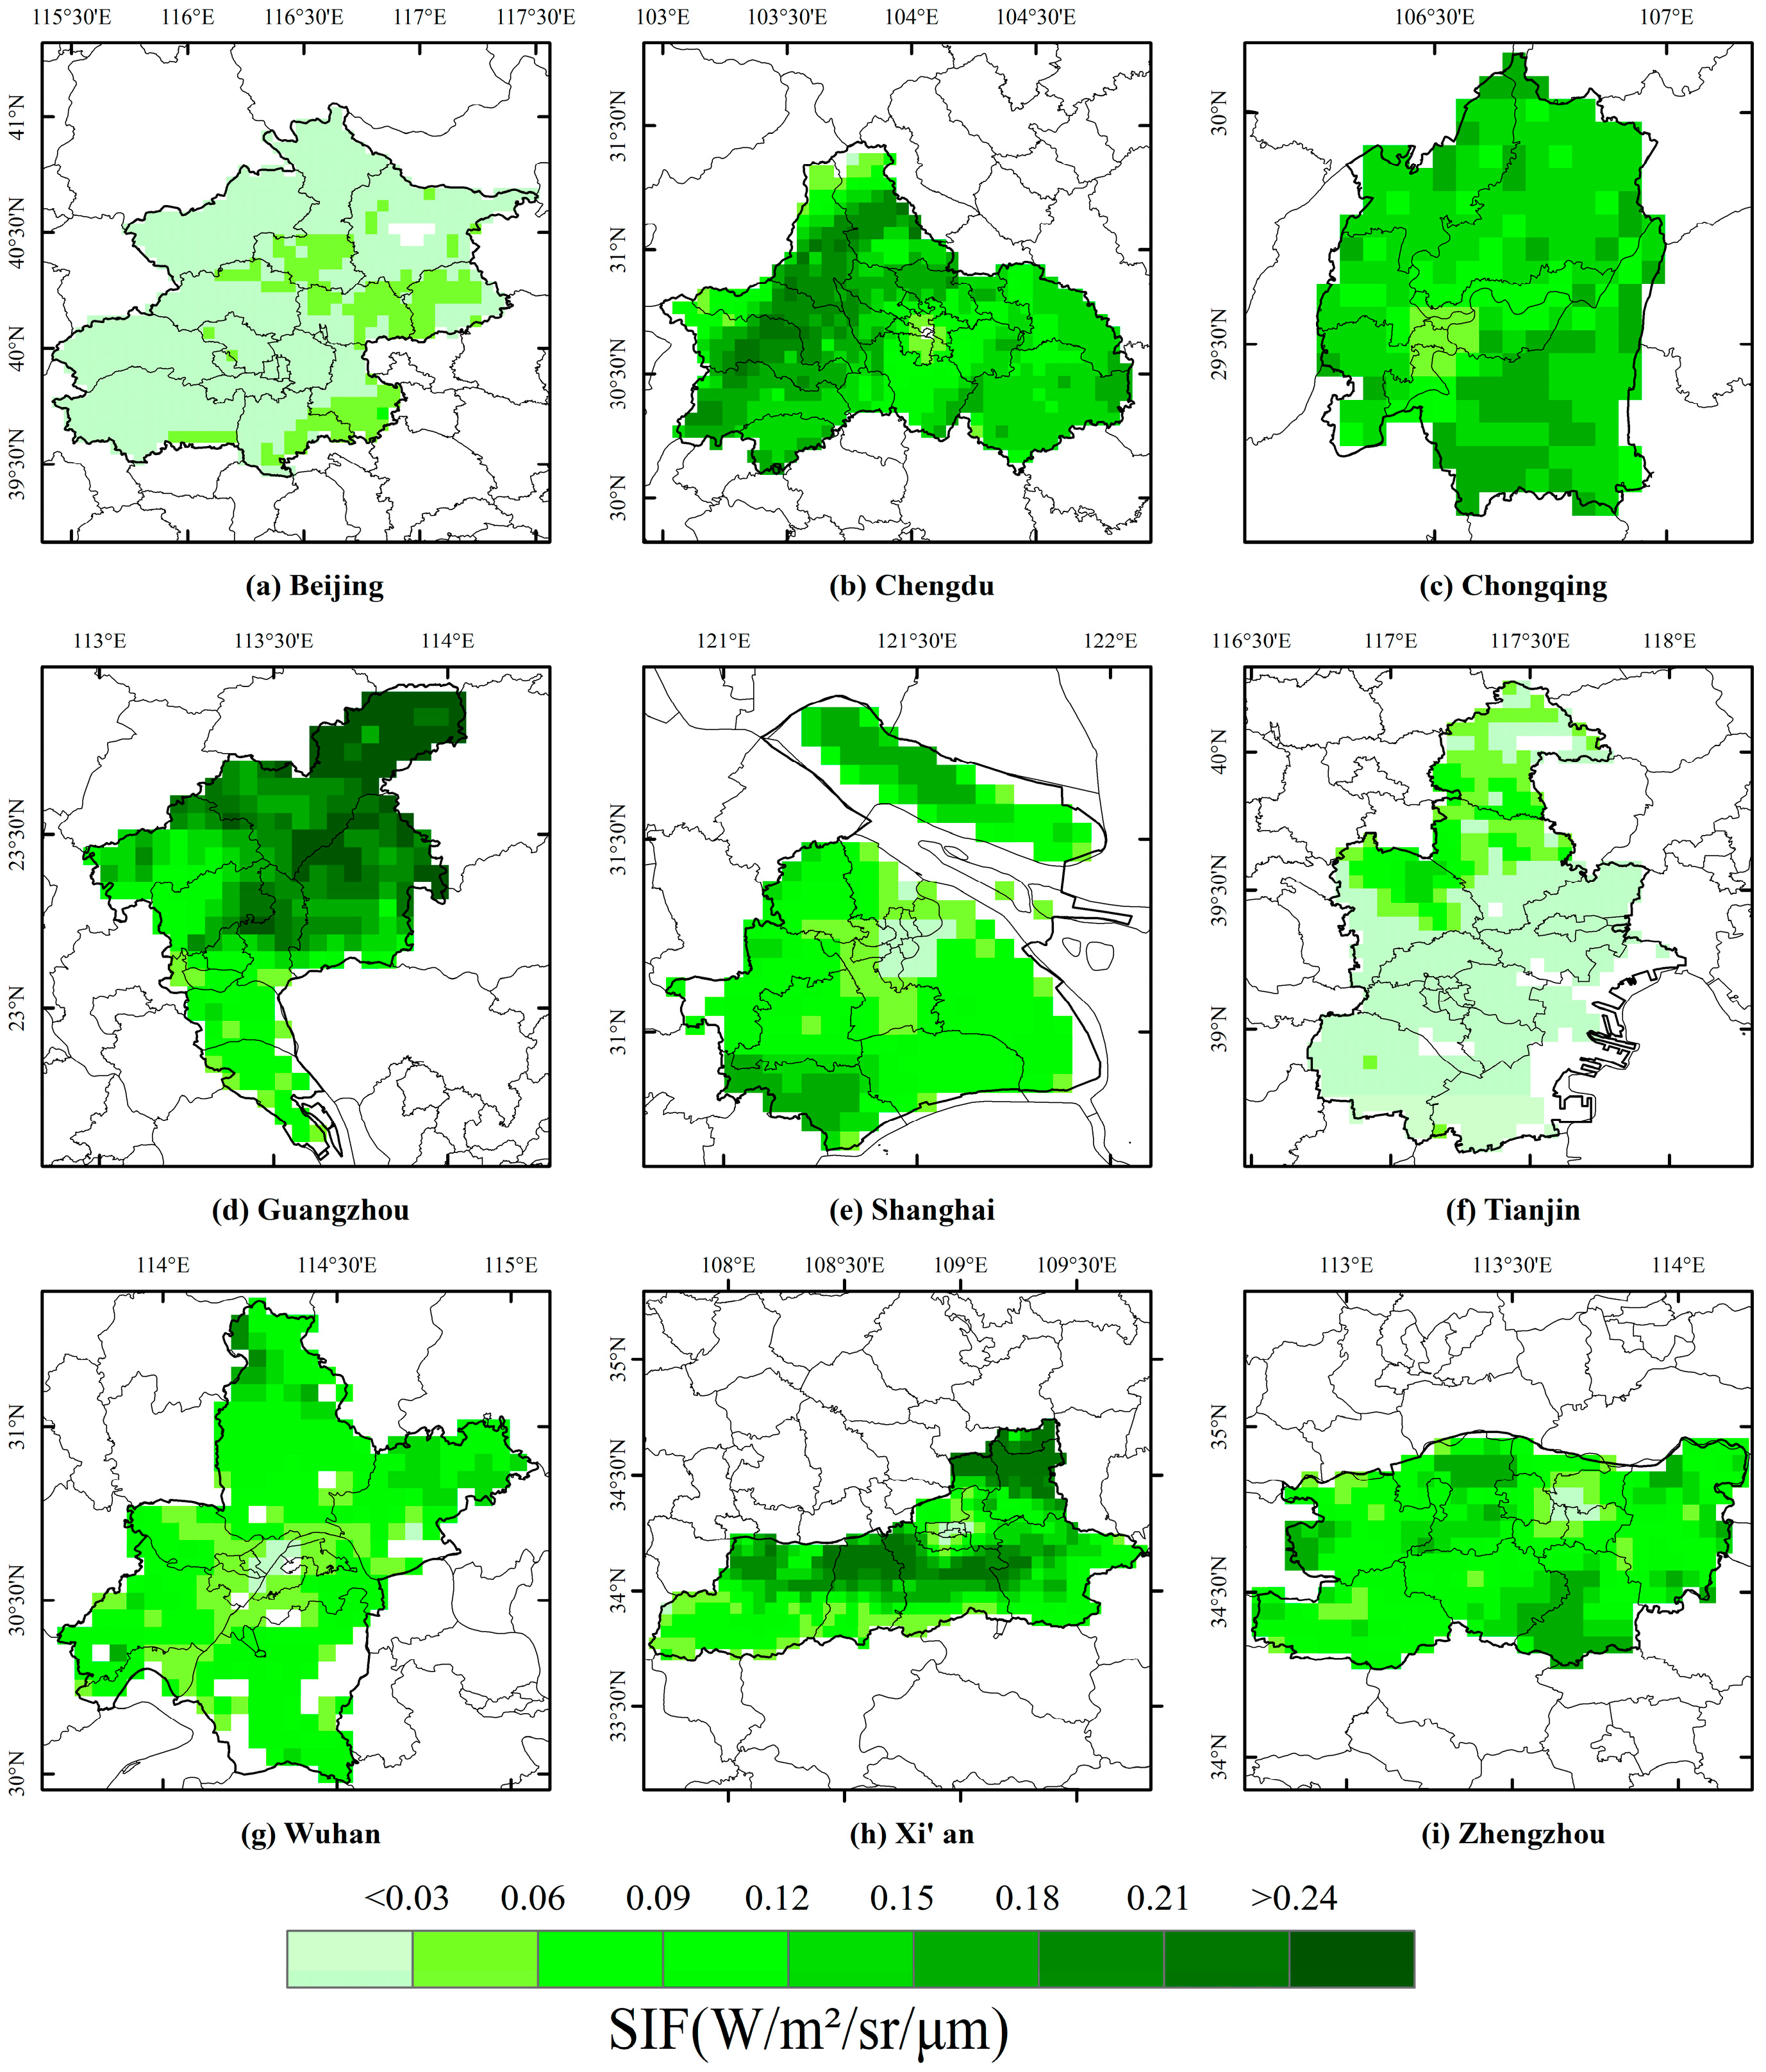
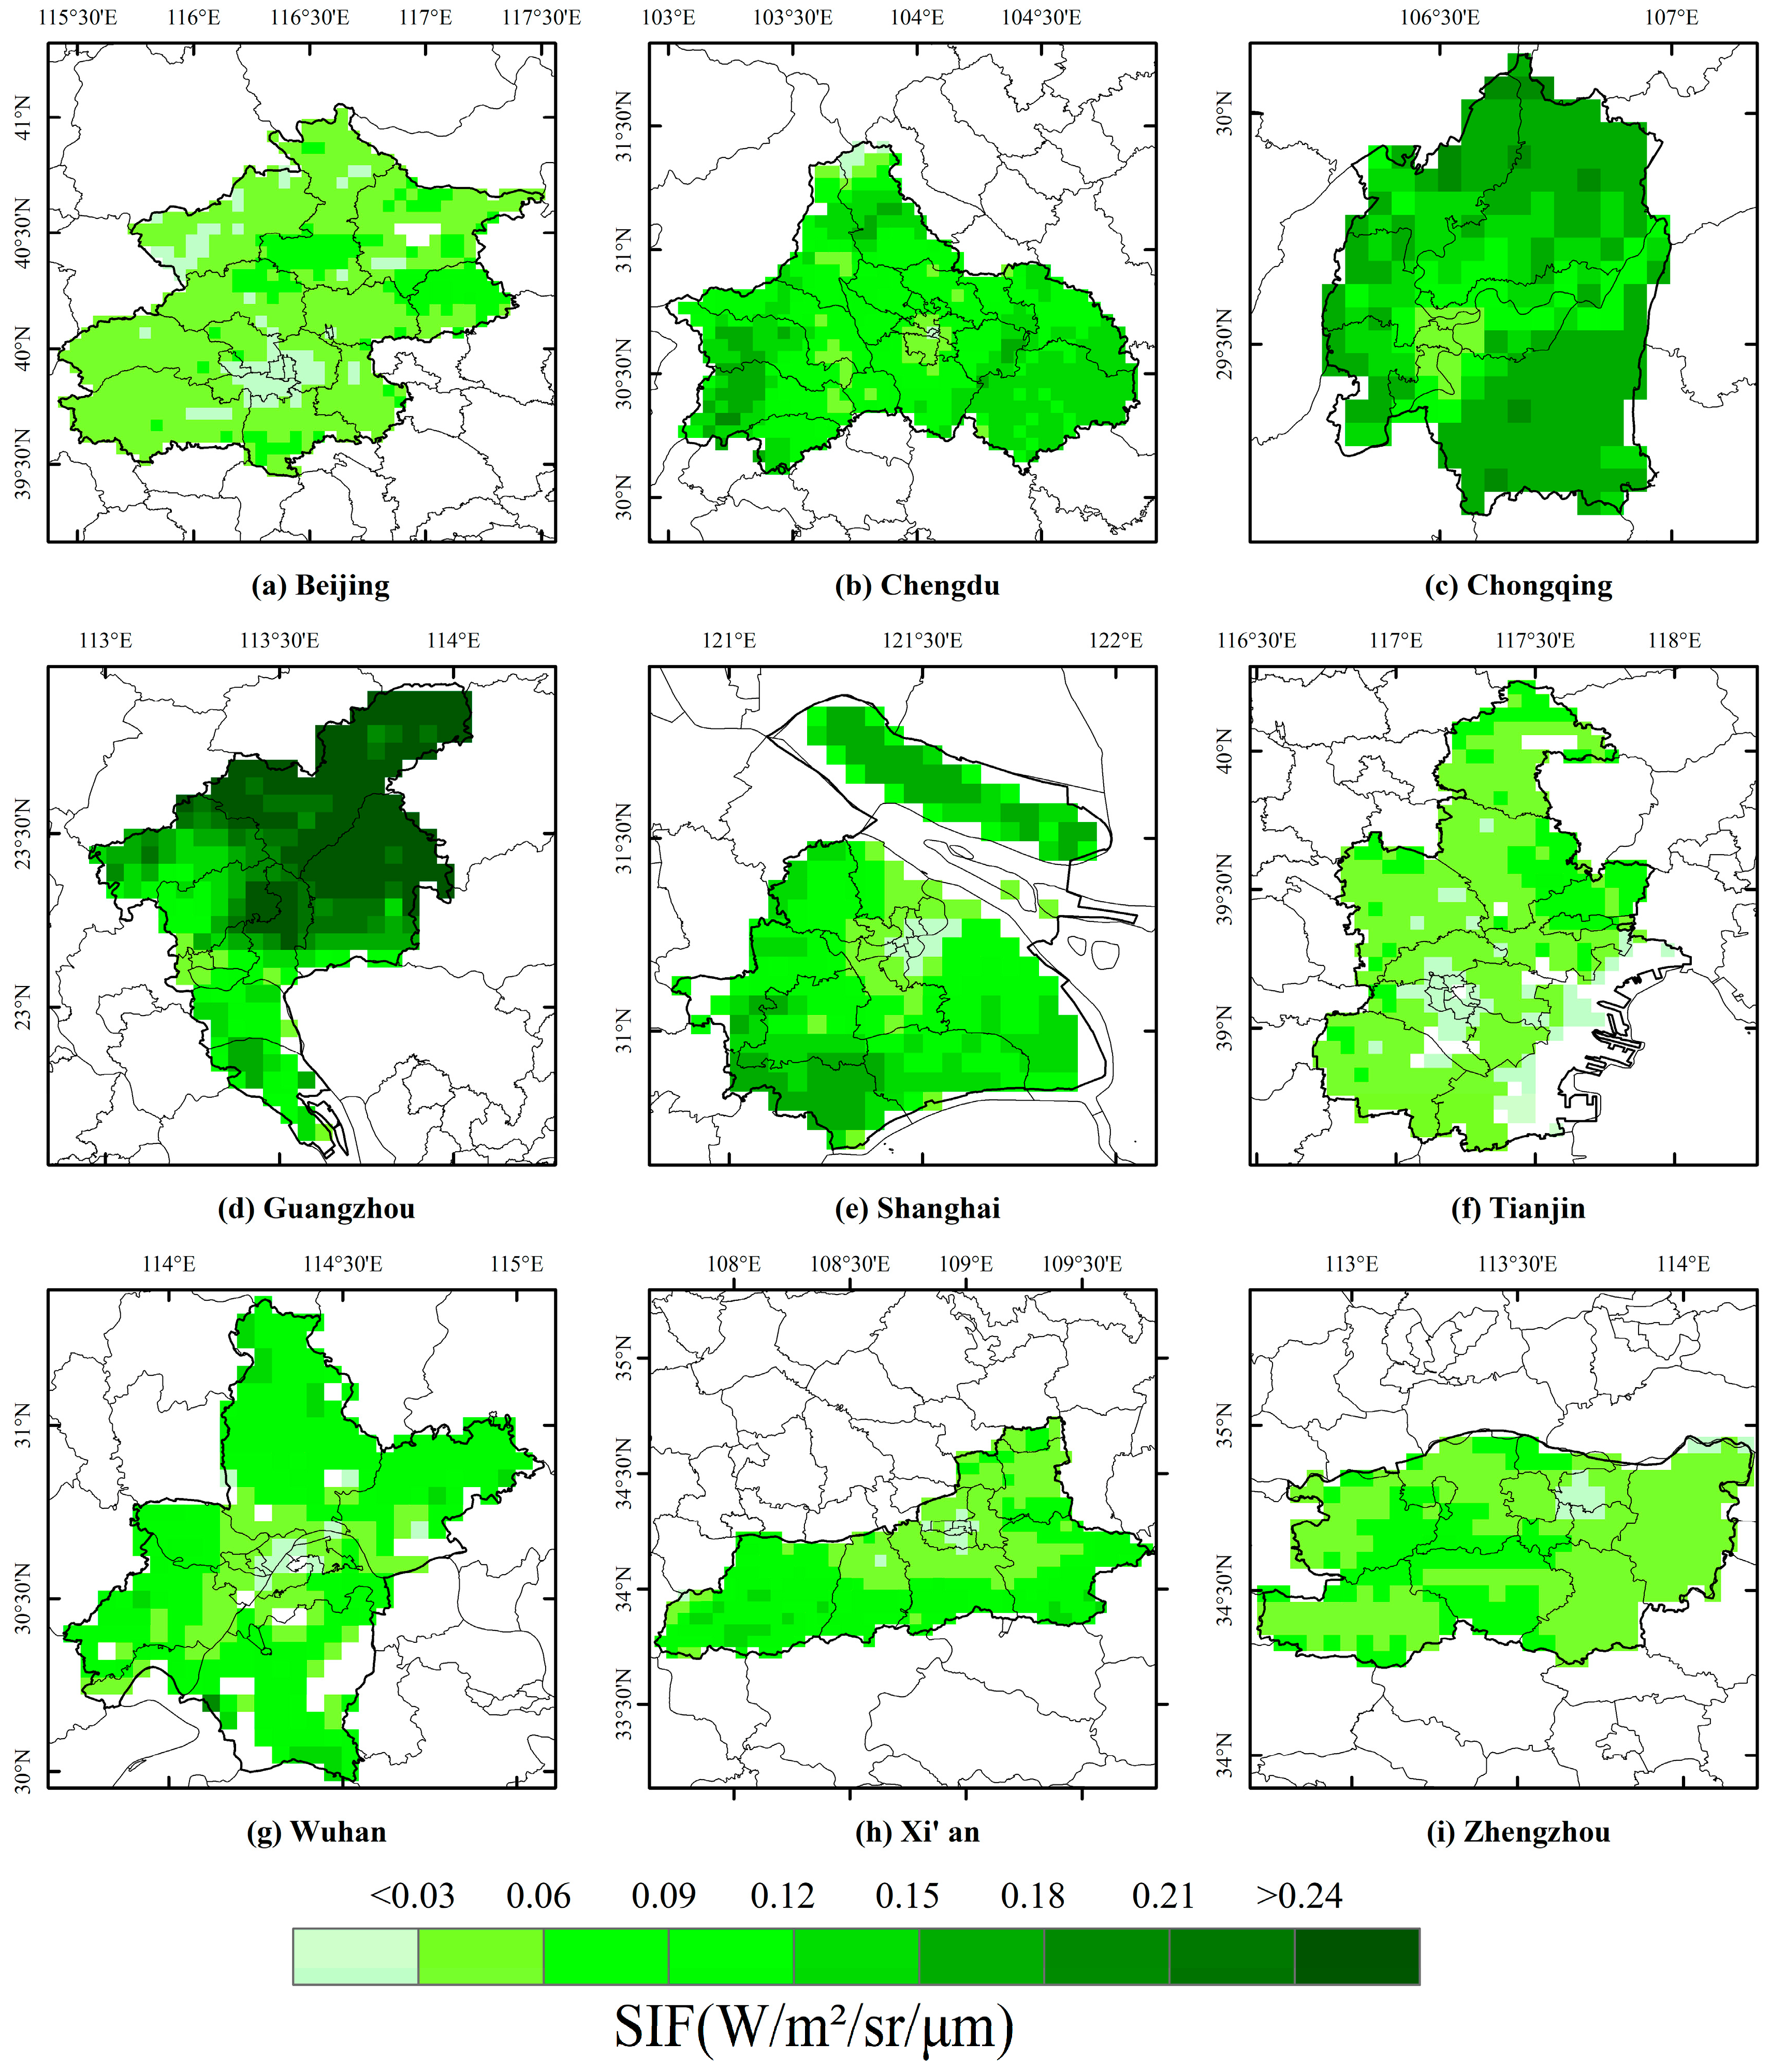
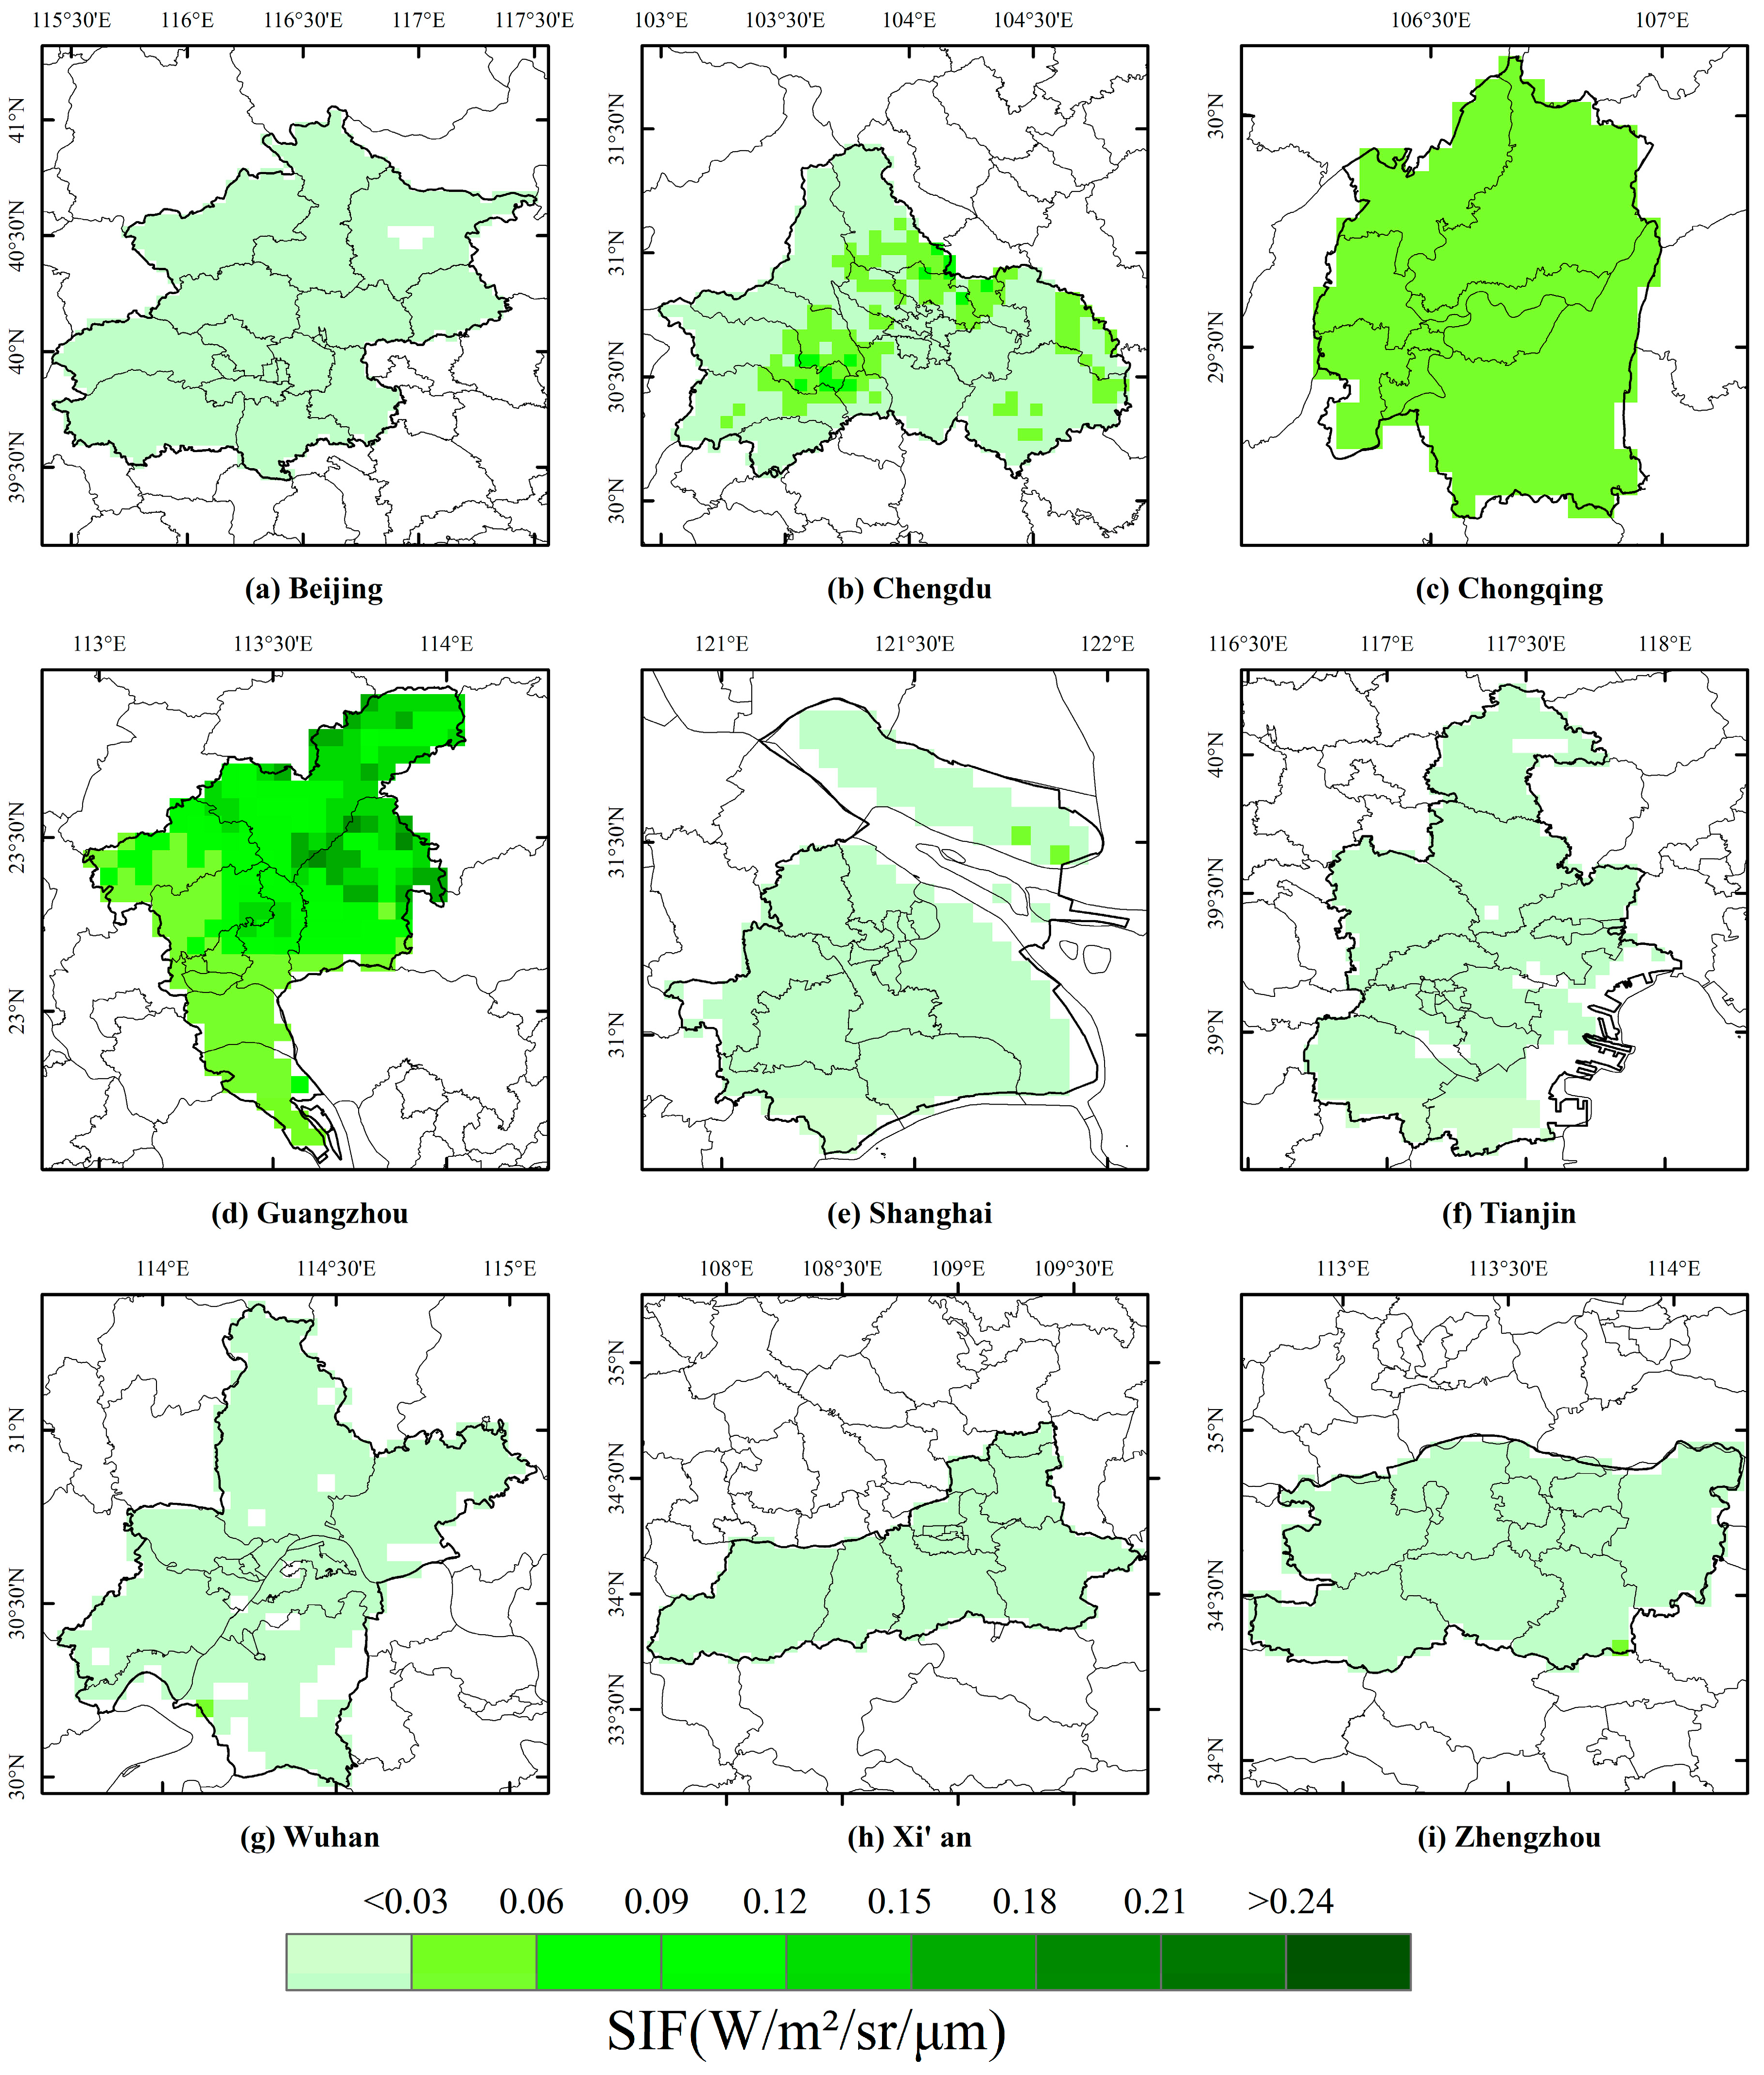
3.1. Spatial Patterns

Spatial patterns of the natural oxygen supply capacity in the nine national central cities were illustrated by averaging the multi-year mean annual SIF data from 2001–2020 (Figure 2). In general, the oxygen supply capacity of urban green space in China showed significant spatial heterogeneity, and the SIF in the southern cities was significantly higher than that in the northern cities, which was primarily related to the microclimate and vegetation types in various urban areas. Guangzhou, Chengdu, Chongqing, Wuhan, and other national central cities that are located south of the Qinling-Huaihe River line, mainly belong to tropical and subtropical areas, which leads to a high natural oxygen supply capacity of urban green space. Particularly, as the southernmost of the nine cities, Guangzhou City is located on the northern edge of the Pearl River Delta. With heat and water at the same period, the region is conducive to plant growth. The terrain of Guangzhou is high in the northeast and low in the southwest. The north is a hilly and mountainous area, with concentrated forests, wherein the higher value of SIF also appeared, and the Yuexiu, Tianhe, Haizhu, and Liwan districts are relatively lower. Meanwhile, Chengdu City is located in the western part of the Sichuan Basin and the hinterland of the Chengdu Plain, with a warm and humid climate. Most of the vegetation is evergreen, hence the SIF is overall high. The topographic difference leads to a spatial difference in SIF. The western part is dominated by hilly mountains with a high vegetation coverage, whereas vegetation in the central urban area is sparse. The area of mountainous areas in Chongqing is relatively large, and the altitude of the terrain decreases from north to south towards the Yangtze Valley. Spatially, the decreasing SIF is consistent with the decreasing altitude of the terrain, thus, the SIF values are larger in Yubei and Banan districts, and smaller in Yuzhong, Nanan, and Jiangbei districts. The landform of Wuhan City belongs to the transition area from the hills of southeastern Hubei to the low hills of the southern foothills of Dabie Mountain through the eastern edge of the Han River Plain, with low flats in the middle, hills in the north and south, and low mountains in the north. The higher SIF values are in Huangling and Jiangxia districts, and the regional values of the Yangtze River flowing through are relatively lower. Shanghai City is part of the alluvial plain of the Yangtze River Delta with flat terrain. However, natural vegetation is quite limited, and the higher SIF values primarily appeared in the southwest woodland and Chongming Island.
Xi’an City is located in the middle of Guanzhong Plain, bordering the Weihe River in the north and Qinling Mountains in the south. Large differences appear in the altitude of the city. The SIF value of the Qinling forest is high, hence, it is an important natural oxygen bar in Xi’an. Meanwhile, Zhengzhou City is across the second- and third-level landform steps in China, and the terrain is relatively complex. The general trend is high in the southwest and low in the northeast, with high SIF in the hilly mountains in the west and south, and low in the plain region in the northeast. Beijing is located on the northwest edge of the North China Plain, backed by the Yanshan Mountains, with the Yongding River flowing through the southwest of the old city, adjacent to Tianjin. The high SIF values in Beijing appeared in the northwestern and northeastern mountains, as well as northern Huairou and Miyun, and showed a decreasing trend from the northeastern mountains to the southwest towards the central city. However, Tianjin City is located in the northern part of the North China Plain, the SIF value is lower overall, and the northern is slightly higher than the southern.

3.2. Seasonal Dynamics

Figure 3, Figure 4, Figure 5 and Figure 6 compared the spatial differences of the multi-year mean SIF in spring, summer, autumn and winter of each central city in China. Generally, differences in geographic location, city topography and vegetation communities among these cities resulted in significant differences in SIF across the four seasons (see Table 2), thereby suggesting that the oxygen supply capacity of urban green spaces also varies significantly throughout the year. The variability was most significant in the northern cities during different seasons. For example, Beijing and Tianjin, with higher latitudes, have the most evident spatial differences in summer, and the vegetation in winter was in the defoliation stage, thereby leading to very low SIF in most areas. Meanwhile, the SIF value in autumn is generally higher than that in spring, with a relatively smaller spatial difference. In Xi’an and Zhengzhou, which lie in the mid-latitude region, SIF was relatively higher in spring than in autumn, and exhibited the lowest value in winter. In Xi’an City, the areas exhibiting higher SIF values in spring and summer were different. The characteristic of ‘high-low-high-low’ appeared from north to south in spring, whereas the SIF exhibited high and low values in the south and north in autumn, respectively. In Zhengzhou City, the distribution of higher SIF values in spring, summer and autumn were also different. Located in the middle and lower reaches of the Yangtze River, Wuhan and Shanghai have the same spatial differences in spring and autumn, with the highest and lowest in summer and winter, respectively. In Chengdu and Chongqing, located in southwest China, the spatial differences of SIF in spring, summer and autumn were evident. Especially in spring, the SIF values were significantly higher than those in the northern cities, but in winter they were also low overall. In Guangzhou City, the distribution area of high SIF values is similar across the four seasons, with the lowest intra-year seasonal dynamic changes.

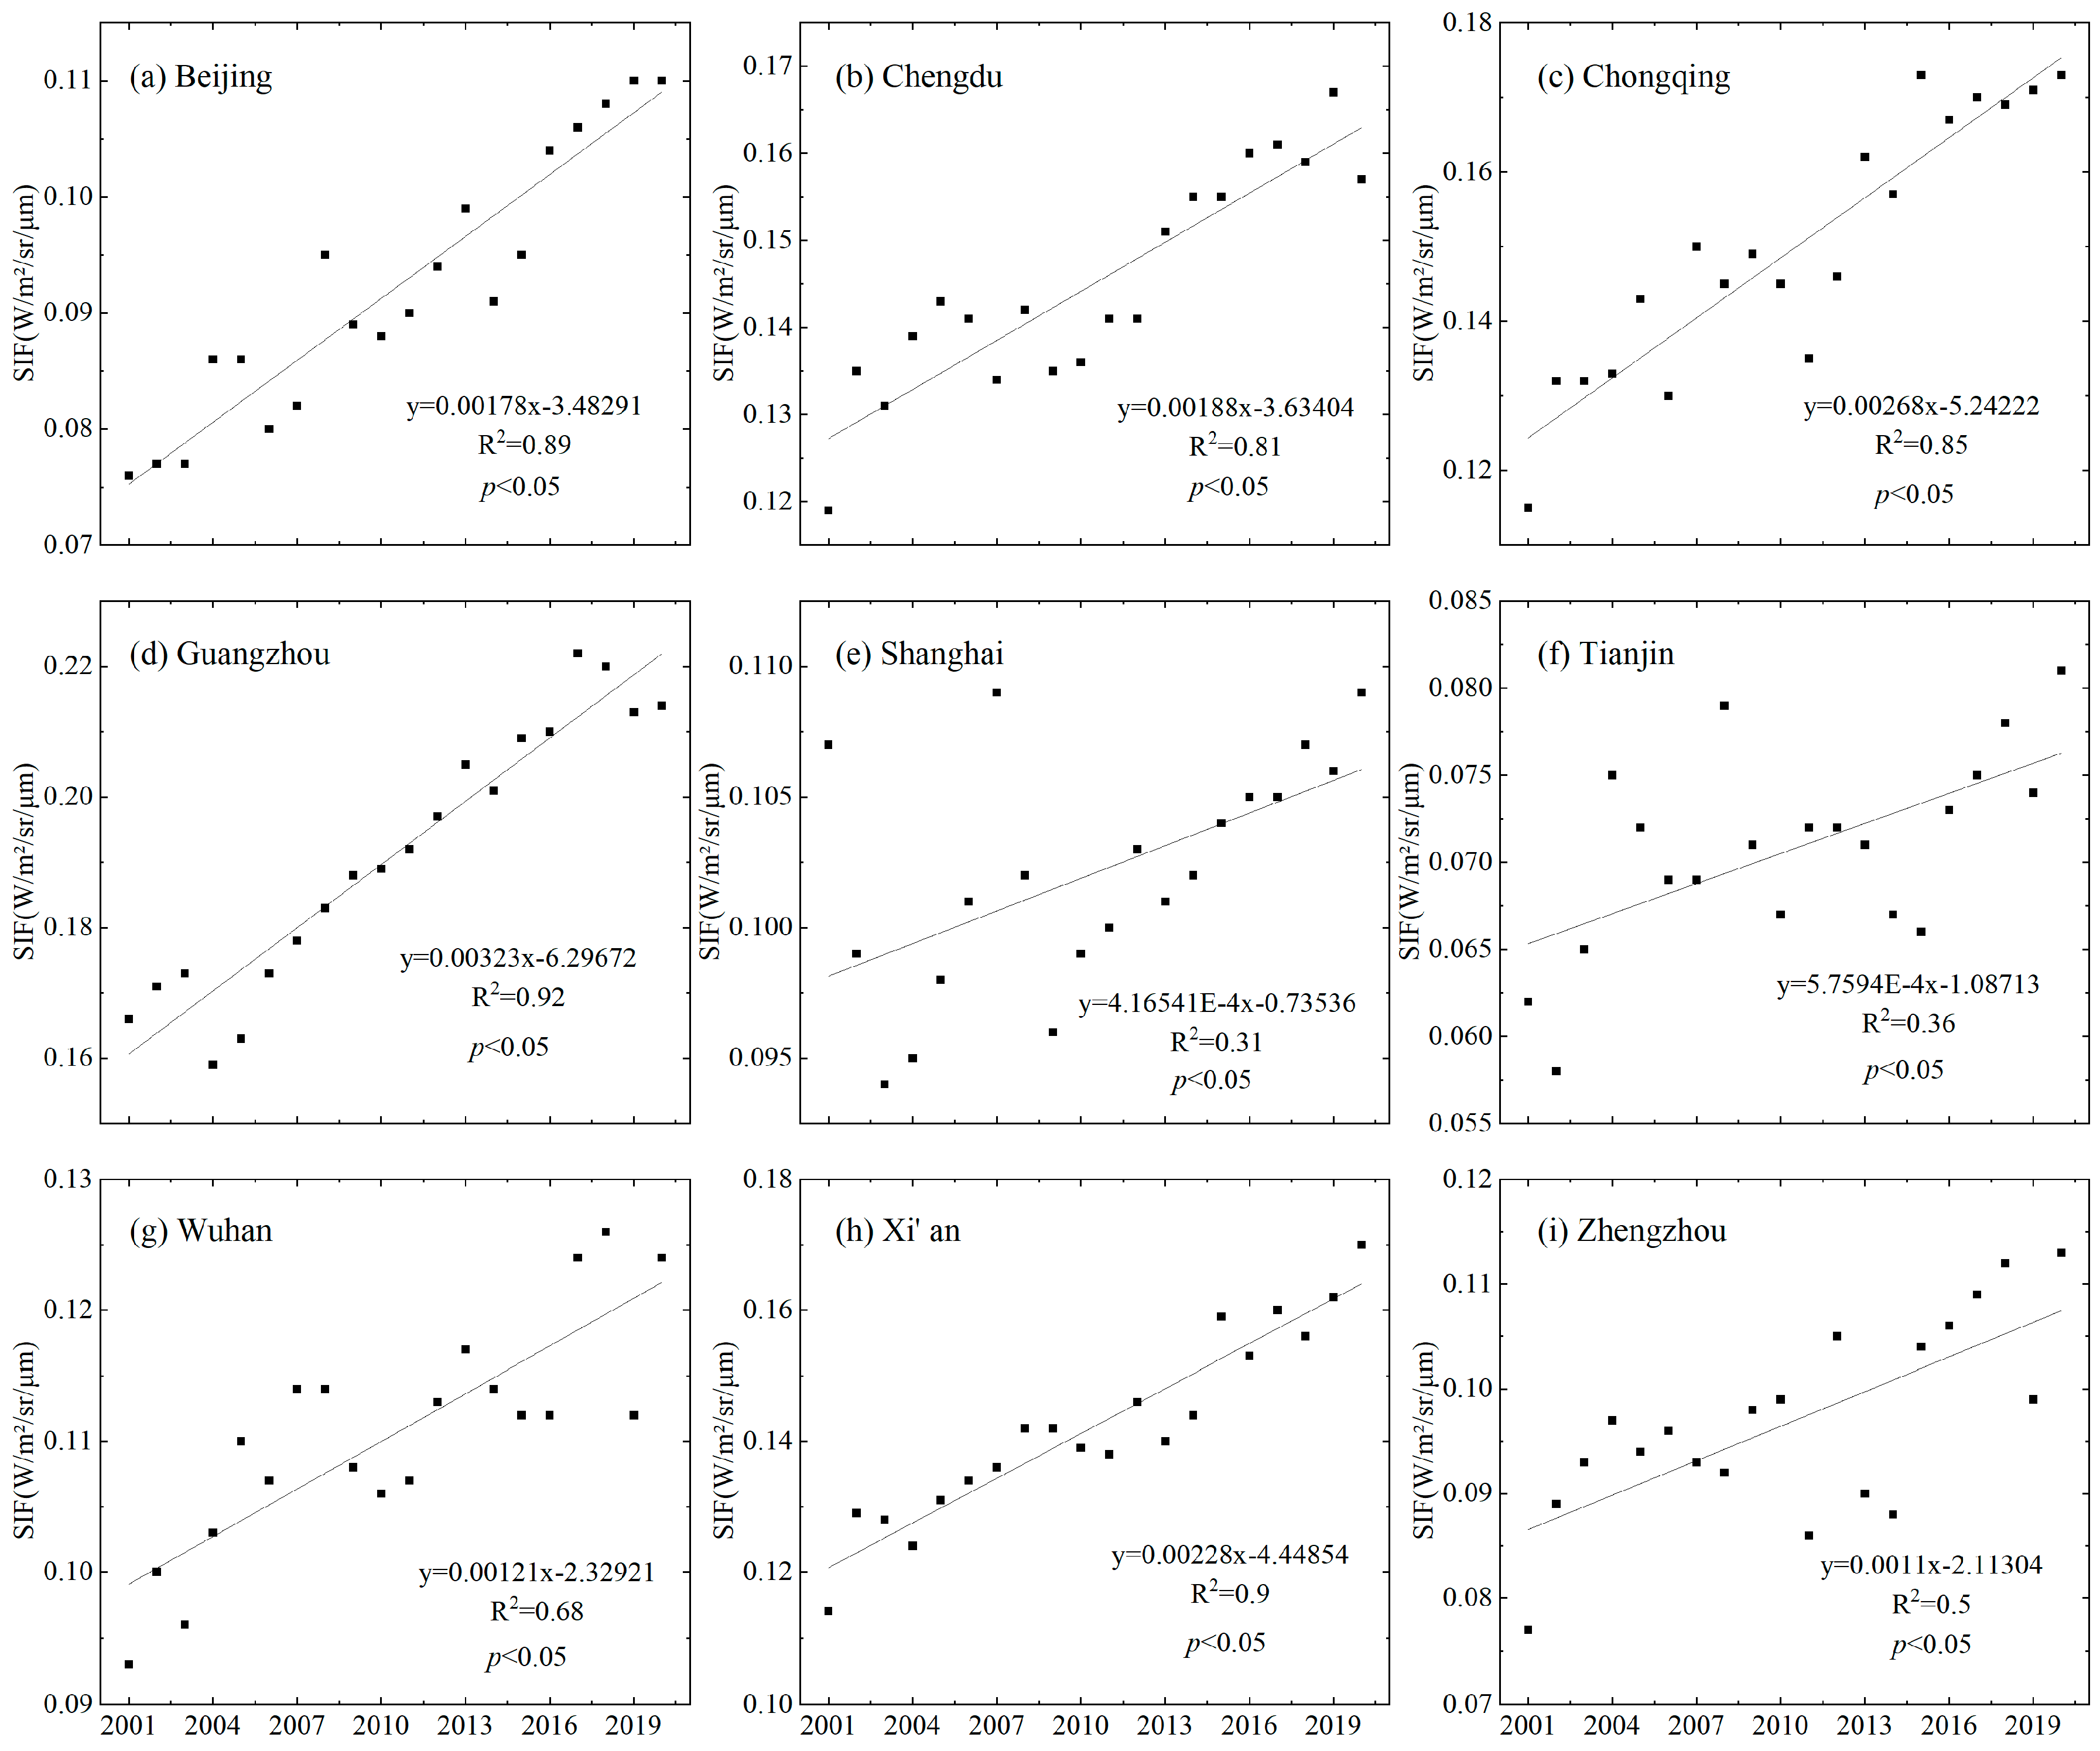
3.3. Long-Term Trend Change

Long-term dynamics of annual mean SIF between 2001 and 2020 are shown in Figure 7, indicating an overall upward trend across cities (p < 0.05). Particularly, Guangzhou, Xi’an, Beijing, Chongqing, and Chengdu have the most significant linear growth trend. From the perspective of the interannual fluctuation range, the annual average SIF in Guangzhou rose the fastest among the nine central cities with 0.0032 W/m2/sr/μm/a. This was followed by Chongqing and Xi’an, their growth rates were approximately 0.0027 W/m2/sr/μm/a and 0.0023 W/m2/sr/μm/a, respectively. The increases in SIF of Beijing and Chengdu were relatively slower at 0.0017 W/m2/sr/μm/a and 0.0018 W/m2/sr/μm/a, respectively. Moreover, the interannual fluctuations were more drastic in cities such as Tianjin, Shanghai, and Zhengzhou. The spatial trends of SIF in each central city from 2001 to 2020 are shown in Figure 8 and Table 3. The SIF values of green space in all central cities, as a proxy for the oxygen supply capacity, showed significant improvements in most areas, with Beijing, Guangzhou and Chongqing cities being the most significant, accounting for approximately 90% of the city area. This is followed by Xi’an, Wuhan, Chengdu, and Zhengzhou, where significant increases accounted for 64.33% to 76.38% of the city area. Tianjin has nearly half, while Shanghai has about 41.39%. Meanwhile, areas of significant degradation were also sporadically distributed in cities such as Shanghai, Zhengzhou, and Chengdu.

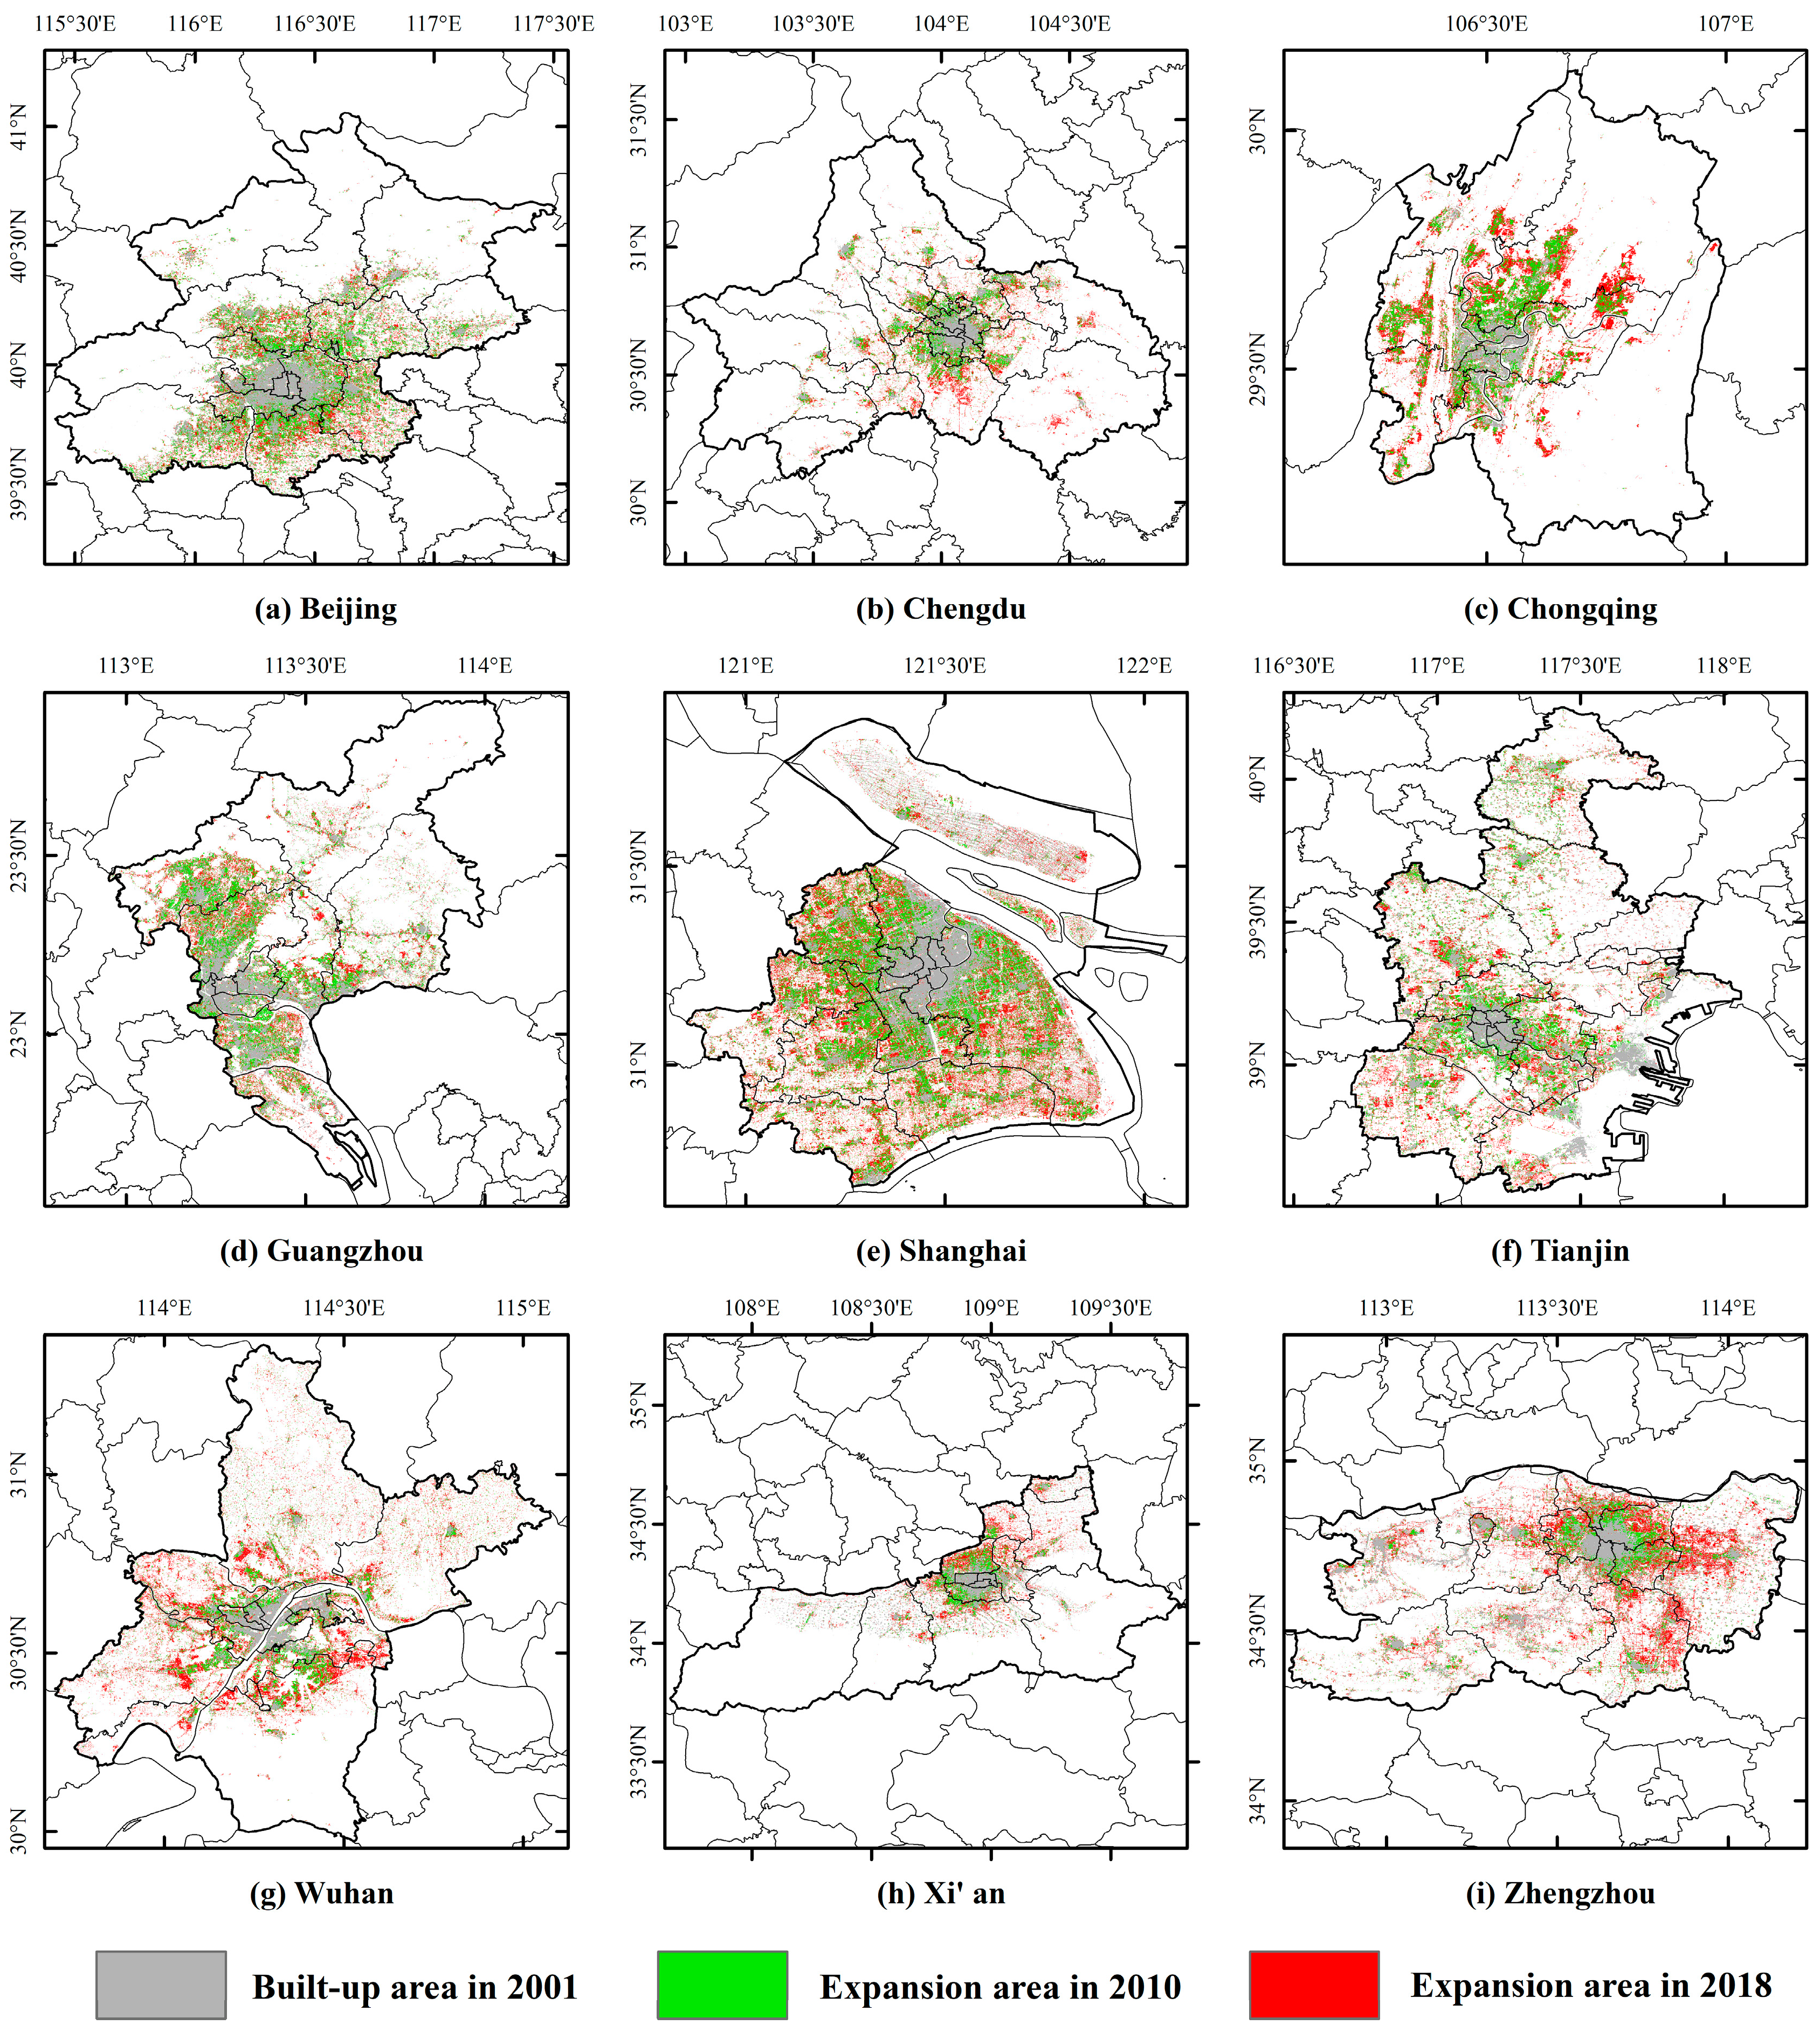
3.4. Impact of Urban Construction Land Expansion

Combined with the expansion map of urban construction land (Figure 9), the significant changes in SIF in each central city are analyzed in Table 4. Areas with more SIF reduction in Shanghai, Xi’an, and Zhengzhou coincided with the expansion of the urban construction land area, which explains the significant reduction of SIF in these cities. Chongqing and Wuhan experienced significant expansions in both periods, including 2001–2010 and 2010–2018. However, there were not many areas where SIF declined, which may be related to the expansion areas being relatively concentrated. During the two periods, although the construction land expansion areas in Beijing and Guangzhou were significant, the SIF values were on the rise, thereby indicating that the expansion of construction land is not the only factor limiting the oxygen supply capacity of the urban green space, and the improvement of vegetation structure in the region also plays a positive role.

4. Discussion and Conclusions

Urban green space has been regarded as one of the important biophysical indicators for assessing urban environmental quality, which acts as the lungs of urban areas by purifying air by reducing CO2 and releasing O2, and providing a healthy life to the city dwellers [30,31]. Hence, the information on the inter-annual vegetation dynamics, and its long-term trend, is crucial for the sustainable development of cities and effective management. With the availability of multi-source satellite-based products, plenty of quantitative studies on urban green space have been conducted in recent years. The satellite-based vegetation indices such as NDVI are considered as one of the most reliable and robust techniques for extracting inherent biophysical and biochemical information about urban green spaces [32,33]. Generally, urban green spaces are comprised of parks, forests, shrubs, gardens, playgrounds, and greenways. However, the traditional remote sensing-based NDVI data remains a greenness-based index, which is obtained from the land surface reflectance data. Therefore, it cannot represent the functions of a complicated vegetation ecosystem. However, SIF can detect the actual vegetation photosynthesis and help to better understand the green infrastructure and its ecological effects.
This study analysed the spatio-temporal dynamics of oxygen supply levels in urban green spaces across nine central cities in China during the past two decades, using satellite-based chlorophyll fluorescence data as the proxy for characterising the oxygen supply capacity of the urban green spaces. Horizontally, the multi-year averages indicate that the SIF in the southern cities was significantly higher than that in the northern cities, which was primarily related to the climatic zones and corresponding vegetation types in each city, with Guangzhou, Chengdu, Chongqing, and Wuhan being the largest, Xi’an, Zhengzhou, and Shanghai being the second, and Beijing and Tianjin being the lowest. Meanwhile, the seasonal dynamics showed that the fluctuations in SIF in the northern cities were more intense over the four seasons, while such fluctuations were relatively small in the southern cities. This is primarily related to the dominant vegetation types in each city, with evergreen vegetation in southern China and deciduous vegetation in northern China. Long-term trend analysis showed that the oxygen supply capacity of green spaces in central cities in China was generally on the rise (p < 0.05), with the most significant growth trend in Guangzhou, Xi’an, Beijing, Chongqing, and Chengdu. Nevertheless, the significantly degraded pixels were primarily scattered inside cities such as Shanghai and Zhengzhou.
However, the urban greenery’s ecosystem supply can only ease the environmental and global ecological problems. The O2-CO2 circle of vegetation is built on photosynthesis during the daytime, however, there is the other side of the material circle, that is the night-time CO2 emission of vegetation. These facts should be taken into account when summarizing the significant environmental benefit of green space. They can be partitioned into the amount of CO2 sequestered via photosynthesis GPP to fully understand biogenic fluxes, and the amount respired by vegetation, called ecosystem respiration (Reco). Given that fluxes to and from vegetation are often not accounted for when studying anthropogenic CO2 emissions in urban areas, Sabrina et al. [34] investigated the urban vegetative fluxes of CO2 over the Greater Toronto and Hamilton areas, Canada. In this study, the SIF data from space has also been used as a valuable proxy for photosynthesis and thus used to estimate GPP. Although the spatial pattern and long-term trend of the oxygen supply capacity of urban green spaces were successfully monitored in central cities of China, the coarse spatial resolution of such GOSIF data will lead to the spatial mismatch when providing a scientific basis for policy-makers.
During the past decades, urban areas of developing countries have experienced unprecedented expansion [31]. However, this growth is not well planned in most of the cities. Even in recent days, no significant change is observed in city planning and there remains a lack of concern regarding environmental issues, particularly the changing green cover in cities. Thus, identifying the green space dynamics of major cities is crucial when considering strategic planning of smart cities, policy intervention, and combating the problems associated with degreening. This analysis, combined with the data on urban construction land expansion during the same period, showed that for cities with more SIF reduction, the expansion of construction land led to a significant reduction of the corresponding SIF. However, the increase in construction land was not the only factor limiting the long-term trend of SIF, and the improvement of vegetation structure and function caused by climatic factors would greatly weaken the disturbance of human activities. Meanwhile, global climate change, particularly extreme climate events such as drought and heat wave, will threaten or even destroy the ecological security of urban green spaces [35,36]. Although this study analyzed the impact of human activities such as built-up land on the urban green spaces, given the difficulty in obtaining scale-matching data, this work does not explore the effect of urban management measures from the urban internal structure, such as the construction of green spaces like parks. Therefore, further attempts will be made to explain the dynamics of oxygen supply capacity of urban green space from multiple dimensions and provide a more scientific basis for the construction of livable cities.

Author Contributions

Conceptualization, formal analysis and writing—original draft preparation, L.Y. and Z.P.; methodology and data curation, W.Z. and Y.S.; writing—review and editing and funding acquisition, H.Z.; writing—review and revision, Q.D. and X.L. All authors have read and agreed to the published version of the manuscript.

Funding

This research was jointly funded by the Chongqing Social Science Planning and Cultivation Project (2020PY40), Fundamental Research Funds for the Central Universities (SWU2209225, SWU020015), Chongqing Science and Technology Bureau, Technology Innovation and Application Development Project (cstc2021jscx-gksb0116), Open Fund of Key Laboratory of Geospatial Technology for the Middle and Lower Yellow River Regions (Henan University), Ministry of Education (Grant No. GTYR202202).

Data Availability Statement

All data are available upon request.

Conflicts of Interest

The authors declare no conflict of interest.

References

  1. Wang, H.; Liu, J.F.; Ma, L.J.; Xie, Z.Y. Evolution law and ecological response of hydrological elements in the middle and upper reaches of Shule River under changing environment. Water Power 2019, 45, 1–5. [Google Scholar]
  2. Wang, R.; Liu, Z.G.; Yang, P.Q. Remote sensing principle and research progress of plant chlorophyll fluorescence induced by sunlight. Adv. Earth Sci. 2012, 27, 1221–1228. [Google Scholar]
  3. Xiao, J.; Chevallier, F.; Gomez, C.; Guanter, L.; Hicke, J.A.; Huete, A.R.; Ichii, K.; Ni, W.; Pang, Y.; Rahman, A.F.; et al. Remote sensing of the terrestrial carbon cycle: A review of advances over 50 years. Remote Sens. Environ. 2019, 233, 111383. [Google Scholar] [CrossRef]
  4. Zhang, Z.Y.; Wang, S.H.; Qiu, B.; Song, L.; Zhang, Y.G. Remote sensing retrieval of chlorophyll fluorescence induced by sunlight and application progress of carbon cycle. J. Remote Sens. 2019, 23, 37–52. [Google Scholar]
  5. Mohammed, G.H.; Colombo, R.; Middleton, E.M.; Rascher, U.; van der Tol, C.; Nedbal, L.; Goulas, Y.; Pérez-Priego, O.; Damm, A.; Meroni, M.; et al. Remote sensing of solar-induced chlorophyll fluorescence (SIF) in vegetation: 50 years of progress. Remote Sens. Environ. 2019, 231, 111177. [Google Scholar] [CrossRef]
  6. Tang, X.; Xiao, J.; Ma, M.; Yang, H.; Li, X.; Ding, Z.; Yu, P.; Zhang, Y.; Wu, C.; Huang, J.; et al. Satellite evidence for China’s leading role in restoring vegetation productivity over global karst ecosystems. For. Ecol. Manag. 2022, 507, 120000. [Google Scholar] [CrossRef]
  7. Krause, G.H.; Weis, E. Chlorophyll Fluorescence and Photosynthesis: The Basics. Annu. Rev. Plant Physiol. Plant Mol. Biol. 1991, 42, 313–349. [Google Scholar] [CrossRef]
  8. Zhan, C.H.; Zhang, Z.Y.; Zhang, Y.G. Research Progress on Radiative Transfer Model of Chlorophyll Fluorescence Induced by Sunlight. J. Remote Sens. 2020, 24, 945–957. [Google Scholar]
  9. Gitelson, A.A.; Buschmann, C.; Lichtenthaler, H.K. Leaf chlorophyll fluorescence corrected for re-absorption by means of absorption and reflectance measurements. J. Plant Physiol. 1998, 152, 283–296. [Google Scholar] [CrossRef]
  10. Van Wittenberghe, S.; Alonso, L.; Verrelst, J.; Hermans, I.; Delegido, J.; Veroustraete, F.; Valcke, R.; Moreno, J.; Samson, R. Upward and downward solar-induced chlorophyll fluorescence yield indices of four tree species as indicators of traffic pollution in Valencia. Environ. Pollut. 2013, 173, 29–37. [Google Scholar] [CrossRef]
  11. Lichtenthaler, H.K.; Buschmann, C.; Rinderle, U.; Schmuck, G. Application of chlorophyll fluorescence in ecophysiology. Radiat. Environ. Biophys. 1986, 25, 297–308. [Google Scholar] [CrossRef]
  12. Genty, B.; Briantais, J.-M.; Baker, N.R. The relationship between the quantum yield of photosynthetic electron transport and quenching of chlorophyll fluorescence. Biochim. Biophys. Acta BBA-Gen. Subj. 1989, 990, 89–92. [Google Scholar] [CrossRef]
  13. Mennis, J. Socioeconomic-Vegetation Relationships in Urban, Residential Land. Photogramm. Eng. Remote Sens. 2006, 72, 911–921. [Google Scholar] [CrossRef]
  14. Yao, R.; Wang, L.; Huang, X.; Gong, W.; Xia, X. Greening in Rural Areas Increases the Surface Urban Heat Island Intensity. Geophys. Res. Lett. 2019, 46, 2204–2212. [Google Scholar] [CrossRef]
  15. Jain, S.; Sannigrahi, S.; Sen, S.; Bhatt, S.; Chakraborti, S.; Rahmat, S. Urban heat island intensity and its mitigation strategies in the fast-growing urban area. J. Urban Manag. 2020, 9, 54–66. [Google Scholar] [CrossRef]
  16. Treuhaft, R.N.; Law, B.E.; Asner, G.P. Forest Attributes from Radar Interferometric Structure and Its Fusion with Optical Remote Sensing. Bioscience 2004, 54, 561. [Google Scholar] [CrossRef]
  17. Chen, Y.; Gu, H.; Wang, M.; Gu, Q.; Ding, Z.; Ma, M.; Liu, R.; Tang, X. Contrasting Performance of the Remotely-Derived GPP Products over Different Climate Zones across China. Remote Sens. 2019, 11, 1855. [Google Scholar] [CrossRef]
  18. Cui, T.; Sun, R.; Qiao, C.; Zhang, Q.; Yu, T.; Liu, G.; Liu, Z. Estimating Diurnal Courses of Gross Primary Production for Maize: A Comparison of Sun-Induced Chlorophyll Fluorescence, Light-Use Efficiency and Process-Based Models. Remote Sens. 2017, 9, 1267. [Google Scholar] [CrossRef]
  19. Sun, Y.; Frankenberg, C.; Wood, J.D.; Schimel, D.S.; Jung, M.; Guanter, L.; Drewry, D.T.; Verma, M.; Porcar-Castell, A.; Griffis, T.J.; et al. OCO-2 advances photosynthesis observation from space via solar-induced chlorophyll fluorescence. Science 2017, 358, eaam5747. [Google Scholar] [CrossRef]
  20. Wang, Y.N.; Wei, J.; Tang, X.G.; Hang, X.J.; Ma, M.G. Research progress in estimating total primary productivity of vegetation by chlorophyll fluorescence. Remote Sens. Technol. Appl. 2020, 35, 975–989. [Google Scholar]
  21. Liu, M.X.; Yang, C.X.; Fan, Z.X. Review and Prospect of the Relationship between Urban Space Microclimate and Crowd Behavior. Landsc. Archit. 2022, 29, 121–127. [Google Scholar]
  22. Zhao, H.; Liu, X.J. Promote the high-quality development of national central cities with the concept of sustainable cities. Reg. Econ. Rev. 2020, 5, 76–84. [Google Scholar]
  23. Li, X.; Xiao, J. A Global, 0.05-Degree Product of Solar-Induced Chlorophyll Fluorescence Derived from OCO-2, MODIS, and Reanalysis Data. Remote Sens. 2019, 11, 517. [Google Scholar] [CrossRef]
  24. Gong, P.; Li, X.; Wang, J.; Bai, Y.; Chen, B.; Hu, T.; Liu, X.; Xu, B.; Yang, J.; Zhang, W.; et al. Annual maps of global artificial impervious area (GAIA) between 1985 and 2018. Remote Sens. Environ. 2020, 236, 111510. [Google Scholar] [CrossRef]
  25. Angel, S.; Parent, J.; Civco, D.L.; Blei, A.; Potere, D. The dimensions of global urban expansion: Estimates and projections for all countries, 2000–2050. Prog. Plan. 2011, 75, 53–107. [Google Scholar] [CrossRef]
  26. Bounoua, L.; Nigro, J.; Zhang, P.; Thome, K.; Lachir, A. Mapping urbanization in the United States from 2001 to 2011. Appl. Geogr. 2018, 90, 123–133. [Google Scholar] [CrossRef]
  27. Solecki, W.; Seto, K.C.; Marcotullio, P.J. It’s Time for an Urbanization Science. Environ. Sci. Policy Sustain. Dev. 2013, 55, 12–17. [Google Scholar] [CrossRef]
  28. Zhu, Z.; Zhou, Y.; Seto, K.C.; Stokes, E.C.; Deng, C.; Pickett, S.T.; Taubenböck, H. Understanding an urbanizing planet: Strategic directions for remote sensing. Remote Sens. Environ. 2019, 228, 164–182. [Google Scholar] [CrossRef]
  29. Hamed, K.H. Trend detection in hydrologic data: The Mann–Kendall trend test under the scaling hypothesis. J. Hydrol. 2008, 349, 350–363. [Google Scholar] [CrossRef]
  30. Mwendwa, P.; Giliba, R.A. Benefits and challenges of urban green spaces. Chin. J. Popul. Resour. Environ. 2012, 10, 73–79. [Google Scholar] [CrossRef]
  31. Liu, F.; Zhang, Z.; Shi, L.; Zhao, X.; Xu, J.; Yi, L.; Liu, B.; Wen, Q.; Hu, S.; Wang, X.; et al. Urban expansion in China and its spatial-temporal differences over the past four decades. J. Geogr. Sci. 2016, 26, 1477–1496. [Google Scholar] [CrossRef]
  32. Li, W.; Saphores, J.-D.M.; Gillespie, T.W. A comparison of the economic benefits of urban green spaces estimated with NDVI and with high-resolution land cover data. Landsc. Urban Plan. 2015, 133, 105–117. [Google Scholar] [CrossRef]
  33. Dutta, D.; Rahman, A.; Paul, S.K.; Kundu, A. Spatial and temporal trends of urban green spaces: An assessment using hyper-temporal NDVI datasets. Geocarto Int. 2021, 10, 1–21. [Google Scholar] [CrossRef]
  34. Madsen, S.; Wunch, D.; Arain, M.A.; Frankenberg, C.; Koehler, P.; Rogers, C.; Staebler, R.; Vogel, F.; Wu, D. Investigation of urban vegetative fluxes of carbon dioxide over the Greater Toronto and Hamilton area. AGU Fall Meet. 2021, B25H-1580. [Google Scholar]
  35. Allen, M.A.; Roberts, D.A.; McFadden, J.P. Reduced urban green cover and daytime cooling capacity during the 2012–2016 California drought. Urban Clim. 2021, 36, 100768. [Google Scholar] [CrossRef]
  36. Kabisch, N.; Kraemer, R.; Brenck, M.E.; Haase, D.; Lausch, A.; Luttkus, M.L.; Mueller, T.; Remmler, P.; von Döhren, P.; Voigtländer, J.; et al. A methodological framework for the assessment of regulating and recreational ecosystem services in urban parks under heat and drought conditions. Ecosyst. People 2021, 17, 464–475. [Google Scholar] [CrossRef]
Figure 1. Distribution of the national central cities in China. Given the large area of Chongqing City, only the nine main urban districts are selected as integral to make the study comparable.
Land 12 00426 g001
Figure 2. Spatial patterns of multi-year mean SIF of the central cities.
Land 12 00426 g002
Figure 3. Patterns of multi-year averaged SIF in spring across the nine central cities in China.
Land 12 00426 g003
Figure 4. Patterns of multi-year averaged SIF in summer across the nine central cities in China.
Land 12 00426 g004
Figure 5. Patterns of multi-year averaged SIF in autumn across the nine central cities in China.
Land 12 00426 g005
Figure 6. Patterns of multi-year averaged SIF in winter across the nine central cities in China.
Land 12 00426 g006
Figure 7. Long-term dynamics of SIF in the nine central cities of China from 2001 to 2020.
Land 12 00426 g007
Figure 8. Spatial trend of SIF in the nine central cities of China from 2001 to 2020.
Land 12 00426 g008
Figure 9. Expansion of the urban built-up area in the nine central cities of China from 2001 to 2018.
Land 12 00426 g009
Table 1. Demographic and economic indicators of the national central cities (2020).
GDP
(108 Yuan)
Resident Population at
Year-End (104 People)
Urban Population
(104 People)
Beijing36,102.621891916.6
Chengdu17,716.71519.71015.61
Chongqing25,002.793208.932229.08
Guangzhou25,019.111874.031615.23
Shanghai38,700.582488.362222
Tianjin14,083.731386.61174.7
Wuhan15,616.061244.77929.84
Xi’an10,020.3912961026.43
Zhengzhou12,0031260.06988
Table 2. Multi-year seasonal average value of SIF in each central city of China.
BeijingChengduChongqingGuangzhouShanghaiTianjinWuhanXi’anZhengzhou
Spring0.0210.1390.1320.1710.0930.0220.0870.1380.107
Summer0.2760.3360.3090.290.2130.2140.2720.330.24
Autumn0.0470.1050.1450.2040.1100.0480.0810.0730.052
Winter00.0230.0220.0880.01100.0080.0040.004
Table 3. Statistics of the spatial trend of the nine central cities of China from 2001 to 2020.
CityTrendPercentCityTrendPercent
Significantly increased91.87% Significantly increased50.00%
BeijingBasically unchanged7.84%TianjinBasically unchanged46.58%
Significantly reduced0.29% Significantly reduced3.42%
Significantly increased64.43% Significantly increased69.23%
ChengduBasically unchanged29.05%WuhanBasically unchanged25.75%
Significantly reduced6.52% Significantly reduced5.02%
Significantly increased89.76% Significantly increased76.38%
ChongqingBasically unchanged6.34%Xi’anBasically unchanged19.10%
Significantly reduced3.90% Significantly reduced4.52%
Significantly increased90.40% Significantly increased64.33%
GuangzhouBasically unchanged8.80%ZhengzhouBasically unchanged23.00%
Significantly reduced0.80% Significantly reduced12.67%
Significantly increased41.39%
ShanghaiBasically unchanged40.98%
Significantly reduced17.62%
Table 4. Growth rate of the urban built-up areas in the nine central cities of China from 2001 to 2018.
TitleArea Increased in
2001–2010 (km2)
Area Growth Rate
2001–2010
Area Increased in
2010–2018 (km2)
Area Growth Rate
2010–2018
Beijing1386.736266.04%1185.061533.99%
Chengdu504.8177.94%648.646256.28%
Chongqing303.7914141.79%416.411180.38%
Guangzhou567.796563.93%508.879834.95%
Shanghai1114.457479.24%1232.073948.88%
Tianjin917.335857.50%1180.189846.97%
Wuhan378.549971.77%749.13382.69%
Xi’an281.389536.92%467.301644.78%
Zhengzhou377.095536.19%910.903564.18%
Disclaimer/Publisher’s Note: The statements, opinions and data contained in all publications are solely those of the individual author(s) and contributor(s) and not of MDPI and/or the editor(s). MDPI and/or the editor(s) disclaim responsibility for any injury to people or property resulting from any ideas, methods, instructions or products referred to in the content.

