


Quantifying and Comparing the Cooling Effects of Three Different Morphologies of Urban Parks in Chengdu
Abstract
:1. Introduction
- Propose a park form classification method to delineate the major parks in Chengdu;
- Evaluate the cooling effect of different morphological types of parks;
- Analyze the relationship between the park cooling effect and morphological characteristics to determine the optimal cooling park form;
- Propose urban park planning and design optimization strategies to provide theoretical guidance basis for the construction and promotion of park cities.
2. Materials and Methods
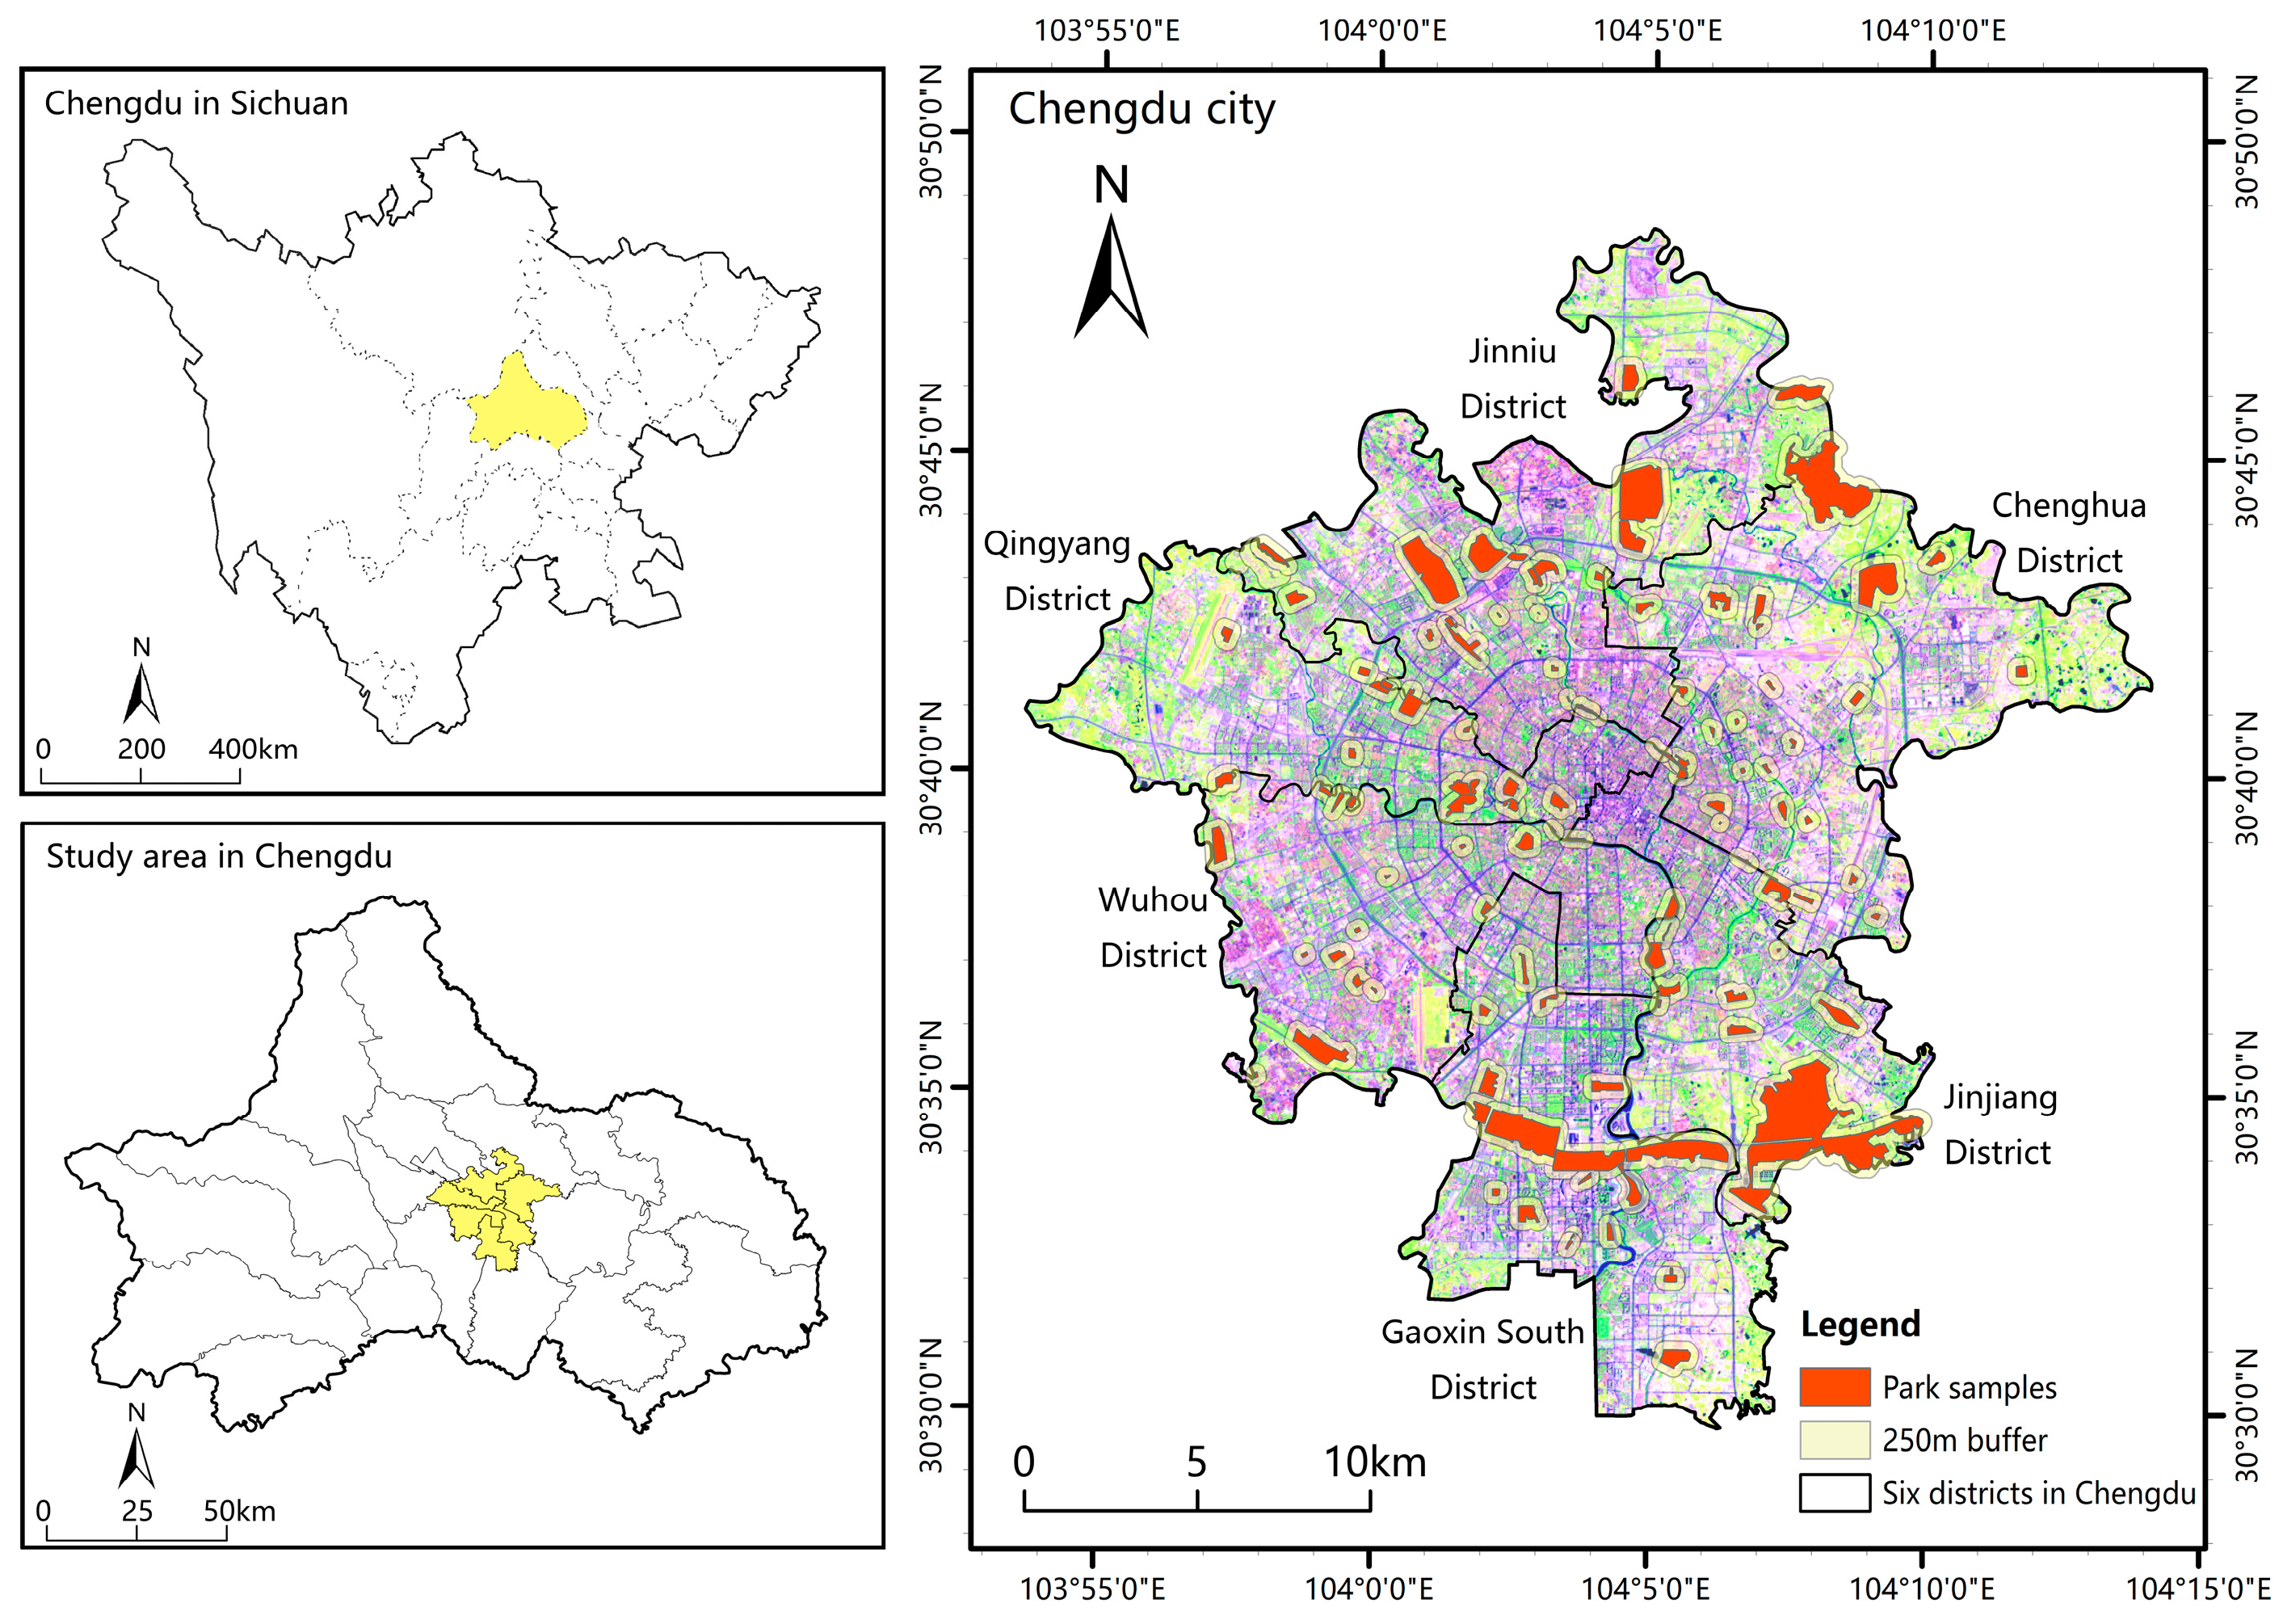
2.1. Study Area and Objective
2.2. Park Extraction and Classification
2.3. Surface Temperature Inversion
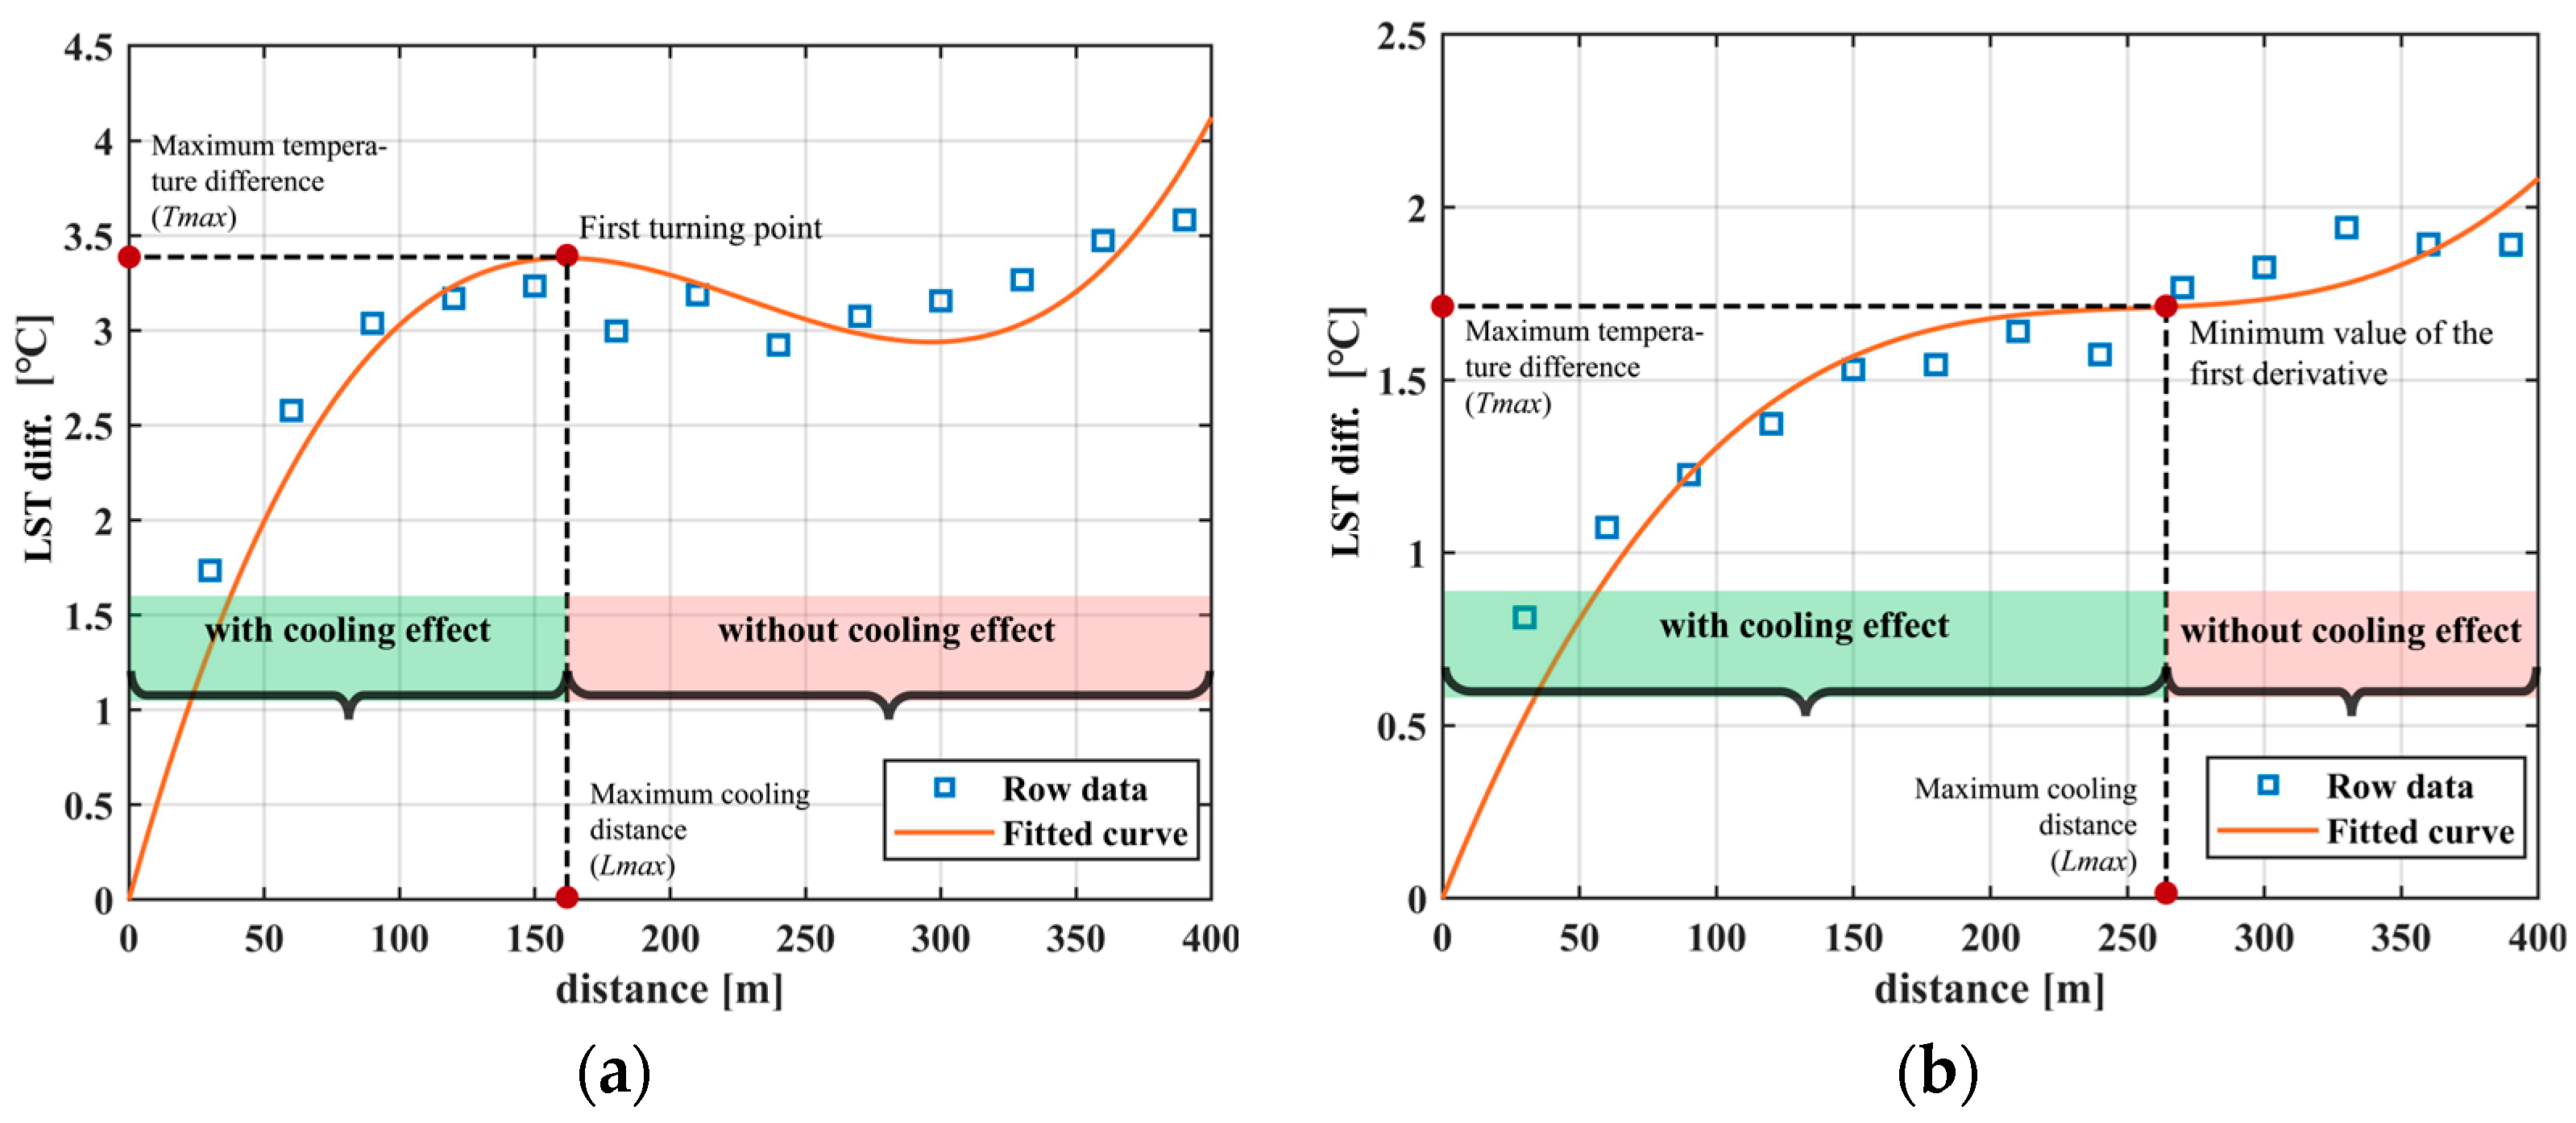
2.4. Park Cooling Effect Assessment
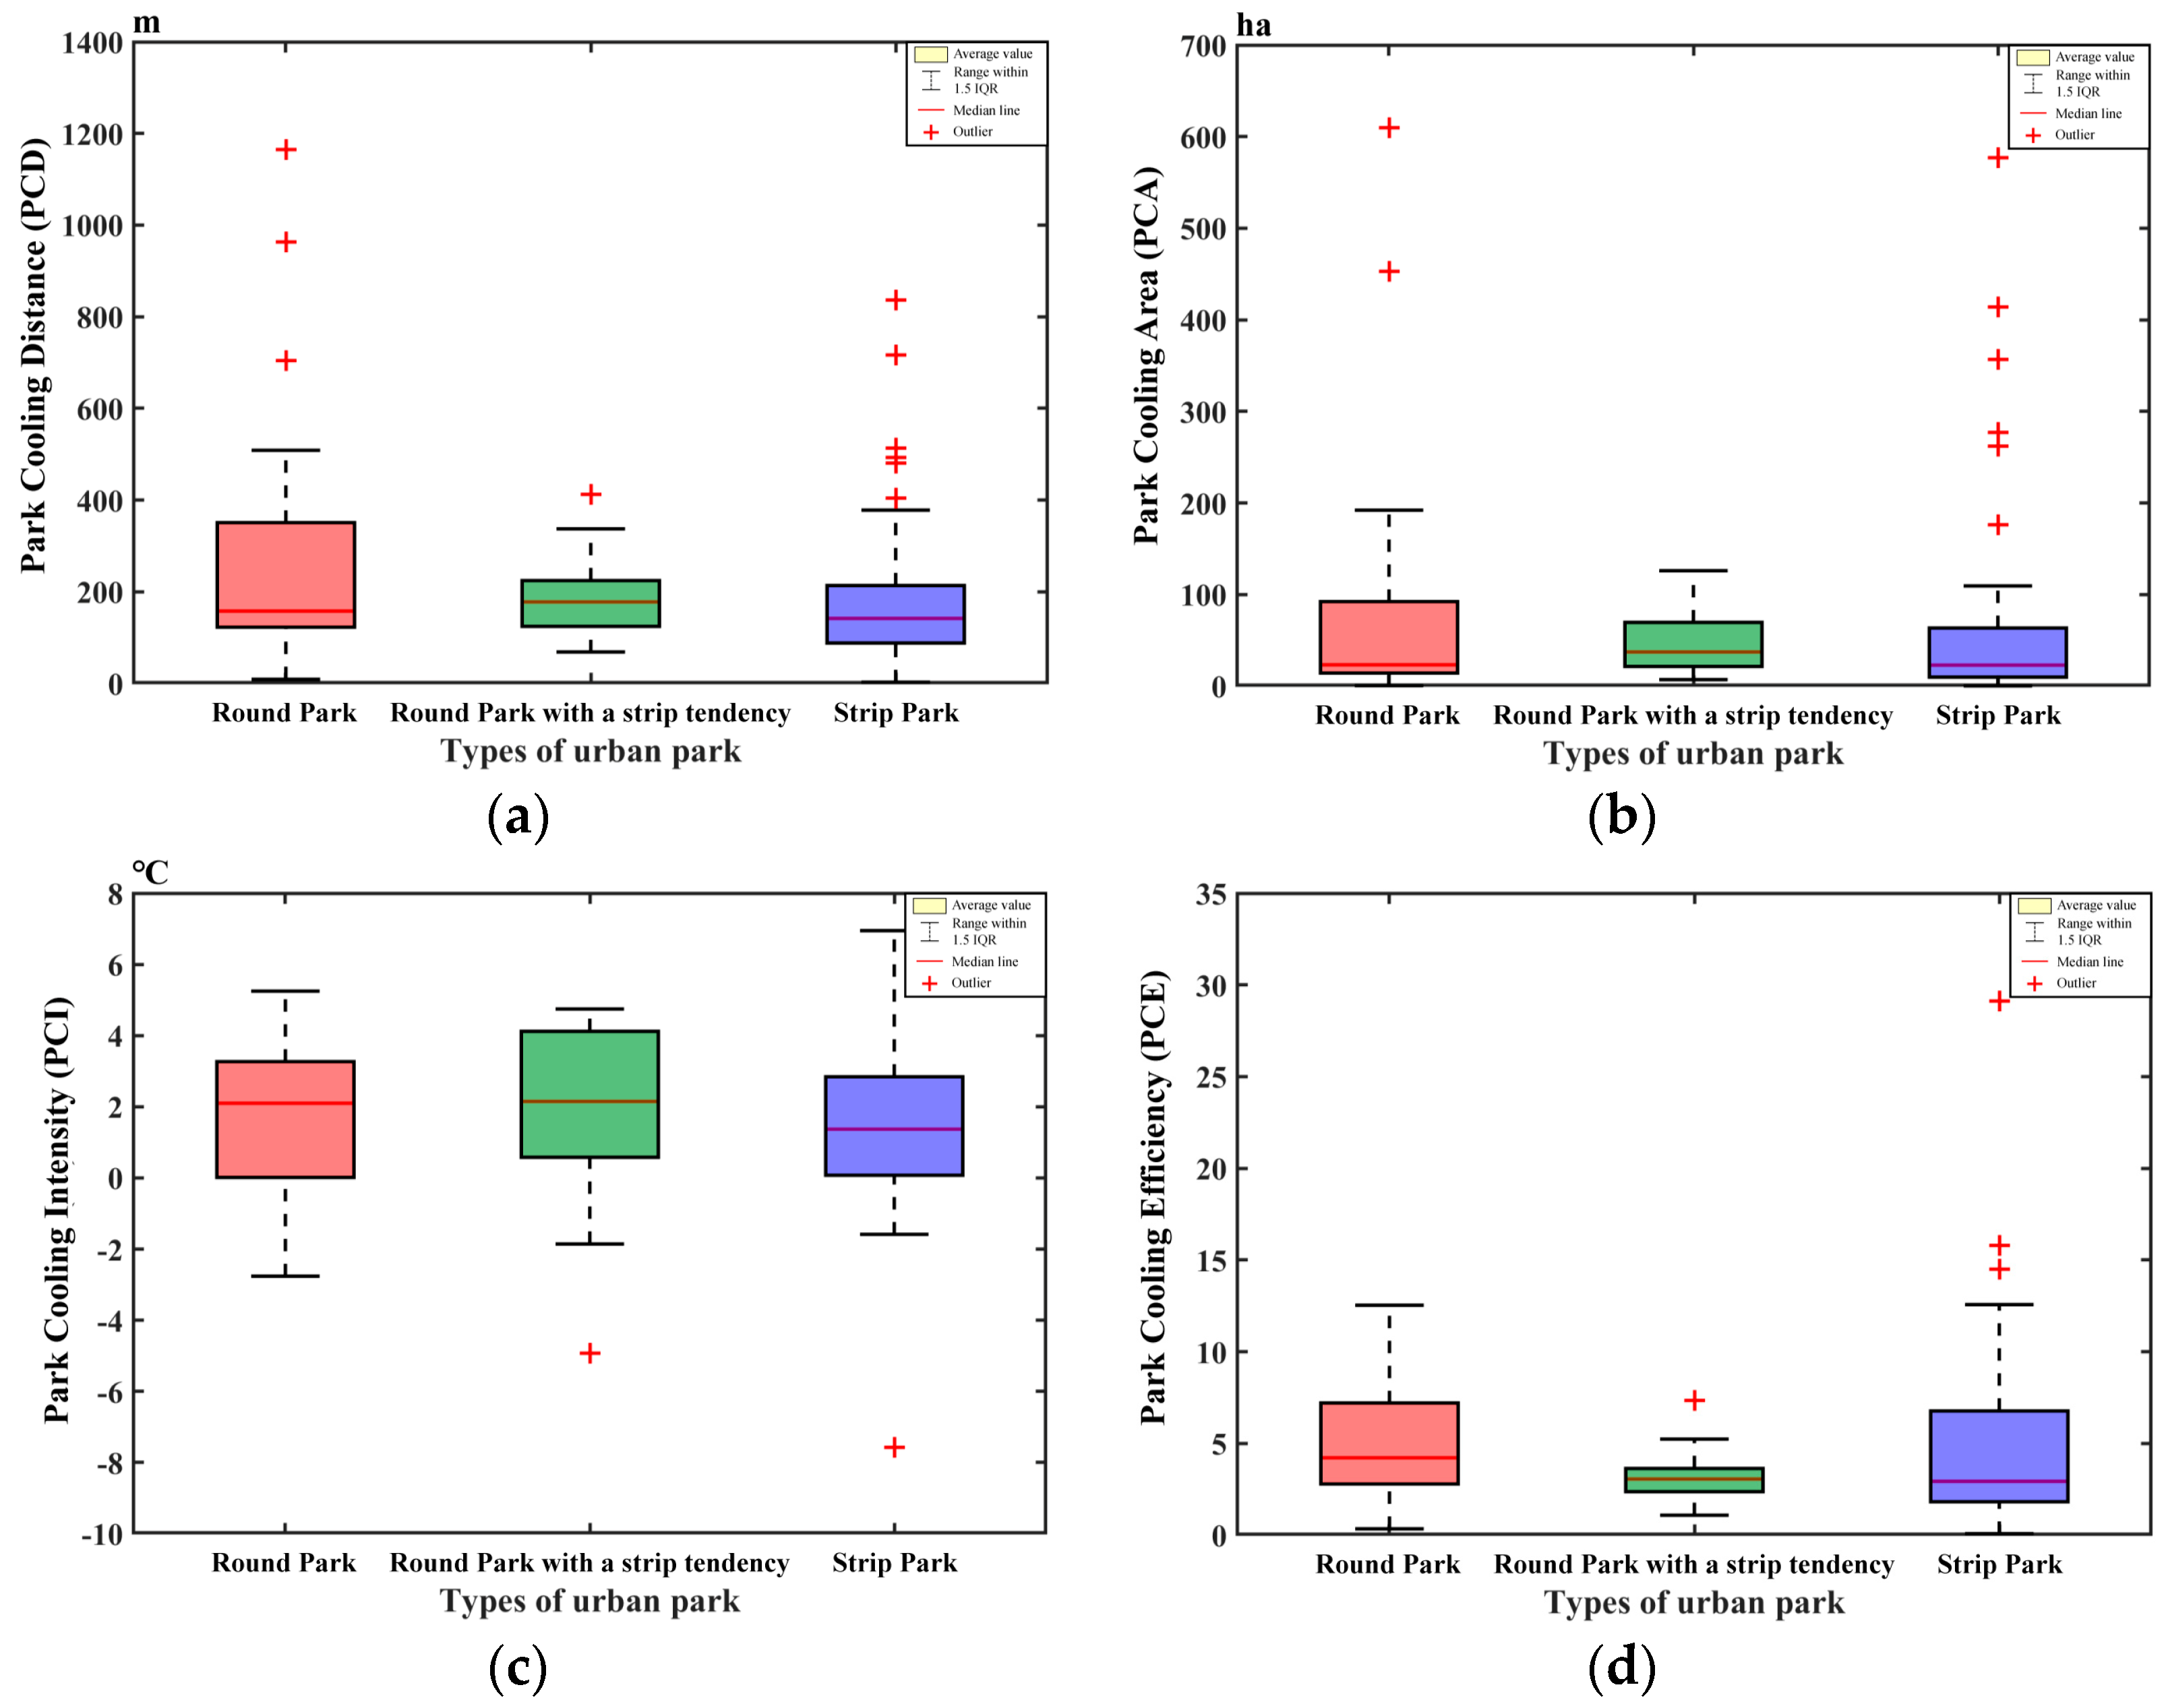
- Park cooling distance (PCD), which is defined as the furthest distance from the edge of an urban park that can be affected by the park cooling effect (Lmax), is an index used to measure the magnitude of the park cooling effect in the horizontal direction. It has been demonstrated that the root means square of the Lmax error derived from the fitted equation is basically between 1.0 and 4.5 m [65].
- Park cooling area (PCA), which is defined as the area of the largest peripheral buffer zone (Smax) affected by the cooling effect of the park [52]. The spatial distribution of the park cooling effect is closely related to the size and external morphology of the park itself. A single park cooling distance (PCD) cannot capture the variation in spatial characteristics and requires the use of the park cooling area (PCA) for additional description.
- Park cooling intensity (PCI), which is defined as the maximum difference between the LST(Te) in the maximum cooling range outside the park and the average LST(Tpark) inside the park. The larger the PCI, the greater the cooling magnitude of the exterior area of the urban park and the greater the cooling effect of the park on the peripheral area, regardless of the size and shape of the park. It has been demonstrated that the root mean square error of the PCI derived from the fitted equations remains essentially in the range of 0.1–0.37 K [65].
- Park cooling efficiency (PCE), which is defined as the ratio of the maximum cooling area of an urban park (Smax) to the park area (Spark) [52]. This index reflects the external cooling area per unit area of the park. As can be seen in Equation (7), PCE is a typical mathematical expression of efficiency in the form of the ratio of the number of effective outputs (“product”) to the number of total inputs (“cost”) (R = P/C). Here, the area of park construction is considered as input (“cost”), and the effective cooling area is considered as effective output (“product”), which can realize the measurement of economic efficiency of urban park construction in terms of the thermal environment.
3. Results
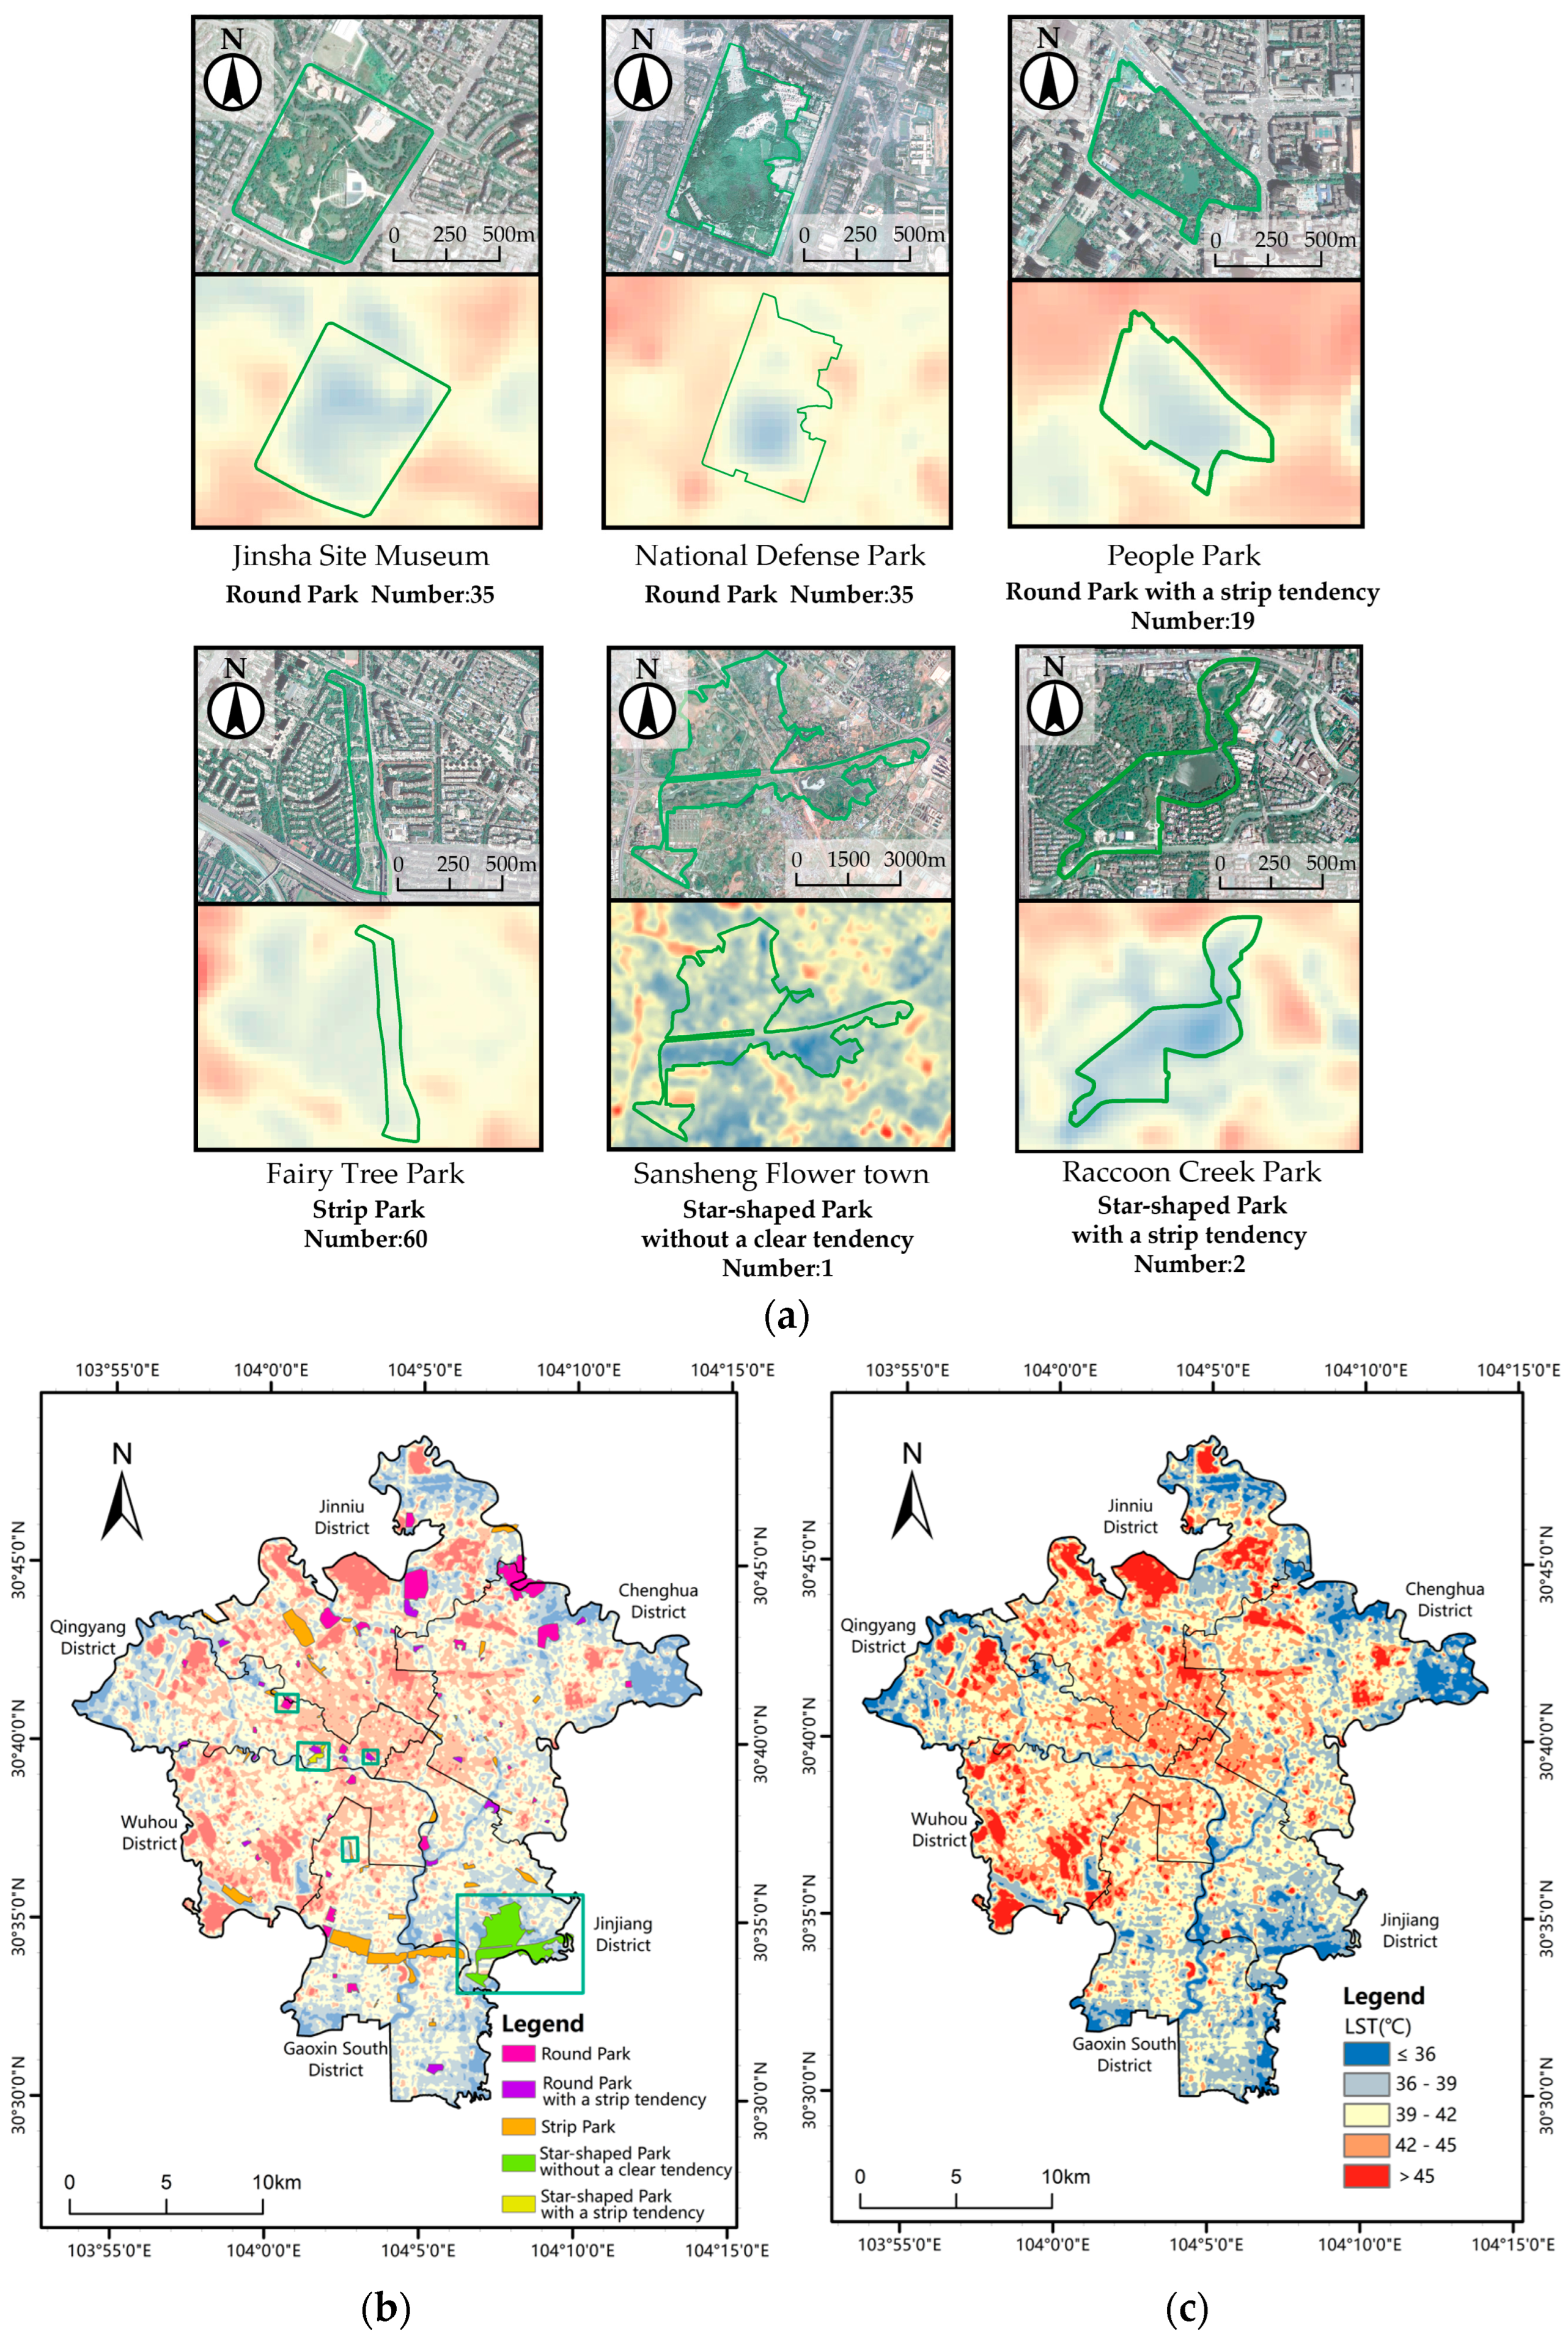
3.1. Classification of Park Planar Morphology
3.2. Comparison of Park Cooling Indexes
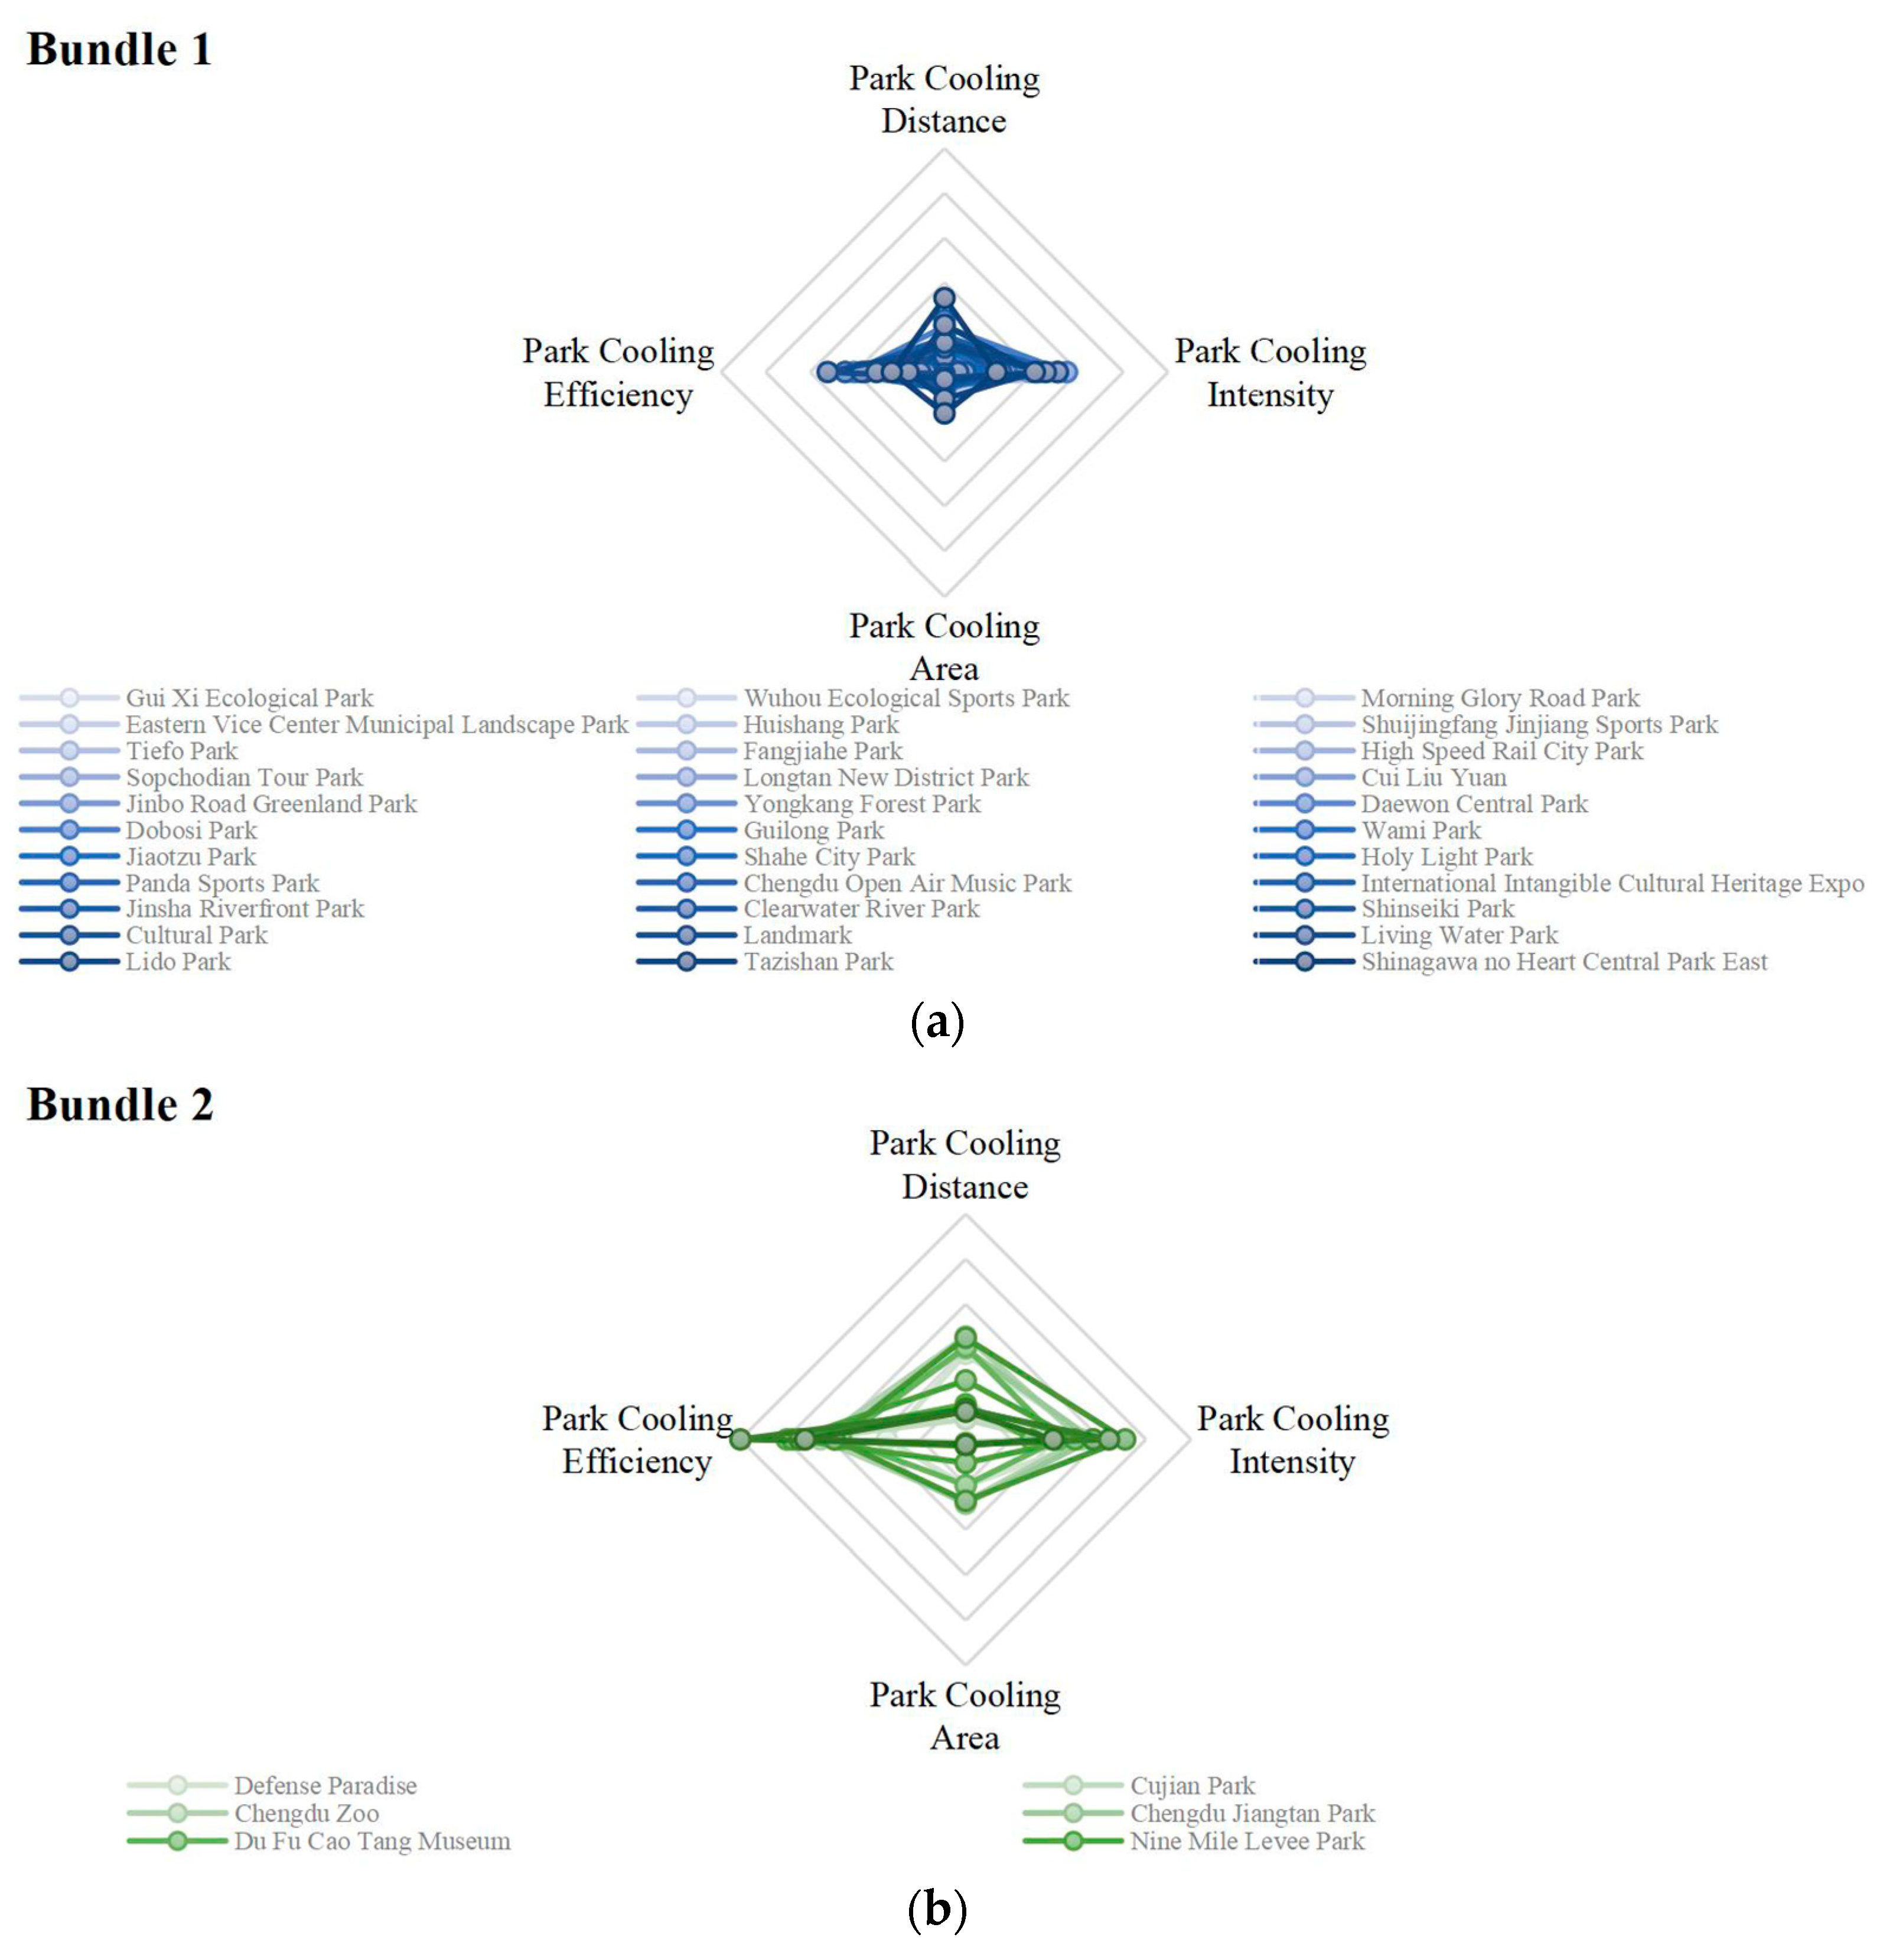
3.3. Cooling Effect of Various Morphologies of Urban Parks
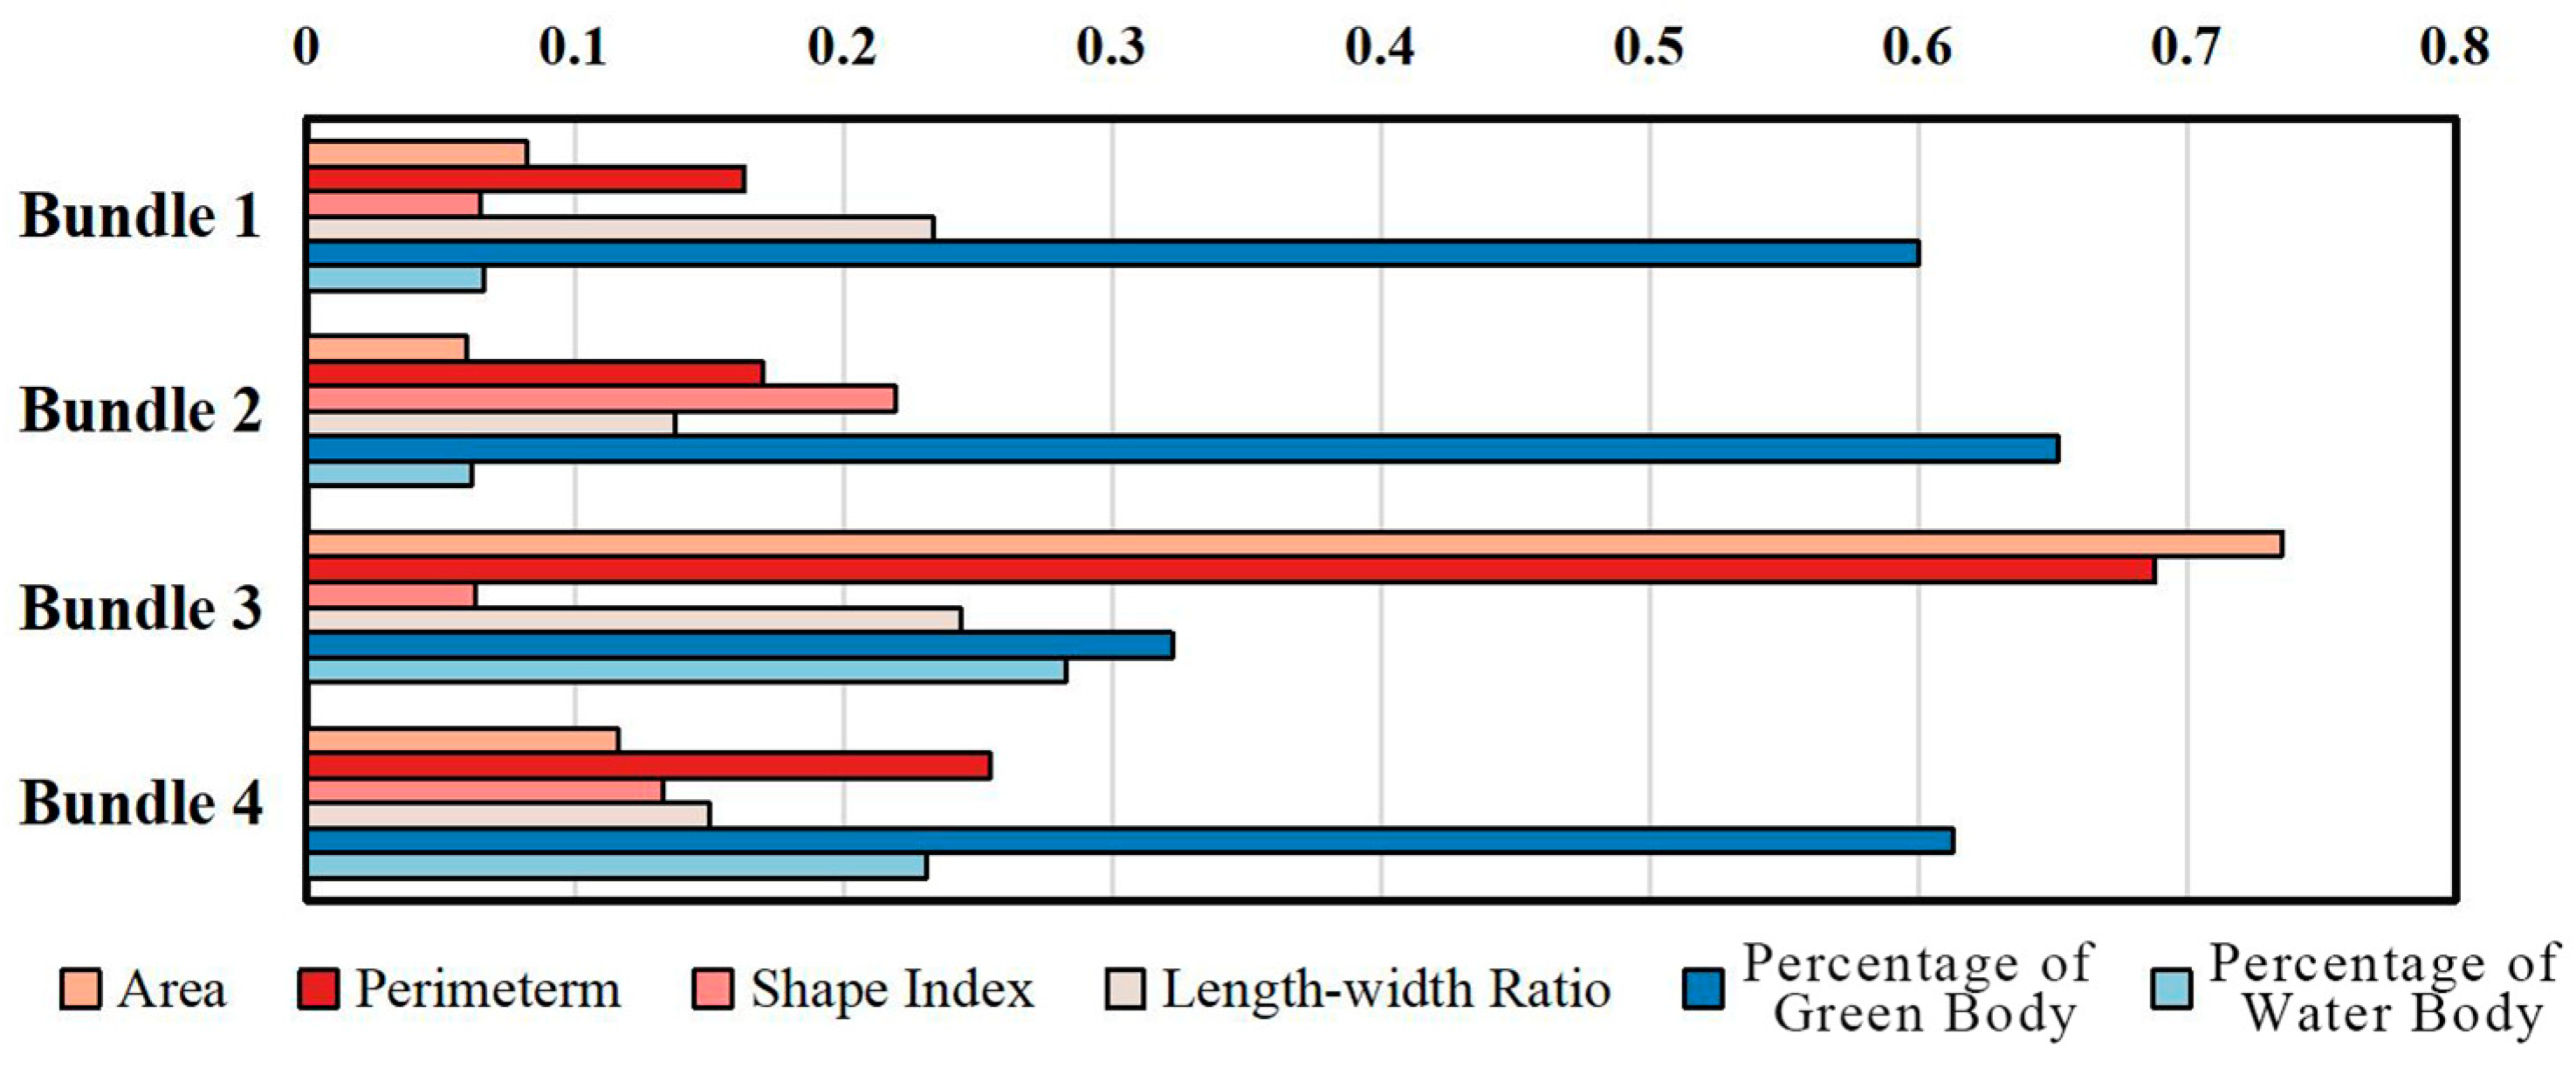
- Bundle 1 (Figure 6a): All four cooling indicators were low. Their PCD, PCA, PCE, and PCI were less than 82.9%, 52.4%, 93.7%, and 73.2% of the maximum value, respectively. This type of urban park had the weakest cooling effect. Most of them were narrow strip parks.
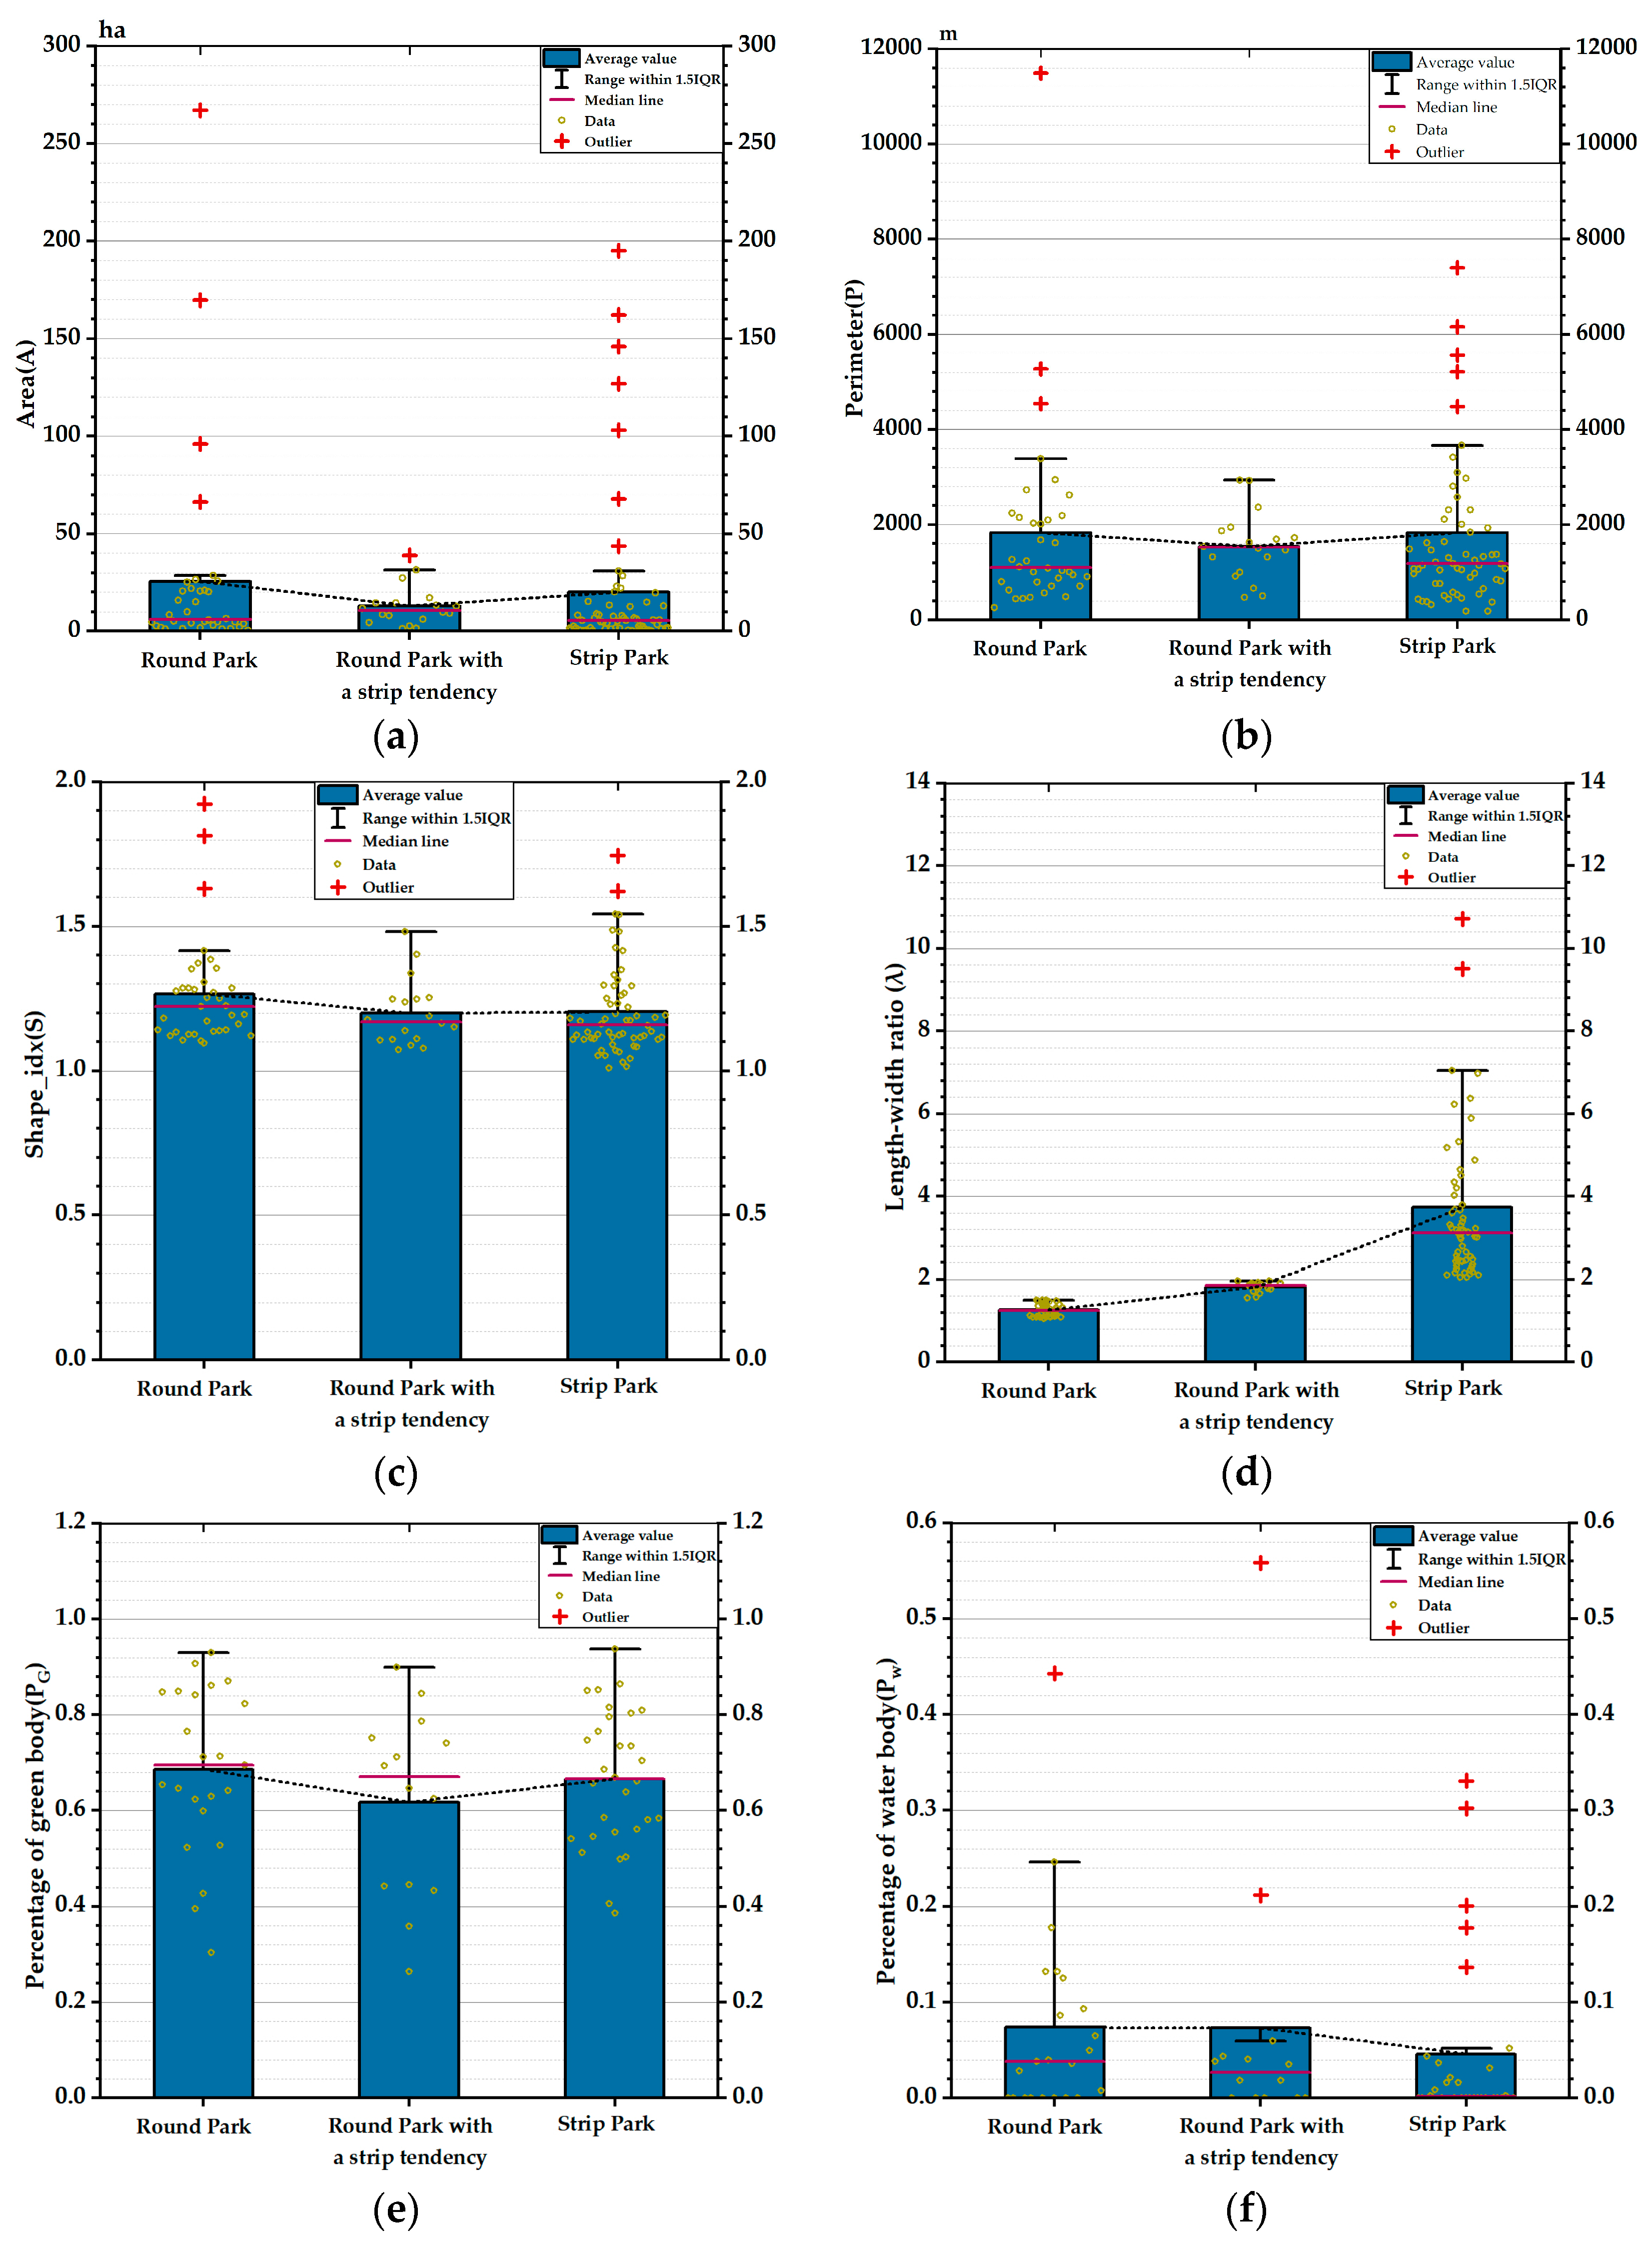
- Bundle 2 (Figure 6b): Most of these urban parks focusing on cooling efficiency were round parks with an average PCE of 0.7. Compared with the PCE of Bundle 3 and Bundle 4, the average cooling efficiency of this type was 53.9% and 64.2% higher, respectively. Its average shape index was the largest at 0.2, which was 71.5% higher than the smallest value. While the average park area to water body area ratio was the smallest. The PCE characterizes the effectiveness or economy of the park cooling process, and the larger the PCE, the greater the economic efficiency of the urban park. Therefore, considering the input and output of urban park construction, the round park had certain economic benefits in terms of the cooling effect.
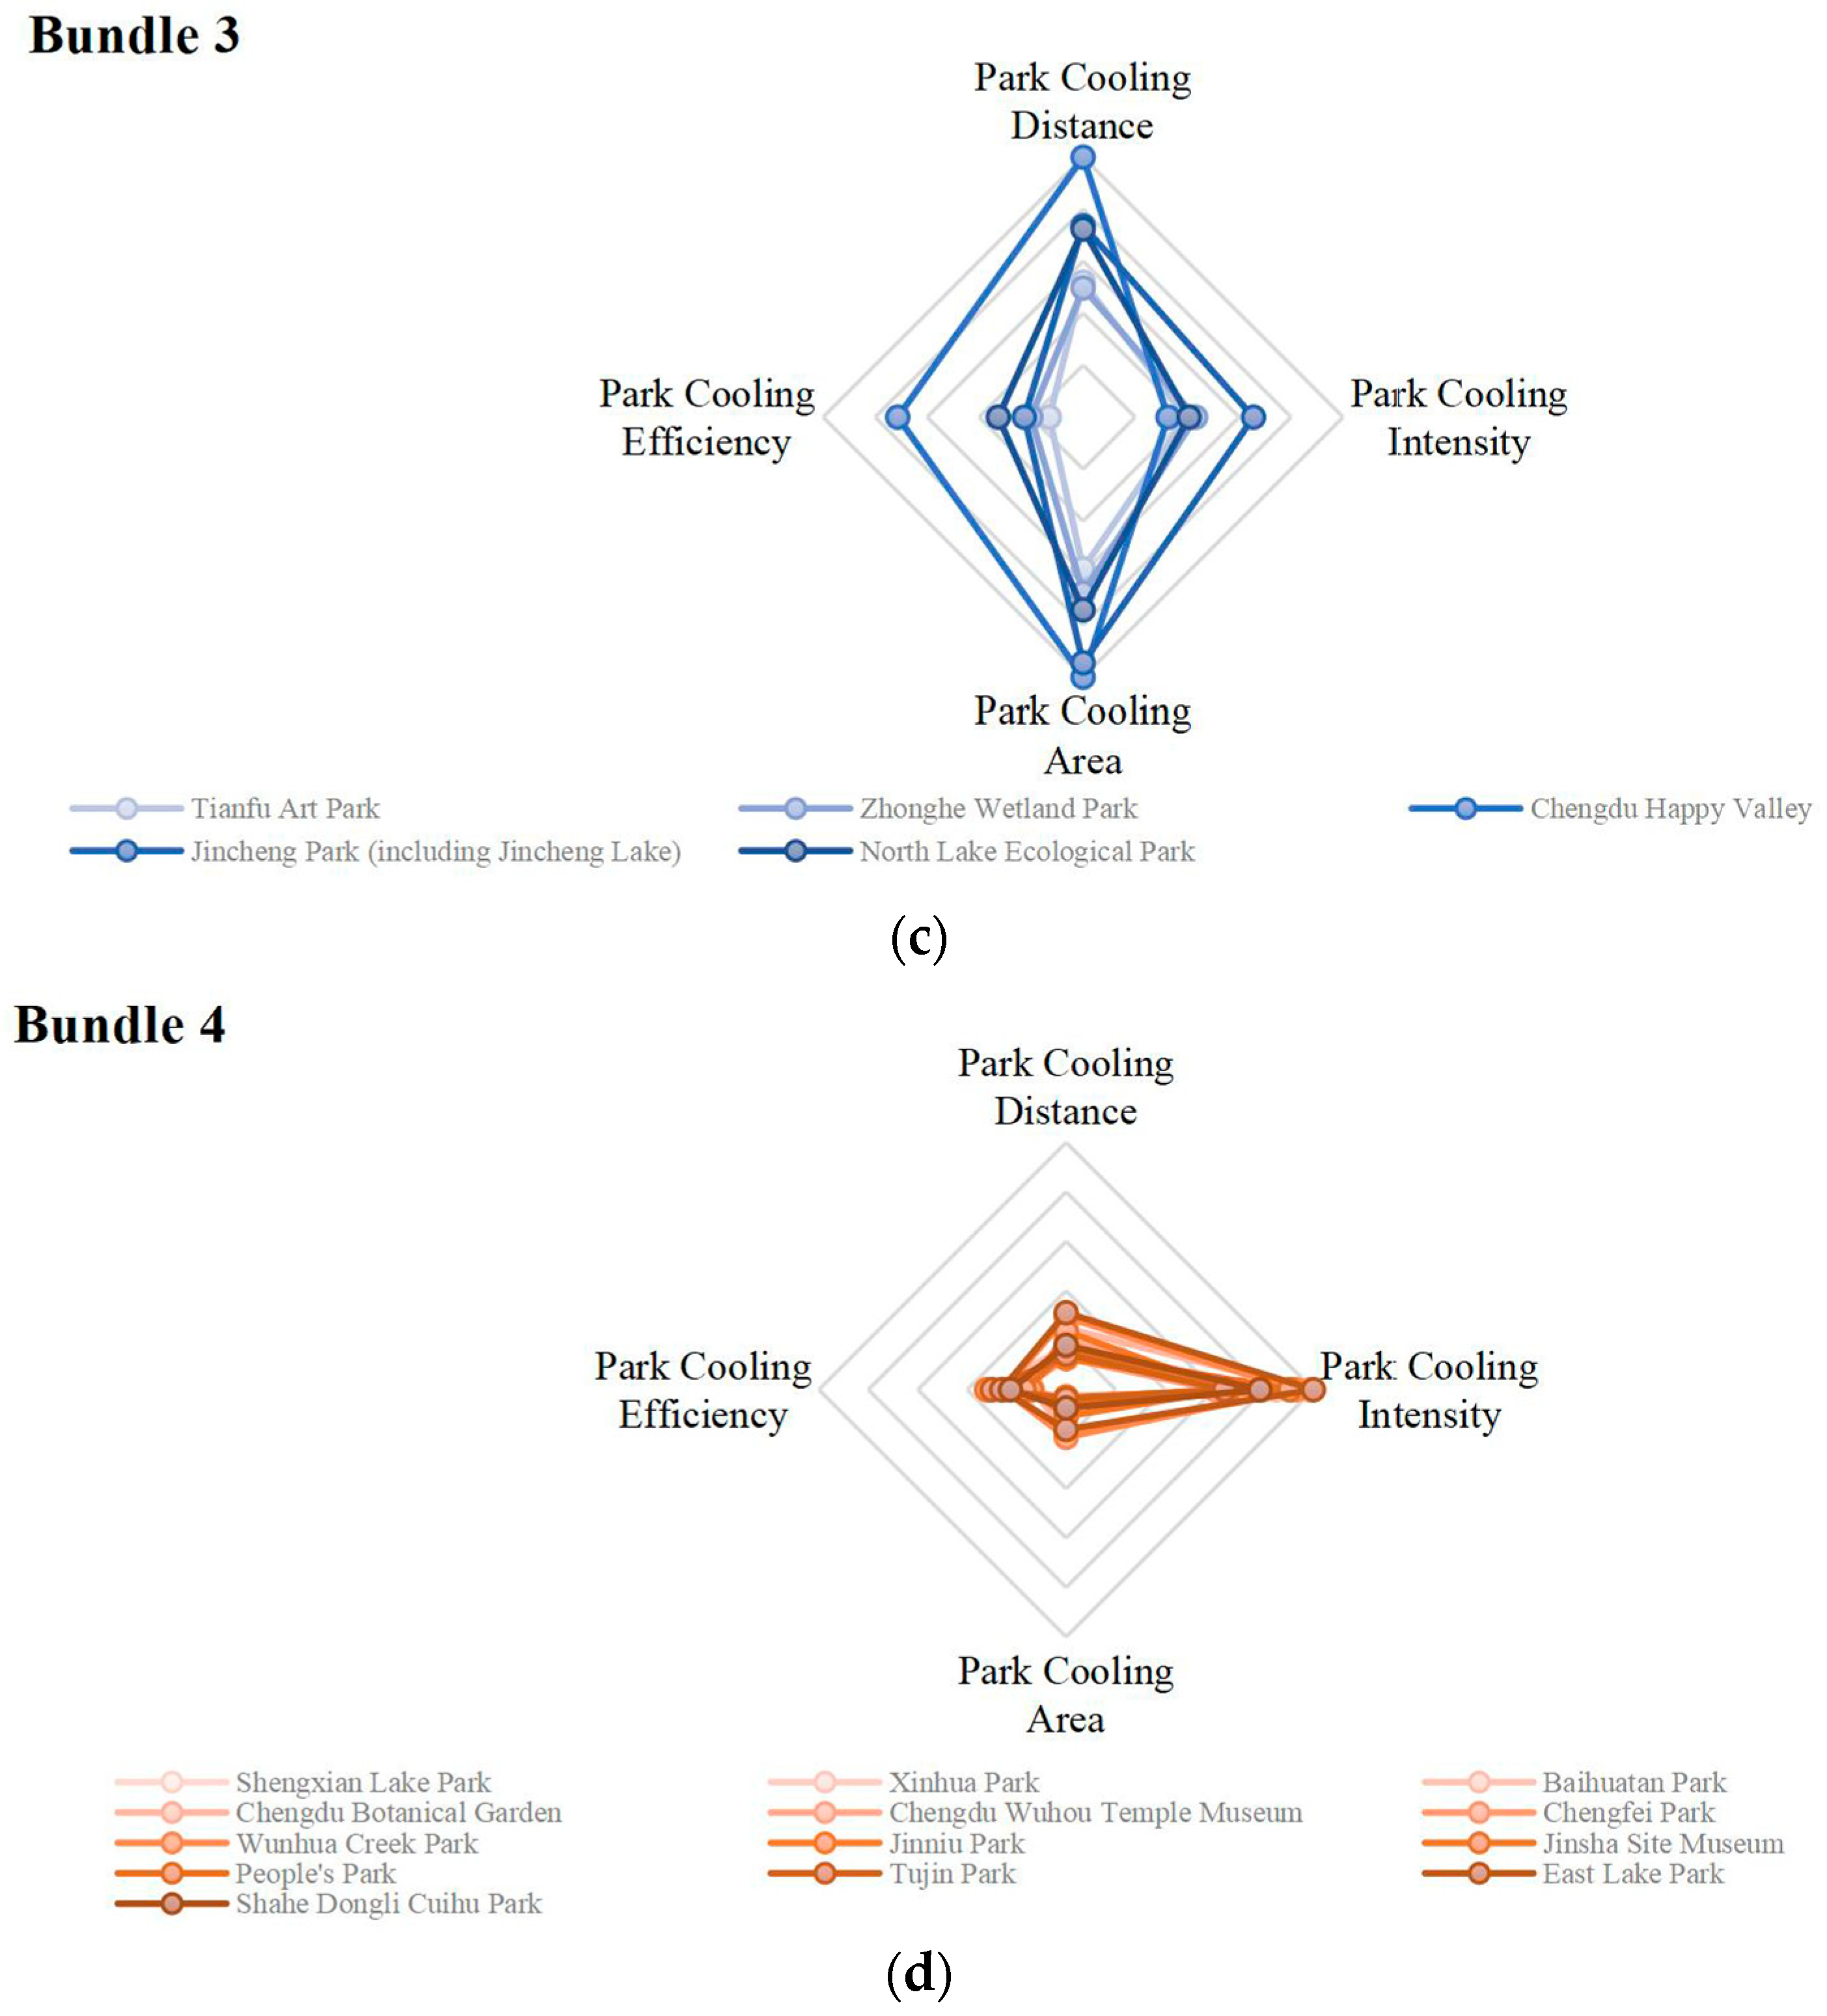
- Bundle 3 (Figure 6c): These parks were dominated by cooling area and cooling distance. The cooling effect of this type on the surrounding environment was stronger, with a PCA and PCD generally higher than 84.6% and 70.5%. It is mainly a large area strip park, the average area and perimeter of which are 0.7 and 0.7, respectively, which were higher than 88.4% and 71.6% of the urban parks in Bundle 2. Park area and perimeter are important factors influencing PCA and PCD, but they are also limited by other conditions. For example, the largest PCA and PCD in Bundle 3 was Chengdu Happy Valley, and its PCE was also higher, yet the park area and perimeter were much smaller than Jincheng Park (the largest area).
- Bundle 4 (Figure 6d): The cooling effect of such parks is mainly based on the cooling intensity. PCI was significantly higher at 0.8, while PCA, PCE, and PCG were lower. Their PCI average was 0.3 higher than the PCI of Bundle 2 and Bundle 3. This type of park was mainly the round park with a strip tendency and the round park, with a higher vegetation area and lower average perimeter and area.
3.4. Influencing Factors of Urban Park Cooling Effects
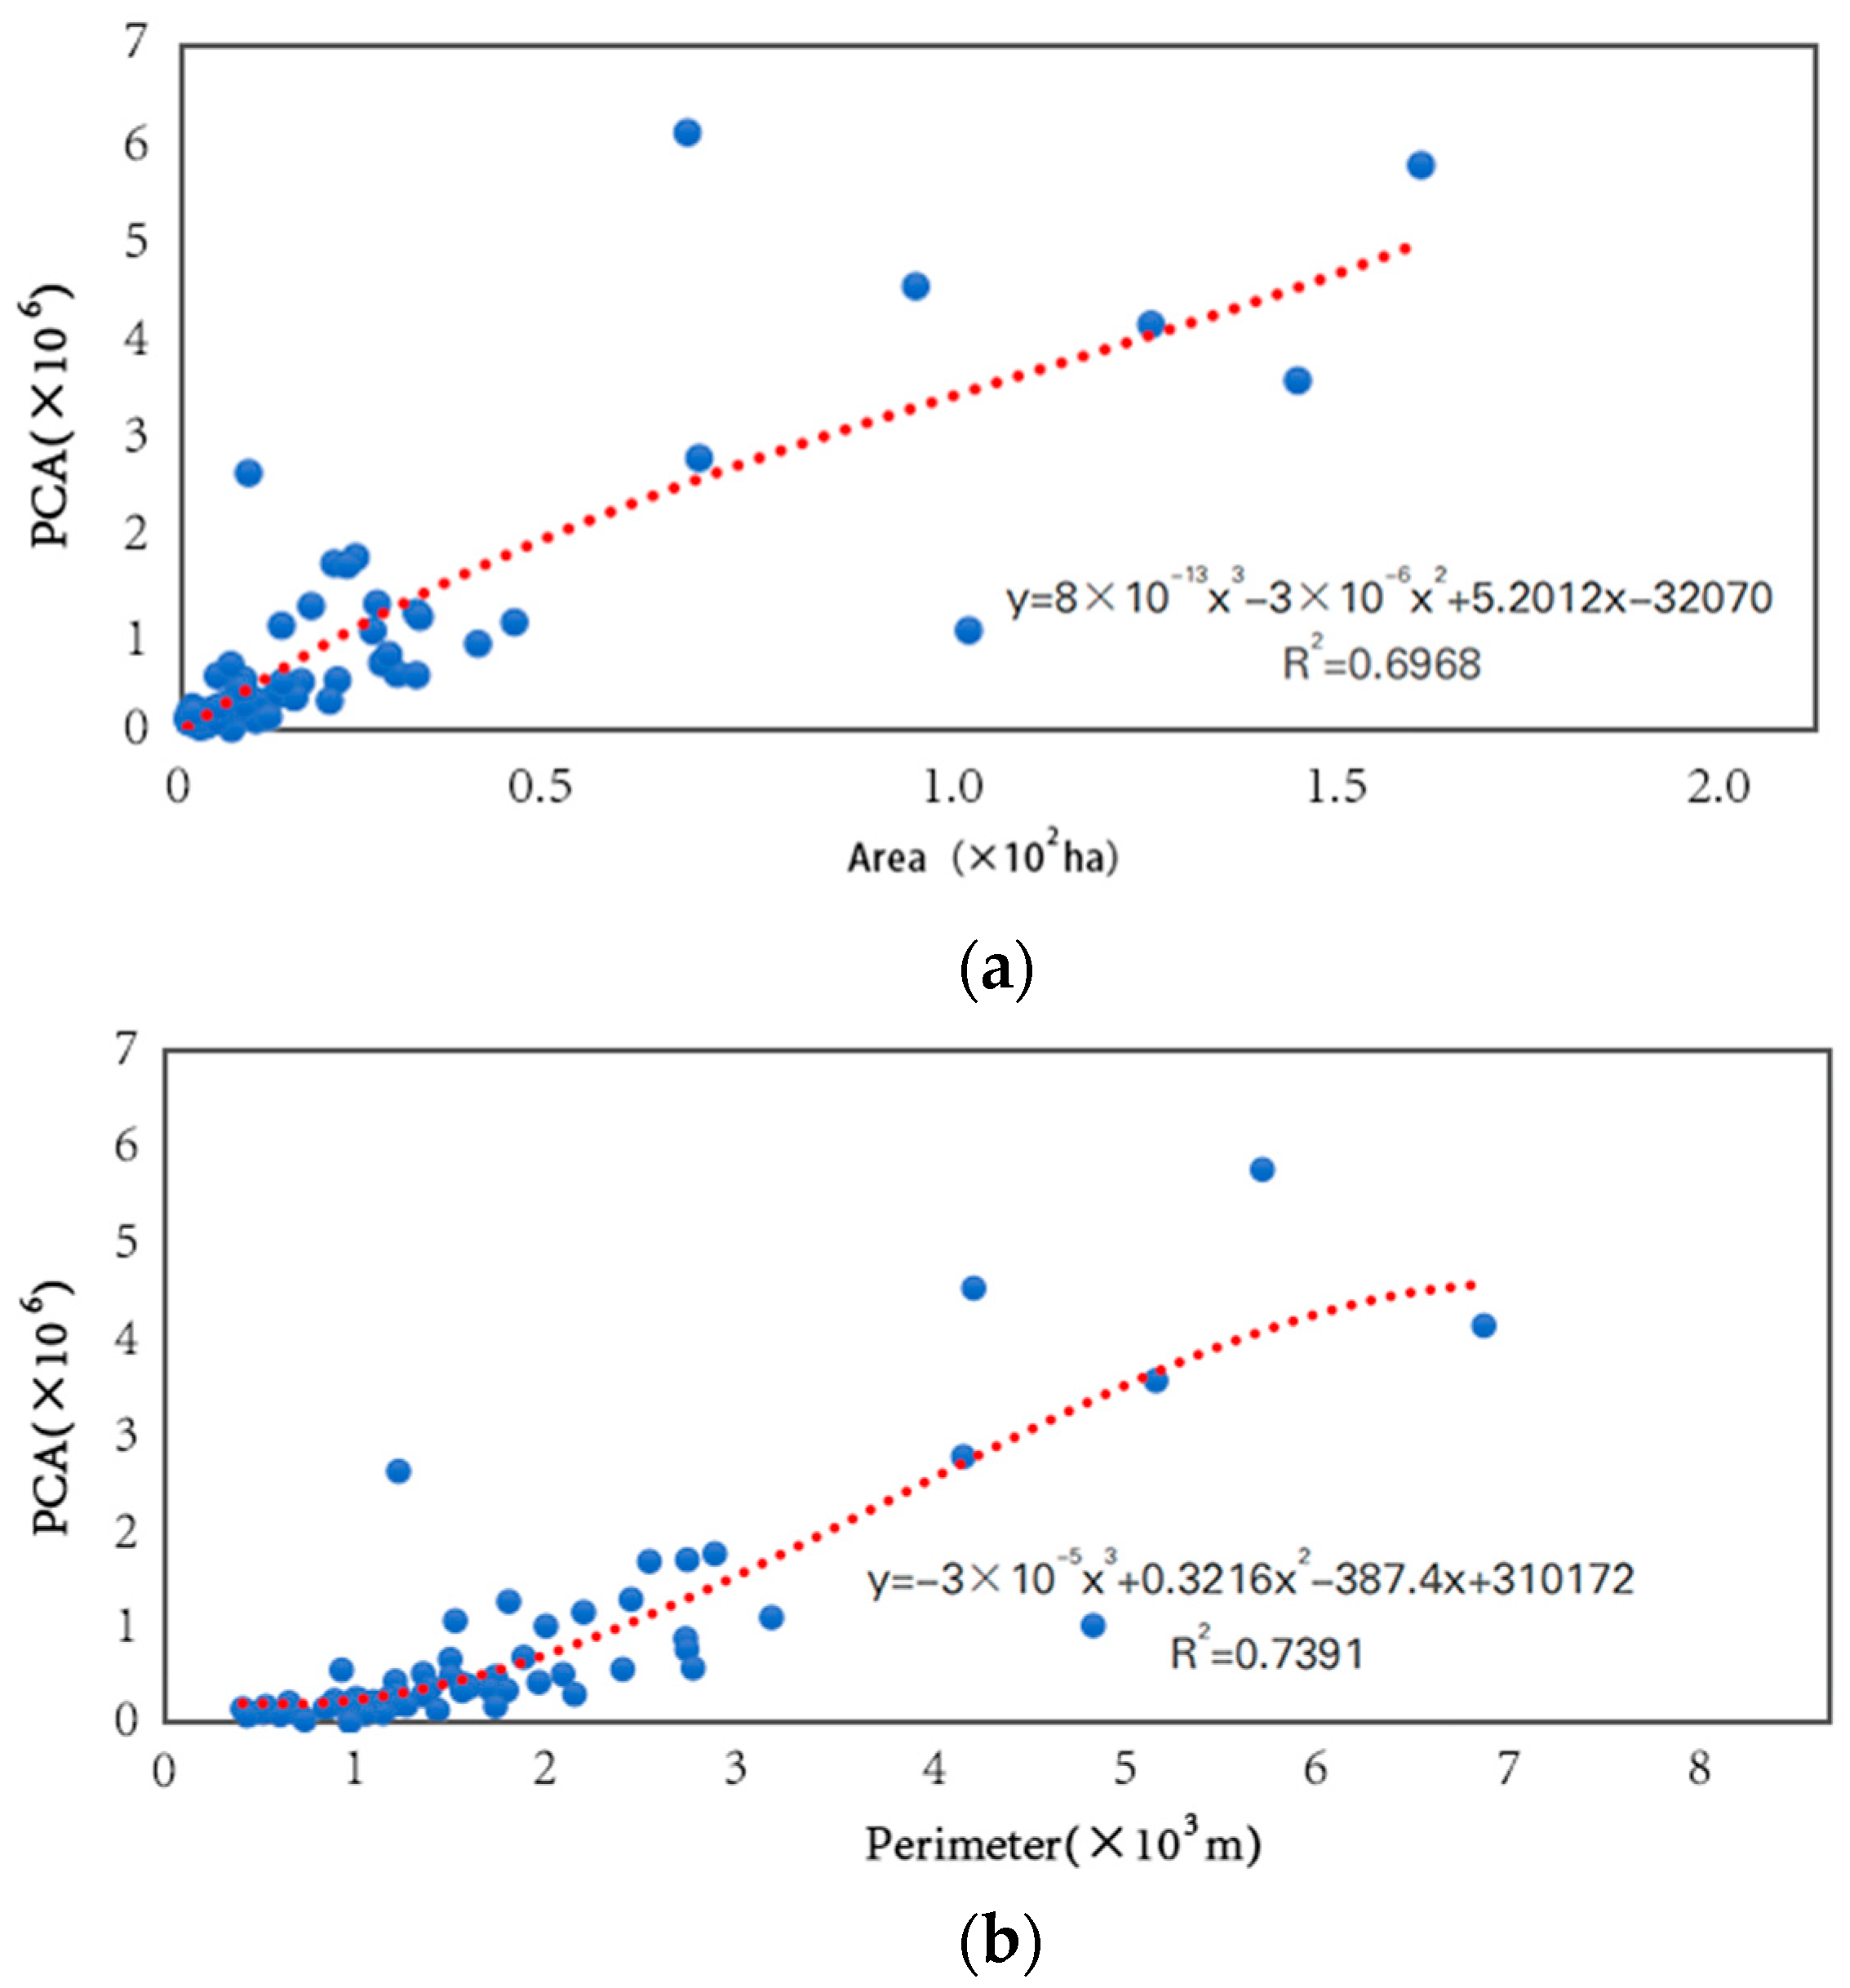
3.4.1. Correlation Analysis of Urban Park Area, Perimeter, and Cooling Area
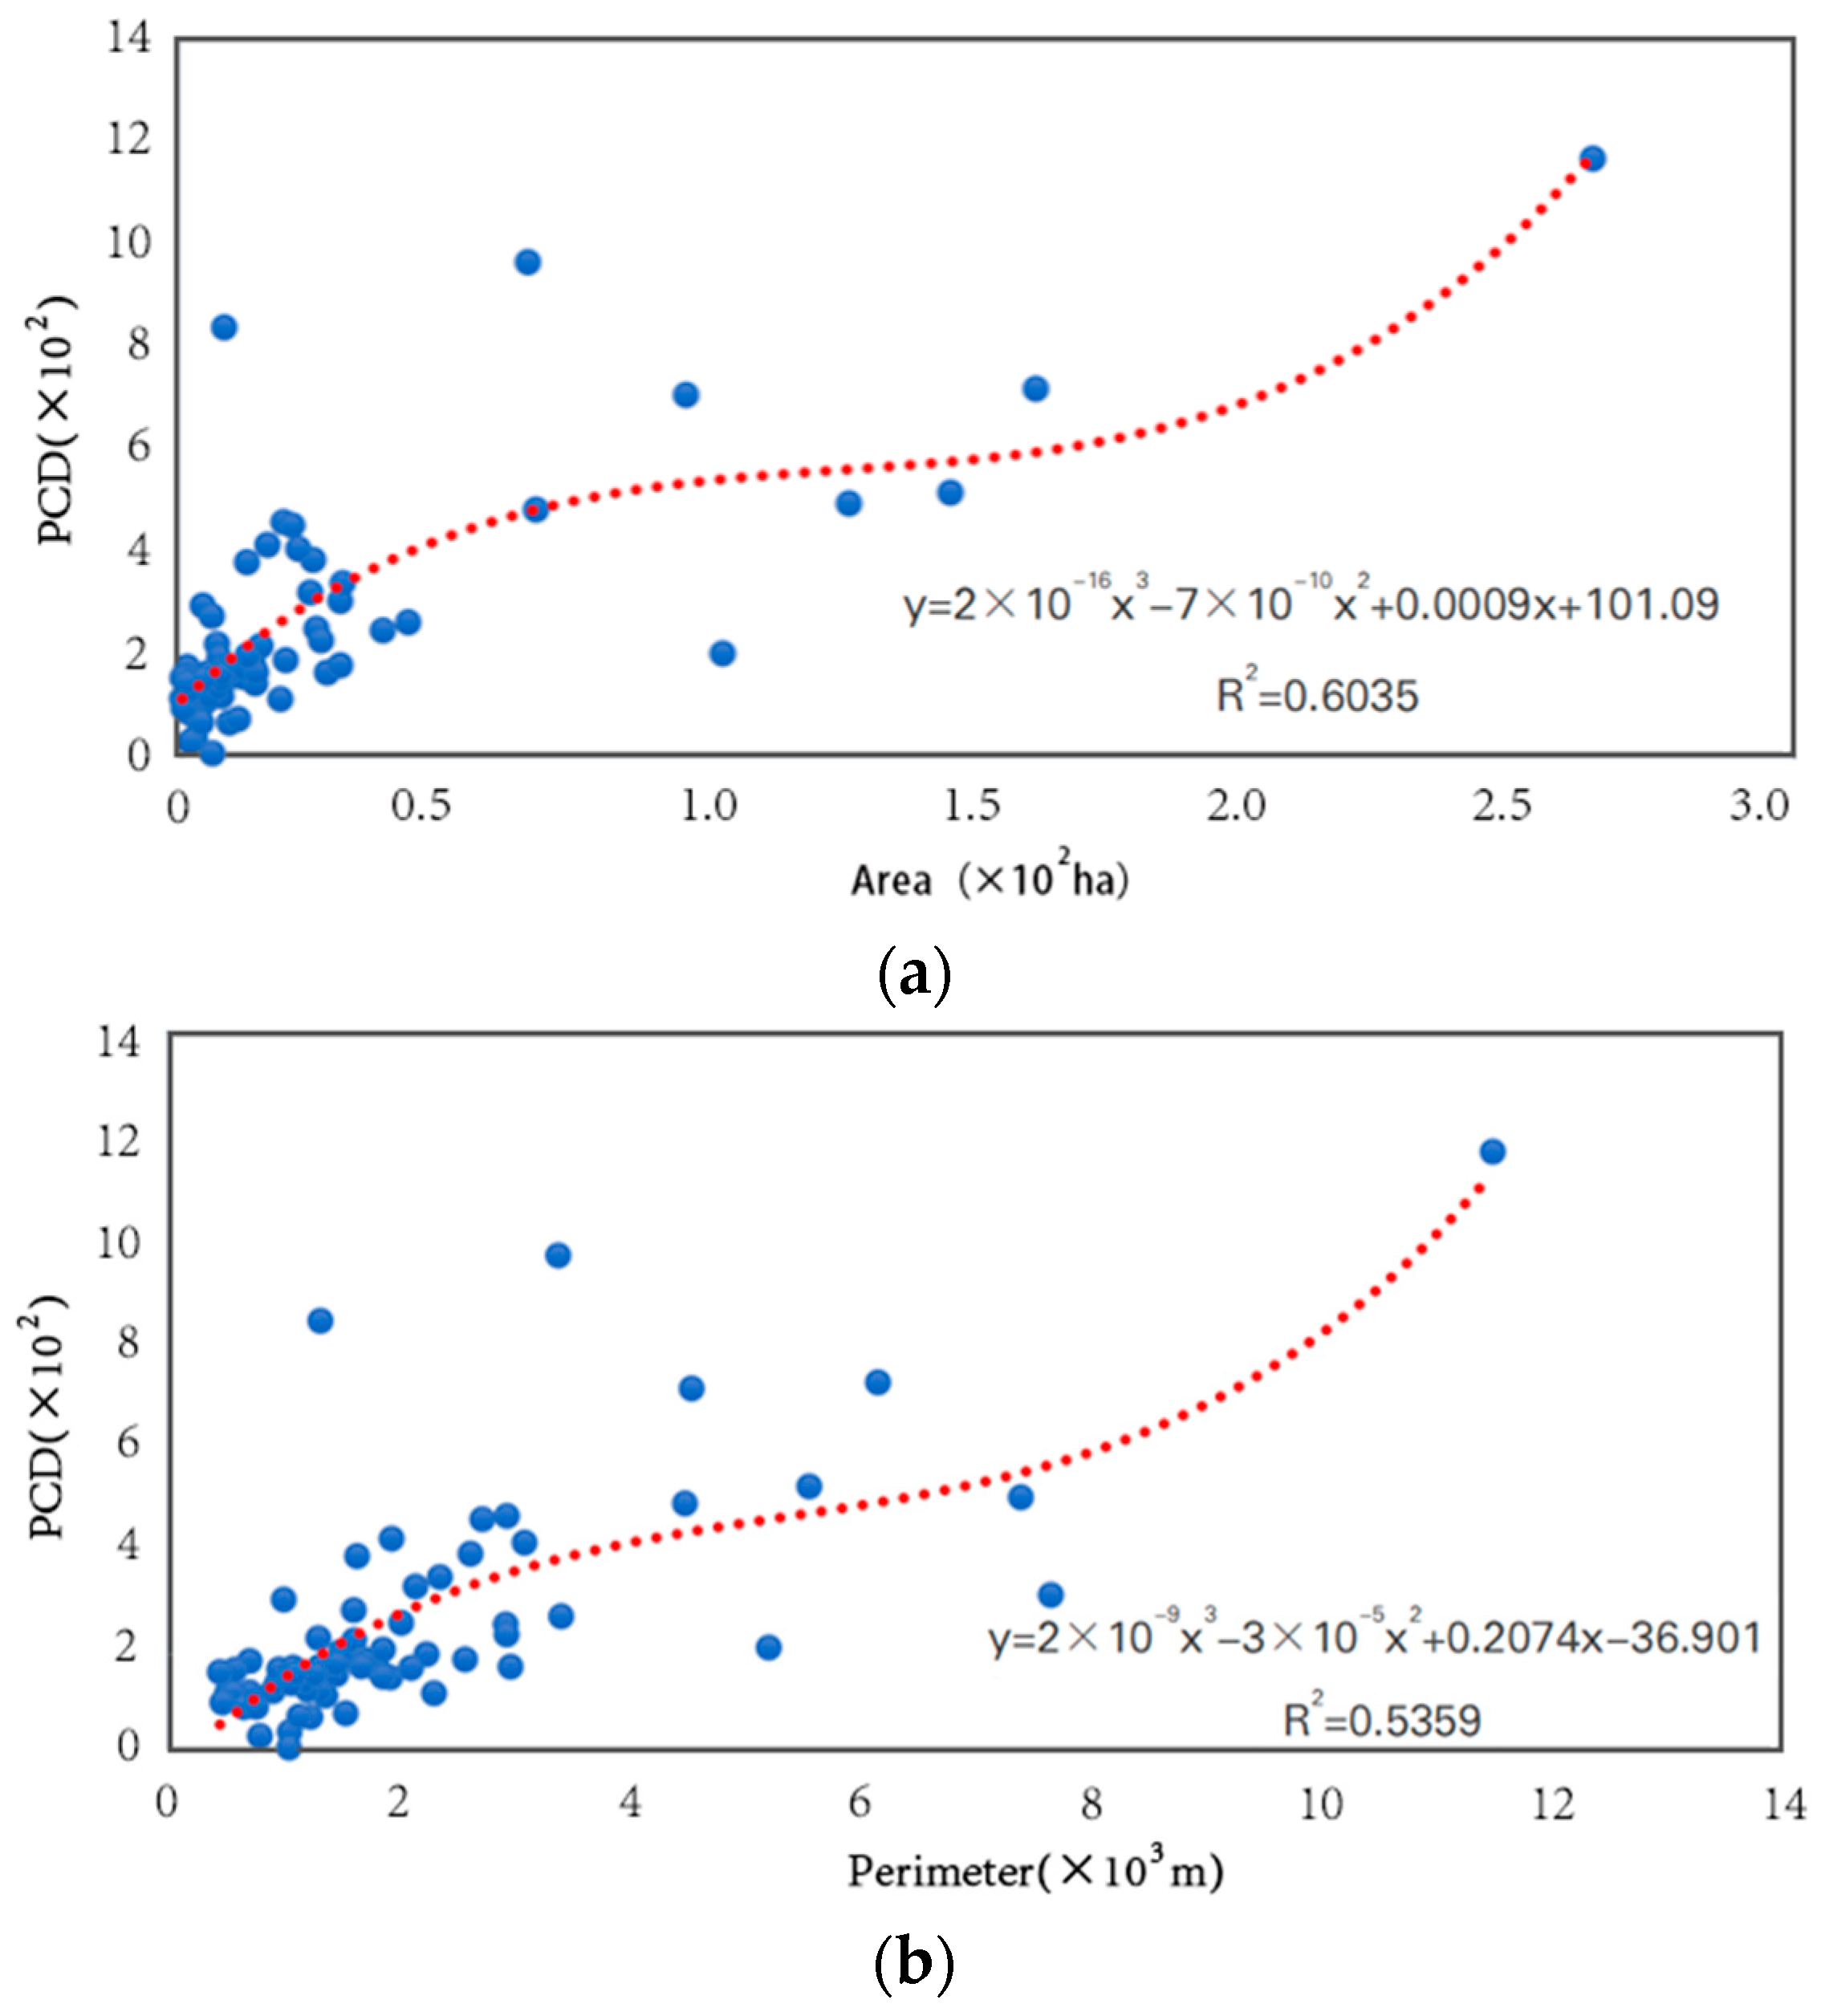
3.4.2. Correlation Analysis of Park Area, Perimeter, and Cooling Distance
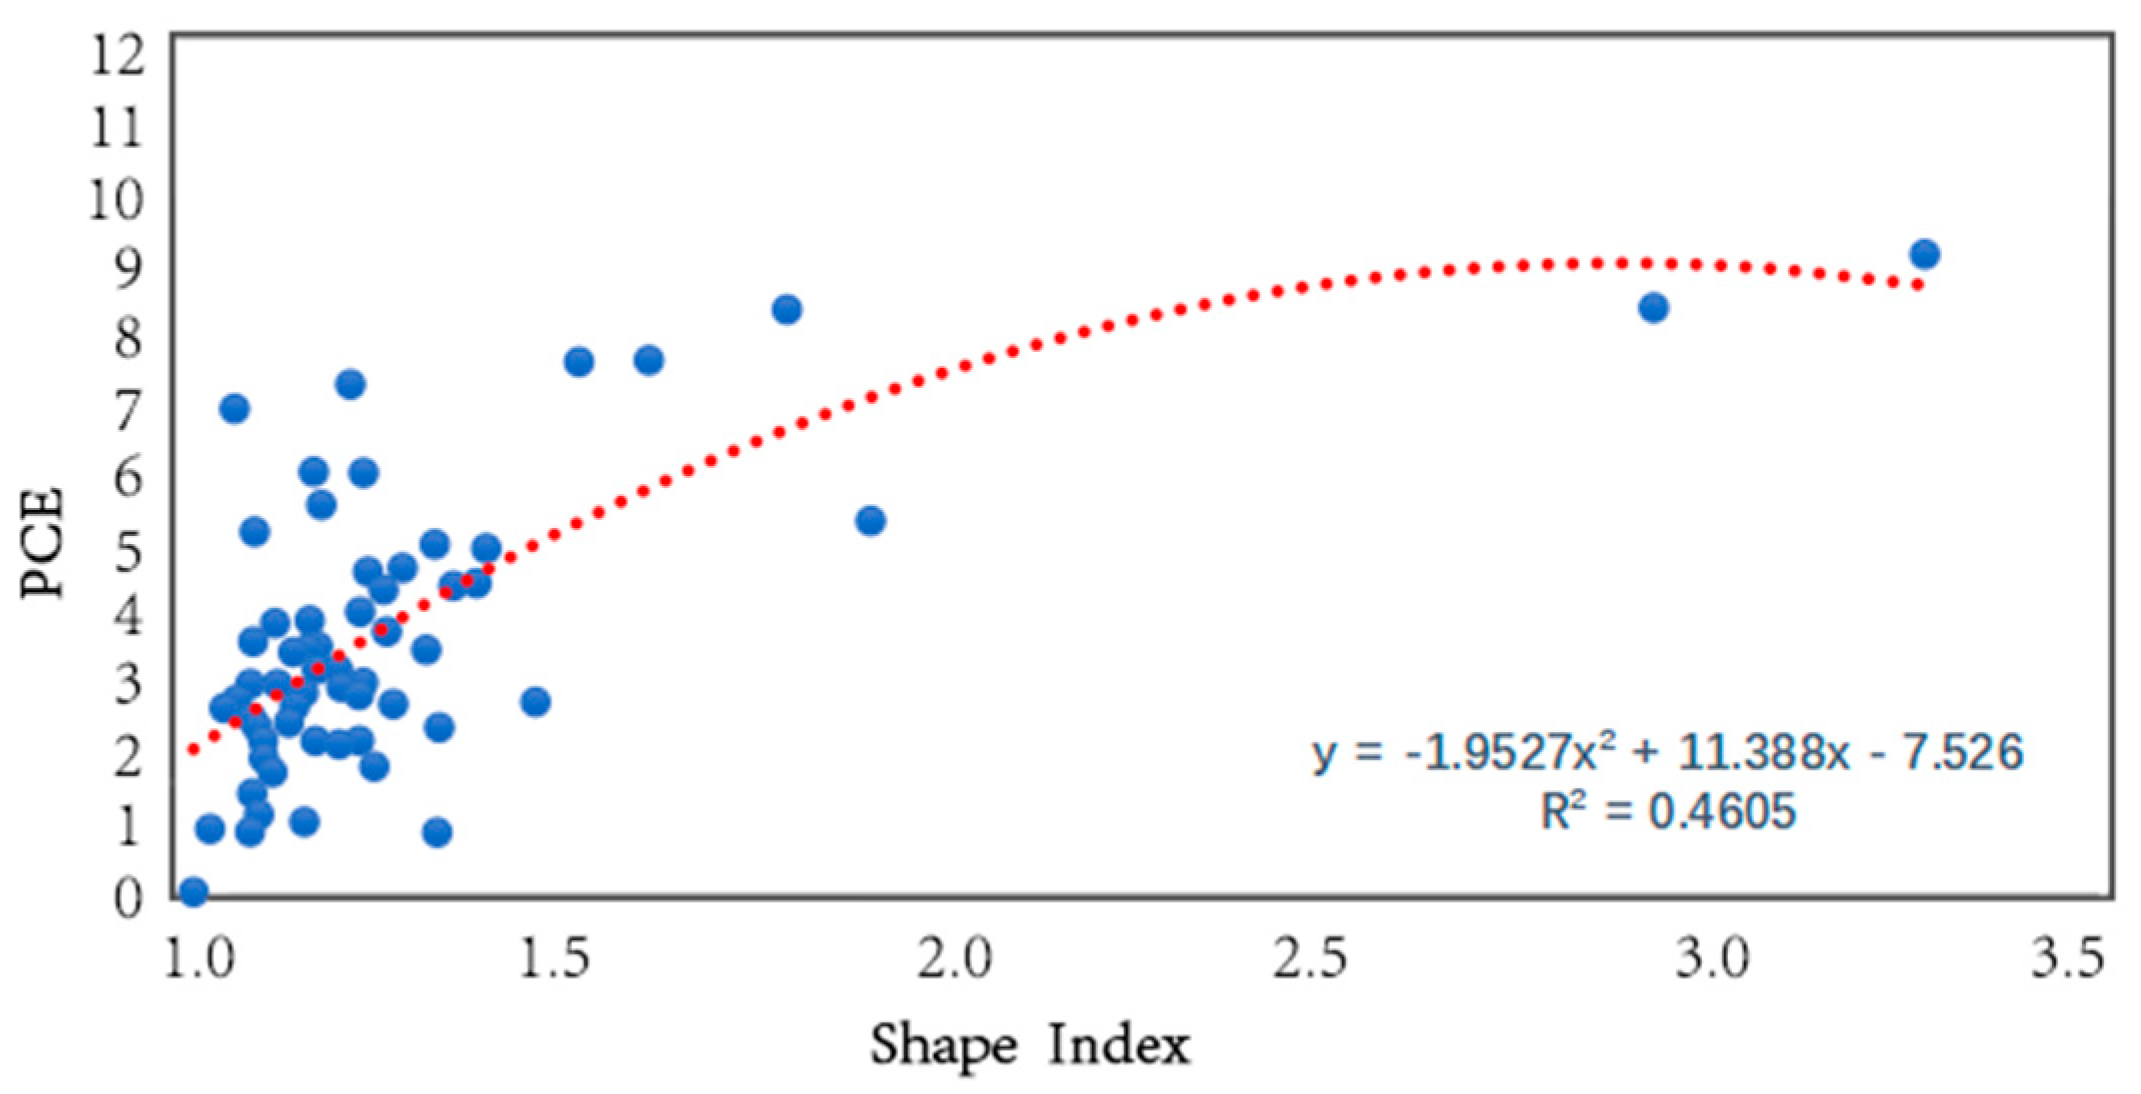
3.4.3. Correlation Analysis of Shape Index and Cooling Efficiency
4. Discussion
4.1. Optimal Urban Park Cooling Effect Morphology
4.2. Correlation and Threshold of Cooling Effect in Urban Parks
4.3. Limitations and Future Research Directions
5. Conclusions
- The cooling effects of urban parks with different morphologies on the surrounding thermal environment were different, with round parks > round parks with a strip tendency > strip parks. Among them, the round park with a complex morphological boundary had good economic and ecological benefits, and its shape index was 71.5% higher than the minimum value.
- The area of urban parks significantly affected the cooling distance and cooling area of parks, and the correlation coefficients were 0.898 and 0.964, respectively. When the area of urban parks was larger than 30 ha, the increase in the cooling effect decreased by 50.0%. For the cooling distance, the threshold value of the urban park area was 70 ha.
- The perimeter of the urban park was significantly and positively correlated with the cooling distance and cooling area of the park. When the perimeter length was greater than 3000 m, the park cooling area increased faster. When the park perimeter exceeded 4000 m, the cooling distance no longer increased significantly, and when it reached 9000 m, the increase rose steeply again.
- The shape index of urban parks was significantly and positively correlated with the cooling efficiency of parks. When the shape index was 2.8, the cooling efficiency reached the inflection point value. However, the length–width ratio of urban parks did not have a large influence on the cooling effect.
Author Contributions
Funding
Data Availability Statement
Conflicts of Interest
References
- Peng, J.; Ma, J.; Liu, Q.Y.; Liu, Y.X.; Hu, Y.N.; Li, Y.R.; Yue, Y.M. Spatial-Temporal Change of Land Surface Temperature across 285 Cities in China: An Urban-Rural Contrast Perspective. Sci. Total Environ. 2018, 635, 487–497. [Google Scholar] [CrossRef]
- Arshad, S.; Ahmad, S.R.; Abbas, S.; Asharf, A.; Siddiqui, N.A.; ul Islam, Z. Quantifying the Contribution of Diminishing Green Spaces and Urban Sprawl to Urban Heat Island Effect in a Rapidly Urbanizing Metropolitan City of Pakistan. Land Use Policy 2022, 113, 105874. [Google Scholar] [CrossRef]
- Zhang, L.; Wei, D.; Hou, Y.; Du, J.; Liu, Z.; Zhang, G.; Shi, L. Outdoor Thermal Comfort of Urban Park—A Case Study. Sustainability 2020, 12, 1961. [Google Scholar] [CrossRef]
- Galodha, A.; Gupta, S.K. LAND surface temperature as an indicator of urban heat island effect: A google earth engine based Web-App. In Proceedings of the the International Archives of the Photogrammetry, Remote Sensing and Spatial Information Sciences, Virtual, 29 March–2 April 2021; Volume XLIV-M-3-2021, pp. 57–62. [Google Scholar] [CrossRef]
- Kolokotroni, M.; Ren, X.; Davies, M.; Mavrogianni, A. London’s Urban Heat Island: Impact on Current and Future Energy Consumption in Office Buildings. Energy Build. 2012, 47, 302–311. [Google Scholar] [CrossRef]
- Li, H.; Wang, G.; Tian, G.; Jombach, S. Mapping and Analyzing the Park Cooling Effect on Urban Heat Island in an Expanding City: A Case Study in Zhengzhou City, China. Land 2020, 9, 57. [Google Scholar] [CrossRef]
- de Abreu-Harbicha, L.V.; Labakia, L.C.; Matzarakis, A. Effect of Tree Planting Design and Tree Species on Human Thermal Comfort in the Tropics. Landsc. Urban Plan. 2015, 138, 99–109. [Google Scholar] [CrossRef]
- Norton, B.A.; Coutts, A.M.; Livesley, S.J.; Harris, R.J.; Hunter, A.M.; Williams, N.S.G. Planning for Cooler Cities: A Framework to Prioritise Green Infrastructure to Mitigate High Temperatures in Urban Landscapes. Landsc. Urban Plan. 2015, 134, 127–138. [Google Scholar] [CrossRef]
- Stratópoulos, L.M.F.; Duthweiler, S.; Häberle, K.-H.; Pauleit, S. Effect of Native Habitat on the Cooling Ability of Six Nursery-Grown Tree Species and Cultivars for Future Roadside Plantings. Urban For. Urban Green. 2018, 30, 37–45. [Google Scholar] [CrossRef]
- Mazzeo, D.; Matera, N.; Peri, G.; Scaccianoce, G. Forecasting Green Roofs’ Potential in Improving Building Thermal Performance and Mitigating Urban Heat Island in the Mediterranean Area: An Artificial Intelligence-Based Approach. SSRN Electron. J. 2022, 22, 119879. [Google Scholar] [CrossRef]
- Moss, J.L.; Doick, K.J.; Smith, S.; Shahrestani, M. Influence of Evaporative Cooling by Urban Forests on Cooling Demand in Cities. Urban For. Urban Green. 2019, 37, 65–73. [Google Scholar] [CrossRef]
- Narh, S.N.; Takyi, S.A.; Asibey, M.O.; Amponsah, O. Garden City without Parks: An Assessment of the Availability and Conditions of Parks in Kumasi. Urban For. Urban Green. 2020, 55, 126819. [Google Scholar] [CrossRef]
- Bernard, J.; Rodler, A.; Morille, B.; Zhang, X. How to Design a Park and Its Surrounding Urban Morphology to Optimize the Spreading of Cool Air? Climate 2018, 6, 10. [Google Scholar] [CrossRef]
- Zoulia, I.; Santamouris, M.; Dimoudi, A. Monitoring the Effect of Urban Green Areas on the Heat Island in Athens. Environ. Monit. Assess. 2009, 156, 275–292. [Google Scholar] [CrossRef]
- Li, Y.L.; Fan, S.X.; Li, K.; Zhang, Y.; Kong, L.X.; Xie, Y.F.; Dong, L. Large Urban Parks Summertime Cool and Wet Island Intensity and Its Influencing Factors in Beijing, China. Urban For. Urban Green. 2021, 65, 127375. [Google Scholar] [CrossRef]
- Cohen, P.; Potchter, O.; Matzarakis, A. Daily and Seasonal Climatic Conditions of Green Urban Open Spaces in the Mediterranean Climate and Their Impact on Human Comfort. Build. Environ. 2012, 51, 285–295. [Google Scholar] [CrossRef]
- Spronken-Smith, R.; Oke, T.R. The Thermal Regime of Urban Parks in Two Cities with Different Summer Climates. Int. J. Remote Sens. 1998, 19, 2085–2104. [Google Scholar] [CrossRef]
- Algretawee, H. The Effect of Graduated Urban Park Size on Park Cooling Island and Distance Relative to Land Surface Temperature (LST). Urban Clim. 2022, 45, 101255. [Google Scholar] [CrossRef]
- Wu, J. Landscape Ecology—Pattern, Process, Scale and Hierarchy, 2nd ed.; Higher Education Press: Beijing, China, 2007; ISBN 9787040208795. [Google Scholar]
- Kong, F.; Yin, H.; James, P.; Hutyra, L.R.; He, H.S. Effects of Spatial Pattern of Greenspace on Urban Cooling in a Large Metropolitan Area of Eastern China. Landsc. Urban Plan. 2014, 128, 35–47. [Google Scholar] [CrossRef]
- Guo, L.; Liu, R.; Men, C.; Wang, Q.; Miao, Y.; Zhang, Y. Quantifying and Simulating Landscape Composition and Pattern Impacts on Land Surface Temperature: A Decadal Study of the Rapidly Urbanizing City of Beijing, China. Sci. Total Environ. 2019, 654, 430–440. [Google Scholar] [CrossRef] [PubMed]
- Oke, T.R.; Zeuner, G.; Jauregui, E. The Surface Energy Balance in Mexico City. Atmos. Environ. Part B Urban Atmos. 1992, 26, 433–444. [Google Scholar] [CrossRef]
- Liu, D.; Li, Y.; Kong, F. Spatial Distribution of Land Surface Temperature in Central City Proper and the Cooling of Objects Effect: A Case Study of Nanjing. Remote Sens. Nat. Resour. 2013, 25, 117–122. [Google Scholar] [CrossRef]
- Xiao, J. Cooling Effect of City Parks—A Case of Shijiazhuang. J. Arid Landsc. Resour. Environ. 2015, 29, 75–79. [Google Scholar] [CrossRef]
- Han, W. Shape, 1st ed.; Southeast University Press: Nanjing, China, 2006; ISBN 9787564102715. [Google Scholar]
- Yin, J.; Wu, X.; Shen, M.; Zhang, X.; Zhu, C.; Xiang, H.; Shi, C.; Guo, Z.; Li, C. Impact of Urban Greenspace Spatial Pattern on Land Surface Temperature: A Case Study in Beijing Metropolitan Area, China. Landsc. Ecol. 2019, 34, 2949–2961. [Google Scholar] [CrossRef]
- Zhang, X.; Zhong, T.; Feng, X.; Wang, K. Estimation of the Relationship between Vegetation Patches and Urban Land Surface Temperature with Remote Sensing. Int. J. Remote Sens. 2009, 30, 2105–2118. [Google Scholar] [CrossRef]
- Nastran, M.; Kobal, M.; Eler, K. Urban Heat Islands in Relation to Green Land Use in European Cities. Urban For. Urban Green. 2019, 37, 33–41. [Google Scholar] [CrossRef]
- Zhou, W.; Huang, G.; Cadenasso, M.L. Does Spatial Configuration Matter? Understanding the Effects of Land Cover Pattern on Land Surface Temperature in Urban Landscapes. Landsc. Urban Plan. 2011, 102, 54–63. [Google Scholar] [CrossRef]
- Han, G.; Cai, Z. Impact of Mountain Urban Park Form on Cooling Effect. J. Hum. Settl. West China 2016, 31, 61–68. [Google Scholar] [CrossRef]
- Batty, M. Exploring Isovist Fields: Space and Shape in Architectural and Urban Morphology. Environ. Plan. B Plan. Des. 2001, 28, 123–150. [Google Scholar] [CrossRef]
- Pu, X. Quantitative Research on the Integrated Form of the Two-Dimension Plan to Traditional Rural Settlement. Ph.D. Thesis, Zhejiang University, Hangzhou, China, 2012. [Google Scholar]
- Hai, Y.; Fan, W.; Li, D. Influence of a Large Urban Park on the Local Urban Thermal Environment. Sci. Total Environ. 2018, 622, 882–891. [Google Scholar] [CrossRef]
- Wu, F.; Li, S.; Liu, J. Research on the Relationship between Urban Green Spaces of Different Areas and the Temperature and Humidity Benefit. Chin. Landsc. Arch. 2007, 23, 71–74. [Google Scholar]
- Du, H.; Zhou, F.; Cai, W.; Cai, Y.; Xu, Y. Thermal and Humidity Effect of Urban Green Spaces with Different Shapes: A Case Study of Shanghai, China. Int. J. Environ. Res. Public Health 2021, 18, 5941. [Google Scholar] [CrossRef] [PubMed]
- Yu, Z.; Guo, X.; Jørgensen, G.; Vejre, H. How Can Urban Green Spaces Be Planned for Climate Adaptation in Subtropical Cities? Ecol. Indic. 2017, 82, 152–162. [Google Scholar] [CrossRef]
- McGarigal, K.; Marks, B.J. FRAGSTATS: Spatial Pattern Analysis Program for Quantifying Landscape Structure; US Department of Agriculture, Forest Service, Pacific Northwest Research Station: Corvallis, OR, USA, 1995; Volume 351.
- Stewart, I.D. A Systematic Review and Scientific Critique of Methodology in Modern Urban Heat Island Literature. Int. J. Climatol. 2011, 31, 200–217. [Google Scholar] [CrossRef]
- Mohamed, A.A.; Odindi, J.; Mutanga, O. Land Surface Temperature and Emissivity Estimation for Urban Heat Island Assessment Using Medium- and Low-Resolution Space-Borne Sensors: A Review. Geocarto Int. 2017, 32, 455–470. [Google Scholar] [CrossRef]
- Yu, Z.; Guo, X.; Zeng, Y.; Koga, M.; Vejre, H. Variations in Land Surface Temperature and Cooling Efficiency of Green Space in Rapid Urbanization: The Case of Fuzhou City, China. Urban For. Urban Green. 2018, 29, 113–121. [Google Scholar] [CrossRef]
- Feyisa, G.L.; Dons, K.; Meilby, H. Efficiency of Parks in Mitigating Urban Heat Island Effect: An Example from Addis Ababa. Landsc. Urban Plan. 2014, 123, 87–95. [Google Scholar] [CrossRef]
- Pramanik, S.; Punia, M. Assessment of Green Space Cooling Effects in Dense Urban Landscape: A Case Study of Delhi, India. Model. Earth Syst. Environ. 2019, 5, 867–884. [Google Scholar] [CrossRef]
- Blachowski, J.; Hajnrych, M. Assessing the Cooling Effect of Four Urban Parks of Different Sizes in a Temperate Continental Climate Zone: Wroclaw (Poland). Forests 2021, 12, 1136. [Google Scholar] [CrossRef]
- Kawashima, S.; Ishida, T.; Minomura, M.; Miwa, T. Relations between Surface Temperature and Air Temperature on a Local Scale during Winter Nights. J. Appl. Meteorol. 2000, 39, 1570–1579. [Google Scholar] [CrossRef]
- Doick, K.J.; Peace, A.; Hutchings, T.R. The Role of One Large Greenspace in Mitigating London’s Nocturnal Urban Heat Island. Sci. Total Environ. 2014, 493, 662–671. [Google Scholar] [CrossRef]
- Hartz, D.A.; Prashad, L.; Hedquist, B.C.; Golden, J.S.; Brazel, A. Linking Satellite Images and Hand-Held Infrared Thermography to Observed Neighborhood Climate Conditions. Remote Sens. Environ. 2006, 104, 190–200. [Google Scholar] [CrossRef]
- Cueto, O.R.G.; Ostos, E.J.; Toudert, D.; Martínez, A.T. Detection of the Urban Heat Island in Mexicali, B.C., México and Its Relationship with Land Use. Atmosfera 2007, 20, 111–131. [Google Scholar]
- Lindberg, F. Modelling the Urban Climate Using a Local Governmental Geo-Database. Meteorol. Appl. 2007, 14, 263–273. [Google Scholar] [CrossRef]
- Schwarz, N.; Schlink, U.; Franck, U.; Großmann, K. Relationship of Land Surface and Air Temperatures and Its Implications for Quantifying Urban Heat Island Indicators—An Application for the City of Leipzig (Germany). Ecol. Indic. 2012, 18, 693–704. [Google Scholar] [CrossRef]
- Chow, W.T.L.; Roth, M. Temporal Dynamics of the Urban Heat Island of Singapore. Int. J. Climatol. 2006, 26, 2243–2260. [Google Scholar] [CrossRef]
- Chang, C.-R.; Li, M.-H.; Chang, S.-D. A Preliminary Study on the Local Cool-Island Intensity of Taipei City Parks. Landsc. Urban Plan. 2007, 80, 386–395. [Google Scholar] [CrossRef]
- Cheng, X.; Wei, B.; Chen, G.; Li, J.; Song, C. Influence of Park Size and Its Surrounding Urban Landscape Patterns on the Park Cooling Effect. J. Urban Plan. Dev. 2015, 141, A4014002. [Google Scholar] [CrossRef]
- Peng, J.; Dan, Y.; Qiao, R.; Liu, Y.; Dong, J.; Wu, J. How to Quantify the Cooling Effect of Urban Parks? Linking Maximum and Accumulation Perspectives. Remote Sens. Environ. 2021, 252, 112135. [Google Scholar] [CrossRef]
- Chen, X.; Su, Y.; Li, D.; Huang, G.; Chen, W.; Chen, S. Study on the Cooling Effects of Urban Parks on Surrounding Environments Using Landsat TM Data: A Case Study in Guangzhou, Southern China. Int. J. Remote Sens. 2012, 33, 5889–5914. [Google Scholar] [CrossRef]
- Fan, H.; Yu, Z.; Yang, G.; Liu, T.Y.; Liu, T.Y.; Hung, C.H.; Vejre, H. How to Cool Hot-Humid (Asian) Cities with Urban Trees? An Optimal Landscape Size Perspective. Agric. For. Meteorol. 2019, 265, 338–348. [Google Scholar] [CrossRef]
- Yu, Z.; Fryd, O.; Sun, R.; Jørgensen, G.; Yang, G.; Özdil, N.C.; Vejre, H. Where and How to Cool? An Idealized Urban Thermal Security Pattern Model. Landsc. Ecol. 2021, 36, 2165–2174. [Google Scholar] [CrossRef]
- Yu, Z.W.; Xu, S.B.; Zhang, Y.H.; Jorgensen, G.; Vejre, H. Strong Contributions of Local Background Climate to the Cooling Effect of Urban Green Vegetation. Sci. Rep. 2018, 8, 6798. [Google Scholar] [CrossRef]
- Vaz Monteiro, M.; Doick, K.J.; Handley, P.; Peace, A. The Impact of Greenspace Size on the Extent of Local Nocturnal Air Temperature Cooling in London. Urban For. Urban Green. 2016, 16, 160–169. [Google Scholar] [CrossRef]
- Gunawardena, K.R.; Wells, M.J.; Kershaw, T. Utilising Green and Bluespace to Mitigate Urban Heat Island Intensity. Sci. Total Environ. 2017, 584, 1040–1055. [Google Scholar] [CrossRef]
- Yu, X.; Guo, X.; Wu, Z. Land Surface Temperature Retrieval from Landsat 8 TIRS-Comparison between Radiative Transfer Equation-Based Method, Split Window Algorithm and Single Channel Method. Remote Sens. 2014, 6, 9829–9852. [Google Scholar] [CrossRef]
- Chandrasekhar, S. Radiative Transfer; Courier Corporation: Garden City, NY, USA, 2013; ISBN 9780486605906. [Google Scholar]
- Jiménez-Muñoz, J.C.; Sobrino, J.A.; Skoković, D.; Mattar, C.; Cristóbal, J. Land Surface Temperature Retrieval Methods From Landsat-8 Thermal Infrared Sensor Data. IEEE Geosci. Remote Sens. Lett. 2014, 11, 1840–1843. [Google Scholar] [CrossRef]
- Hamada, S.; Ohta, T. Urban Forestry & Urban Greening Seasonal Variations in the Cooling Effect of Urban Green Areas on Surrounding Urban Areas. Urban For. Urban Green. 2010, 9, 15–24. [Google Scholar] [CrossRef]
- Lin, W.; Yu, T.; Chang, X.; Wu, W.; Zhang, Y. Calculating Cooling Extents of Green Parks Using Remote Sensing: Method and Test. Landsc. Urban Plan. 2015, 134, 66–75. [Google Scholar] [CrossRef]
- Su, Y.; Huang, G.; Chen, X.; Chen, S. The Cooling Effect of Guangzhou City Parks to Surrounding Environments. Acta Ecol. Sin. 2010, 30, 4905–4918. [Google Scholar]
- Liao, W.; Cai, Z.; Feng, Y.; Gan, D.; Li, X. A Simple and Easy Method to Quantify the Cool Island Intensity of Urban Greenspace. Urban For. Urban Green. 2021, 62, 127173. [Google Scholar] [CrossRef]
- Yao, X.; Yu, K.; Zeng, X.; Lin, Y.; Ye, B.; Shen, X.; Liu, J. How Can Urban Parks Be Planned to Mitigate Urban Heat Island Effect in “Furnace Cities”? An Accumulation Perspective. J. Clean. Prod. 2022, 330, 129852. [Google Scholar] [CrossRef]
- Gao, Z.; Zaitchik, B.F.; Hou, Y.; Chen, W. Toward Park Design Optimization to Mitigate the Urban Heat Island: Assessment of the Cooling Effect in Five U.S. Cities. Sustain. Cities Soc. 2022, 81, 103870. [Google Scholar] [CrossRef]
- Asgarian, A.; Amiri, B.J.; Sakieh, Y. Assessing the Effect of Green Cover Spatial Patterns on Urban Land Surface Temperature Using Landscape Metrics Approach. Urban Ecosyst. 2015, 18, 209–222. [Google Scholar] [CrossRef]
- Raudsepp-Hearne, C.; Peterson, G.D.; Bennett, E.M. Ecosystem Service Bundles for Analyzing Tradeoffs in Diverse Landscapes. Proc. Natl. Acad. Sci. USA 2010, 107, 5242–5247. [Google Scholar] [CrossRef]
- Hamada, S.; Tanaka, T.; Ohta, T. Impacts of Land Use and Topography on the Cooling Effect of Green Areas on Surrounding Urban Areas. Urban For. Urban Green. 2013, 12, 426–434. [Google Scholar] [CrossRef]
- Yang, C.; He, X.; Yu, L.; Yang, J.; Yan, F.; Bu, K.; Chang, L.; Zhang, S. The Cooling Effect of Urban Parks and Its Monthly Variations in a Snow Climate City. Remote Sens. 2017, 9, 1066. [Google Scholar] [CrossRef]
- Yang, J.; Guo, R.; Li, D.; Wang, X.; Li, F. Interval-Thresholding Effect of Cooling and Recreational Services of Urban Parks in Metropolises. Sustain. Cities Soc. 2022, 79, 103684. [Google Scholar] [CrossRef]
- Lo, C.P.; Quattrochi, D.A.; Luvall, J.C. Application of High-Resolution Thermal Infrared Remote Sensing and GIS to Assess the Urban Heat Island Effect. Int. J. Remote Sens. 1997, 18, 287–304. [Google Scholar] [CrossRef]
- Chen, Y.; Shan, B.; Yu, X.; Zhang, Q.; Ren, Q. Urban Climate Comprehensive Effect of the Three-Dimensional Spatial Distribution Pattern of Buildings on the Urban Thermal Environment. Urban Clim. 2022, 46, 101324. [Google Scholar] [CrossRef]
- Venter, Z.S.; Chakraborty, T.; Lee, X. Crowdsourced Air Temperatures Contrast Satellite Measures of the Urban Heat Island and Its Mechanisms. Sci. Adv. 2021, 7, eabb9569. [Google Scholar] [CrossRef]


| Name | Equation | Description |
|---|---|---|
| Perimeter (P) | P: Perimeter; Pi: perimeter (m) of patch i. | |
| Area (A) | A: area; Ai: area (ha) of patch i. | |
| Length–Width Ratio (λ) | bi: Length (m) of the minimum outer rectangle for patch i. ai: Width (m) of the minimum outer rectangle for patch i. λ: The length–width ratio represents the narrow and long degree of the settlement boundary figure. | |
| Shape Index (S) | S: Shape index, reflecting the deviation degree of the shape between the figure and the ellipse of equal area. | |
| Percentage of Water Body (Pw) | Pw: The total water body as a percentage of the park area. Awi: Area (ha) of water for patch i; Ai: area(ha) of patch i. | |
| Percentage of Green Body (PG) | PG: The total green body as a percentage of the park area. AGi: Area (ha) of green for patch i; Ai: area(ha) of patch i. |
| Classified Basis | Type |
|---|---|
| S * < 2, λ * < 1.5 | Round park |
| S < 2, 1.5 ≤ λ < 2 | Round park with a strip tendency |
| S < 2, 2 ≤ λ | Strip park |
| S ≥ 2, 1.5 ≤ λ < 2 | Star-shaped park without a clear tendency |
| S ≥ 2, 2 ≤ λ | Star-shaped park with a strip tendency |
| Bundle | Sum | Type | Quantity | Percentage |
|---|---|---|---|---|
| 1 | 33 | Strip park | 18 | 54.6% |
| Round park | 9 | 27.3% | ||
| Round park with a strip tendency | 6 | 18.2% | ||
| 2 | 11 | Strip park | 2 | 18.2% |
| Round park | 8 | 72.7% | ||
| Round park with a strip tendency | 1 | 9.1% | ||
| 3 | 5 | Strip park | 4 | 80.0% |
| Round park | 1 | 20.0% | ||
| 4 | 14 | Strip park | 3 | 21.4% |
| Round park | 4 | 28.6% | ||
| Round park with a strip tendency | 7 | 50.0% |
| Characteristic | PCD | PCI | PCA | PCE |
|---|---|---|---|---|
| A/m2 | 0.898 ** | 0.120 | 0.964 ** | 0.033 |
| P/m | 0.886 ** | 0.159 | 0.948 ** | 0.023 |
| S | 0.434 ** | 0.193 | 0.142 | 0.489 ** |
| λ | −0.090 | 0.042 | −0.053 | 0.089 |
Disclaimer/Publisher’s Note: The statements, opinions and data contained in all publications are solely those of the individual author(s) and contributor(s) and not of MDPI and/or the editor(s). MDPI and/or the editor(s) disclaim responsibility for any injury to people or property resulting from any ideas, methods, instructions or products referred to in the content. |
© 2023 by the authors. Licensee MDPI, Basel, Switzerland. This article is an open access article distributed under the terms and conditions of the Creative Commons Attribution (CC BY) license (https://creativecommons.org/licenses/by/4.0/).
Share and Cite
Feng, X.; Yu, J.; Xin, C.; Ye, T.; Wang, T.; Chen, H.; Zhang, X.; Zhang, L. Quantifying and Comparing the Cooling Effects of Three Different Morphologies of Urban Parks in Chengdu. Land 2023, 12, 451. https://doi.org/10.3390/land12020451
Feng X, Yu J, Xin C, Ye T, Wang T, Chen H, Zhang X, Zhang L. Quantifying and Comparing the Cooling Effects of Three Different Morphologies of Urban Parks in Chengdu. Land. 2023; 12(2):451. https://doi.org/10.3390/land12020451
Chicago/Turabian StyleFeng, Xiaojing, Jiahao Yu, Chuliang Xin, Tianhao Ye, Tian’ao Wang, Honglin Chen, Xuemei Zhang, and Lili Zhang. 2023. "Quantifying and Comparing the Cooling Effects of Three Different Morphologies of Urban Parks in Chengdu" Land 12, no. 2: 451. https://doi.org/10.3390/land12020451
APA StyleFeng, X., Yu, J., Xin, C., Ye, T., Wang, T., Chen, H., Zhang, X., & Zhang, L. (2023). Quantifying and Comparing the Cooling Effects of Three Different Morphologies of Urban Parks in Chengdu. Land, 12(2), 451. https://doi.org/10.3390/land12020451