Article

Scale Effect of Sloping Landscape Characteristics on River Water Quality in the Upper Reaches of the Si River in East-Central China

1
College of Environmental Science and Engineering, Donghua University, Shanghai 201620, China
2
State Key Laboratory of Simulation and Regulation of Water Cycle in River Basin, China Institute of Water Resources and Hydropower Research (IWHR), Beijing 100038, China
3
Key Laboratory for Geographical Process Analysis & Simulation of Hubei Province, School of Urban and Environmental Sciences, Central China Normal University, Wuhan 430079, China
4
Yellow River Institute of Hydraulic Research No. 45, Shunhe Road, Jinshui District, Zhengzhou 450003, China
*
Author to whom correspondence should be addressed.
Land 2023, 12(2), 457; https://doi.org/10.3390/land12020457
Submission received: 5 January 2023 / Revised: 8 February 2023 / Accepted: 10 February 2023 / Published: 11 February 2023

Abstract

:
Landscape composition and configuration determine the source of pollutants. They also determine the interception and pollution-holding potential of the surface landscape. Using the upper reaches of the Si River Basin, a major grain-producing region in Shandong province in east-central China, as a case study, this study analyzed the influence of landscape characteristics on river water quality (RWQ) after superimposing topographic slope factors for 2017, and investigated which spatial scale had the strongest influence on RWQ. The landscape indices of three spatial scales (riparian zone, river reach and sub-catchment) and three slope scales (general land, flat ground and steep slope) were extracted. Correlation analysis and redundancy analysis were used to reveal the effects of landscape characteristics on RWQ at different scales. The results indicate that the landscape types were dominated by arable land and construction land in 2017. Landscape indices at different scales were significantly different. The RWQ generally met Class II or III surface water quality standard. Arable land and construction land had a negative impact on RWQ, both of which were “source” landscapes, while forest was a “sink” landscape that can effectively alleviate the deterioration of RWQ. The eight landscape indices which indicated heterogeneity, fragmentation level, landscape diversity, and shape information had different degrees of correlation with NO3-N, NH4+-N, CODMn and BOD5. Different scales of landscape features had different correlations with RWQ, with the strongest correlation in the riparian zone, followed by the river reach, and the weakest in the sub-catchment. The influence of steep slope land was higher than that of flat ground land. The study confirmed that landscape structure and configuration had a scale effect on RWQ. It thus has great significance for water resources protection and land use management in the study area.

1. Introduction

River water quality (RWQ) plays a key role in the sustainable development and environmental health of modern society, and it is an important measure of an environmentally friendly society [1,2,3]. There are two causes of water pollution: point source pollution and non-point source pollution [4]. At present, the control of point source pollution has become quite effective, and non-point source pollution has become the dominant factor in river water pollution [5]. The landscape structure and configuration are the main factors causing non-point source pollution, because they affect the migration and transformation of pollutants in runoff [6]. Therefore, studying the relationship between regional landscape characteristics and RWQ is one of the keys to controlling regional surface source pollution and restoring aquatic ecology [7].
The relationship between landscape characteristics and RWQ is influenced by both natural attributes and spatial scales [8,9,10]. The currently available studies focus on watershed landscape composition and structure from a natural attribute perspective. Most studies have shown that water quality parameters are more sensitive to landscape composition, especially in arable land and forest landscapes [11,12]. With continuous research, the research content has developed from focusing on the influence of landscape composition on RWQ to focusing on landscape configuration. Studies have used the landscape index to analyze the connection between landscape configuration and RWQ in landscape ecological processes [13]. On this basis, the two levels of natural attributes and spatial scales were effectively combined to analyze the influence of various landscape structures and configuration on RWQ at different spatial scales [14,15]. Different regions had different research results as they were influenced by topography, geomorphology, hydroclimate, and soil conditions, among others. Coupled with different spatial scales, the influence of landscape features on RWQ varies greatly [16,17]. Some studies have concluded that the sub-catchment have a greater impact on RWQ than riparian zones and river reach, but others have concluded that riparian zones can better explain RWQ [18,19,20,21]. On the other hand, the methods used to refine the relationship are broad and include two types: traditional statistical analysis and model simulation analysis [22,23,24]. Model simulation methods are affected by the difficulty of data acquisition and applicability, and their application in the study of the relationship between landscape features and RWQ response is somewhat limited [25]. The traditional statistical analysis method can more directly reflect the connection between the two, and is still the most widely used analysis method.
A synthesis of the above domestic and international research progress found that in the spatial scale effect study of the association between landscape features and RWQ, the spatial scale with the greatest impact on RWQ was highly controversial. Additionally, most studies on landscape features and RWQ were concentrated in urbanized watersheds, lake and wetland watersheds, and less in the main food production areas where agricultural production was the main focus [26,27]. In contrast, in the main grain-producing areas where arable land is the main landscape type, topographic slope is not only critical for agricultural production, but also a key factor in characterizing the migration of pollutants carried by surface runoff into the river [28]. Therefore, this study focused on the main grain-producing areas to analyze the influence of landscape features on RWQ after superimposing topographic slope factors and to investigate which spatial scale had the strongest influence on RWQ in the study area. This study provided a scientific basis and reference for the control of pollutants entering the river, water environmental protection, the optimization of landscape configuration and the sustainable development of the regional ecological environment in the main grain-producing areas.
The Si River is a tributary of the northern bank of the Huai River in Shandong Province, China. The upper watershed of the Si River is a major grain-producing area in central Shandong Province. In this paper, the upper Si River Basin was used as the study area. The landscape composition and landscape indices of three spatial scales (riparian zone, river reach, and sub-catchment) and three slope scales (general land, steep slope, and flat ground) were extracted based on the 2017 land use and topographic data. Combined with water quality data from September of the same year, traditional correlation and redundancy analyses were applied to reveal the relationship between landscape characteristics at different spatial scales and RWQ in the upper Si River Basin, with a view to providing references for the management of land use structure and the security of water resources in the Si River Basin.

2. Study Area

The Si River is a tributary of the north coast of Huai River in east-central China, which directly flows into the Nansi Lake water system in Huai River basin (Figure 1). The study area was the upper reaches of the Si Rive, located within 117°6′–117°42′ E, 35°27′–35°49′ N. The main stream in the territory is 70.26 km and covers an area of 1242.64 km2. The topography in the study area is high in the east and low in the west, high in the south and low in the north. The annual average precipitation in the basin is 760 mm, and the annual average evaporation is 1042.2 mm. The average annual runoff is 2.44 × 10⁸ m3/a. Cinnamon soil is the most widely distributed, with cultivated vegetation as the main vegetation type.

3. Materials and Methods

3.1. Data Source

The RWQ monitoring data in September 2017 were obtained from the Water Conservancy Bureau of Sishui County, Jining City, Shandong Province, China. There were eight monitoring points in total (Figure 1c). The land use data were derived from the land use dataset with a resolution of 10 m in 2017 (https://www.resdc.cn/, accessed on 1 March 2021) [29]. The digital elevation model (DEM) was obtained from the geospatial data cloud platform (http://www.gscloud.cn/, accessed on 1 March 2021).

3.2. Data Processing

Water samples were collected three times in September 2017 from each of the water quality monitoring stations in the upper reaches of the Si River basin. A total of 24 water samples were collected. The monitoring stations were evenly distributed within the basin to ensure a comprehensive characterization of the watershed features. Based on the previous research results [30,31], six water quality indicators were selected for surface water quality analysis in this study. The two basic water quality indicators were pH and dissolved oxygen (DO). Where pH is dimensionless and DO is in mg/L. The four hadrochemical indicators were nitrate nitrogen (NO3-N), ammonia nitrogen (NH4+-N), permanganate index (CODMn), and biochemical oxygen demand (BOD5). The units for all four indicators are mg/L.
The land use types were integrated in the original data to obtain the landscape types required for the research, which were arable land, forest, grassland, water area, construction land and unused land (Figure 2a). Based on the DEM (30 m spatial resolution) data, the terrain slope was calculated by using the surface analysis module of ArcGIS10.2 software. With reference to the definition of slope farmland and the critical value of sloped erosion, the topographic gradient was divided into flat ground (<6°), gentle slopes (6–25°) and steep slopes (≥25°) [32]. The analysis showed that the study area only contained flat ground and steep slopes, and the distribution of steep slopes was dominant, accounting for 98.49% of the total area (Figure 2b).

3.3. Analysis Methods

3.3.1. Creation of Spatial Scale

Combined with previous studies, this paper selected three spatial scales to study the impact of landscape characteristics on RWQ, including the river reach zone, riparian zone and sub-catchment. First, based on DEM elevation data, the hydrological analysis module in ArcGIS10.2 software was used to extract the sub-catchment with monitoring sites as water outlets. A total of eight sub-basins were extracted in this paper, and the code of the sub-catchment was the same as the code of the water quality monitoring station. Secondly, the river was intercepted by taking the sub-catchment as the boundary, and we extended 300 m to the left and right of the banks of the river to form a 600 m riparian zone. Finally, taking the water quality monitoring station as the benchmark, a 2000 m-diameter river reach buffer zone was formed upstream (Figure 2a,b) [17,33,34].

3.3.2. Selection of Landscape Indices

In terms of landscape composition, based on the mask tool of ArcGIS10.2 software, the area proportions of general land, flat ground and steep slopes in the above three spatial scales were calculated. The general land included flat ground, gentle slope and steep slope.
In addition to the references, researchers have also started to adopt landscape indices to analyze the impact of the landscape configuration on RWQ [8,35,36]. Through the analysis of these indices, the complex and unclear spatial landscape features can be quantified in order to effectively identify them. In conclusion, the selection of landscape indices needs to meet three criteria: (1) the feasibility of reflecting the characteristics of landscape configuration in the study area; (2) with ecological significance; and (3) comparable to previous landscape ecological studies [37,38,39]. Based on these criteria, 12 landscape indices were selected by using FRAGSTATS V 4.2, which indicated heterogeneity, fragmentation level, landscape diversity, and shape information for the upper reach of the Si Rive basin. The calculating formula and ecological significance of selecting landscape indices are shown in Table 1. Number of patches (NP), patch density (PD) and edge density (ED) were used to demonstrate information about landscape fragmentation. The largest patch Index (LPI) was used to quantify the abundance of dominant species. The landscape shape index (LSI) was used to measure the complexity of landscape shape. Shannon’s diversity index (SHDI) and Shannon’s evenness index (SHEI) reflects the heterogeneity and evenness of the landscape. The aggregation index (AI), patch cohesion index (COHESION) and Contagion (CONTAG) were employed to display the connectivity and aggregation of the landscape [28,37,40,41,42,43]. The landscape metric Boltzmann entropy was used to discuss landscape stability in terms of landscape structure [44,45].

3.3.3. Statistical Analysis

(1)
Pearson correlation analysis
In this paper, Pearson correlation analysis was conducted with the help of SPSS software. As an effective method for exploring “one-to-one” relationships, Pearson correlation analysis allows a bivariate analysis of landscape character indices and water quality indicators to be conducted. The correlation between landscape area or landscape indices and water quality indicators in the study area can easily be explored. After verification of the normal distribution of the samples using the K–S test, it was found that P > 0.05, which is consistent with the normal distribution characteristics [46]. The specific formula was.
P = i = 1 n ( x i x ¯ ) ( y i y ¯ ) i = 1 n ( x i x ¯ ) 2 i = 1 n ( y i y ¯ ) 2
In the above equation, x i is the value of water quality indicators; y i is the proportion of a landscape type area (or landscape index value); p is the correlation coefficient between water quality indicators and the proportion of a landscape type area (landscape index) between −1 and 1. When 0 < P < 1, the correlation is positive; when −1 < P < 0, the correlation is negative; when P = 0, there is no correlation between the two. A larger absolute value of the correlation coefficient indicates that the correlation between water quality indicators and the landscape type or landscape index is stronger.
(2)
Redundancy Analysis (RDA)
In order to better visualize the impact of landscape features on RWQ, RDA of landscape types and landscape indices at each scale with RWQ was carried out with the software Canoco 5.0. RDA is a method of analysis that statistically interprets the ranking of one set of variables in relation to another set of multiple variables. The method originated in ecology and was used to reveal the relationship between species and environmental variables. It was later applied to geography in the areas of land use cover and water quality [47]. This method reveals the contribution of landscape types or landscape indices to river water quality, but also visualizes the relationship between environmental variables and water quality in a two-dimensional ordination diagram [33]. A descending trend correspondence analysis (DCA) of the water quality data is required prior to the ranking analysis. If the Lengths of gradient on the first axis is greater than 4, then CCA analysis is chosen; if it is between 3 and 4, then both models are possible; if it is less than 3, RDA is more effective [28,48]. It was found that the lengths of gradient on the first axis was 0.459 (<3.0), so RDA was selected. In the ranking diagram, the vectors of species and environmental indicators are indicated by arrows, respectively. The cosine of the angle between the two arrows represents the correlation between them. If the cosine value is >0, there is a positive correlation, and otherwise there is a negative correlation. The length of the arrow represents the proportion of the impact factor. The longer the arrow, the higher the degree of influence.

4. Results

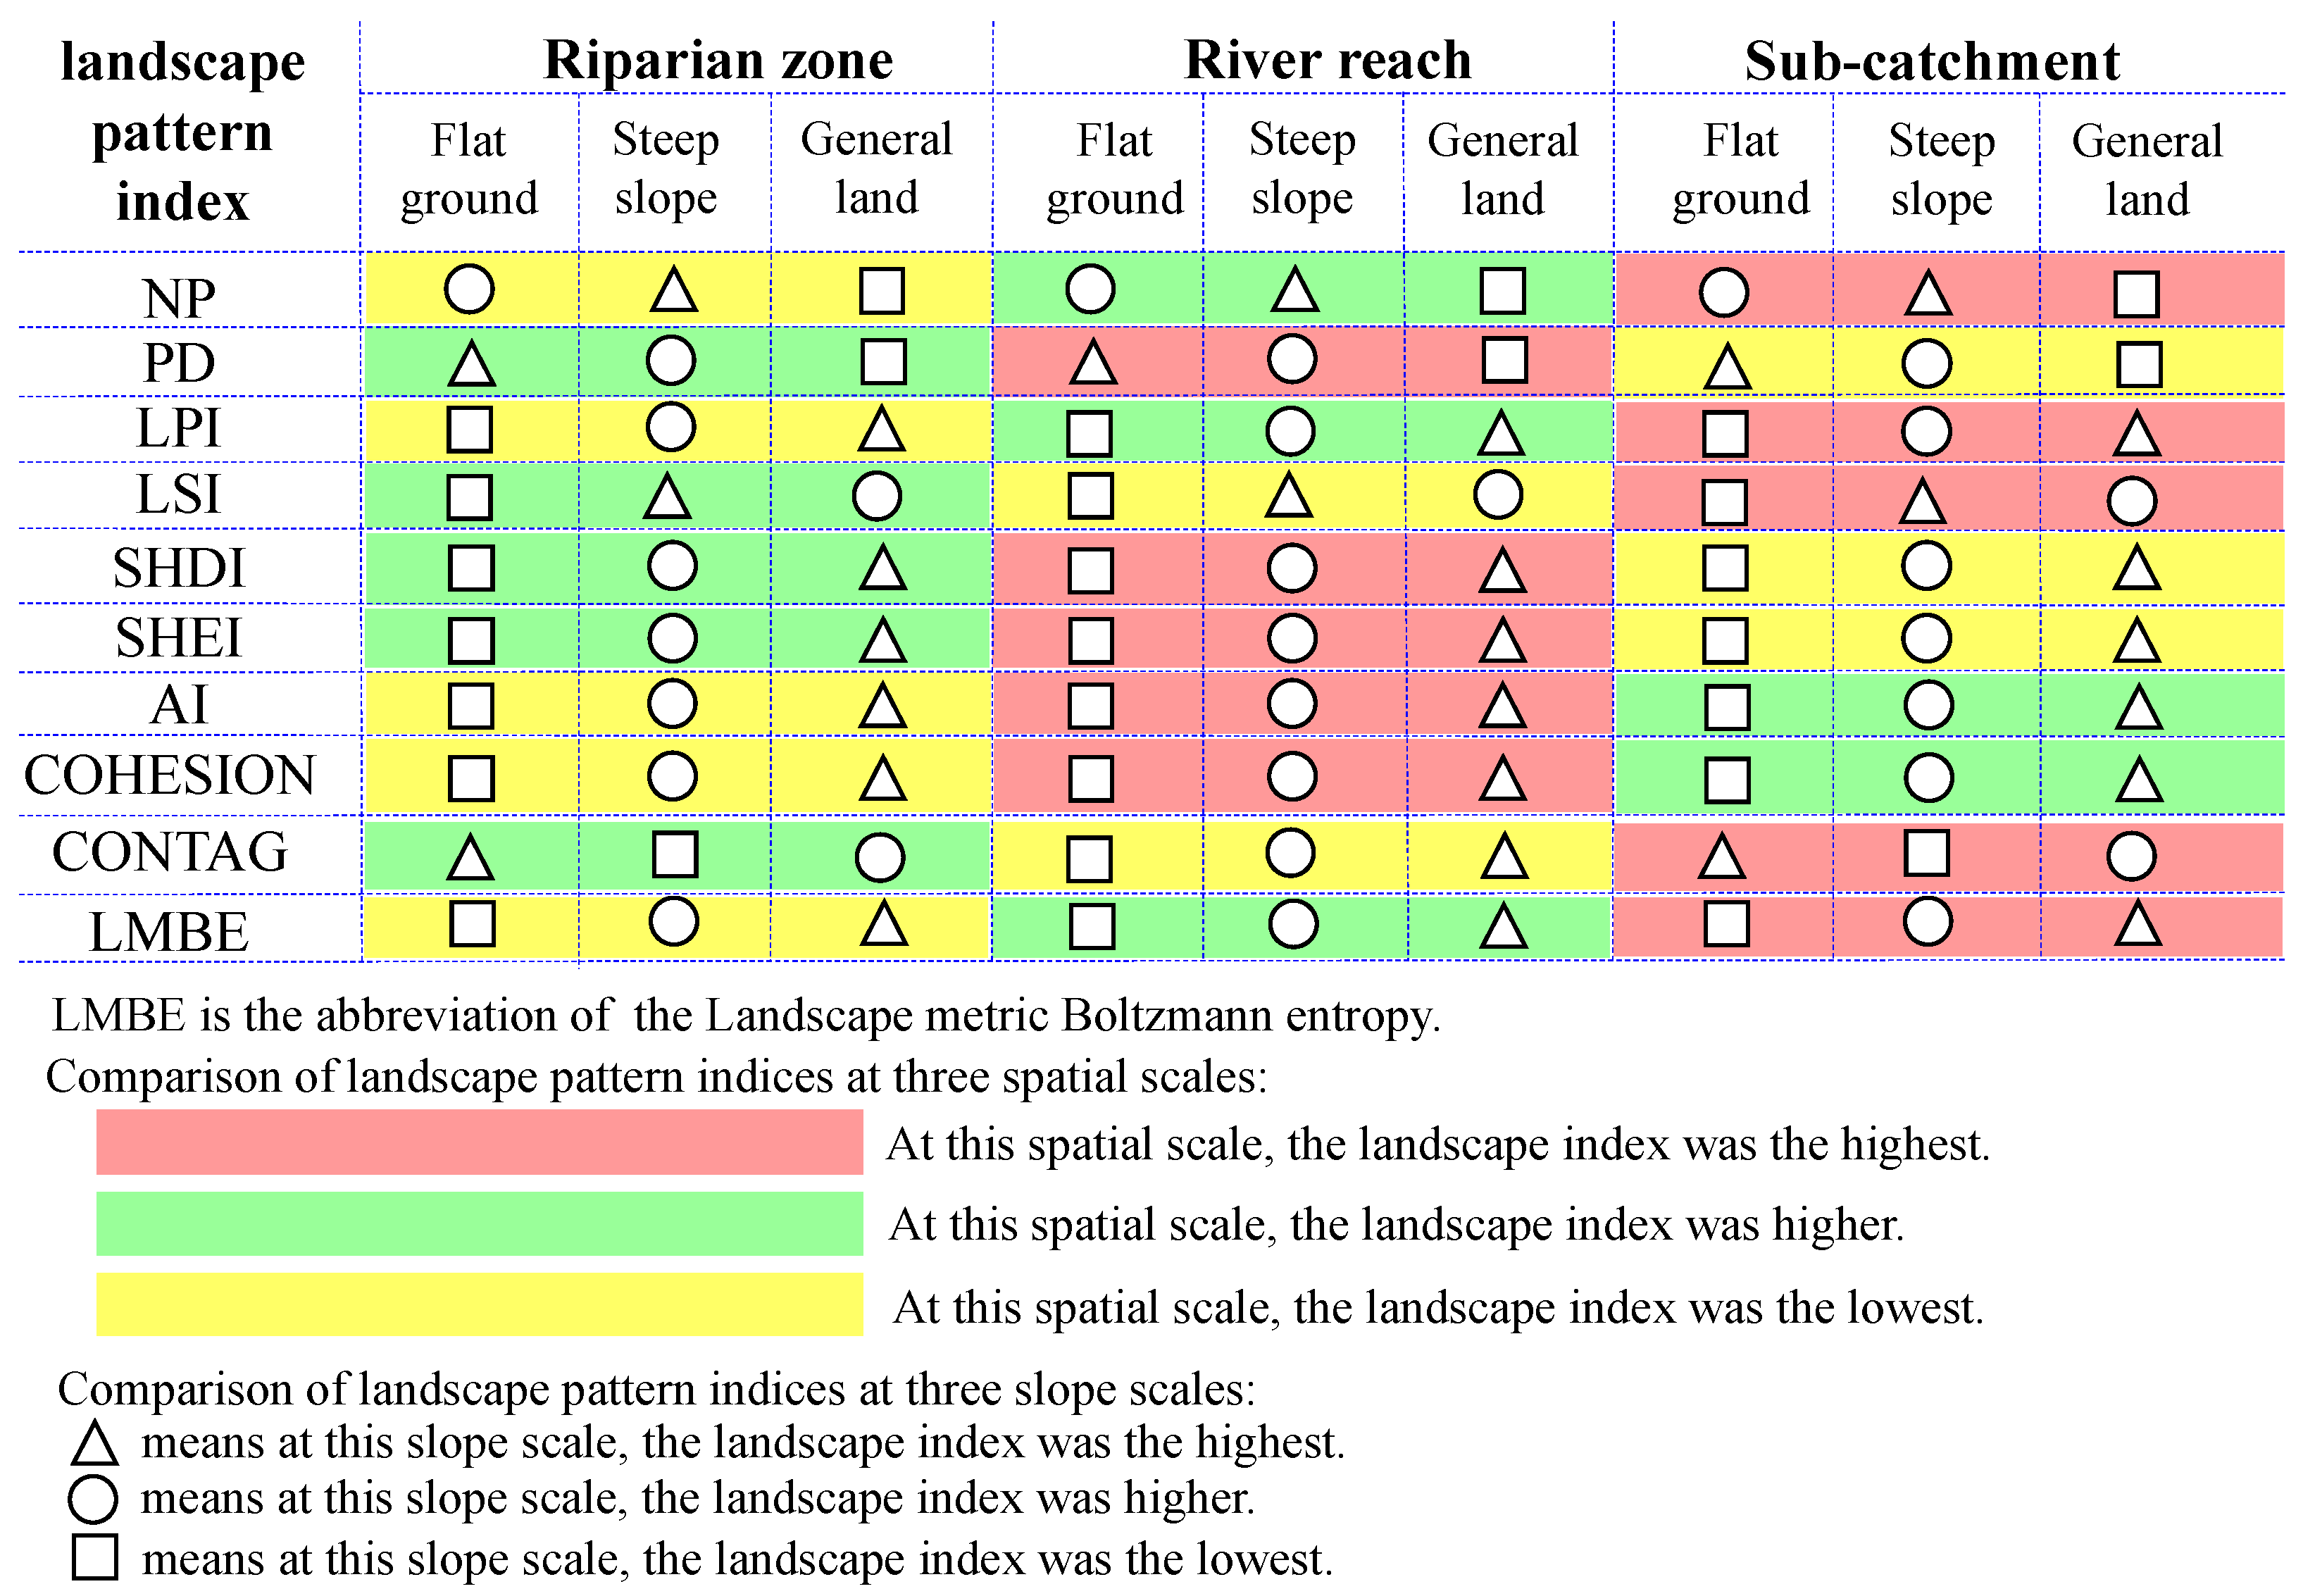
4.1. Characteristics of Landscape Characteristics at Different Scales

This study found that the main landscape types in the upper reaches of the Si River Basin in 2017 were arable land (accounting for more than 80%) and construction land (accounting for more than 10%), regardless of the spatial scales or slope scales. Because of the dominance of steeply sloped land in the study area, the landscape types of steeply sloped land were consistent with general land. At the scale of the riparian zone and river reach, most of steeply sloped land was arable land, construction land and grassland. At the sub-catchment scale, most of the steeply sloped land was arable land, construction land, and forest. The forest landscape in the study area was mainly distributed in the steeply sloped land. Regarding flat ground, it was only distributed in the sub-catchments (1 and 8) dominated by mountainous areas. In addition, the distribution of flat landscape types was more prevalent around artificial land features (Figure 3).
Landscape indices were significantly different in different spatial and slope scales (Figure 4). In general, the landscape indices were higher at the river reach and sub-catchment scales than in the riparian zone; the latter were higher in general land and steeply sloped land than in flat land. In particular, the diversity and evenness indices SHDI and SHEI, the connectivity and aggregation indices COHESION and AI, as well as the indices LMBE, which reflected landscape stability, were higher in these areas. Additionally, it is indicated that the landscape diversity and heterogeneity of general land and steeply sloped land were higher at river reach and sub-catchment scales, and the connectivity and aggregation were better. The landscape stability in terms of landscape structure was high at river reach and sub-catchment scales.

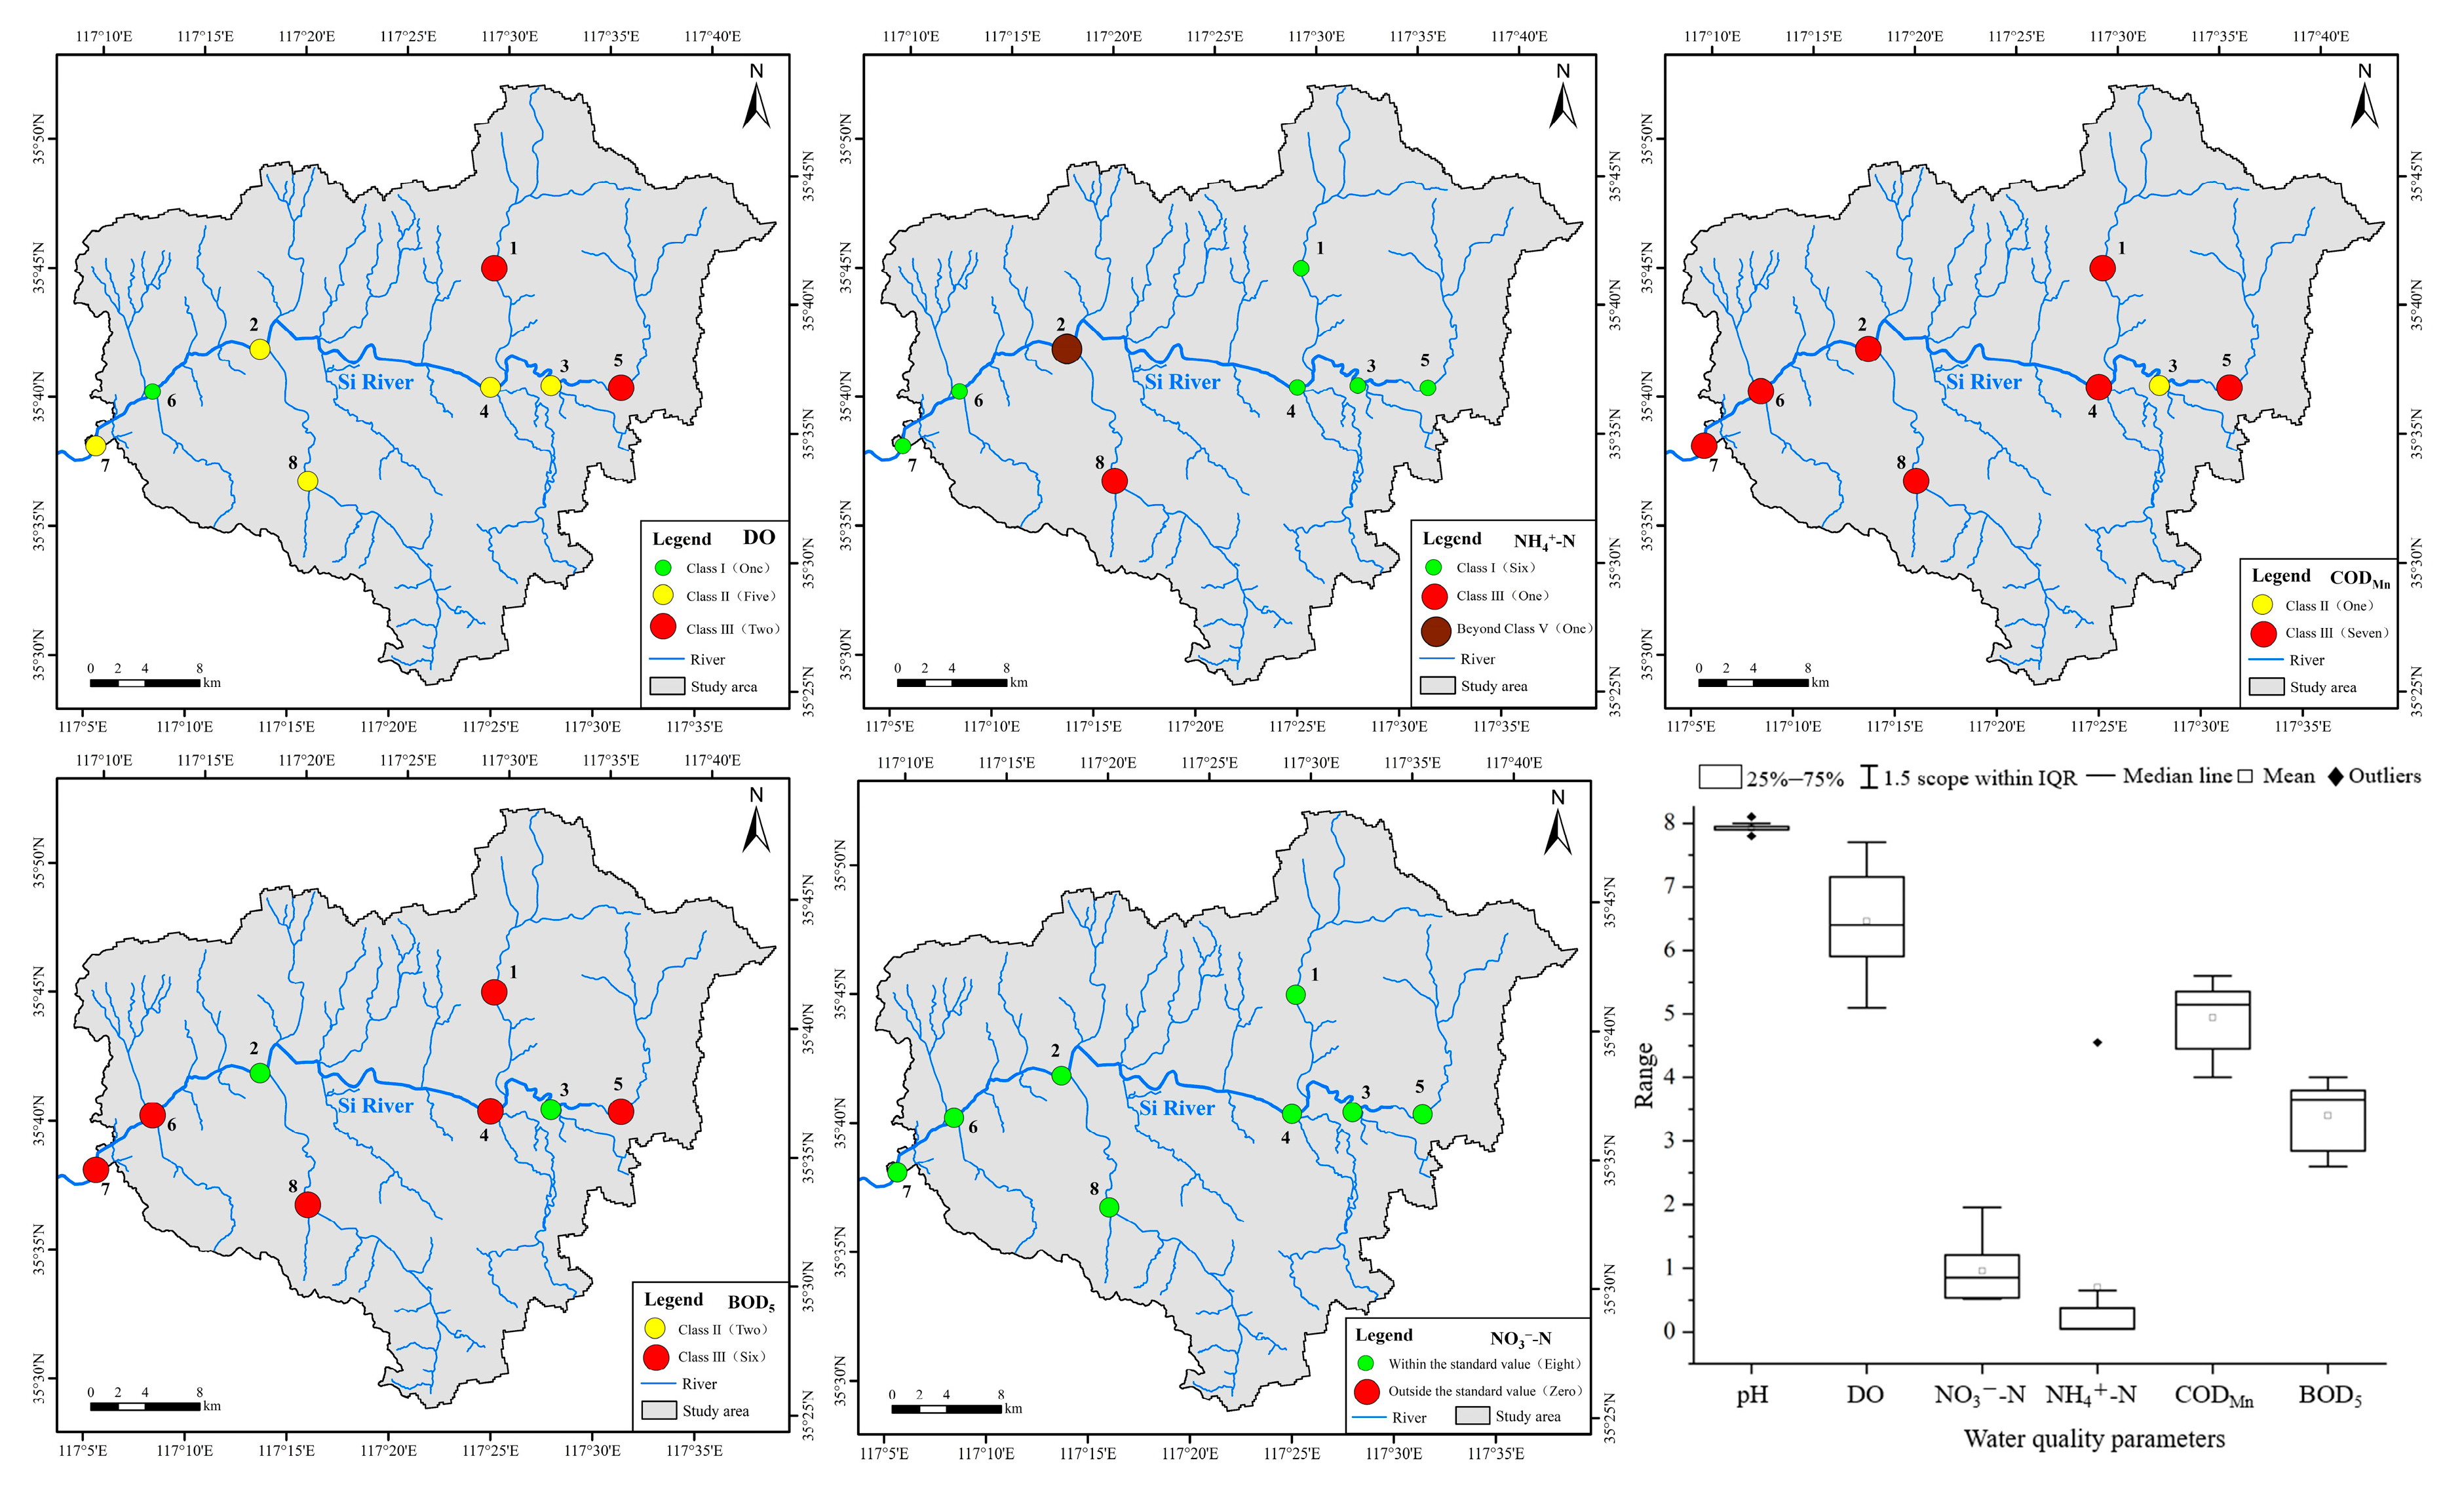
4.2. Temporal and Spatial Characteristics of RWQ

Water quality parameters were evaluated with reference to “Surface Water Environmental Quality Standard GB 3838-2002” (Figure 5). The study found that the pH value of the upper reaches of the Si River was 7.76–8.1 in September, and the overall water quality was weakly alkaline. The fluctuation range of DO content was 4.74–8.18 mg/L. This indicator met the Class III surface water quality standard at upstream monitoring points 1 and 5. Downstream monitoring point 6 reached the Class I standard. The others all reached the standard of Class II. The value of NH4+-N was 0.07–0.23 mg/L. The indicator at monitoring point 2 exceeded the Class V standard. Monitoring point 8 reached the Class III standard, and others reached the Class II standard. The concentration of CODMn was 3.74–6.14 mg/L. This indicator at other monitoring points reached the Class III standard, except that at monitoring point 3, which reached the Class II standard. The value of BOD5 was 2.28–4.54 mg/L. The indicator at both monitoring point 2 and 3 met the Class II standard, and that at the other monitoring points reached the Class III standard. The concentration range of NO3-N was 0.34–1.58 mg/L. The water quality at each sampling point was within the standard limit. To sum up, the RWQ in the study area reached the Class II-III standard generally.

4.3. The Correlation between Landscape Characteristics and RWQ

4.3.1. Correlation between Landscape Types and RWQ

It was found that the landscape types closely related to the RWQ included arable land, construction land, forest, grassland, and water area. The water quality parameters with a high correlation were DO, NO3-N, NH4+-N, and BOD5 (Table 2). In the flat ground of the riparian zone, the water area was significantly positively correlated with DO, and the forest was significantly negatively correlated with NO3-N. Additionally, in steeply sloped land and general land, there was a negative correlation between grassland and NO3-N. There was also a significant positive correlation between construction land and NH4+-N. The flat ground in the river reach zone was only arable land, which was significantly positively correlated with NH4+-N and BOD5. Additionally, in steeply sloped land and general land, the arable land was significantly positively correlated with NO3-N and NH4+-N, while the forest landscape was significantly negatively correlated with NO3-N. There was a significant negative correlation between water area and NH4+-N, and a significant positive correlation between grassland and NO3-N in the flat ground of the sub-catchment. Additionally, in steeply sloped land and general land, arable land was negatively correlated with NO3-N, but significantly positively correlated with CODMn. Construction land was significantly positively correlated with DO.

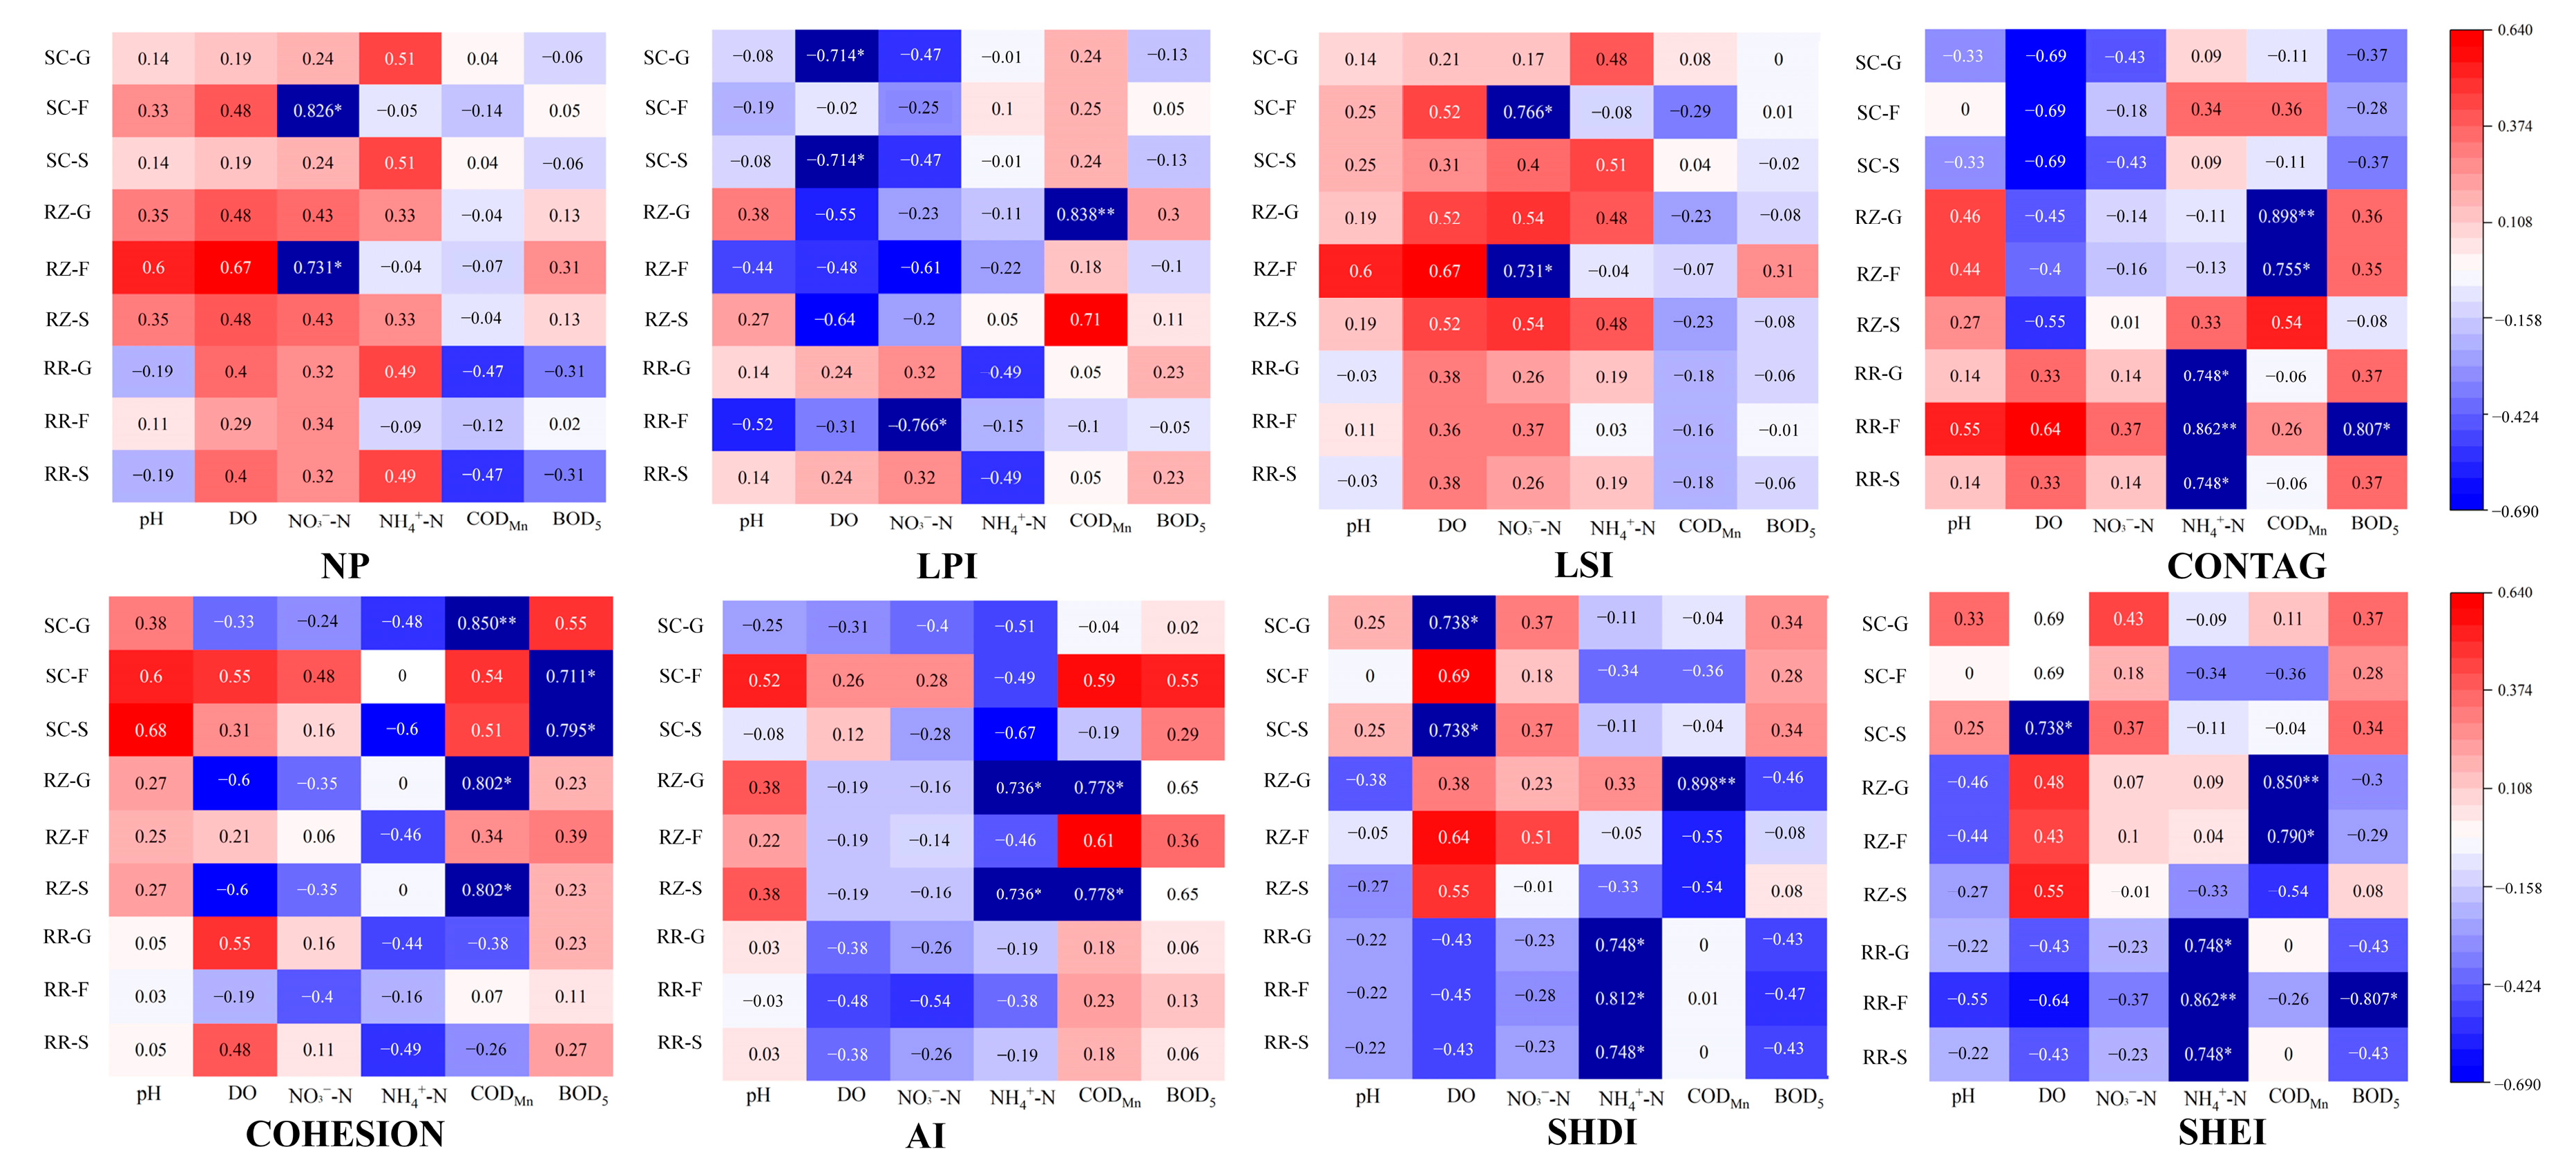
4.3.2. Correlation between Landscape Indices and RWQ

This study found that there were obvious differences in the correlation between the landscape index and the water quality index at different scales (Figure 6). The landscape indices NP and LSI were significantly positively correlated with NO3-N in the flat land of the riparian zone. Additionally, the landscape indices COHESION, AI, CONTAG, SHEI, and SHDI were significantly positively correlated with CODMn in steeply sloped land and general land. There was a significant negative correlation between the LPI and NO3-N in the flat ground of the river reach. Additionally, the landscape indices CONTAG, SHDI, and SHEI were significantly positively correlated with NH4+-N in the three slope scales. The correlation between the landscape indices NP, LSI and NO3-N in flat ground was similar to that in the riparian zone. Additionally, LPI and DO were significantly negatively correlated in steeply sloped and general land, while SHEI and SHDI were positively correlated. The index COHESION was positively correlated with CODMn and BOD5 in the three slope scales.

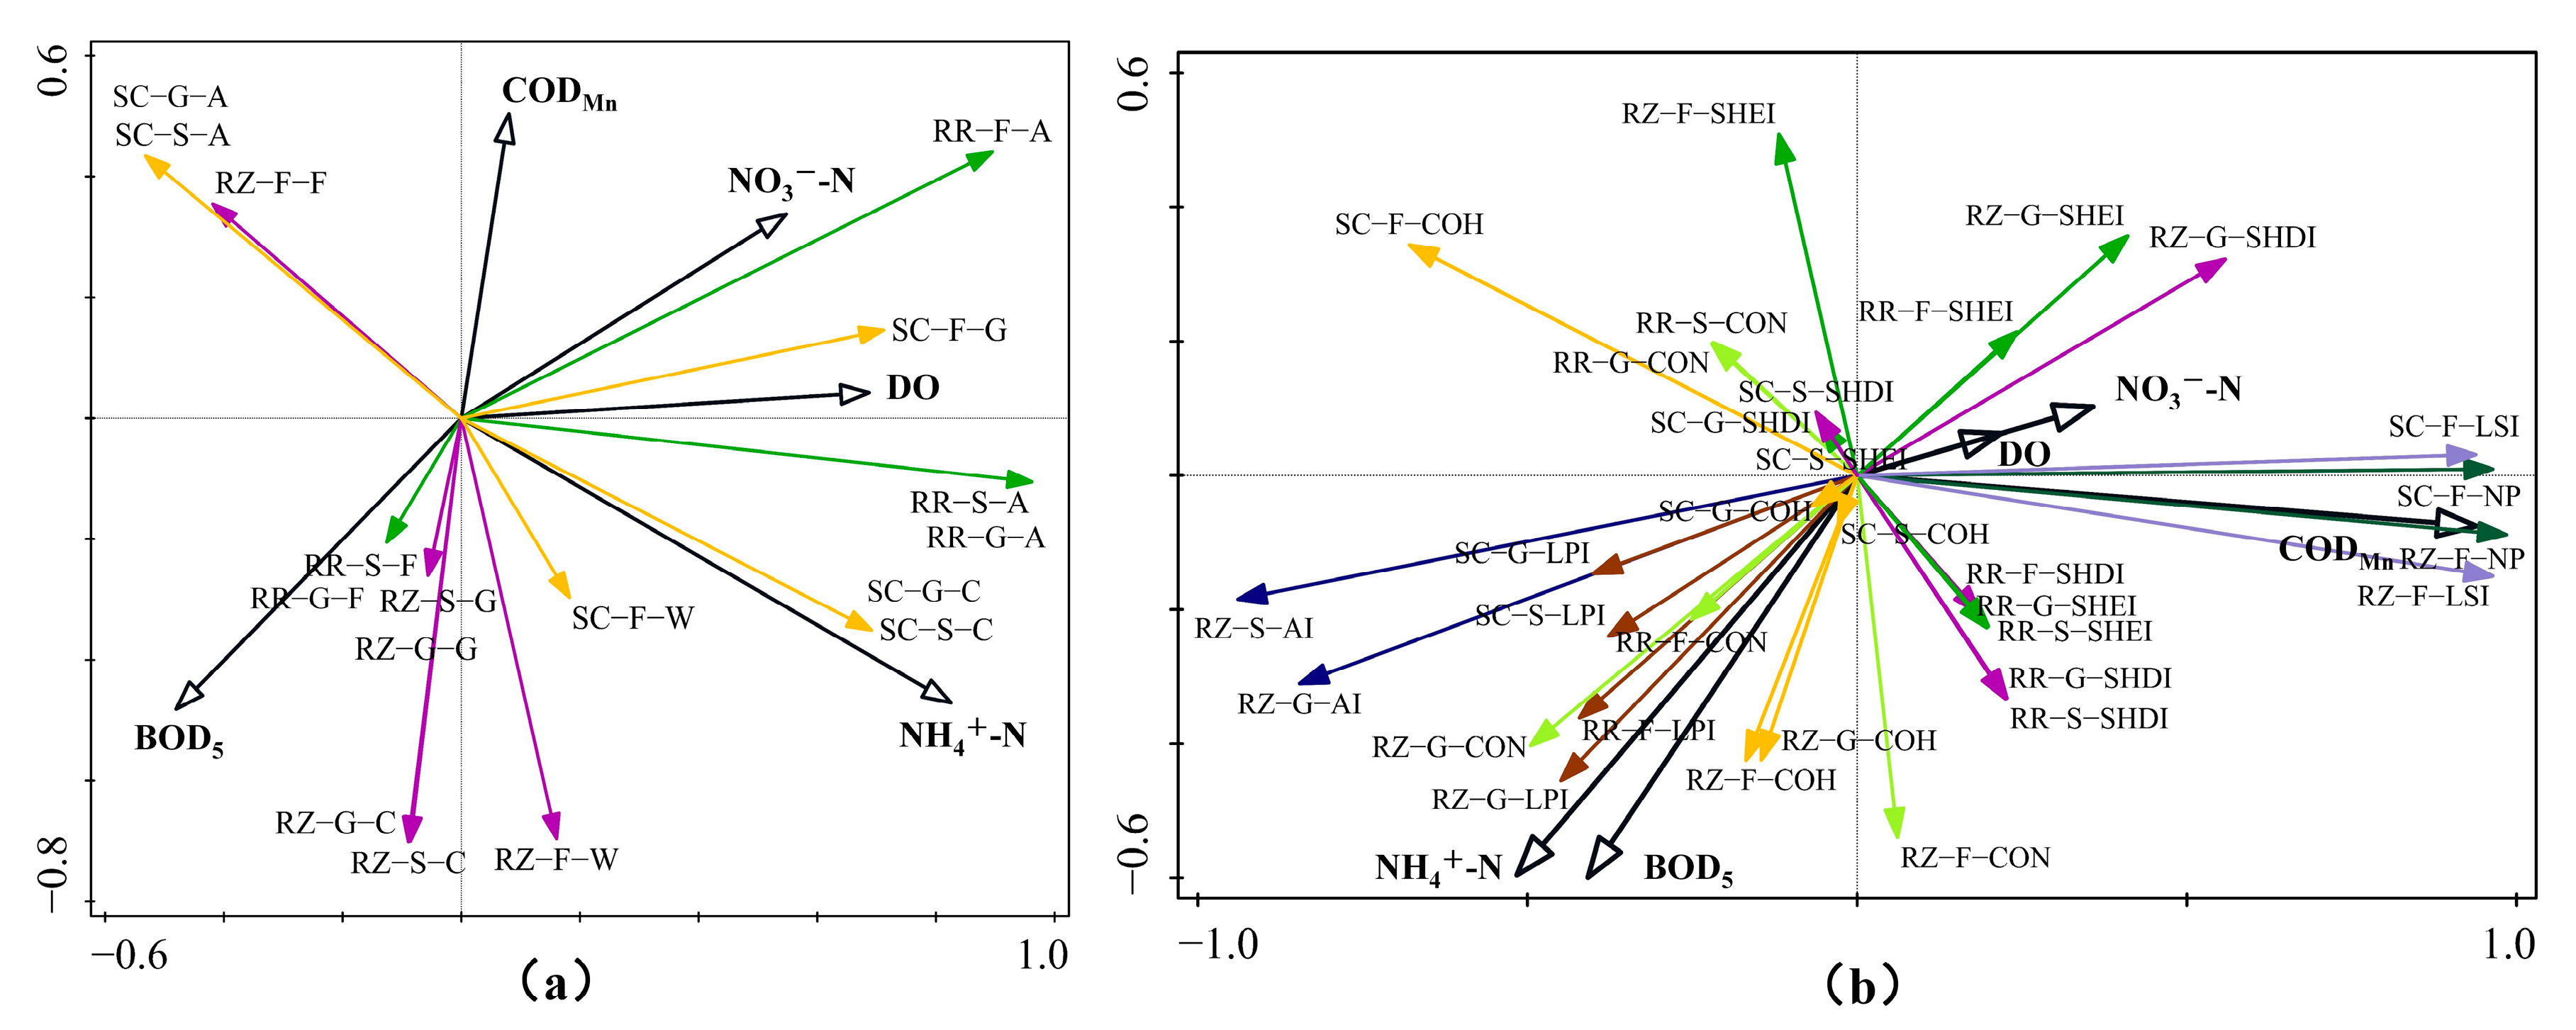
4.3.3. RDA of Landscape Characteristics and Water Quality Indicators

Figure 7 shows the ranking results of the RDA of landscape characteristics and RWQ at different scales. The interpretation rates of landscape type and landscape index on water quality indicators were both greater than 81.4%, which showed that landscape characteristics had a great impact on RWQ. The positive effect of river reach–flat ground–arable land on NH4+-N was less than that of steep slope–arable land (Figure 7a). The most negative influence on NO3-N was that of riparian zone–flat ground–forest, followed by river reach–steep slope–forest. Sub-catchment–construction land had the highest impact on NH4+-N, followed by river reach–arable land. There was no significant difference in the influence of the flat ground landscape indices NP and LSI on NO3-N, which showed that the effect of the riparian zone was higher than that of the sub-catchment (Figure 7b). According to the influence degree of the landscape indices LPI on DO and NO3-N, the effect of the sub-catchment was higher than that of the riparian zone, and the effect of general land was higher than that of steeply sloped land. The influence degree of CONTAG, COHESION and AI on NH4+-N was higher than that of other landscape indices. The riparian zone was more influential than the river reach, while the influence of the river reach was higher than that of the sub-catchment. The effect of steeply sloped land was higher than that of the flat land. The influence degrees of SHDI and SHEI on RWQ in the river reach and riparian zone were significantly higher than that in the sub-catchment.
SC–S–A means sub–catchment–steep slope–arable land, SC–G–A means sub–catchment–general land–arable land, SC–S–C means sub-catchment–steep slope–construction land, SC–G–C means sub-catchment–general land–construction land, SC–F–G means sub-catchment–flat ground–grassland, SC–F–W means sub-catchment–flat ground–water area. RR–F–A means river reach–flat ground–arable land, RR–S–A means river reach–steep slope–arable land, RR–G–A means river reach–general land–arable land, RR–S–F means river reach–steep slope–forest, RR–G–F means river reach–general land–forest, RZ–F–F means riparian zone–flat ground–forest, RZ–S–C means riparian zone–steep slope–construction land, RZ–G–C means riparian zone–general–construction land, RZ–F–W means riparian zone–flat ground–water area, RZ–S–G means riparian zone–steep slope–grassland, RZ–G–G means riparian zone–general land–grassland. SC–S– means sub–catchment–steep slope–, SC–G– means sub-catchment–general land–, SC–F– means sub-catchment–flat ground–. RR–S– means river reach–steep slope–, RR–G– means river reach–general land–, RR–F– means river reach–flat ground–. RZ–S– means riparian zone–steep slope–, RZ–G– means riparian zone–general land–, RZ–F– means riparian zone–flat ground.

5. Discussion

5.1. Effects of Landscape Types on RWQ

This study found that arable land and construction land were significantly positively correlated with the water quality parameters NO3-N, NH4+-N and CODMn, which also had a great influence on them. Arable land and construction land were the main landscape types that caused river water pollution and can therefore be referred to as “source” landscapes [49]. The tillage method applied on arable land was found to potentially cause severe soil erosion activity. The use of excessive pesticides and fertilizers caused pollutants to enter river water through surface runoff, interflow and other routes, resulting in water quality deterioration [50,51]. The domestic and industrial wastewater discharged from the construction land caused the concentration of pollutants in the water body to increase. The ground in urban ecosystems was mostly impervious, which led to pollutants directly flowing into water through runoff without being filtered through forest, grassland or soil [52]. The forest had an inhibitory effect on the water quality parameter NO3-N. This meant that the forest played a positive role in alleviating the deterioration of water quality and can therefore be referred to as a “sink” landscape [53,54]. Grassland in the sub-catchment was positively correlated with water quality indicators, which was contrary to the view that grassland could reduce the pollutant content in the runoff. The main reason for this was that the grassland area in the study area was very small and the role of other landscape types was dominant [55,56,57].

5.2. Effects of Landscape Indices on RWQ

The landscape indices NP and LSI were usually used to characterize landscape fragmentation and complexity. In this study, these two indices were significantly positively correlated with the water quality index NO3-N. This meant that human activities in the study area were strong and landscape patches were highly fragmented. Severe fragmentation will aggravate water pollution in the study area [58,59,60]. Relevant studies found that the impact of LPI on RWQ depended on the dominant landscape in the region, and the dominant landscape in the study area was arable land [61]. The landscape indices CONTAG, AI and COHESION were found to be positively correlated with NH4+-N and CODMn in this paper. These three indicators characterized the aggregation and connectivity of patches in the region, which in turn reflected the ability of material to spread between patches. Previous studies have disputed the impact of the degree of patch aggregation on RWQ [62,63], but Hu et al. provided an explanation. When the “source” landscape (arable land or construction land) is arranged in a standardized way, the higher the concentration degree, the easier the generated pollutants will be concentrated for production and discharge, which will aggravate water pollution. However, the more standardized the arrangement of the “sink” landscape (forest) is, the stronger the purification capacity of pollutants carried by surface runoff is [64]. Arable land was dominant in the study area, especially in the riparian zone and sub-catchment scale. Large-scale arable land caused the concentration and diffusion of pollutants, which led to the positive impact of these three indicators on pollutants. The SHDI and SHEI indicators characterized the diversity and heterogeneity of the landscape, which contributed to the water pollution in this study. With the increase in landscape diversity, as the confluence pass through more land types, the probability of passing through the “source” landscape increases, thus increasing the probability of pollutants entering the river [65].

5.3. Scale Response of Landscape Characteristics to RWQ

The results of this study show that the landscape characteristics of the riparian zone had a greater impact on RWQ than those of the river reach and sub-catchment. Some studies argued that due to the large area of the sub-catchment, pollutants are absorbed through soil storage, vegetation interception, and other methods during the transportation process [5]. Dai et al. believed that the 200 m buffer zone in the riparian zone is the area in which the impact of the landscape type on RWQ reach its peak. There are few ways to dilute, transform and intercept pollutants such as domestic and production sewage, fertilizer and pesticides within this range, and they are often directly transported to the river [10]. Meanwhile, the forest in the riparian zone will greatly reduce the pollutants entering the river, indicating that the riparian zone shelterbelt is an effective measure to alleviate the deterioration of RWQ [66,67]. In the study area, the influence of steeply sloped arable land on RWQ was higher than that of flat arable land, which was consistent with previous studies. Sloping arable land was an important “source” landscape of non-point source pollution. Due to its slope, it will increase erosion capacity under the action of terrain, intensify water and soil loss, and cause surface pollutants to enter the river more quickly [68,69]. In terms of the impact of construction land on RWQ, the impact at the scale of the sub-catchment was higher than that of the riparian zone and river reach. The main reason for this was that the research scale of the riparian zone and river reach was limited, and it could not cover enough construction land area within this scale. The impact on RWQ can only be fully reflected in the sub-catchment [70,71].

5.4. Recommendations for Water Quality Protection Based on Landscape Characteristics

A synthesis of previous studies and this study found that in major food-producing areas where sloping arable land is the dominant landscape type, arable land and construction land are the main types of land contributing to RWQ pollution. Forest and grassland are the main types of landscape mitigating RWQ pollution. The strongest impact on RWQ at the spatial scale is in the riparian zone. Therefore, in watershed water quality protection, the following three aspects can be considered. (1) in urban areas, runoff needs to be intercepted and treated by simple natural ecosystems before discharge. (2) At the sub-catchment scale, the spatial structure of arable land and urban areas is optimized and the aggregation of forest and grassland is increased. (3) The method of returning poor-quality arable land in the riparian zone to forest and grass should be adopted, and the fragmentation of arable land should be reduced. The interception, adsorption, absorption and transformation capacity of the riparian zone for sediment and pollutants should be improved, and soil erosion and nutrient exportation should be reduced.

6. Conclusions

Taking the upper reaches of the Si River as an example, by combining the data on land use and water quality, the landscape structure and landscape indices of general land, steeply sloped land, and flat ground at the riparian zone, river reach, and sub-catchment scales were extracted. The effects of landscape characteristics at different scales on RWQ in the study area were revealed by means of correlation analysis and RDA. The main conclusions were as follows:
(1)
The landscape types were dominated by arable land and construction land in 2017. The landscape indices at different scales were significantly different. Additionally, RWQ generally met the Class II or III surface water quality standard in September of the same year.
(2)
Arable land and construction land were positively correlated with NO3-N, NH4+-N, and CODMn, meaning that both were “source” landscapes of water quality pollution. The forest was negatively correlated with water quality parameters, meaning that it is an effective “sink” landscape to alleviate the deterioration of RWQ.
(3)
The landscape index also contributed greatly to the water quality pollution of the study area. Additionally, landscape indices including NP, LSI, COHESION, CONTAG, AI, SHDI, and SHEI had different degrees of correlation with NO3-N, NH4+-N, CODMn and BOD5.
(4)
There was a spatial scale response to the impact of the landscape configuration in the basin on RWQ of the upper reaches of the Si River. The degree of correlation between landscape characteristics and water quality was the highest at the riparian scale, followed by the river reach scale, and the smallest at the sub-catchment scale. The influence of steeply sloped arable land was higher than that of flat land in the river reach. However, the influence of construction land was higher at the sub-catchment scale than that at the riparian zone and the river reach scales.
The study on the scale effect of landscape characteristics on RWQ improved our understanding of the response of natural and human factors to river hydrological processes. A scale of important landscape characteristics such as water pollution prevention and control was also provided. In addition, the influence of terrain slope was considered, providing a reference for land use planning and water quality improvement of multi-spatial-scale basins in plain areas. It is hoped that this study will provide technical support for water environment protection in mountainous and hilly areas.

Author Contributions

Conceptualization, F.L.; Methodology, F.L.; Data curation, T.Q.; Writing—original draft, F.L., H.N. and J.W.; Writing—review & editing, F.L., S.L. and T.Q.; Supervision, S.L.; Project Administration, H.W.; Funding acquisition, T.Q. All authors have read and agreed to the published version of the manuscript.

Funding

This study was supported by the National Science Fund Project (Grant No. 52130907).

Data availability statement

The raw data supporting the conclusions of this article will be made available by the authors, without undue reservation.

Conflicts of Interest

The authors declare no conflict of interest.

References

  1. Li, T.; Qiu, S.; Mao, S.X.; Bao, R.; Deng, H.B. Evaluating water resource accessibility in Southwest China. Water 2019, 11, 1708. [Google Scholar] [CrossRef]
  2. Wei, W.; Li, Z.H.; Huang, Z.Z. Study on the Evolution of Land Use and Landscape Patterns in Urban Riparian Zones. Ecol. Environ. Sci. 2018, 27, 7. (In Chinese) [Google Scholar] [CrossRef]
  3. Wang, H.L.; Chen, K.F.; Zhang, W.S.; Geng, J.W. Impact of Water Quality in Lakes and Reservoirs under Land-use Changes in Huaihe River Basin. Water Resour. Power 2020, 38, 41–45. (In Chinese) [Google Scholar] [CrossRef]
  4. Cho, K.H.; Pachepsky, Y.A.; Oliver, D.M.; Muirhead, R.W.; Park, Y.; Quilliam, R.S.; Shelton, D.R. Modeling fate and transport of fecally-derived microorganisms at the watershed scale: State of the science and future opportunities. Water Res. 2016, 100, 38–56. [Google Scholar] [CrossRef]
  5. Wu, J.H.; Lu, J. Landscape patterns regulate non-point source nutrient pollution in an agricultural watershed. Sci. Total Environ. 2019, 669, 377–388. [Google Scholar] [CrossRef] [PubMed]
  6. Li, S.H.; Peng, S.Y.; Jin, B.X.; Zhou, J.S.; Li, Y.X. Multi-scale relationship between land use/land cover types and water quality in different pollution source areas in Fuxian lake basin. PeerJ 2019, 7, e7283. [Google Scholar] [CrossRef] [PubMed]
  7. García-Martínez, M.Á.; Valenzuela-González, J.E.; Escobar-Sarria, F.; López-Barrera, F.; Castaño-Meneses, G. The surrounding landscape influences the diversity of leaf-litter ants in riparian cloud forest remnants. PLoS ONE 2017, 12, e0172464. [Google Scholar] [CrossRef] [PubMed]
  8. Xu, S.; Li, S.L.; Zhong, J.; Li, C. Spatial scale effects of the variable relationships between landscape pattern and water quality: Example from an agricultural karst river basin, Southwestern China. Agric. Ecosyst. Environ. 2020, 300, 106999. [Google Scholar] [CrossRef]
  9. Shehab, Z.N.; Jamil, N.R.; Aris, A.Z.; Shafie, N.S. Spatial variation impact of landscape patterns and land use on water quality across an urbanized watershed in Bentong, Malaysia. Ecol. Indic. 2021, 122, 107254. [Google Scholar] [CrossRef]
  10. Dai, X.Y.; Zhou, Y.Q.; Ma, W.C.; Zhou, L.G. Influence of spatial variation in land-use patterns and topography on water quality of the rivers inflowing to Fuxian Lake, a large deep lake in the plateau of southwestern China. Ecol. Eng. 2017, 99, 417–428. [Google Scholar] [CrossRef]
  11. Kändler, M.; Blechinger, K.; Seidler, C.; Pavlů, V.; Šanda, M.; Dostál, T.; Krása, J.; Vitvar, T.; Štich, M. Impact of land use on water quality in the upper Nisa catchment in the Czech Republic and in Germany. Sci. Total Environ. 2017, 586, 1316–1325. [Google Scholar] [CrossRef] [PubMed]
  12. Wang, L.Q.; Han, X.X.; Zhang, Y.Y.; Zhang, Q.; Wan, X.M.; Liang, T.; Song, H.; Bolan, N.; Shaheen, S.M.; White, J.R.; et al. Impacts of land uses on spatio-temporal variations of seasonal water quality in a regulated river basin, Huai River, China. Sci. Total Environ. 2023, 857, 159584. [Google Scholar] [CrossRef] [PubMed]
  13. Zhang, J.; Li, S.Y.; Jiang, C.S. Effects of land use on water quality in a River Basin (Daning) of the Three Gorges Reservoir Area, China: Watershed versus riparian zone. Ecol. Indic. 2020, 113, 106226. [Google Scholar] [CrossRef]
  14. Xu, Q.Y.; Wang, P.; Shu, W.; Zhang, H.; Ding, M.J. Investigation of the impacts of land use structure and spatial pattern on water quality in the Yuan River. Acta Sci. Circumstantiae 2020, 40, 2611–2620. [Google Scholar]
  15. Xu, Q.Y.; Wang, P.; Wang, T.; Shu, W.; Zhang, H.; Qi, S.H. Investigation of the impacts of land use structure and landscape pattern on water quality in the Ganjiang River, Lake Poyang Basin. J. Lake Sci. 2020, 32, 1008–1019. [Google Scholar] [CrossRef]
  16. Chen, J.X.; Lyu, Y.; Zhao, Z.F.; Liu, H.; Zhao, H.L.; Li, Z.C. Using the multidimensional synthesis methods with non-parameter test, multiple time scales analysis to assess water quality trend and its characteristics over the past 25 years in the Fuxian Lake, China. Sci. Total Environ. 2019, 655, 242–254. [Google Scholar] [CrossRef]
  17. Shi, P.; Zhang, Y.; Li, Z.B.; Li, P.; Xu, G.C. Influence of land use and land cover patterns on seasonal water quality at multi-spatial scales. Catena 2017, 151, 182–190. [Google Scholar] [CrossRef]
  18. Mello, K.D.; Valente, R.A.; Randhir, T.O.; Alves dos Santos, A.C.; Vettorazzi, C.A. Effects of land use and land cover on water quality of low-order streams in Southeastern Brazil: Watershed versus riparian zone. Catena 2018, 167, 130–138. [Google Scholar] [CrossRef]
  19. Wei, W.; Gao, Y.N.; Huang, J.C.; Gao, J.F. Exploring the effect of basin land degradation on lake and reservoir water quality in China. J. Clean. Prod. 2020, 268, 1–12. [Google Scholar] [CrossRef]
  20. Namugize, J.N.; Jewitt, G.; Graham, M. Effects of land use and land cover changes on water quality in the uMngeni river catchment, South Africa. Phys. Chys. Chem. Earth. 2018, 105, 247–264. [Google Scholar] [CrossRef]
  21. Jaja, N.; Mbila, M.; Coding, E.; Tsegaye, T.; Odutola, J. Landscape variability of riparian buffers and its impact on soil and water chemistry of an urbanized watershed. Ecol. Indic. 2022, 137, 108777. [Google Scholar] [CrossRef]
  22. Gonzales-Inca, C.A.; Kalliola, R.; Kirkkala, T.; Lepistö, A. Multiscale Landscape Pattern Affecting on Stream Water Quality in Agricultural Watershed, SW Finland. Water Resour. Manag. 2015, 29, 1669–1682. [Google Scholar] [CrossRef]
  23. Mainali, J.; Chang, H. Landscape and anthropogenic factors affecting spatial patterns of water quality trends in a large river basin, South Korea. J. Hydrol. 2018, 564, 26–40. [Google Scholar] [CrossRef]
  24. Jiao, P.; Yang, E.; Ni, Y.X. Experimental study of overland flow resistance coefficient model of grassland based on BP neural network. E3S Web Conf. 2018, 38, 1030. [Google Scholar] [CrossRef]
  25. Khoi, D.N.; Nguyen, V.; Sam, T.T.; Nhi, P.T.T. Evaluation on effects of climate and land-use changes on streamflow and water quality in the La Buong River Basin, Southern Vietnam. Sustainability 2019, 11, 7221. [Google Scholar] [CrossRef]
  26. Liu, C.; Wang, Z.Y.; Zhang, J.H.; Chen, Q.W.; Du, Y.B.; Chen, C.; Huang, Y.; Chen, T.Y. Effects of landscape types and landscape pattern evolution on water quality of Hongze Lake. Acta Sci. Circumstantiae 2021, 41, 3302–3311. [Google Scholar]
  27. Mwaijengo, G.N.; Msigwa, A.; Njau, K.N.; Brendonck, L.; Vanschoenwinkel, B. Where does land use matter most? Contrasting land use effects on river quality at different spatial scales. Sci. Total Environ. 2020, 715, 134825. [Google Scholar] [CrossRef] [PubMed]
  28. Zhang, L.L.; Liu, R.; Zhang, J.; Xiao, Z.L.; Ji, Q. The influence of sloping landscape features on riverine water quality in upper Yangtze River. Acta Ecol. Sin. 2022, 42, 6704–6717. [Google Scholar] [CrossRef]
  29. Li, K.; Zhang, B.; Xiao, W.; Lu, Y. Land Use Transformation Based on Production−Living−Ecological Space and Associated Eco-Environment Effects: A Case Study in the Yangtze River Delta Urban Agglomeration. Land 2022, 11, 1076. [Google Scholar] [CrossRef]
  30. Dymek, D.; Zgłobicki, W.; Baran-Zgłobicka, B. The Impact of Mosaic Land Use and Land Cover on the Quality of River Waters (Case Study: Lubelskie Province, E Poland). Land 2021, 10, 1318. [Google Scholar] [CrossRef]
  31. Liu, J.; Cheng, F.; Zhu, Y.; Zhang, Q.; Song, Q.; Cui, X. Urban Land-Use Type Influences Summertime Water Quality in Small- and Medium-Sized Urban Rivers: A Case Study in Shanghai, China. Land 2022, 11, 511. [Google Scholar] [CrossRef]
  32. Cai, H.; Liu, G.M.; Kang, W.H. The effects of sloping landscape features on water quality in the upper and middle reaches of the Chishui River Watershed. Geogr. Res.-Aust. 2018, 37, 704–716. [Google Scholar] [CrossRef]
  33. Gu, Q.; Hu, H.; Ma, L.G.; Sheng, L.; Yang, S.; Zhang, X.B.; Zhang, M.U.; Zheng, K.F.; Chen, L.S. Characterizing the spatial variations of the relationship between land use and surface water quality using self-organizing map approach. Ecol. Indic. 2019, 102, 633–643. [Google Scholar] [CrossRef]
  34. Wu, J.H.; Lu, J. Spatial scale effects of landscape metrics on stream water quality and their seasonal changes. Water Res. 2021, 191, 116811. [Google Scholar] [CrossRef] [PubMed]
  35. Zhang, Q.; Chen, C.L.; Wang, J.Z.; Yang, D.Y.; Zhang, Y.; Wang, Z.F.; Gao, M. The spatial granularity effect, changing landscape patterns, and suitable landscape metrics in the Three Gorges Reservoir Area, 1995–2015. Ecol. Indic. 2020, 114, 106259. [Google Scholar] [CrossRef]
  36. Wang, L.T.; Wang, S.X.; Zhou, Y.; Zhu, J.F.; Zhang, J.Z.; Hou, Y.F.; Liu, W.L. Landscape pattern variation, protection measures, and land use/land cover changes in drinking water source protection areas: A case study in Danjiangkou Reservoir, China. Glob. Ecol. Conserv. 2020, 21, e00827. [Google Scholar] [CrossRef]
  37. Zhang, Y.Q.; Liu, S.L.; Hou, X.Y.; Cheng, F.Y.; Shen, Z.Y. Landscape- and climate change-induced hydrological alterations in the typically urbanized Beiyun River basin, Beijing, China. Stoch. Environ. Res. Risk Assess. 2019, 33, 149–168. [Google Scholar] [CrossRef]
  38. Su, S.; Xiao, R.; Jiang, Z.; Zhang, Y. Characterizing landscape pattern and ecosystem service value changes for urbanization impacts at an eco-regional scale. Appl. Geogr. 2012, 34, 295–305. [Google Scholar] [CrossRef]
  39. Su, S.; Ma, X.; Xiao, R. Agricultural landscape pattern changes in response to urbanization at ecoregional scale. Ecol. Indic. 2014, 40, 10–18. [Google Scholar] [CrossRef]
  40. Liu, S.L.; Yin, X.H.; Cheng, F.Y.; Yang, J.J.; Li, J.R.; Dong, S.K.; Zhu, A. Ecosystem Services and landscape change associated with plantation expansion in a tropical rainforest region of Southwest China. Ecol. Model. 2017, 353, 129–238. [Google Scholar] [CrossRef]
  41. Clément, F.; Ruiz, J.; Rodríguez, M.A.; Blais, D.; Campeau, S. Landscape diversity and forest edge density regulate stream water quality in agricultural catchments. Ecol. Indic. 2017, 72, 627–639. [Google Scholar] [CrossRef]
  42. Liu, H.Y.; Meng, C.; Wang, Y.; Li, Y.; Li, Y.Y.; Liu, X.L.; Wu, J.S. Establishing the relationship between the integrated multidimensional landscape pattern and stream water quality in subtropical agricultural catchments. Ecol. Indic. 2021, 127, 107781. [Google Scholar] [CrossRef]
  43. Hu, L.; Li, S.R. Scale Effects of Land Use Structure and Landscape Pattern on Water Quality in the Longchuan River Basin. Ecol. Environ. Sci. 2021, 030, 1470–1481. [Google Scholar]
  44. Gao, P.C.; Zhang, H.; Li, Z.L. An efficient analytical method for computing the Boltzmann entropy of a landscape gradient. Trans. GIS 2018, 22, 1046–1063. [Google Scholar] [CrossRef]
  45. Gao, P.C.; Li, Z.L. Aggregation-based method for computing absolute Boltzmann entropy of landscape gradient with full thermodynamic consistency. Landsc. Ecol. 2019, 34, 1837–1847. [Google Scholar] [CrossRef]
  46. Cho, E.; Choi, M. Regional scale spatio-temporal variability of soil moisture and its relationship with meteorological factors over the Korean peninsula. J. Hydrol. 2014, 516, 317–329. [Google Scholar] [CrossRef]
  47. Cheng, B.F.; Zhang, Y.; Xia, R.; Zhang, N.; Zhang, X.F. Temporal and Spatial Variations in Water Quality of Hanjiang River and Its Influencing Factors in Recent Years. Environ. Sci. 2021, 42, 4211–4221. [Google Scholar] [CrossRef]
  48. Yang, M.; Wei, S.; Mwangi, B.N.; Liu, S.; Huang, J.; Li, Y. Horizontal Distribution Characteristics and Environmental Factors of Shrubland Species Diversity in Hainan Island, China. Land 2022, 11, 1047. [Google Scholar] [CrossRef]
  49. Karmakar, S.; Haque, S.M.S.; Hossain, M.M.; Sen, M.; Hoque, M.E. Water quality parameter as a predictor of small watershed land cover. Ecol. Indic. 2019, 106, 105462. [Google Scholar] [CrossRef]
  50. Ramião, J.P.; Cássio, F.; Pascoal, C. Riparian land use and stream habitat regulate water quality. Limnologica 2020, 82, 125762. [Google Scholar] [CrossRef]
  51. Zhang, J.; Li, S.Y.; Dong, R.Z.; Jiang, C.S.; Ni, M.F. Influences of land use metrics at multi-spatial scales on seasonal water quality: A case study of river systems in the Three Gorges Reservoir Area, China. J. Clean. Prod. 2019, 206, 76–85. [Google Scholar] [CrossRef]
  52. Shi, B.Q.; Bach, P.M.; Lintern, A.; Zhang, K.F.; Coleman, R.A.; Metzeling, L.; McCarthy, D.T.; Deletić, A.B. Understanding spatiotemporal variability of in-stream water quality in urban environments: A case study of Melbourne, Australia. J. Environ. Manag. 2019, 246, 203–213. [Google Scholar] [CrossRef]
  53. Ferreira, P.; Soesbergen, A.V.; Mulligan, M.; Freitas, M.; Vale, M.M. Can forests buffer negative impacts of land-use and climate changes on water ecosystem services? The case of a Brazilian megalopolis. Sci. Total Environ. 2019, 685, 248–258. [Google Scholar] [CrossRef] [PubMed]
  54. Zhang, Y.J.; Li, Z.W.; Hu, B.B.; Xie, H.J.; Song, A.Y. Impact of a “source-sink” landscape pattern in an urbanized watershed on nitrogen and phosphorus spatial variations in rivers: A case study of Yuqiao Reservoir watershed, Tianjin, China. Acta Ecol. Sin. 2017, 37, 2437–2446. [Google Scholar] [CrossRef]
  55. Li, K.; Xie, Y.J.; Sun, W.; Wang, X.R.; Li, Z.H.; Wang, L. Spatial response of lake water quality to multi-scale landscape pattern of lakeside zone in agricultural watershed. Chin. J. Appl. Ecol. 2020, 31, 2057–2066. [Google Scholar] [CrossRef]
  56. Fan, C.R.; Zhang, C.F.; Shi, X.H.; Sun, B. Nitrogen Loss in Surface Runoff from Hulun Buir Steppe in Different Grazing Systems. Ecol. Environ. Sci. 2020, 5, 951–960. [Google Scholar] [CrossRef]
  57. Lv, L.T.; Gao, X.Q.; Liu, Q.; Jiang, Y. Influence of landscape pattern on nitrogen and phosphorus output in the Dongjiang River Basin. Acta Ecol. Sin. 2021, 41, 1758–1765. [Google Scholar] [CrossRef]
  58. Li, J.Y.; Zhou, Y.; Li, Q.; Yi, S.Q.; Peng, L.N. Exploring the effects of land use changes on the landscape pattern and soil erosion of western Hubei province from 2000 to 2020. Int. J. Environ. Res. Public Health 2022, 19, 1571. [Google Scholar] [CrossRef] [PubMed]
  59. Ji, D.Q.; Wen, Y.; Wei, J.B.; Wu, Z.F.; Liu, Q.; Cheng, Z. Relationships between landscape spatial characteristics and surface water quality in the Liu Xi River watershed. Acta Ecol. Sin. 2015, 35, 246–253. [Google Scholar] [CrossRef]
  60. Zhou, J.J.; Xiang, J.; Wang, L.Y.; Zhong, G.S.; Zhu, G.F.; Wei, W.; Feng, W.; Huang, M.H. Relationship between landscape pattern and hydrochemical characteristics of Binggou River Basin in eastern Qilian Mountains. Chin. J. Ecol. 2019, 38, 3779–3788. [Google Scholar] [CrossRef]
  61. Chen, D.C.; Elhadj, A.; Xu, H.L.; Xu, X.L.; Qiao, Z. A study on the relationship between land use change and water quality of the mitidja watershed in algeria based on GIS and RS. Sustainability 2020, 12, 3510. [Google Scholar] [CrossRef]
  62. Ding, J.; Jiang, Y.; Liu, Q.; Hou, A.J.; Liao, J.Y.; Fu, L.; Peng, Q.Z. Influences of the land use pattern on water quality in low-order streams of the Dongjiang River basin, China: A multi-scale analysis. Sci. Total Environ. 2016, 551–552, 205–216. [Google Scholar] [CrossRef]
  63. Liu, J.F.; Xu, J.J.; Zhang, X.; Liang, Z.M.; Rao, K. Nonlinearity and threshold effects of landscape pattern on water quality in a rapidly urbanized headwater watershed in China. Ecol. Indic. 2021, 124, 107389. [Google Scholar] [CrossRef]
  64. Hu, H.B.; Liu, H.Y.; Hao, J.F.; An, J. Influence of Spatial Difference on Water Quality in Jiuxiang River Watershed, Nanjing. Environ. Sci. 2012, 33, 794–801. [Google Scholar]
  65. Huang, J.L.; Li, Q.S.; Hong, H.S.; Lin, J.; Qu, M.C. Preliminary study on linking land use & landscape pattern and water quality in the Jiulong River watershed. Environ. Sci. 2011, 32, 66–74. [Google Scholar]
  66. Collins, K.E.; Doscher, C.; Rennie, H.G.; Ross, J.G. The Effectiveness of Riparian ‘Restoration’ on Water Quality–A Case Study of Lowland Streams in Canterbury, New Zealand. Restor. Ecol. 2012, 21, 40–48. [Google Scholar] [CrossRef]
  67. Mcmillan, S.K.; Tuttle, A.K.; Jennings, G.D.; Gardner, A. Influence of restoration age and riparian vegetation on reach-scale nutrient retention in restored urban streams. J. Am. Water Resour. Assoc. 2014, 50, 626–638. [Google Scholar] [CrossRef]
  68. Wang, T.; Zhu, B.; Luo, Z.X.; Zhang, J. Nitrate loss from sloping cropland of purple soil. Acta Pedol. Sin. 2010, 5, 962–970. [Google Scholar]
  69. Jing, X.K.; Li, L.; Chen, S.H.; Shi, Y.L.; Xu, M.X.; Zhang, Q.W. Steep Slope land and surface pollutants. Agric. Ecosyst. Environ. 2022, 339, 108154. [Google Scholar] [CrossRef]
  70. Meneses, B.M.; Reis, R.; Vale, M.J.; Saraiva, R. Land use and land cover changes in Zêzere watershed (Portugal)—Water quality implications. Sci. Total Environ. 2015, 527–528, 439–447. [Google Scholar] [CrossRef] [PubMed]
  71. Chen, Z.K.; An, C.J.; Tan, Q.; Tian, X.L.; Li, G.C.; Zhou, Y. Spatiotemporal analysis of land use pattern and stream water quality in southern Alberta, Canada. J. Contam. Hydrol. 2021, 242, 103852. [Google Scholar] [CrossRef] [PubMed]
Figure 1. (a) Location of study area in China; (b) Map of the Si River basin showing the main tributaries; (c) The digital elevation model of study area and spatial distribution of water quality monitoring stations: (1) Huacun reservoir, (2) Sishui bridge, (3) Bian bridge on the Si River, (4) Huangyinji gate, (5) Hezhuang reservoir, (6) The entrance of the Yincheng River to Si River, (7) Si he jin zhuang, (8) Longwantao reservoir.
Land 12 00457 g001
Figure 2. (a) Landscape types in three spatial scales; (b) Overview map of three spatial scales and three slope scales.
Land 12 00457 g002
Figure 3. Statistical map of sloping landscape structure at different scales. Note: Sub-catchment (SC), Riparian zone (RZ), River reach (RR), General land (G), Flat ground (F), Steep slope (S).
Land 12 00457 g003
Figure 4. Comparison of landscape index under different scales.
Land 12 00457 g004
Figure 5. Spatial distribution of water quality nutritional indicators. Note: the numbers 1–8 are the code of surface water monitoring station.
Land 12 00457 g005
Figure 6. The correlation between landscape indices and RWQ in different spatial and slope scales. Note: “*” means significant difference at p < 0.05; “**” means significant difference at p < 0.01.
Land 12 00457 g006
Figure 7. Sequence diagram of RDA results of different landscape features and RWQ in different scales ((a): landscape type; (b): landscape indices). Note: The naming method in above figure was “spatial scale–slope scale–landscape type (landscape index)”.
Land 12 00457 g007
Table 1. Landscape indices.
No.landscape IndicesAbbreviationsCalculation FormulaEcological Meanings
1Number of patches NP NP = N The total number of patches in a landscape type, which can describe landscape heterogeneity and fragmentation.
2Patch density PD PD = N A It is used to describe spatial heterogeneity and fragmentation.
3Edge density ED ED = N A 10 6 It is used to describe the degree of boundary segmentation. The larger the ED, the bigger the edge between different patches.
4Largest Patch Index LPI L P I = [ max ( a i j ) A ] Proportion of the largest patch in the landscape area.
5Landscape shape index LSI L S I = 0.25 E A Used to reflect the shape complexity of landscape types; the patch shape will affect its internal ecological process.
6Shannon’s diversity index SHDI S H D I = i = 1 n ( P i × ln P i ) It is sensitive to the uneven distribution of various landscape types and is mostly used for landscape heterogeneity and diversity analyses.
7Shannon’s evenness index SHEI S H E I = i = 1 m ( P i ln P i ) ln m If the value is small, it reflects that the landscape is dominated by one or more dominant patch type. On the contrary, it shows that the distribution of each patch in the landscape is relatively uniform.
8Aggregation index AI A I = [ i = 1 m ( g i j max g i j ) P i ] It is used to reflect the aggregation degree of landscape types, and the higher the value is, the higher the aggregation degree is.
9Patch cohesion indexCOHESION C O H E S I O N = [ 1 i = 1 m P i j j = 1 n P i j a i j ] For the natural connectivity of the same landscape, the greater the value, the better the connectivity.
10Contagion CONTAG C O N T A G = [ 1 + i = 1 m j = 1 n P i j ln ( P i j ) 2 ln ( m ) ] ( 100 ) Describes the degree of aggregation and the trend of extension between different patches in the landscape.
11Landscape metric Boltzmann entropyLMBE S = log 10 ( q = 0 t 1 j = 1 n ( i = 1 k M i ) ) This index can discuss landscape stability in terms of landscape structure.
Notes: N means total number of patches in the landscape, A means total landscape area, a ij means area of patch i j , E mans total length of all patches boundaries, P i means proportion of the landscape occupied by patch type (classes) i , m means number of patch types (classes) in the landscape, g i j means number of like adjacencies (joins) between pixels of patch type (class). P i j means the perimeter of patch i j , M i is the value of M computed for the ith multiset (i = 1, 2, …, k). LMBE was the abbreviations of Landscape metric Boltz-mann entropy.
Table 2. The correlation between landscape type and RWQ in different scales.
Spatial ScalesSlope ScalesLandscape TypeDONO3-NNH4+-NCODMnBOD5
Riparian zoneFlat groundWater area0.833 *----
Forest-−0.898 **---
Steep slopeGrassland-−0.790 *---
Construction land--0.755 **--
General landGrassland-−0.790 *---
Construction land--0.755 **--
River reachFlat groundArable land--0.857 **-−0.747 *
Steep slopeArable land0.675 *0.736 *0.913 **--
Forest-−0.802 *---
General landArable land0.675 *0.736 *0.913 **--
Forest-−0.802 *---
Sub-catchmentFlat groundGrassland-0.719 *---
Water area---−0.762 *-
Steep slopeArable land-−0.702 **-0.768 *-
Construction land0.778 *----
General landArable land-−0.702 **-0.768 *-
Construction land0.778 *----
Note: “*” means significant difference at p < 0.05; “**” means significant difference at p < 0.01.
Disclaimer/Publisher’s Note: The statements, opinions and data contained in all publications are solely those of the individual author(s) and contributor(s) and not of MDPI and/or the editor(s). MDPI and/or the editor(s) disclaim responsibility for any injury to people or property resulting from any ideas, methods, instructions or products referred to in the content.

