Abstract
Alterations of soil characteristics frequently accompany adaptations of pristine areas to different land uses, and these shifts have an impact on the overall ecosystem. Soil carbon stores and atmospheric CO2 emissions are directly affected by those adaptations in farming management and land usage. To comprehend the mechanisms involved in the carbon pool, this study was conducted in a subtropical region by considering six contiguous land uses; pasture, rice land, kiwi orchard, tea land, woodland, and uncultivated land. A CO2 trap was used to quantify CO2 emissions for six weeks, and the obtained data were used to analyze CO2 respiration. In comparison to other land uses, the pasture and woodland showed the best results in soil microbial respiration (SMR), significantly higher than other land uses, with values of 2561.2 and 2334.8 mg CO2-C kg−1 soil, respectively. Tea land and uncultivated land demonstrated considerably increased microbial metabolic quotients (MMQ) compared to other land uses. Whereas with an increase in soil depth, the MMQ significantly increased in tea and uncultivated lands, other land uses did not show significant changes with depth. Compared to other land uses, pasture, and forest areas boosted soil organic carbon (SOC) and microbial biomass carbon (MBC) both in the top and subsoil. It is reasonable to assume that the amount of SOC and MBC in the soil significantly dropped when the land was converted from pasture and woodland to other land uses.
1. Introduction
Increased food demand due to increases in the population may put pressure on the available land supply [1]. Numerous ecosystems are put in danger by alterations in land use brought on by human activity and natural forces [2]. Various aspects such as soils, water supplies, woodlands, pasturelands, farmlands, and biodiversity are all included in the definition of land degradation, which includes the entire environment [3,4,5,6]. About 30% of the world’s woodlands and pasturelands have been turned into agricultural land or used for grazing livestock over the past four centuries [7]. The mismanagement and non-sustainable use of soil have led to the destruction of soil, such as a reduction of its organic carbon (OC), decreasing water availability, and the disruption of microbial functions [8,9,10]. When the land was converted from being forested to being used for agriculture, there was a considerable reduction in the amount of silt, aggregate stability, nutrient availability, and organic carbon [11]. Comparing pasture and cropland revealed that pasture had much higher levels of soil organic matter, total nitrogen, accessible potassium, clay, and sand than cropland [12]. Moreover, compared to pasture, various soil characteristics in cropland soils, such as calcium carbonate, bulk density, and soil acidity exhibited a rising trend [3,10]. In addition, when comparing an orchard with cropland, the average clay content in the cropland was higher than in the orchard [13,14]. Additionally, changes in CEC in orchards were greater than in cropland, whereas agricultural use showed increases in EC and total calcium carbonate percentage [15].
During soil respiration, soils serve a crucial function, as a sink or source of significant amounts of carbon in the atmosphere [16]. Over the past century, C losses from land degradation have been rising continuously, and they are already nearing rates of roughly 1.4 Pg C yr−1 [17]. Understanding the biological development of soils from various land uses and fluctuations in the organic carbon pool is indeed crucial for the effective management of ecosystems. A vital element in the carbon cycle is soil respiration, which is the major method through which carbon fixed by the soil is released back into the atmosphere [18]. Therefore, even minor alterations in soil respiration may have a significant impact on the balance of atmospheric CO2 and heat [16]. Furthermore, determining how alterations in land use affect soil respiration is critical for comprehending carbon balances [19]. Analysis of the kinetics of C mineralization could be a reliable solution for the evaluation of a land’s potential to supply mineralizable organic carbon [20].
The determination of the SOC models that can be used to guide global policies and that have the potential for significant economic and social effects is one of the major areas of debate in C stock management. Most current models of SOC loss use first-order kinetics, where the rate of loss is determined by SOC stocks multiplied by a kinetic term [21,22,23,24]. SOC can be separated into two parts, a labile fraction and a more recalcitrant one, each degrading gradually at rates described by its constants [25,26]. Based on the aforementioned details, several investigations have been carried out [27,28,29]. However, the majority of these investigations on the impacts of land use changes on soil respiration have exclusively focused on temperate regions and tropical Latin America [29,30,31]. Site variables like soil and environmental characteristics control soil microbial activity and biodiversity [10]; additionally, it varies depending on the type of flora, how it is managed, and land usage [8]. Assuming that land use has an impact on soil microbial features, their measurement can be used to assess how changes in land use influence alterations in soil microbial functions [9].
For many years, due to increases in population and demand for cultivation, it has been a widespread procedure in northern Iran, along the Caspian Sea, to convert natural land to various land uses. However, due to a lack of management, many of these land changes have been done in an unprincipled and irresponsible manner. Low soil pH and related issues are among the main obstacles to high crop yields in this region. However, very little information is available regarding CO2 emissions from various land uses in these areas, and very little is known about the native soil organic carbon dynamics in diverse land uses. Therefore, the objective of this research was to evaluate the C-mineralization potentials of soils from six contiguous land uses, i.e., pasture, cropland, orchard, tea land, woodland, and uncultivated land, using the first-order model. Additionally, some carbon features and biological statuses of soil such as soil microbial respiration, soil microbial biomass carbon, and half-life of carbon have been measured to evaluate the interaction between soil microbial respiration and C mineralization.
2. Materials and Methods
2.1. Study Area Description
The humid subtropical climate zone of Hashtbar (9°05′55′′ N, 38°36′21′′ E) in northern Iran’s Guilan province was the source of the soil samples. This area is characterized by 1000 mm of precipitation annually and an average monthly temperature of 20.2 °C. Five adjunct sites were taken into consideration to evaluate the carbon cycle amongst various land uses as follows: pastureland (PL), cropland used for rice cultivation (CL), orchard land used for kiwi plantations (OL), tea land (TL), woodland (WL), and land left uncultivated for two years (UL). In July 2021, composite soil samples were taken at random from five places within each land use site in two depths (0–15 cm and 15–30 cm). Plant roots and other residues were cleaned from the samples before soil analysis, and each sample was completely mixed, air-dried, and sieved at a 2 mm size. Some basic properties of collected soil are presented in Table 1.

Table 1.
Soil analysis in different land uses.
2.2. Soil Microbiological Measurements
To evaluate soil microbial respiration (SMR), twenty grams of soil samples were moistened to 60% of their water-holding capacity and maintained at 28 °C in 0.5 L sealed jars to measure microbial activity. In vials containing 10 mL of 0.5 M NaOH, the CO2 emitted was preserved. A blank vial was considered a control. At each gas sampling time, distilled water was added, and the moisture content was weighed to maintain consistency. Following precipitation with BaCl2, the amount of CO2 emitted was determined after 7, 14, 21, 28, 35, and 42 days of incubation using titration with 0.5 M HCl against a phenolphthalein indicator (0.5 M) [32]. The emitted CO2 from the soil during exposure to the alkali was calculated according to Equation (1) [33]:
where Vac is the volume of acid used to titrate NaOH in control jars, and Vas is the volume of acid used to titrate NaOH in the target soils. N is the normality of the acid and E represents the equivalent weight of CO2 = 22.
By applying 0.5 M K2SO4 as an extractant and using the chloroform fumigation extraction method, the soil’s microbial biomass carbon (MBC) and microbial biomass nitrogen (MBN) were quantified [34]. The total organic carbon analyzer Sundy SDCHN636 was used to determine the extracts’ C and N contents percentages.
Another microbial index is the microbial metabolic quotient (MMQ), defined as the basal C respiration rate (respired CO2) per unit of microbial biomass C (MBC), which measures the energy required for the long-term maintenance of the microbial biomass in soils. If C is not appropriately provided, stoichiometric imbalance might result in greater maintenance respiration and a slow reduction in soil microbial biomass. This measure has been widely used as an indicator of change in the eco-physical status of soil microorganisms, for instance during succession, land use change, and soil disturbance. It measures the basic physiological state of the microbial community and is influenced by the fungal to bacterial biomass ratio in soils [35]. The MMQ ratio, as a measure of how effectively microorganisms use the readily available resources (high efficiency for low values of MMQ), was calculated according to Equation (2) [36]:
2.3. C Mineralization Kinetic and Biochemical Parameters
Graphical analyses of the CO2 respiration values obtained during the incubation were carried out to detect anomalies. The first-order model has been used by several studies to fit C mineralization data [5,21]. To describe soil C mineralization and CO2 respiration, the first-order model was used using Equation (3) [37]:
where Ct is cumulative carbon mineralized after time t (mg CO2-C kg−1 soil), Co is potentially mineralizable carbon (mg CO2-C kg−1 soil), k is the rate constant of carbon mineralization that represents the slope of the curve, and t is the period from the start to the end of incubation.
According to the first-order model, the initial potential rate of C mineralization (Co*k), which is the product of Co and k, was calculated. The half-life of carbon (t1/2) was also estimated. The half-life of carbon indicates the time required for half of the initial carbon to decompose away to reach half of the maximal mineralization. A mixed model was used to identify significant variations in the measured variables as a result of land uses in two depths. The depth was taken into account when taking repeated measurements. Equation (4) was used to represent the statistical model:
where i = 1, …, 5 for the soil samples in each land use, j = 1, …, 6 for the land uses, and k = 1,2 for the two depths. Yi,j,k represents the dependent variable’s observed values for land use j at depth k in sample i. Further, µi, βi, and γi are represented as the main effect of sample i, land use j, and depth k, respectively. βγj,k indicates the interaction effect of land use j and depth k. Random error in the dependent variable for land use j at depth k in sample i is shown by εi,j,k.
Assumptions for the model were as follows:
where ω is the covariance between errors at different depths.
Consequently, three variance parameters were incorporated into the model and were calculated using the residual maximum likelihood (REML) technique. Finally, a multiple means comparison of the soil properties was done using the Tukey method in SPSS 26 (Chicago, IL, USA).
3. Results
3.1. Soil Microbial Respiration (SMR)
Soil microbial respiration (SMR) values throughout the 42-day incubation time demonstrated a regular trend in both depths and for all land uses. Typically, as the incubation time went on, SMR values, initially high, were followed by steady drops. There were significant differences between land uses (p < 0.05) (Figure 1). Among the investigated land uses, PL and WL showed the best results for soil respiration, significantly higher than others. The highest SMR value in both depths was obtained from PL with a range of 1266.6 to 1294.6 mg CO2-C kg−1 soil.
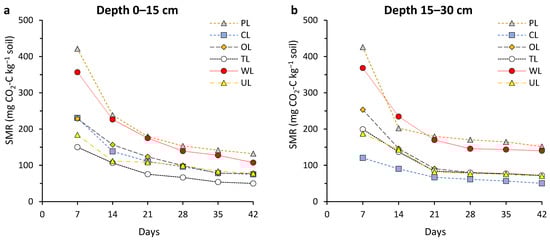
Figure 1.
Changes in soil microbial respiration (SMR) during the incubation period (42 days) affected by different land uses and in two soil depths: (a) 0–15 cm, and (b) 15–30 cm. PL: pastureland; CL: cropland; OL: orchard land; TL: tea land; WL: woodland; UL: uncultivated land.
3.2. Cumulative CO2-C Emitted
Results showed that between land uses, there were significant differences in the cumulative CO2-C emission over the experiment time (p < 0.05). (Figure 2). Pasture and woodland showed the highest cumulative CO2-C emission with values of 2561.2 and 2334.8 mg CO2-C kg−1 soil, respectively. In contrast, the lowest values were obtained from cropland and tea land with values of 1176.2 and 1152.1 mg CO2-C kg−1 soil, respectively.
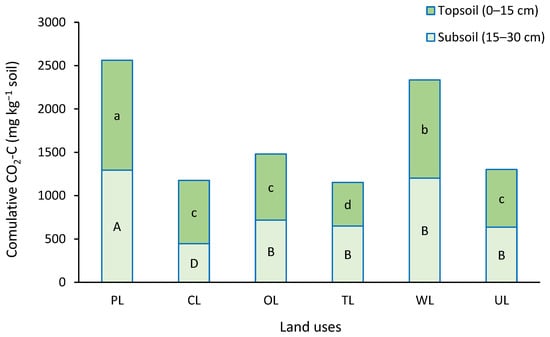
Figure 2.
Cumulative CO2-C emitted during the incubation period (42 days) in different land uses and two depths. Similar small letters refer to no significant difference between land uses in topsoil (0–15 cm), and similar capital letters refer to no significant difference between land uses in subsoil (15–30 cm). PL: pastureland; CL: cropland; OL: orchard land; TL: tea land; WL: woodland; UL: uncultivated land.
From the soil depth view, PL and WL showed significantly higher cumulative CO2-C emissions in both depths compared to others. However, there was a significant difference between PL and WL. In topsoil (0–15 cm), TL showed the lowest cumulative CO2-C emissions with a value of 502.5 mg CO2-C kg−1 soil. At the same depth, there were no significant differences between CL, OL, and UL. In subsoil (15–30 cm), the lowest cumulative CO2-C emission was obtained from CL with a value of 446.6 mg CO2-C kg−1 soil. At the same depth, OL, TL, and UL showed moderate CO2-C values without significant differences between them.
3.3. Soil Carbon Parameters
Results showed that between land uses, there were significant differences in SOC, MBC, Ct, and Co*k parameters (p < 0.05). (Figure 3). Soil organic carbon (SOC) in PL and WL showed the highest amounts (42.7 and 40.1 g kg−1 soil) in comparison with others. There were no significant differences between other land uses. In the case of microbial biomass carbon (MBC), the highest values were related to PL and WL (about 750 mg kg−1 soil), without significant differences between them. Uncultivated land (UL), with an MBC value of 194 mg kg−1 soil, showed a significant difference from the others. There were no significant differences between CL, OL, and TL in the case of MMQ.
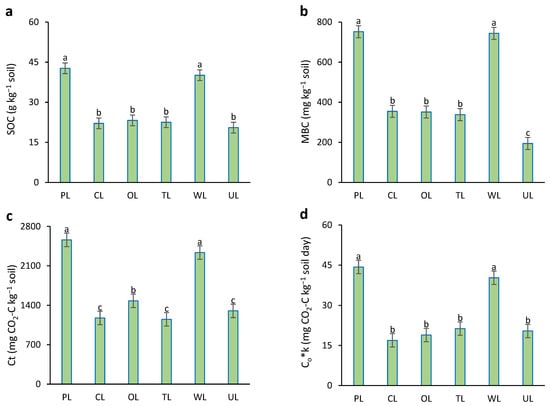
Figure 3.
Soil carbon parameters influenced by different land uses. (a) SOC: soil organic carbon; (b) MBC: microbial biomass carbon; (c) Ct: total mineralized carbon during the experiment period; (d) Co*k: the initial potential of carbon mineralization. PL: pastureland; CL: cropland; OL: orchard land; TL: tea land; WL: woodland; UL: uncultivated land. Similar small letters refer to no significant difference between land uses in topsoil (0–15 cm).
Based on the results, PL and WL showed the highest amounts of total mineralized carbon (Ct), about 54% higher than other land uses. The lowest Ct was obtained from UL with an amount of 226.3 mg CO2-C kg−1 soil. In the case of the initial potential of carbon (Co*k), PL and WL showed the highest values, without significant differences between them. Other land uses had significantly lower Co*k values in comparison to PL and WL.
3.4. C Mineralization Kinetic
Results demonstrated a significant relationship between land use and soil depth for the Co, k, t1/2, and MMQ parameters (p < 0.05) (Figure 4). In the topsoil, PL, CL, and WL showed higher values of potentially mineralizable carbon (Co) in comparison to other land uses (about 1345 mg CO2-C kg−1 soil). There was no significant difference between them. The lowest Co value was obtained from tea land (518.3 mg CO2-C kg−1 soil). In the subsoil, the highest Co values were related to PL and WL, with values of 1312 and 1297 mg CO2-C kg−1 soil, respectively, and there was no significant difference between them. The lowest Co value was observed from CL with a value of 439.8 mg CO2-C kg−1 soil. Furthermore, there was a significant difference in the Co value of CL in two different depths; the Co value in surface soil was 66% higher than that in subsurface soil.
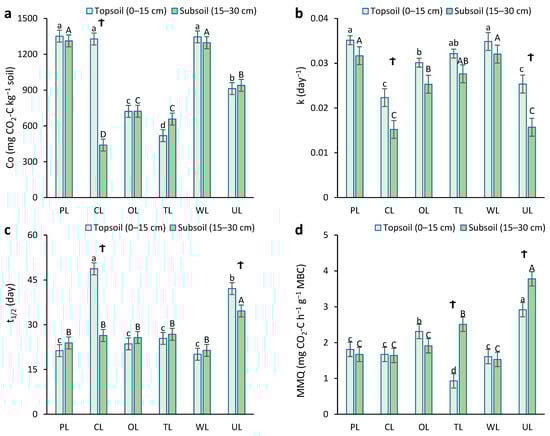
Figure 4.
Soil microbial activity parameters influenced by different land uses in two depths. (a) Co: potentially mineralizable carbon; (b) k: constant of carbon mineralization; (c) t1/2: half-life time of carbon; (d) MMQ: microbial metabolic quotient. PL: pastureland; CL: cropland; OL: orchard land; TL: tea land; WL: woodland; UL: uncultivated land. Lowercase letters indicate the mean comparison between land uses in topsoil (0–15 cm). Uppercase letters indicate the mean comparison between land uses in subsoil (15–30 cm). Ϯ shows a significant difference between the two depths for one land use.
In the case of the rate constant of carbon mineralization (k), PL and WL showed the highest k constant in both depths, without significant differences between them. In contrast, CL and UL showed the lowest k constant in both depths, without significant differences between them. Additionally, there was a significant difference in the k constant of CL and UL in different depths, and their k constants in surface soil were 32% and 36% higher than those in subsurface soil.
In the topsoil, CL showed the highest half-life time (t1/2) of carbon (49 days). The second-highest t1/2 was obtained from UL, with 42 days’ half-life time. Other land uses, with a half-life time of roughly 25 days, were not significantly different from each other. In subsurface soil, the half-life time of carbon in UL was significantly higher than in other land uses. Depth also had a significant effect on t1/2 in CL and UL, whereas there was no significant difference between the two depths for other land uses.
In the case of the microbial metabolic quotient (MMQ), UL showed the highest values in both depths in comparison to others. The lowest MMQ in surface and subsurface were obtained from TL and WL, respectively. The change in depth had a significant effect on MMQ in TL and UL, and deep depth showed higher values. However, there were no significant differences in MMQ for other land uses in the case of depth.
4. Discussion
Based on the results, soil respiration decreased over the duration of the experiment. The greater amount of CO2 that was produced at the beginning of the process suggests a quick depletion of labile organic carbon [38,39,40]. Even though the most labile fraction of soil organic carbon was emptied, the stable fraction continued to be mineralized during the steady phase, which shows that mineralization had decreased to a substantially stable level [21,25,38]. Among the investigated land uses, the amount of CO2 emitted caused by microbial respiration, in pasture and woodland was higher, with pasture slightly outperforming woodland in this regard. This might be explained by the fact that they contain more organic matter than rice land, kiwi orchards, tea land, and uncultivated land (Table 1). It has been reported that pasture soil has a developed root density in contrast to that of a forest, which preserves water and improves root and microbial respiration [41,42]. A large pool of labile C substrates and a high porosity of soil along with a quick oxidation process can lead to high rates of soil respiration [43,44]. As a result, increased basal respiration can cause the decomposition of more organic matter, high nutrient cycling, and biological functions [45]. The lower bulk density and high porosity of pasture soil compared to other land uses can prove that claim (Table 1). On the other hand, it’s also expected that soil respiration is directly affected by microbial biomass carbon, and the highest rates of soil respiration correlate with the highest microbial biomass carbon [46]. Pasture and woodland included more readily degradable organic matter than other land uses, and their higher soil MBC could have occurred due to more C mineralization [47]. That is why the amount of MBC in the pasture and woodland was significantly higher (Figure 3b). The competence of pasture and forest lands compared to ploughed soils such as agricultural soils or orchards may be attributable to the stability of their soil structure, robust soil particle agglomeration, and decreased disturbance through anthropogenic activities [48]. Mean weight diameter (MWD) is considered one of the important soil structure indexes; a high MWD value indicates more soil aggregation and stronger structure [49]. With a closer look at Table 1, it can be seen that the high MWD values in pasture and woodland soils can support that claim. There have also been reports of increased amounts of mineralized carbon in grazing pastures with lower tillage [50]. As a result, it is possible to explain the drop in C mineralization in the subsurface of soil as being caused by decreased levels of organic carbon and relatively reduced microbial activity [48]. According to previous studies, deeper soil layers have less microbial and fungal activity than the top soil layers [51,52].
The findings demonstrated that soil depth affected the values of the C kinetic parameters in each land use case (Figure 4). Lower values of Co may imply compounds that are harder to break down because of different chemical contents or less active microorganisms [52,53]. Microbial biomass carbon (MBC) is referred to as an active C pool whose volume directly affects the model results in models that predict the organic carbon (OC) cycle [54,55]. As a result, variations in SOC and MBC may make a major contribution to the variations in C kinetic model outputs seen in this work [34]. All k values, except rice land and uncultivated land, remained around a rather small range (Figure 4b).
This finding suggests that labile organic C and microbial respiration are comparable to one another or are equally available in both depths [56]. After determining that variations in k values within soils cannot be attributable to variations in the relative sizes of the C pools, it can be said that there are no significant connections between k and both potentially and readily mineralizable C [57,58]. Half-life duration is a metric that can be understood quite precisely, and the high half-life of carbon is related to stressors on the environment [59]. Accordingly, the lower levels of carbon mineralization that were indicated by uncultivated land and rice land mean longer half-life times. Although increased soil respiration and MBC levels typically suggest superior soil properties, these measures do not often alter in the same way [19,46]. Because of this, the microbial metabolic quotient (MMQ) is used to assess how effectively MBC consumes organic C [34,46,55]. A greater MMQ value indicates less metabolic activity in the consumption of organic C, or, in other words, a strong need for sustaining energy [32]. The amount of MMQ observed in tea and uncultivated land showed a significant difference between depths in comparison to other land uses. A greater MMQ indicates a substantial requirement to sustain carbon, and MBC should be decreased if the soil ecosystem fails to replace the carbon that is released during respiration [60,61,62]. The lower MMQ value seen in the topsoil in this study suggests more sustainable ecosystems, with more microorganisms converting organic C more effectively [36]. On the other hand, liming in the study area’s tea land is also worth considering. Acidic soils are typically better for the tea plant’s growth [63]. However, due to the increase in the use of chemical fertilizers, sometimes the pH level of the soil reaches below four. As a consequence, farmers use liming in tea gardens to avoid too much acidity. An increase in the diversity of detritivores and soil fauna should follow from liming [64], and this would promote the breakdown of organic components and C mineralization [53]. The effectiveness of liming was seen by the substantially reduced levels of the MMQ being only in topsoil [36]. Given the fact that lime flows quite slowly through soil and has a buffering effect only on the topsoil, the added lime was unable to modify the MMQ value in the subsoil part [65]. The MMQ even clearly illustrates the differences in microbial activity between unaltered and changed habitats [66,67,68]. Therefore, in contrast to lands with more sustainable habitats, the considerably higher MMQ values found in uncultivated land at both depths and tea land in the subsoil imply more pressure on biological activity [65]. Additionally, the chemical properties of soil, which affect substrate supply, change significantly with depth [58]. The depth of sampling in this experiment had a substantial impact on the outcomes of the C kinetics parameters. The mean Co and t1/2 values in rice land were substantially greater in the topsoil than in the subsoil. The mean MMQ values found in tea fields and uncultivated land in topsoil were substantially lower than those found in the subsurface.
Since pasture and woodland soils were mostly unaffected by the depth of soil sampling, this suggests a sustainable soil system in both [42,69]. This could be a result of a mixture of larger C losses from soil erosion following land management such as tillage and fewer carbon inputs through biomass return [11,17]. It is generally known that the change of evergreen land to agricultural land results in reductions in the C content of soil [4]. Quick soil erosion, disturbance of soil structure, and finally loss of SOC are serious consequences of cultivation in lands that were normally occupied by natural plants [8,49]. It has been proven that switching from pasture to agricultural lands results in a considerable loss of SOC, although changing forest to pasture does not induce SOC loss [12,47,50]. As a result, the current study’s increasing carbon content in pasture and woodland indicates that these soils might contribute to a C sink in a specific environment [48]. As hypothesized, the topsoil had much larger concentrations of Ct and Co*k than the subsoil, since topsoil had greater values for SOC and MBC, and Ct and Co*k are significantly affected by both of those metrics. In reaction to the declining labile C sources, the soil metabolism reduced with depth [56]. The reduced microbial activities in the subsoil are somewhat explained by the fact that MBC diminishes with depth [57,58]. On the other hand, nutrient supply is regulated by soil texture, especially clay particles [70]. Additionally, organic matter regulates the quantity and accessibility of adsorbent and dissolved organic matter [22]. However, it’s been demonstrated that as depth increases, both of them gradually become weaker [57,58].
5. Conclusions
The findings of an experimental comparison of C kinetics in various land use cases showed that the rates of soil C mineralization varied greatly, and that the best results were achieved from areas with natural ecology. Higher levels of CO2-C mineralization were found in pasture and woodland than in rice-farming land, kiwi orchards, tea lands under liming management, and uncultivated land, showing high levels of biological activity and C cycling. Compared to rice land, kiwi orchard land, tea land, and uncultivated land, pasture and woodland areas boosted soil SOC production and degradation both in top and subsoil. The first-order model’s estimated parameters Co, Co*k and MMQ performed well as discriminators between various land uses. Due to their sensitivity to changes in land use, these metrics, along with SOC and MBC, could be used to track changes in soil degradation. Apart from pasture and woodland, four other land uses were considered as new land features impacted by human activities; all six areas were chosen in the same region and next to one another. Therefore, it can be certainly said that the land use change from pasture or woodland to other land uses drastically decreased soil SOC and MBC. The change in soil carbon patterns due to land use change will be more important when it is considered on a global scale. Thus, it is essential to carry out comprehensive investigations using worldwide data.
Author Contributions
Conceptualization, M.G.; methodology, M.G.; software, M.G. and E.A.; validation, M.G., P.K., J.M. and M.K.; formal analysis, M.G. and E.A.; investigation, M.G. and E.A.; resources, P.K. and J.M.; data curation, M.G., E.A., P.K., J.M. and M.K.; writing—original draft preparation, M.G., E.A. and T.N.H.; writing—review and editing, M.G., E.A., P.K. and M.K.; visualization, M.G.; supervision, M.G.; project administration, E.A.; funding acquisition, P.K. All authors have read and agreed to the published version of the manuscript.
Funding
This research was supported by the University of South Bohemia in České Budějovice (GAJU 085/2022/Z).
Data Availability Statement
Not applicable.
Conflicts of Interest
The authors declare no conflict of interest.
References
- Kopittke, P.M.; Menzies, N.W.; Wang, P.; McKenna, B.A.; Lombi, E. Soil and the Intensification of Agriculture for Global Food Security. Environ. Int. 2019, 132, 105078. [Google Scholar] [CrossRef] [PubMed]
- Davey, T.M.; Selvey, L.A. Relationship between Land Use/Land-Use Change and Human Health in Australia: A Scoping Study. Int. J. Environ. Res. Public Health 2020, 17, 8992. [Google Scholar] [CrossRef] [PubMed]
- Esse, C.; Ríos, N.; Saavedra, P.; Fonseca, D.; Encina-Montoya, F.; Santander-Massa, R.; De los Ríos-Escalante, P.; Figueroa-Muñoz, G.; López-Pérez, A.; Correa-Araneda, F. Effects of Land Use Change on Water Availability and Water Efficiency in the Temperate Basins of South-Central Chile. J. King Saud Univ. Sci. 2021, 33, 101650. [Google Scholar] [CrossRef]
- Mongil-Manso, J.; Navarro-Hevia, J.; San Martín, R. Impact of Land Use Change and Afforestation on Soil Properties in a Mediterranean Mountain Area of Central Spain. Land 2022, 11, 1043. [Google Scholar] [CrossRef]
- Yee, S.H.; Paulukonis, E.; Simmons, C.; Russell, M.; Fulford, R.; Harwell, L.; Smith, L.M. Projecting Effects of Land Use Change on Human Well-Being through Changes in Ecosystem Services. Ecol. Model. 2021, 440, 109358. [Google Scholar] [CrossRef] [PubMed]
- Meng, X.; Zhu, Y.; Yin, M.; Liu, D. The Impact of Land Use and Rainfall Patterns on the Soil Loss of the Hillslope. Sci. Rep. 2021, 11, 16341. [Google Scholar] [CrossRef]
- Gibbs, H.K.; Salmon, J.M. Mapping the World’s Degraded Lands. Appl. Geogr. 2015, 57, 12–21. [Google Scholar] [CrossRef]
- Xiao, S.; Zhang, W.; Ye, Y.; Zhao, J.; Wang, K. Soil Aggregate Mediates the Impacts of Land Uses on Organic Carbon, Total Nitrogen, and Microbial Activity in a Karst Ecosystem. Sci. Rep. 2017, 7, 41402. [Google Scholar] [CrossRef]
- Chen, Q.; Yang, F.; Cheng, X. Effects of Land Use Change Type on Soil Microbial Attributes and Their Controls: Data Synthesis. Ecol. Indic. 2022, 138, 108852. [Google Scholar] [CrossRef]
- Malik, A.A.; Puissant, J.; Buckeridge, K.M.; Goodall, T.; Jehmlich, N.; Chowdhury, S.; Gweon, H.S.; Peyton, J.M.; Mason, K.E.; van Agtmaal, M.; et al. Land Use Driven Change in Soil PH Affects Microbial Carbon Cycling Processes. Nat. Commun. 2018, 9, 3591. [Google Scholar] [CrossRef]
- Li, H.; Zhu, H.; Liang, C.; Wei, X.; Yao, Y. Soil Erosion Significantly Decreases Aggregate-Associated OC and N in Agricultural Soils of Northeast China. Agric. Ecosyst. Environ. 2022, 323, 107677. [Google Scholar] [CrossRef]
- Alkimim, A.; Sparovek, G.; Clarke, K.C. Converting Brazil’s Pastures to Cropland: An Alternative Way to Meet Sugarcane Demand and to Spare Forestlands. Appl. Geogr. 2015, 62, 75–84. [Google Scholar] [CrossRef]
- Gao, J.; Lu, Y.; Chen, Z.; Wang, L.; Zhou, J. Land-use Change from Cropland to Orchard Leads to High Nitrate Accumulation in the Soils of a Small Catchment. Land Degrad. Dev. 2019, 30, 2150–2161. [Google Scholar] [CrossRef]
- Dang, C.; Shao, Z.; Huang, X.; Qian, J.; Cheng, G.; Ding, Q.; Fan, Y. Assessment of the Importance of Increasing Temperature and Decreasing Soil Moisture on Global Ecosystem Productivity Using Solar-induced Chlorophyll Fluorescence. Glob. Chang. Biol. 2022, 28, 2066–2080. [Google Scholar] [CrossRef]
- Bibi, S.; Irshad, M.; Mohiuddin, M.; Sher, S.; Tariq, M.A.U.R.; Ng, A.W.M. Distribution of Phosphorus Fractions in Orchard Soils in Relation to Soil Properties and Foliar P Contents. Sustainability 2022, 14, 3966. [Google Scholar] [CrossRef]
- Vargas-Terminel, M.L.; Flores-Rentería, D.; Sánchez-Mejía, Z.M.; Rojas-Robles, N.E.; Sandoval-Aguilar, M.; Chávez-Vergara, B.; Robles-Morua, A.; Garatuza-Payan, J.; Yépez, E.A. Soil Respiration Is Influenced by Seasonality, Forest Succession and Contrasting Biophysical Controls in a Tropical Dry Forest in Northwestern Mexico. Soil Syst. 2022, 6, 75. [Google Scholar] [CrossRef]
- Hu, X.; Næss, J.S.; Iordan, C.M.; Huang, B.; Zhao, W.; Cherubini, F. Recent Global Land Cover Dynamics and Implications for Soil Erosion and Carbon Losses from Deforestation. Anthropocene 2021, 34, 100291. [Google Scholar] [CrossRef]
- Vries, F.T.; Williams, A.; Stringer, F.; Willcocks, R.; McEwing, R.; Langridge, H.; Straathof, A.L. Changes in Root-exudate-induced Respiration Reveal a Novel Mechanism through Which Drought Affects Ecosystem Carbon Cycling. New Phytol. 2019, 224, 132–145. [Google Scholar] [CrossRef]
- Li, Y.; Zhang, J.; Li, E.; Miao, Y.; Han, S.; Liu, Y.; Liu, Y.; Zhao, C.; Zhang, Y. Changes in Carbon Inputs Affect Soil Respiration and Its Temperature Sensitivity in a Broadleaved Forest in Central China. CATENA 2022, 213, 106197. [Google Scholar] [CrossRef]
- Liptzin, D.; Norris, C.E.; Cappellazzi, S.B.; Bean, G.M.; Cope, M.; Greub, K.L.H.; Rieke, E.L.; Tracy, P.W.; Aberle, E.; Ashworth, A.; et al. An Evaluation of Carbon Indicators of Soil Health in Long-Term Agricultural Experiments. Soil Biol. Biochem. 2022, 172, 108708. [Google Scholar] [CrossRef]
- Liyanage, L.R.M.C.; Sulaiman, M.F.; Ismail, R.; Gunaratne, G.P.; Dharmakeerthi, R.S.; Rupasinghe, M.G.N.; Mayakaduwa, A.P.; Hanafi, M.M. Carbon Mineralization Dynamics of Organic Materials and Their Usage in the Restoration of Degraded Tropical Tea-Growing Soil. Agronomy 2021, 11, 1191. [Google Scholar] [CrossRef]
- Zacháry, D.; Filep, T.; Jakab, G.; Varga, G.; Ringer, M.; Szalai, Z. Kinetic Parameters of Soil Organic Matter Decomposition in Soils under Forest in Hungary. Geoderma Reg. 2018, 14, e00187. [Google Scholar] [CrossRef]
- Zhu, R.; Zheng, Z.; Li, T.; Zhang, X.; He, S.; Wang, Y.; Liu, T.; Li, W. Dynamics of Soil Organic Carbon Mineralization in Tea Plantations Converted from Farmland at Western Sichuan, China. PLoS ONE 2017, 12, e0185271. [Google Scholar] [CrossRef] [PubMed]
- Cai, B.; Shao, Z.; Fang, S.; Huang, X.; Huq, M.E.; Tang, Y.; Li, Y.; Zhuang, Q. Finer-Scale Spatiotemporal Coupling Coordination Model between Socioeconomic Activity and Eco-Environment: A Case Study of Beijing, China. Ecol. Indic. 2021, 131, 108165. [Google Scholar] [CrossRef]
- Zhang, H.; Zhou, Z. Recalcitrant Carbon Controls the Magnitude of Soil Organic Matter Mineralization in Temperate Forests of Northern China. For. Ecosyst. 2018, 5, 17. [Google Scholar] [CrossRef]
- Fernández-Labrada, M.; López-Mosquera, M.E.; López-Fabal, A. Anaerobic Digestion and Microfiltration of the Liquid Fraction of Pig Slurry: N Mineralization, C-CO2 Emissions and Agricultural Value of the Products. Waste Biomass Valor. 2022. [Google Scholar] [CrossRef]
- Ding, F.; Sun, W.; Huang, Y.; Hu, X. Larger Q10 of Carbon Decomposition in Finer Soil Particles Does Not Bring Long-Lasting Dependence of Q10 on Soil Texture: Q10 of C Decomposition in Soil Particle-Size Fractions. Eur. J. Soil Sci. 2018, 69, 336–347. [Google Scholar] [CrossRef]
- Chen, Y.; Sun, K.; Wang, Z.; Zhang, E.; Yang, Y.; Xing, B. Analytical Methods, Molecular Structures and Biogeochemical Behaviors of Dissolved Black Carbon. Carbon Res. 2022, 1, 23. [Google Scholar] [CrossRef]
- Ferraz de Almeida, R.; Rodrigues Mikhael, J.E.; Oliveira Franco, F.; Fonseca Santana, L.M.; Wendling, B. Measuring the Labile and Recalcitrant Pools of Carbon and Nitrogen in Forested and Agricultural Soils: A Study under Tropical Conditions. Forests 2019, 10, 544. [Google Scholar] [CrossRef]
- Sy, V.D.; Herold, M.; Achard, F.; Beuchle, R.; Clevers, J.G.P.W.; Lindquist, E.; Verchot, L. Land Use Patterns and Related Carbon Losses Following Deforestation in South America. Environ. Res. Lett. 2015, 10, 124004. [Google Scholar] [CrossRef]
- Marengo, J.A.; Souza, C.M.; Thonicke, K.; Burton, C.; Halladay, K.; Betts, R.A.; Alves, L.M.; Soares, W.R. Changes in Climate and Land Use Over the Amazon Region: Current and Future Variability and Trends. Front. Earth Sci. 2018, 6, 228. [Google Scholar] [CrossRef]
- Goupil, K.; Nkongolo, K. Assessing Soil Respiration as an Indicator of Soil Microbial Activity in Reclaimed Metal Contaminated Lands. Am. J. Environ. Sci. 2014, 10, 403–411. [Google Scholar] [CrossRef]
- Liu, G.; Sonobe, R.; Wang, Q. Spatial Variations of Soil Respiration in Arid Ecosystems. OJE 2016, 06, 192–205. [Google Scholar] [CrossRef]
- Bertozzi, J.; Andrade, D.S.; Oliveira, C.C.; Bala, A.; Caviglione, J.H. Microwave Assisted Biocidal Extraction Is an Alternative Method to Measure Microbial Biomass of Carbon from Cultivated and Non-Cultivated Soils. Braz. J. Microbiol. 2020, 51, 255–263. [Google Scholar] [CrossRef] [PubMed]
- Clayton, J.; Lemanski, K.; Bonkowski, M. Shifts in Soil Microbial Stoichiometry and Metabolic Quotient Provide Evidence for a Critical Tipping Point at 1% Soil Organic Carbon in an Agricultural Post-Mining Chronosequence. Biol. Fertil. Soils 2021, 57, 435–446. [Google Scholar] [CrossRef]
- Jomura, M.; Kuwayama, T.; Soma, Y.; Yamaguchi, M.; Komatsu, M.; Maruyama, Y. Mycelial Biomass Estimation and Metabolic Quotient of Lentinula Edodes Using Species-Specific QPCR. PLoS ONE 2020, 15, e0232049. [Google Scholar] [CrossRef]
- Revellame, E.D.; Fortela, D.L.; Sharp, W.; Hernandez, R.; Zappi, M.E. Adsorption Kinetic Modeling Using Pseudo-First Order and Pseudo-Second Order Rate Laws: A Review. Clean. Eng. Technol. 2020, 1, 100032. [Google Scholar] [CrossRef]
- Firth, A.G.; Brooks, J.P.; Locke, M.A.; Morin, D.J.; Brown, A.; Baker, B.H. Dynamics of Soil Organic Carbon and CO2 Flux under Cover Crop and No-Till Management in Soybean Cropping Systems of the Mid-South (USA). Environments 2022, 9, 109. [Google Scholar] [CrossRef]
- Xiao, Y.; Huang, Z.; Lu, X. Changes of Soil Labile Organic Carbon Fractions and Their Relation to Soil Microbial Characteristics in Four Typical Wetlands of Sanjiang Plain, Northeast China. Ecol. Eng. 2015, 82, 381–389. [Google Scholar] [CrossRef]
- Zhang, L.; Chen, X.; Xu, Y.; Jin, M.; Ye, X.; Gao, H.; Chu, W.; Mao, J.; Thompson, M.L. Soil Labile Organic Carbon Fractions and Soil Enzyme Activities after 10 Years of Continuous Fertilization and Wheat Residue Incorporation. Sci. Rep. 2020, 10, 11318. [Google Scholar] [CrossRef]
- Peng, L.; Tang, C.; Zhang, X.; Duan, J.; Yang, L.; Liu, S. Quantifying the Effects of Root and Soil Properties on Soil Detachment Capacity in Agricultural Land Use of Southern China. Forests 2022, 13, 1788. [Google Scholar] [CrossRef]
- De Carvalheiro, K.O.; Nepstad, D.C. Deep Soil Heterogeneity and Fine Root Distribution in Forests and Pastures of Eastern Amazonia. Plant Soil 1996, 182, 279–285. [Google Scholar] [CrossRef]
- Benbi, D.K.; Brar, K.; Toor, A.S.; Singh, P. Total and Labile Pools of Soil Organic Carbon in Cultivated and Undisturbed Soils in Northern India. Geoderma 2015, 237–238, 149–158. [Google Scholar] [CrossRef]
- Yan, Z.; Liu, C.; Todd-Brown, K.E.; Liu, Y.; Bond-Lamberty, B.; Bailey, V.L. Pore-Scale Investigation on the Response of Heterotrophic Respiration to Moisture Conditions in Heterogeneous Soils. Biogeochemistry 2016, 131, 121–134. [Google Scholar] [CrossRef]
- Hoffland, E.; Kuyper, T.W.; Comans, R.N.J.; Creamer, R.E. Eco-Functionality of Organic Matter in Soils. Plant Soil 2020, 455, 1–22. [Google Scholar] [CrossRef]
- Vicena, J.; Ardestani, M.M.; Baldrian, P.; Frouz, J. The Effect of Microbial Diversity and Biomass on Microbial Respiration in Two Soils along the Soil Chronosequence. Microorganisms 2022, 10, 1920. [Google Scholar] [CrossRef] [PubMed]
- Fujisaki, K.; Perrin, A.-S.; Desjardins, T.; Bernoux, M.; Balbino, L.C.; Brossard, M. From Forest to Cropland and Pasture Systems: A Critical Review of Soil Organic Carbon Stocks Changes in Amazonia. Glob. Chang. Biol. 2015, 21, 2773–2786. [Google Scholar] [CrossRef]
- Suzuki, L.E.A.S.; Reinert, D.J.; Secco, D.; Fenner, P.T.; Reichert, J.M. Soil Structure under Forest and Pasture Land-Uses Affecting Compressive Behavior and Air Permeability in a Subtropical Soil. Soil Syst. 2022, 6, 98. [Google Scholar] [CrossRef]
- Yang, C.; Liu, N.; Zhang, Y. Soil Aggregates Regulate the Impact of Soil Bacterial and Fungal Communities on Soil Respiration. Geoderma 2019, 337, 444–452. [Google Scholar] [CrossRef]
- Seó, H.L.S.; Machado Filho, L.C.P.; Brugnara, D. Rationally Managed Pastures Stock More Carbon than No-Tillage Fields. Front. Environ. Sci. 2017, 5, 87. [Google Scholar] [CrossRef]
- Frey, B.; Walthert, L.; Perez-Mon, C.; Stierli, B.; Köchli, R.; Dharmarajah, A.; Brunner, I. Deep Soil Layers of Drought-Exposed Forests Harbor Poorly Known Bacterial and Fungal Communities. Front. Microbiol. 2021, 12, 674160. [Google Scholar] [CrossRef]
- Celestina, C.; Wood, J.L.; Manson, J.B.; Wang, X.; Sale, P.W.G.; Tang, C.; Franks, A.E. Microbial Communities in Top- and Subsoil of Repacked Soil Columns Respond Differently to Amendments but Their Diversity Is Negatively Correlated with Plant Productivity. Sci. Rep. 2019, 9, 8890. [Google Scholar] [CrossRef]
- Suominen, S.; van Vliet, D.M.; Sánchez-Andrea, I.; van der Meer, M.T.J.; Sinninghe Damsté, J.S.; Villanueva, L. Organic Matter Type Defines the Composition of Active Microbial Communities Originating From Anoxic Baltic Sea Sediments. Front. Microbiol. 2021, 12, 628301. [Google Scholar] [CrossRef]
- Lu, Y.; Xu, H. Distribution Characteristic of Soil Organic Carbon Fraction in Different Types of Wetland in Hongze Lake of China. Sci. World J. 2014, 2014, 487961. [Google Scholar] [CrossRef]
- Rui, Y.; Murphy, D.V.; Wang, X.; Hoyle, F.C. Microbial Respiration, but Not Biomass, Responded Linearly to Increasing Light Fraction Organic Matter Input: Consequences for Carbon Sequestration. Sci. Rep. 2016, 6, 35496. [Google Scholar] [CrossRef]
- Hao, J.; Chai, Y.N.; Lopes, L.D.; Ordóñez, R.A.; Wright, E.E.; Archontoulis, S.; Schachtman, D.P. The Effects of Soil Depth on the Structure of Microbial Communities in Agricultural Soils in Iowa (United States). Appl. Environ. Microbiol. 2021, 87, e02673-20. [Google Scholar] [CrossRef] [PubMed]
- Brangarí, A.C.; Lyonnard, B.; Rousk, J. Soil Depth and Tillage Can Characterize the Soil Microbial Responses to Drying-Rewetting. Soil Biol. Biochem. 2022, 173, 108806. [Google Scholar] [CrossRef]
- Li, M.; Meador, T.; Sauheitl, L.; Guggenberger, G.; Angst, G. Substrate Quality Effects on Stabilized Soil Carbon Reverse with Depth. Geoderma 2022, 406, 115511. [Google Scholar] [CrossRef]
- Terzaghi, E.; Alberti, E.; Raspa, G.; Zanardini, E.; Morosini, C.; Anelli, S.; Armiraglio, S.; Di Guardo, A. A New Dataset of PCB Half-Lives in Soil: Effect of Plant Species and Organic Carbon Addition on Biodegradation Rates in a Weathered Contaminated Soil. Sci. Total Environ. 2021, 750, 141411. [Google Scholar] [CrossRef]
- Gougoulias, C.; Clark, J.M.; Shaw, L.J. The Role of Soil Microbes in the Global Carbon Cycle: Tracking the below-Ground Microbial Processing of Plant-Derived Carbon for Manipulating Carbon Dynamics in Agricultural Systems: Role of Soil Microbes in Global Carbon Cycle: Carbon Tracking & Agro-Cosystem Management. J. Sci. Food Agric. 2014, 94, 2362–2371. [Google Scholar] [CrossRef] [PubMed]
- Hou, J.; Dijkstra, F.A.; Zhang, X.; Wang, C.; Lü, X.; Wang, P.; Han, X.; Cheng, W. Aridity Thresholds of Soil Microbial Metabolic Indices along a 3,200 Km Transect across Arid and Semi-Arid Regions in Northern China. PeerJ 2019, 7, e6712. [Google Scholar] [CrossRef] [PubMed]
- Feketeová, Z.; Hrabovský, A.; Šimkovic, I. Microbial Features Indicating the Recovery of Soil Ecosystem Strongly Affected by Mining and Ore Processing. Int. J. Environ. Res. Public Health 2021, 18, 3240. [Google Scholar] [CrossRef]
- Ding, Z.J.; Shi, Y.Z.; Li, G.X.; Harberd, N.P.; Zheng, S.J. Tease out the Future: How Tea Research Might Enable Crop Breeding for Acid Soil Tolerance. Plant Commun. 2021, 2, 100182. [Google Scholar] [CrossRef] [PubMed]
- Holland, J.E.; Bennett, A.E.; Newton, A.C.; White, P.J.; McKenzie, B.M.; George, T.S.; Pakeman, R.J.; Bailey, J.S.; Fornara, D.A.; Hayes, R.C. Liming Impacts on Soils, Crops and Biodiversity in the UK: A Review. Sci. Total Environ. 2018, 610–611, 316–332. [Google Scholar] [CrossRef] [PubMed]
- Barcelos, J.P.Q.; Mariano, E.; Jones, D.L.; Rosolem, C.A. Topsoil and Subsoil C and N Turnover Are Affected by Superficial Lime and Gypsum Application in the Short-Term. Soil Biol. Biochem. 2021, 163, 108456. [Google Scholar] [CrossRef]
- Cao, Y.; Xu, L.; Zhang, Z.; Chen, Z.; He, N. Soil Microbial Metabolic Quotient in Inner Mongolian Grasslands: Patterns and Influence Factors. Chin. Geogr. Sci. 2019, 29, 1001–1010. [Google Scholar] [CrossRef]
- Wardle, D.A.; Ghani, A. A Critique of the Microbial Metabolic Quotient (QCO2) as a Bioindicator of Disturbance and Ecosystem Development. Soil Biol. Biochem. 1995, 27, 1601–1610. [Google Scholar] [CrossRef]
- Feng, J.; Zeng, X.-M.; Zhang, Q.; Zhou, X.-Q.; Liu, Y.-R.; Huang, Q. Soil Microbial Trait-Based Strategies Drive Metabolic Efficiency along an Altitude Gradient. ISME Commun. 2021, 1, 71. [Google Scholar] [CrossRef]
- Liao, C.; Li, D.; Huang, L.; Yue, P.; Liu, F.; Tian, Q. Higher Carbon Sequestration Potential and Stability for Deep Soil Compared to Surface Soil Regardless of Nitrogen Addition in a Subtropical Forest. PeerJ 2020, 8, e9128. [Google Scholar] [CrossRef]
- Tahir, S.; Marschner, P. Clay Addition to Sandy Soil—Influence of Clay Type and Size on Nutrient Availability in Sandy Soils Amended with Residues Differing in C/N Ratio. Pedosphere 2017, 27, 293–305. [Google Scholar] [CrossRef]


Disclaimer/Publisher’s Note: The statements, opinions and data contained in all publications are solely those of the individual author(s) and contributor(s) and not of MDPI and/or the editor(s). MDPI and/or the editor(s) disclaim responsibility for any injury to people or property resulting from any ideas, methods, instructions or products referred to in the content. |
© 2023 by the authors. Licensee MDPI, Basel, Switzerland. This article is an open access article distributed under the terms and conditions of the Creative Commons Attribution (CC BY) license (https://creativecommons.org/licenses/by/4.0/).