Abstract
Since China acceded to the WTO, the industrial economy of urban areas has experienced a prosperous phase. However, disturbed by the global financial crisis and reverse globalization since 2008, the past crude development path has been unsustainable. Therefore, it is urgent and necessary to improve industrial resilience to avoid falling into a declining trap. This study integrates multi-source spatiotemporal information such as enterprise big data and panel data using the methods of GIS spatial analysis, complex network analysis, and multi-indicator comprehensive evaluation to evaluate the industrial economic resilience of Taihu Lake Basin (TLB). Resistance indicators such as resistance sensitivity, industrial land area, and regional economic connections are used to evaluate the resistance ability of the industrial economy in the TLB during the 2008 financial crisis and the 2018 Sino-US trade conflict. Resistance sensitivity and independent innovation ability are introduced to assess the recovery ability after two rounds of shocks, and comprehensive economic resilience is evaluated based on the entropy weighting method. The results show that in the face of the two economic shocks, the industrial economy in the TLB is increasingly vulnerable to external economic shocks and has a significantly stronger ability to adapt to economic shocks. Under successive shocks, the industrial economy of the TLB continues to transition to a new path of innovation, which contributes to higher value-added and more efficient use of industrial land. Shanghai and Suzhou, which not only have shown strong economic resilience of their own but are also centers of independent innovation in the TLB, badly need to further reduce their reliance on low-end manufacturing in the future. Among the other cities, Huzhou and Zhenjiang show the highest level of resilience, while Changzhou, Wuxi, and Jiaxing are at the middle level, and Hangzhou is evaluated as the city with the lowest industrial economic resilience. Changzhou and Wuxi need to further increase the technical complexity of their industrial products, while Jiaxing, Huzhou, and Zhenjiang are supposed to strengthen their economic connections with Shanghai, Suzhou, and Hangzhou to expand the industrial scale further. Although Hangzhou shows the lowest comprehensive resilience, it still has a catalytic role to play in the development of industrial land and the upgrading and transformation of manufacturing in Jiaxing and Huzhou.
1. Introduction
Since the 1990s, China has seized the historical opportunity of large-scale global industrial transfer and entered into a rapid industrialization period, not only establishing a modern industrial system with a full range of categories and leaping to become the world’s top manufacturing country but also seeking to transform into a technology-intensive manufacturing country. However, after the outbreak of the financial crisis in 2008, the shrinking of international market demand and the sharp decline in orders from manufacturing enterprises had a serious impact on China’s export-oriented economy, resulting in a slowdown in economic growth, a massive loss of labor and a wave of business closures [1,2,3]. In the past three years, with the COVID-19 virus ravaging the world and ongoing international trade conflicts, the low-end manufacturing economy of China has been facing triple pressures of demand contraction, supply shock, and weakening expectations [4]. Industry, especially manufacturing, is not only the backbone of the national economy and an important manifestation of national creativity, competitiveness, and comprehensive national power but also a source of livelihood and material security for nonagricultural laborers. Some regions have emerged from the shock of the industrial economic system quickly and achieved a new development path, while others have declined [5,6,7]. How to enhance the economic resilience of the industrial economic system of each region in the face of risk perturbations, achieve the upgrading and transformation of industrial structure, and avoid falling into a decline predicament is an urgent issue that scholars and local governments need to address at present.
Economic resilience is an important indicator of urban economic development and has been used to analyze urban economies’ response mechanisms and their stability in the face of risky disruptions. Influenced by the idea of equilibrium theory, economic resilience was first considered the rate at which a region returns to its initial equilibrium state after a shock or the ability of a region to maintain the stability of its system under an external crisis [8]. With the widespread application of complex systems theory in social-ecological systems research, the traditional kernel emphasizing the restoration of equilibrium gradually changed to describe the evolutionary capacity of the system when exposed to different levels of shocks or stresses. As a result, adaptive resilience has replaced engineering resilience and ecological resilience as the mainstream view. Influenced by this, resilience research in the field of economics also goes beyond the traditional view of resisting disturbances and restoring past functions and pays more attention to the system’s ability to balance and adapt to external shocks and the ability to transform to achieve new development paths [9]. Based on adaptive resilience theory, urban economies will gradually form path dependence and negative lock-in during learning from each other as well as their evolution. The external shocks they face are usually regarded as necessary conditions to unlock the state [10,11,12] and promote the region to seek new industrial development directions, as well as the formation of new institutions and the use of new technologies. Compared with traditional economic resilience theory, adaptive resilience not only emphasizes the economic adjustment capacity of individual cities but also focuses on how cities can strengthen the readiness of intercity symbiotic networks, the resistance to adapt to economic risk perturbations, and the resilience to achieve collaborative urban transformation and development at the macroscopic scale through cross-regional industrial interaction and structural adjustment strategies [13,14,15].
The current assessment methods for economic resilience are mainly divided into multi-indicator comprehensive evaluation methods and core variable evaluation methods [16]. The former methods usually construct a measurement system that includes macroeconomic stability, micro-market efficiency, economic governance, and social development. Then, weights are assigned to comprehensively evaluate the resilience characteristics of the economic system, which focuses on the structural characteristics of the socioeconomic system, such as connectivity, redundancy, diversification, and collaboration [17,18], and indirectly reflects the ability of the economic system to react to future crises. However, the selection of evaluation indicators is often highly subjective due to the lack of distinction among the types of crises and the summarization of the response mechanisms of the economic system [16]. In contrast, the latter reflects the level of economic resilience by adopting a single variable, such as the urban unemployment rate, total GDP, or GDP growth rate, to reflect the sensitive performance of the economic system at different stages before, during, and after the crisis. In other words, this method quantifies the difference between the actual and expected performance of the economic system from the perspective of the whole system [19,20]. However, the core variable evaluation method cannot explain the reasons for the differences in the resilience of different regions in the face of economic shocks and usually requires an in-depth analysis of the intrinsic influence mechanisms of economic resilience using shift-share decomposition methods or models such as geographic probes [9,21,22]. However, even so, the existing research is still inadequate in explaining the resilience ability of the economic system to transfer to high-quality development [23]. In other words, it is difficult to reflect the change in the internal innovation development capacity and industrial structure of the economic system under the effect of shocks by the sensitivity change of the single variables. To more comprehensively evaluate the resilience performance of the economic system when facing severe sudden shocks or long-term slow-burning, some scholars have chosen to combine the advantages of the two methods, on the one hand, decomposing economic resilience into resilience characteristics at different stages before and after the disturbance or before, during and after the disturbance, which is inherited from the core variable method, and on the other hand constructing a multi-indicator system to quantify the resilience characteristics at different stages separately [7,24]. In summary, the existing economic resilience studies have the following limitations: (1) the research object is usually the overall resilience of the urban economy but is less focused on the development of the industrial economy; (2) the research objective is often to evaluate the economic resilience of a region under a single disturbance event, which cannot effectively reflect the adaptive evolution of its economic system in this shock; (3) the research methods often choose the core variable method or multi-indicator evaluation methods, each of which cannot comprehensively reflect the economic system’s resistance, adaptive capacity and ability to leap to a high-quality development path under each crisis cycle; and (4) research data mostly rely only on socioeconomic panel data, which can hardly reflect the evolutionary characteristics of the industrial economic system at the micro level.
This study aims to construct a comprehensive evaluation method for industrial economic resilience based on the theory of adaptive resilience. Based on the evaluation results, we provide effective suggestions for the development of industrial economic resilience in the Taihu Lake Basin (TLB) to cope with the increasingly complex development environment. TLB is located in the core region of the Yangtze River Delta and is relatively independent in terms of geographical environment. In recent years, the Chinese government has made efforts to build a unified domestic market. In this context, industrial restructuring, industrial layout optimization and cross-provincial economic cooperation, and industrial spatial integration in the TLB, which is located at the border of Zhejiang Province, Jiangsu Province, and Shanghai City, have exemplary effects on the whole country. However, the impact of perturbing factors such as the COVID-19 epidemic, the Sino-US trade war, and the restriction of carbon emissions in recent years have made the internal and external environment of industrial economic development in the TLB increasingly complex. Therefore, this study will take the TLB as an actual research object, combine the traditional core variable method and multi-indicator evaluation method, and evaluate the changes in the resilience level of its industrial economy under different disturbance events based on multiple types of information, such as socioeconomic panel data and Tianyancha enterprise data. Based on the total industrial output value above the scale of macro variables, this paper first makes a horizontal and vertical comparison of the industrial economic development status of the Taihu Basin urban agglomeration and selects two-time nodes, the 2008 international financial crisis and the 2018 Sino-US trade war, to make a comparative study on the changes in the resilience level of the industrial economy of the Taihu Basin. In addition, referring to the practices of Sun Hui [7,24] and other scholars, the core variable evaluation method was combined with the multi-index comprehensive evaluation method. From the perspective of time sequence development, the resistance ability of the industrial economic system in each region before risk disturbance and the recovery and evolution ability after risk disturbance were respectively evaluated. Finally, based on the comprehensive performance of industrial economic resilience of various cities, the trend and structure of industrial spatial expansion, and the analysis of regional development linkages, we provide targeted suggestions for industrial spatial integration development to enhance economic resilience from the perspective of spatial evolution.
2. Data Sources and Methodology
2.1. Overview of the Industrial Evolution of the TLB
As shown in Figure 1, the TLB spans Shanghai, Jiangsu, and Zhejiang, with a total area of 36,895.00 km2, accounting for 0.38% of the national land area. Except for the sporadic distribution of mountains in Anhui Province, Shanghai, Jiangsu, and Zhejiang provinces account for more than 99.00%. In 2018, the total population of the TLB was 61.04 million, accounting for 4.4% of China’s total population. The GDP of the TLB is 87.63 billion RMB, accounting for 9.7% of China’s GDP. The TLB is one of the most economically developed regions and one of the most densely populated regions by human activities in China [25].

Figure 1.
The extent map and elevation of the TLB.
The TLB is the “growth pole and engine” of China’s economic and social development, but its economic system is often affected by various shocks. Since China’s accession to the WTO in December 2001 and until the financial crisis in 2008, the average growth rate of the total industrial output value above the scale of the cities in the TLB was 25.12%, which was higher than the national average growth rate of the total industrial output value in that period. Then, the growth rate of the industrial economy slowed down to 3.12%, lower than the national average growth rate. Benefiting from the proactive fiscal policy and moderately accommodative monetary policy, as well as the package to address the crisis and promote development, China’s economy quickly returned to a high-speed development track, and the overall industrial output growth rate in the TLB also increased to 22.23%, again exceeding the national average growth rate. However, Figure 2 shows that the impact of the global financial crisis on the economy of the TLB did not disappear, the cities experienced a slowdown in industrial growth between 2010 and 2016, and the negative impact was not eliminated until 2016. After 2016, the overall growth rate of the industrial economy of the TLB increased, but with the opening of the trade war between China and the United States in 2018, industrial export trade was hit again, and in 2008 and 2009, the total industrial output value was affected. After 2019, the growth rate of the total industrial output value increased to the national average. In summary, this study regards 2008–2009 and 2017–2019 as the resistance phases of these two shocks and 2009–2016 and 2019–2020 as the recovery phases of the two shocks and evaluates the industrial economic sensitivity of the city group in the TLB based on these two periods.

Figure 2.
The total industrial output value above the scale (million yuan) of TLB.
2.2. Preprocessing of Research Data
This study uses multi-source big data to quantitatively analyze the resilience of the industrial economic system of each city. The data sources and time ranges of each category of data as well as the data applications in this study, are shown in Table 1. Among them, the global annual urban dynamics (GAUD) dataset is updated to 2015, but observing the overlay of this dataset with the remote sensing images in 2020, these data still almost reflect the extent of the built-up area in 2020. Therefore, this study extracted industrial land based on the GAUD dataset in recent years.

Table 1.
The introduction of research data.
To facilitate the subsequent extraction of each economic resilience index, the main data sources are first processed(Figure 3): (1) clip the GAUD dataset and OSM road network by mask to extract the urban construction land and road network within the study area; (2) perform vectorization on the enterprise big data to generate the points of interest (POIs) for industrial enterprises and present the investment and financing relationship among enterprises as the form of an economical connection network; and (3) sort and classify the industrial output value of each type of industry above the scale in the past years according to the time series.

Figure 3.
Pre-processes for main data sources.
2.3. Research Methodology
2.3.1. Construction of the Industrial Economic Resilience Evaluation Index System
This study evaluates the resistance ability of each region’s industrial economy facing risk perturbations based on the resistance sensitivity index [20], industrial land area, economic connection degree [28], and economic structure characteristics [29] and evaluates the recovery ability of the industrial economic system after risk perturbations based on recovery sensitivity [20] and regional independent innovation ability [30]. The reasons for selecting each evaluation indicator are shown in Table 2.
Table 2.
Industrial economic resilience evaluation index system.
2.3.2. Calculation of Industrial Economic Resilience Indicators
- Resistance sensitivity index and recovery sensitivity index
Based on the changes in the growth rate of total industrial output above the scale of each city in the TLB, the economic shock period is divided into the resistance phase and recovery phase, and the resistance-sensitive index and recovery-sensitive index of the cities are measured separately [20]. The calculation formula is as follows.
where denotes the expected value of change in the total industrial output above the scale of the city during the resistance or recovery phase [,]; denotes the total industrial output value above the scale of the city in the industry in year ; and denotes the rate of change in the total industrial output value above the scale of the country in the period [,]. The formulas for urban resistance sensitivity , and resilience sensitivity are as follows:
where and represent the actual changes in the total industrial output value above the scale in the resistance phase and recovery phase, respectively, and and represent the expected values of changes in the total industrial output value above the scale in the resistance phase and recovery phase.
- Industrial land over the years and industrial technological complexity
Firstly, convert the format of urban construction land into a shapefile polygon, extract the main urban road network from the OSM road network, and clip and split the shapefile polygon based on the OSM road network to obtain the distribution of street blocks. Finally, overlay analysis is performed to assign information such as the category and year of establishment of manufacturing enterprises to each street block and screen out industrial land from them, and the extraction process is shown in Figure 4.

Figure 4.
Industrial Land Extraction Process.
After completing the overlay analysis operation, the basic information of manufacturing enterprises corresponding to each block is extracted for statistics, including the earliest and latest moving-in time of the enterprises on each block, as well as the manufacturing sector with the largest number of moving-in, which are calculated as follows.
where denotes the registration year of the enterprise in block , and denotes the registered category of the enterprise. Take the maximum value of as the most recent development time of block and the minimum value of as the earliest development time of block . In addition, the manufacturing category with the largest number is taken as the main industrial category of the block.
Hausmann et al. proposed the concept of technological complexity to measure the technological content of a country’s export goods, assuming that the technical content of export products is related to the per capita income level of the exporting country [31]. Hao et al. calculated the technical complexity of industrial exports in 30 provincial regions of China (excluding Tibet) based on export data of 29 industrial subsectors from 2007–2016 [32]. The thresholds have been set based on the manufacturing technology classification standards of the Organization for Economic Cooperation and Development to classify manufacturing industries into high-technology, medium-high technology, medium-technology, and low-technology industries.
where represents the industry, represents the year, and represents the province; represents technological complexity; represents real GDP per capita; and represents the share of exports of industry in province in total manufacturing exports in province in year . represents the sum of the share of exports of industry in the total manufacturing exports of each province in year . This study directly cites the mean technical complexity and grading thresholds of each manufacturing industry in the paper of Hao et al. to calculate the average industry technical complexity of each block and classify them into low, medium, medium-high, and high levels.
After that, the mean value of the technical complexity of all manufacturing enterprises in each block is calculated to represent the independent innovation ability of the block. Referring to the grading thresholds of each manufacturing technology complexity level proposed by Hao et al., the average industry technology complexity of each block is divided into four levels: low, medium, medium-high, and high, which are calculated as follows [32].
where represents the mean technology complexity of manufacturing enterprises in the block and represents the graded result, represents the complexity of manufacturing enterprises which are located in the block, and represents the total number of manufacturing enterprises in the block.
- Economic network centrality degree
The existing studies on regional economic connections usually use gravity models to measure the regional interaction effect, taking into account factors such as the number of non-agricultural populations, GDP, and the spatial distance between the target objects [33,34]. However, such indicators can only reflect the probability of generating economic connections between the two regions and cannot be used as a basis to reflect the actual economic relationship. This study establishes an industrial economic network based on the actual investment and financing information from the Tianyancha platform. For this purpose, the total amount of interregional industrial investment and financing is first calculated based on the Equation (10).
where represents the investment amount of a manufacturing enterprise located in city to city ; represents the total amount of all industrial investment from city to city . The centrality degree of the complex network model is used to indicate the pivotal characteristics of towns or cities in the investment and financing network. Taking each city as a node and the normalized results of total industrial investment between regions as weighted values, a directed graph model is constructed, and the degree centrality of its nodes is calculated by the following Equation (11).
where represents the weighted sum of the node’s inflow degree and outflow degree, and is the total number of associated nodes of node .
- Relative diversity index and relative specialization index
The relative level of industrial specialization is measured using the location entropy index [35], which is applied to assess the distribution of factors among regions and the degree of agglomeration of dominant industries with the following Equation (12).
where is the specialization index of region , which is also the maximum location entropy value of the region; is the selected economic indicator of industry in region ; represents the total selected economic indicators of all industries in region ; and represents the total selected economic indicators of all industries in the region and denotes the total selected economic indicators of all industries in all regions. Based on socioeconomic panel data, the output value of each category of the industry is used as the basic economic indicator for calculating the location entropy index. In addition, regarding previous research methods [36,37,38], the formula for calculating the relative diversity index of each town and city within the urban group in the TLB is constructed as follows.
where is the proportion of the selected economic indicator of the city in industry to the total economic indicator of this city. is the proportion of economic indicators of other regions except for city in industry to the total economic indicator of the corresponding region. The annual output value of each industry in each city is used as the base economic indicator for calculating and .
2.3.3. Comprehensive Measurement of Economic Resilience
The weights of each resilience indicator under a specific shock scenario are determined by the entropy weighting method, and then the level of industrial economic resilience of the evaluation object is calculated based on the analytic hierarchy process method. The resilience indicators under various shock scenarios are classified into positive and negative factors, with larger values of the positive factors indicating higher resilience levels and smaller values of the negative factors indicating higher resilience levels. The positive and negative factors are first normalized in a dimensionless format, and the values of the indicators are in the range of [0, 1]. The normalized result is calculated as shown in the Equations (14) and (15) [36,37,38].
Positive factors:
Negative factors:
where is the normalized result and indicates the original value of the evaluation indicator. and are the maximum and minimum values of indicator respectively. is the information entropy value. The greater the information value , the more important it is, which means that the indicator is given more weight in the resilience assessment. In addition, is the proportion of region i on indicator .
The weight value of indicator is calculated as follows:
The economic resilience indicator of the city () was calculated as follows:
3. Results
3.1. An Evolutionary Comparison of Resistance in Industrial Economies
3.1.1. Resistance Sensitivity
A comparison of the actual growth and expected growth of the total industrial output value above the scale of each city in the TLB under the two rounds of shocks is shown in Figure 5, and the results of the resistance sensitivity index are shown in Figure 6. Under the 2008 global financial crisis, Jiaxing, Hangzhou, Shanghai, and Wuxi, the cities in the TLB, grew slower than expected in terms of total industrial output value above scale, with a negative resistance sensitivity. Suzhou, Zhenjiang, Huzhou, and Changzhou, on the other hand, grew more than expected and showed positive resilience sensitivity, demonstrating strong resistance and adaptability. During the 2018 shock, Changzhou and Zhenjiang’s sensitivity indexes turn from positive to negative with a large change, indicating that cities with smaller economic foundations may show completely different resilience performances under different crisis disruptions. Cities with larger economic foundations, such as Suzhou and Shanghai, usually have more stable resilience characteristics under different disruptions. However, due to their economic growth slowdown, they usually tend to have lower actual growth than expected changes when facing various major disruptions and show negative resilience sensitivity. Overall, as the foundation of the industrial economy in the TLB increases and the level of openness abroad increases the overall resistance sensitivity index decreases and becomes more vulnerable to changes in the external environment.

Figure 5.
(a) Total industrial output growth in practice compared to expected growth in 2008–2009 (10 thousand Yuan); (b) Total industrial output growth in practice compared to expected growth in 2018–2019 (10 thousand Yuan).

Figure 6.
(a) Resistance Sensitivity Index in 2008; (b) Resistance Sensitivity Index in 2018.
3.1.2. Industrial Foundations
The distribution of industrial land in the TLB in 2008 and 2018 is shown in Figure 7, and the total area of industrial land in each city is shown in Figure 8. In Figure 7, from 2008 to 2018, the industrial land in Shanghai grew slowly, and the urban boundary tended to be stable, while the industrial land in Jiangsu grew faster, but not in a “pie-spreading” manner: (1) each city strengthened the renewal, and the development of the industrial land had been roughly expanded in the past; (2), and each city strengthened inter-regional collaboration, moved toward specific directions, and established clusters of special industries. The expansion of industrial land in the Zhejiang part of the TLB is slower than in the Jiangsu part, and the scale of industrial land in each region is generally smaller. Among them, the central and northern industrial land in Jiaxing and Huzhou is based on the original core and continues to expand toward all directions to the periphery, such as Jiashan County and Pinghu City in Jiaxing, as well as Changxing County and Wuxing District in Huzhou. In contrast, Yuhang District in Hangzhou, Haining City in Jiaxing, and the southern part of Tongxiang City show a stronger trend of integration.

Figure 7.
Comparison of the spatial distribution of industrial land in the TLB in 2008 and 2018.

Figure 8.
(a) Spatial scale of industrial land in 2008 (km2); (b) Spatial scale of industrial land in 2018 (km2).
3.1.3. Regional Investment and Financing Connections
The industrial investment and financing network among districts and counties in the TLB in 2008 and 2018 is shown in Figure 9, and the regional economic connection degree among each city and the other cities is shown in Figure 10. Figure 9 shows that the overall change in the investment and financing network among industrial enterprises from 2008 to 2008 is not significant, and enterprises generally choose neighboring cities as their destinations. For example, Shanghai’s investment expansion to external regions forms two expansion paths: (1) to the core areas of Suzhou-Wuxi-Changzhou metropolitan areas and Zhenjiang, with the degree of close industrial economic connections between the regions; (2) to Jiaxing and Hangzhou, but the degree of inter-regional industrial economic connections is weaker in this direction. Suzhou, Wuxi, and Changzhou have closer economic cooperation and higher external economic connections than other cities, with a strong trend of integration. In addition, from 2008–2018, the economic connections between Hangzhou and other cities in the TLB have become more frequent, and it not only has more intensive industrial investment and financing connections with Shanghai but also has a certain amount of economic radiation to Huzhou, Jiaxing, and Zhenjiang.
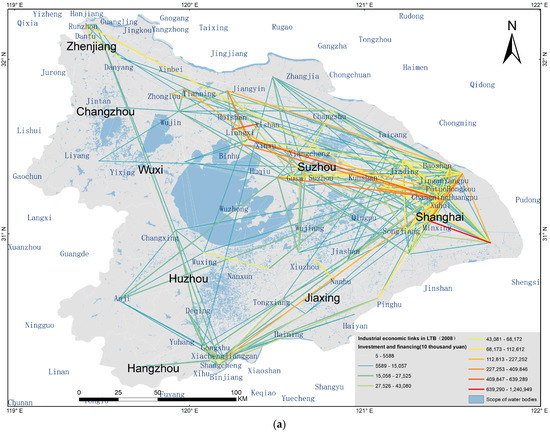

Figure 9.
(a) Regional economic connection networks in the TLB, 2008; (b) Regional economic connection networks in the TLB, 2018.

Figure 10.
(a) Regional economic connection degree in 2008; (b) Regional economic connection degree in 2018.
3.1.4. Industrial Economic Structure
The relative diversity and relative specialization of industries in each city in the TLB are calculated as shown in Figure 11. Among them, Shanghai, Hangzhou, Suzhou, and Wuxi are becoming more mature in their manufacturing market structure and tend to be fixed in their supply chain roles, and their industrial specialization and diversity are gradually falling. In contrast, inland cities such as Zhenjiang, Huzhou, Jiaxing, and Changzhou have long been actively involved in the division of labor and knowledge sharing in the Nanjing Metropolitan circle, Hangzhou Metropolitan circle, and Suzhou-Wuxi-Chanzhou Metropolitan circle, taking on the spillover of low-end industries and manufacturing capital investment from Hangzhou, Shanghai, and Suzhou. Facing the economic risks imported from abroad, Zhenjiang and other cities have a resilient advantage in terms of relative industrial diversity and relative specialization.

Figure 11.
(a) Relative-specialization index in 2008; (b) Relative-specialization index in 2018; (c) Relative-diversity index in 2008; (d) Relative-diversity index in 2018.
3.2. An Evolutionary Comparison of Recovery in Industrial Economies
3.2.1. Recovery Sensitivity
A comparison of the actual and expected growth of the above-scale industrial output value of the cities in the TLB during the recovery phase of the two rounds of shocks is shown in Figure 12, and a comparison of the recovery sensitivity index of each city is shown in Figure 13. In the recovery phase after the international financial crisis in 2008, Shanghai, Hangzhou, Suzhou, and Wuxi showed negative values of recovery sensitivity, while Jiaxing, Zhenjiang, Huzhou, and Changzhou showed positive values of recovery sensitivity, which is similar to the distribution of resistance sensitivity in the same time. In the context of the 2018 Sino-US trade friction, the overall resilience sensitivity of the TLB shifted to positive values, and the industrial economy of the TLB was able to rebound above the national average, indicating that after the financial crisis in 2008, the ability of TLB to adapt to economic risks has increased significantly.

Figure 12.
(a) Total industrial output growth in practice compared to expected growth in 2009–2016 (10 thousand Yuan); (b) Total industrial output growth in practice compared to expected growth in 2019–2020 (10 thousand Yuan).

Figure 13.
(a) Recovery Sensitivity Index of 2008; (b) Recovery Sensitivity Index of 2018.
3.2.2. Independent Innovation Ability
The distribution of the technical complexity of the industrial blocks in the TLB is shown in Figure 14, and the average technology complexity of each city is shown in Figure 15. After the financial crisis in 2008, the upgrading of manufacturing industries and regional collaboration in each region have continuously intensified, and the industrial economic system of each region in the TLB as a whole has been transforming from low value-added industry dominant to high value-added industry dominant. However, there are still large differences in the development levels of manufacturing industries in different regions. Among them, manufacturing enterprises with high technical complexity are mainly concentrated in Suzhou and its surrounding areas, while there are relatively fewer high-end manufacturing industries in Shanghai and Zhejiang. Firstly, Shanghai, which has the leading economic position in the Yangtze River Delta region, is not dominant in the high-value-added manufacturing industries and has reduced technology complexity. Secondly, the Suzhou-Wuxi-Changzhou metropolitan circle has become the backbone of manufacturing development at this phase, with their industrial land showing an integrated development trend, among which high-end manufacturing is mainly concentrated in the Suzhou metropolitan area, which gives Suzhou a central position in the integrated development. Wuxi and Changzhou have a larger scale of industrial land than those of Zhenjiang and cities such as Jiaxing and Huzhou. However, their industrial composition is still dominated by low-value-added manufacturing. Finally, compared with the Jiangsu region, the high-end manufacturing industry in Zhejiang is relatively weak. Most of the high-end manufacturing industries in Zhejiang are generally relatively small in scale, with only Yuhang District, Gongshu District, and Xiacheng District in the south of Hangzhou having a certain concentration of high-end manufacturing industries.
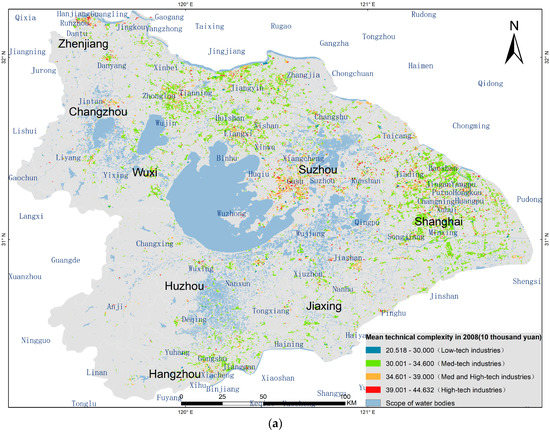

Figure 14.
(a) Average technological complexity of each industrial block in 2008; (b) Average technological complexity of each industrial block in 2018.

Figure 15.
(a) Mean technology complexity of 2008; (b) Mean technology complexity of 2018.
4. Discussion
According to the measurement method of comprehensive economic resilience described in Section 2.3.3, each resilience indicator has been given a weight using the entropy weighting method and weighted. In summary, the resistance ability, recovery ability, and comprehensive economic resilience of each city in the TLB in the face of the 2008 global financial crisis and the 2018 Sino-US trade friction are shown in Table 3. Based on the resilience performance of each city in the two disruptions, this study categorizes them into the following four categories: 1. Zhenjiang and Huzhou; 2. Shanghai and Suzhou; 3. Wuxi, Changzhou, and Jiaxing; and 4. Hangzhou.
Table 3.
Comprehensive Industrial Resilience Performance of the TLB Urban Agglomeration under the 2008 Financial Crisis and the 2018 Sino-US trade friction.
Huzhou and Zhenjiang have shown the strongest comprehensive economic resilience during the two economic shocks, mainly due to the relative diversity and relative specialization of the two cities. During the period when their economic foundations were small, and their developments were faster, their industrial outputs were still able to grow faster than the national average in the face of external disturbances. However, for the same reason, the resistance performance of Huzhou and Zhenjiang during the two shocks differs greatly, with Zhenjiang’s resistance sensitivity index in 2018 decreasing significantly relative to its level in 2008, while Huzhou’s resistance sensitivity in 2018 increased significantly. This indicates that when evaluating cities with a smaller economic foundation based on the core variable method, the assessment results are susceptible to differences in the stage of development of the economies themselves and are subject to a degree of coincidence. Based on the sensitivity of Huzhou and Zhenjiang and the overall performance of other socioeconomic indicators, this study concludes that Huzhou and Zhenjiang have a weak industrial economic foundation, low industrial efficiency, and lack of core technology and may still face challenges in the stable development of the industrial economy under the increasingly complex development environment. Relying on their good natural environmental resources, these two places can prioritize compensating for the shortcomings in industrial structure, innovation ability, and output efficiency and take the initiative to attract high value-added parts with high-carbon emission industries eliminated by cities in Shanghai, Suzhou, and Hangzhou to gather new development momentum and achieve leapfrog development.
Shanghai and Suzhou not only have strong economic resilience of their own but are also centers of independent innovation ability in the TLB. Even though the impact of an external economic crisis or internal industrial restructuring causes low-end industrial enterprises to go bankrupt for a short period and industrial land to be idle, they can still seek new development paths by integrating existing resources with their strong scientific and technological strength and a large number of highly qualified labor forces. As developed economies, Shanghai and Suzhou are significant forces for the entire TLB to resist domestic and international economic risk disruptions and achieve regional industrial evolution and upgrading. Shanghai and Suzhou should take the initiative to reduce the proportion of traditional manufacturing industries and accelerate the outward relocation of industries with high carbon emissions, high energy consumption, and low space utilization to Jiaxing, Zhenjiang, and Huzhou before the next round of crisis comes. At the same time, long-term plans should be promoted for the secondary development of industrial land, start-up or smaller-scale intelligent manufacturing enterprises should be supported and retained through land price subsidies, policy support, and financial support, and the cognitive distance among relative industries should be reasonably controlled to improve their economic anti-risk capacity further.
The comprehensive economic resilience of Wuxi, Changzhou, and Jiaxing are all in the middle of the urban groups in the TLB and are the backbone of the stable development of the industrial economy in the TLB. The performance of Wuxi and Changzhou in indicators such as economic foundation, regional economic connections, and dependence on foreign capital coupled with the intense investment and financing connections and human flows within the Suzhou-Wuxi-Changzhou metropolitan area show an integration development trend and thus a stronger overall resilience to risks in the face of financial crisis shocks. However, for the Suzhou-Wuxi-Changzhou metropolitan circle, industries with high added value, such as electrical machinery, electronic information, and transportation manufacturing, are mainly clustered in and around Suzhou. At the same time, Wuxi and Changzhou’s industrial categories are dominated by medium-high, medium, and low-end manufacturing industries, many of which are highly polluting enterprises. How to further achieve management integration and environmental integration based on industrial spatial integration is to continue to improve the economic resilience of the Suzhou-Wuxi-Changzhou metropolitan circle. In contrast, Jiaxing’s relative diversity and relatively high level of professionalism, but the industrial land scale is still relatively small, coupled with lower economic connections with other cities, and its comprehensive resilience capacity is close to that of Wuxi and Changzhou. With the inclusion of Jiashan County of Jiaxing into the Yangtze River Delta Integration Advance Demonstration Zone, its ecological space management level has improved significantly, and the polluted water bodies in traditional industrial areas such as the textile and garment industry and chemical fiber manufacturing industry have been effectively managed, exploring an eco-friendly development path compatible with multi-level manufacturing development for the late-developing areas in the TLB. The three cities have certain regional independent innovation capabilities while forming a cluster of collaborative industrial development with Shanghai and Suzhou, which is conducive to the optimization and upgrading of the manufacturing industry.
Hangzhou’s comprehensive economic resilience is relatively low, mainly because its economy is dominated by the tertiary sector, while the proportion and volume of the industrial economy are small, and its annual industrial output value above the scale is not only lower than that of Shanghai and Suzhou but also lower than that of Wuxi and other places. In addition, a large number of industrial lands and enterprises, as well as the external investment and financing connections in Hangzhou, are outside the TLB and are not included in the calculation of the resilience index, so the resistance ability, recovery ability, and comprehensive resilience are low. However, Hangzhou, as the capital of Zhejiang Province and the economic and innovation center of the Hangzhou metropolitan area, plays an important role in the stable development of the industrial economy, integrated development of industrial land, and development of high-tech industries in Jiaxing and Huzhou. Hangzhou needs to start from the top-level mechanism of the metropolitan area and coordinate development with neighboring cities in many fields. For example, from the aspect of infrastructure, focus on improving the connectivity between itself and neighboring cities in terms of transportation, natural gas, communication, and running water, and speed up the cross-city flow of talents, capital, resources, and services. From the aspect of cross-regional industrial cooperation, neighboring cities should be encouraged to establish industrial development zones that interface with Hangzhou to form a cooperation mechanism in which Hangzhou is responsible for publicity, business recruitment, design, and R&D, while neighboring cities are responsible for mass production, goods storage, and logistics. From the aspect of technical talent cultivation, encourage some secondary and higher education institutions to move to neighboring cities and promote the intelligent transformation of industries in each region by cultivating technical talent.
5. Conclusions
Based on a regional evolutionary perspective, this study combines socioeconomic panel data with big multivariate data to analyze the resilience characteristics of the urban industrial economy in the TLB under the two shocks of the 2008 international financial crisis and the 2018 Sino-US trade friction. The findings show that the resistance of the TLB declined slightly and resilience increased significantly in the face of externally imported economic risks and that it was able to optimize its industrial structure continuously, strengthen regional economic connections, and improve the complexity of industrial goods after the shocks, thus better adapting to the impact of future shocks. Among them, Huzhou and Zhenjiang showed strong economic resilience during the two shocks, but their industrial economic foundations were weak, and their resilience and recovery ability under different disruptions varied greatly in terms of overall resilience level. Shanghai and Suzhou not only have strong economic resilience of their own but are also centers of independent innovation ability in the TLB. However, Shanghai is still dependent on low- and medium-end manufacturing, and Suzhou is less diverse and less specialized, and its resilience is mainly based on its higher level of technical complexity and dense regional economic connections. Changzhou, Wuxi, and Suzhou have a clear trend of industrial integration, which is conducive to improving the comprehensive economic resilience of the Suzhou-WuXi-Changzhou metropolitan circle. In the future, there is a need to further promote the integration of management and environmental protection to meet the high requirements of energy conservation and carbon emission reduction, quality, and efficiency for high-quality development. Jiaxing has a similar level of economic resilience to Changzhou and Wuxi, with a higher level of relative diversity and relative specialization, but its economic connections with Hangzhou and Shanghai are weaker, and the spatial foundation of the industry remains smaller.
Although this study uses multivariate geographic big data, the research scale cannot be further refined to counties or districts because some of the necessary socioeconomic panel data are at the prefecture-level city scale. In addition, the analysis of the reasons for the evolution of the resilience of the cities in the TLB also remains in the qualitative analysis. In the future, based on this study, more spatiotemporal big data resources will be combined to conduct a multitype risk, fine-scale, and long-period economic resilience evaluation, which will provide more target-oriented conclusions and suggestions for the resilience enhancement of industrial space in each region. Meanwhile, quantitative analysis and mathematical statistics will also be used to study the formation and evolutionary mechanisms of economic resilience.
Author Contributions
Conceptualization, Y.W. and J.X.; Methodology, Y.W.; Writing—original draft, Y.W.; Writing—review & editing, D.L. and Y.Z.; Supervision, J.X.; Project administration, J.X.; Funding acquisition, J.X. All authors have read and agreed to the published version of the manuscript.
Funding
This work was supported by [National Natural Science Foundation of China] (52178043). The authors declare that no funds, grants, or other support were received during the preparation of this manuscript.
Data Availability Statement
Data availability statement: The relevant empirical research data has been obtained from the following sources: (1) Open street map (OSM) road network, which is downloaded from the website (https://download.geofabrik.de/, accessed on 25 June 2021); (2) GAUD dataset, which is cited from “High-spatiotemporal-resolution mapping of global urban change from 1985 to 2015”), can be downloaded at https://doi.org/10.6084/m9.figshare.11513178.v1, accessed on 5 January 2020; (3) enterprise data downloaded from the Tianyancha platform (https://www.tianyancha.com/, accessed on 14 February 2023) using Python code; (4) socioeconomic panel data, obtained from the annual yearbooks published by the official websites of the statistical bureaus of the cities in the Taihu Lake Basin.
Conflicts of Interest
The authors declare no financial interest.
References
- Huang, Y.; Chen, S.; Zheng, Y.; Tong, S.Y. Pearl River Delta in a Crisis of Industrialisation. World Sci. 2010, 67–87. [Google Scholar] [CrossRef]
- Liu, Y.; Lee, J.M.; Lee, C. The challenges and opportunities of a global health crisis: The management and business implications of COVID-19 from an Asian perspective. Asian Bus. Manag. 2020, 19, 277–297. [Google Scholar] [CrossRef]
- Zhikai, W. The private sector development and regional independent innovation in China: Case studies in Zhejiang. In Proceedings of the Conference on Long-Term Growth Potential of Russia and China, Hangzhou, China, 29 December 2009. [Google Scholar]
- Habibi, Z.; Habibi, H.; Mohammadi, M.A. The Potential Impact of COVID-19 on the Chinese GDP, Trade, and Economy. Economies 2022, 10, 73. [Google Scholar] [CrossRef]
- Hassink, R. Regional resilience: A promising concept to explain differences in regional economic adaptability? Camb. J. Reg. Econ. Soc. 2010, 3, 45–58. [Google Scholar] [CrossRef]
- Simmie, J.; Martin, R. The economic resilience of regions: Towards an evolutionary approach. Camb. J. Reg. Econ. Soc. 2010, 3, 27–43. [Google Scholar] [CrossRef]
- Li, L.; Zhang, P.; Lo, K.; Liu, W.; Li, J. The Evolution of Regional Economic Resilience in the Old Industrial Bases in China: A Case Study of Liaoning Province, China. Chin. Geogr. Sci. 2020, 30, 340–351. [Google Scholar] [CrossRef]
- Pendall, R.; Foster, K.A.; Cowell, M. Resilience and regions: Building understanding of the metaphor. Camb. J. Reg. Econ. Soc. 2010, 3, 71–84. [Google Scholar] [CrossRef]
- Martin, R.; Sunley, P.; Gardiner, B.; Tyler, P. How regions react to recessions: Resilience and the role of economic structure. Reg. Stud. 2016, 50, 561–585. [Google Scholar] [CrossRef]
- Akerlof, G.A. Path Dependence, its Critics and the Quest for ‘Historical Economics’. Chapters. 2002. Available online: https://econpapers.repec.org/bookchap/elgeechap/2759_5f5.htm (accessed on 8 January 2023).
- Zheng, Q.; Bao, C. Regional Innovation and Evolution. In Regional Innovation Evolution; Springer: Berlin/Heidelberg, Germany, 2022; pp. 3–19. [Google Scholar]
- David, P.A. Why are institutions the ‘carriers of history’?: Path dependence and the evolution of conventions, organizations and institutions. Struct. Change Econ. Dyn. 1994, 5, 205–220. [Google Scholar] [CrossRef]
- Masten, A.S.; Best, K.M.; Garmezy, N. Resilience and development: Contributions from the study of children who overcome adversity. Dev. Psychopathol. 1990, 2, 425–444. [Google Scholar] [CrossRef]
- Luthar, S.S.; Cicchetti, D.; Becker, B. The Construct of Resilience: A Critical Evaluation and Guidelines for Future Work. Child Dev. 2000, 71, 543–562. [Google Scholar] [CrossRef] [PubMed]
- Ribeiro, P.J.G.; Pena Jardim Gonçalves, L.A. Urban resilience: A conceptual framework. Sustain. Cities Soc. 2019, 50, 101625. [Google Scholar] [CrossRef]
- Li, L.; Huang, X. The Latest Research Progress of Regional Economic Resilience in China. In Proceedings of the 2022 7th International Conference on Social Sciences and Economic Development (ICSSED 2022), Wuhan, China, 25–27 March 2022. [Google Scholar]
- Biggs, R.; Schlüter, M.; Schoon, M.L. Principles for Building Resilience: Sustaining Ecosystem Services in Social-Ecological Systems; Cambridge University Press: Cambridge, UK, 2015. [Google Scholar]
- Biggs, R.; Schlüter, M.; Biggs, D.; Bohensky, E.L.; BurnSilver, S.; Cundill, G.; Dakos, V.; Daw, T.M.; Evans, L.S.; Kotschy, K.; et al. Toward Principles for Enhancing the Resilience of Ecosystem Services. Annu. Rev. Environ. Resour. 2012, 37, 421–448. [Google Scholar] [CrossRef]
- Tan, J. Regional economic resilience of resource-based cities and influential factors during economic crises in China. In Economic Resilience in Regions and Organisations; Springer: Berlin/Heidelberg, Germany, 2021; pp. 91–115. [Google Scholar]
- Faggian, A.; Gemmiti, R.; Jaquet, T.; Santini, I. Regional economic resilience: The experience of the Italian local labor systems. Ann. Reg. Sci. 2018, 60, 393–410. [Google Scholar] [CrossRef]
- Yu, S.; Kim, D. Changes in Regional Economic Resilience after the 2008 Global Economic Crisis: The Case of Korea. Sustainability 2021, 13, 11392. [Google Scholar] [CrossRef]
- Hu, X.; Li, L.; Dong, K. What matters for regional economic resilience amid COVID-19? Evidence from cities in Northeast China. Cities 2021, 120, 103440. [Google Scholar] [CrossRef]
- Wang, W.; Wang, J.; Wulaer, S.; Chen, B.; Yang, X. The effect of innovative entrepreneurial vitality on economic resilience based on a spatial perspective: Economic policy uncertainty as a moderating variable. Sustainability 2021, 13, 10677. [Google Scholar] [CrossRef]
- Hui, S.; Weipeng, Y. A Study on the Relationship Between Economic Resilience and High-Quality Economic Development in Western China. Reg. Econ. Rev. 2020, 23–35. [Google Scholar]
- Zhou, J.; Liu, W. Monitoring and Evaluation of Eco-Environment Quality Based on Remote Sensing-Based Ecological Index (RSEI) in Taihu Lake Basin, China. Sustainability 2022, 14, 5642. [Google Scholar] [CrossRef]
- Liu, X.; Huang, Y.; Xu, X.; Li, X.; Li, X.; Ciais, P.; Lin, P.; Gong, K.; Ziegler, A.D.; Chen, A.; et al. High-spatiotemporal-resolution mapping of global urban change from 1985 to 2015. Nat. Sustain. 2020, 3, 564–570. [Google Scholar] [CrossRef]
- Jin, S.; Xiaohui, H.; Yunxiong, L.; Tao, F. Does the belt and road initiative reshape China’s outward foreign direct investment in ASEAN? Shifting motives of state-owned and private-owned enterprises. Singap. Econ. Rev. 2020, 66, 161–183. [Google Scholar] [CrossRef]
- Ye, S.; Qian, Z. The Economic Network Resilience of the Guanzhong Plain City Cluster, China: A network analysis from the evolutionary perspective. Growth Chang. 2021, 52, 2391–2411. [Google Scholar] [CrossRef]
- Xiao, J.; Boschma, R.; Andersson, M. Resilience in the European Union: The effect of the 2008 crisis on the ability of regions in Europe to develop new industrial specializations. Ind. Corp. Chang. 2017, 27, 15–47. [Google Scholar] [CrossRef]
- Comin, D.A.; Cruz, M.; Cirera, X.; Lee, K.; Torres, J. Technology and Resilience; National Bureau of Economic Research: Cambridge, MA, USA, 2022. [Google Scholar]
- Hausmann, R.; Hwang, J.; Rodrik, D. What You Export Matters. J. Econ. Growth 2007, 12, 1–25. Available online: https://link.springer.com/article/10.1007/s10887-006-9009-4 (accessed on 8 January 2023). [CrossRef]
- Hao, F.; Jiang, W.; Lou, Y. Labor mobility and regional manufacturing upgrade: Based on the perspective of transfer and transformation. Ind. Econ. Rev. 2021, 12, 90–109. [Google Scholar]
- Zhang, B.; Yin, J.; Jiang, H.; Qiu, Y. Application of Social Network Analysis in the Economic Connection of Urban Agglomerations Based on Nighttime Lights Remote Sensing: A Case Study in the New Western Land-Sea Corridor, China. ISPRS Int. J. Geo Inf. 2022, 11, 522. [Google Scholar] [CrossRef]
- Lu, S.; Zhang, W.; Li, J.; Ma, R. The Role of Proximity in Transformational Development: The Case of Resource-Based Cities in China. Land 2022, 11, 2123. [Google Scholar] [CrossRef]
- Ma, X.; Chen, X.; Du, Y.; Zhu, X.; Dai, Y.; Li, X.; Zhang, R.; Wang, Y. Evaluation of Urban Spatial Resilience and Its Influencing Factors: Case Study of the Harbin–Changchun Urban Agglomeration in China. Sustainability 2022, 14, 2899. [Google Scholar] [CrossRef]
- Gemba, K.; Kodama, F. Diversification dynamics of the Japanese industry. Res. Policy 2001, 30, 1165–1184. [Google Scholar] [CrossRef]
- Duranton, G.; Puga, D. Diversity and specialisation in cities: Why, where and when does it matter? Urban Stud. 2000, 37, 533–555. [Google Scholar] [CrossRef]
- Aw, B.; Batra, G. Firm size and the pattern of diversification. Int. J. Ind. Organ. 1998, 16, 313–331. [Google Scholar] [CrossRef]


Disclaimer/Publisher’s Note: The statements, opinions and data contained in all publications are solely those of the individual author(s) and contributor(s) and not of MDPI and/or the editor(s). MDPI and/or the editor(s) disclaim responsibility for any injury to people or property resulting from any ideas, methods, instructions or products referred to in the content. |
© 2023 by the authors. Licensee MDPI, Basel, Switzerland. This article is an open access article distributed under the terms and conditions of the Creative Commons Attribution (CC BY) license (https://creativecommons.org/licenses/by/4.0/).