1. Introduction
Climate change is broadly recognized as one of the main agents in re-shaping the physical global environment in our next future [
1,
2]. Evidence provided by scientists, together with the increasing occurrence of exceptional meteorological events, lead toward re-shaping the built environment in a way that must be inspired at reducing the anthropogenic pressure on nature, and at preventing the damages generated by climate change [
3]. The 2022 Intergovernmental Panel on Climate Change (IPCC) Report indicates cities as very vulnerable to intense climate-induced events due to the high exposure of population and valuable assets of infrastructure and services, including cultural ones. IPCC Report 2022 also estimates events such as sea level rise, heatwaves, droughts, changes in runoff, floods, and wildfires have a high confidence rate of occurrence. These events will affect urban areas by disruptions of energy supply and transmission systems, communications, food and water supply, and transport systems, as well as un-estimable assets such as the loss of human lives and of cultural heritages [
3].
The urgency in coping with climate-induced hazards is also enhanced by the 2020 Joint Research Centre (JRC) Report, Peseta IV (Projection of Economic impacts of climate change in Sectors of the European Union based on bottom-up Analysis), which provides a combination of process-based and empirical models to simulate system behavior in response to climate change. This study works in the framework of the EU Adaptation Strategy (notably, Action 4), and it aims at bridging the gap between “information on damage from climate change” and the “benefits and costs of adaptation”. The JRC Report selects several typical damages caused by climate-induced events and estimates the potential effects of mitigation and adaptation actions to reduce the costs generated by it. It also estimates the annual cost of the EU economy’s exposure to global warming, which accounts for at least 1.36% of the European Gross Domestic Product (EU GDP) (EUR 170 billion) if no risk reduction measures are taken [
4]. In addition, the United Nations Global Report estimates that the cost of good adaptation is one-tenth the cost of no action in coastal cities. While investments in adaptation and resilience present «benefit-cost ratios ranging from 2:1 to 10:1, and in some cases even higher» [
5].
To respond to such an urgent call to action, cities have developed planning strategies based on risk reduction, notably those inspired by climate adaptation. Many of these responses implement technical solutions able at increasing the ecological benefits of green spaces within the city, especially those related to evapotranspiration services, soil drainage, and run-off regulation [
6,
7,
8,
9]. Notably, the Urban Green Infrastructure (UGI) and the Nature Based Solutions (NBS) have been recognized as cost-effective strategies «which seek to preserve, restore and create green space using soils, vegetation, and rainwater harvest techniques» [
10]. These strategies are based on the provision of Ecosystem Services (ESs) delivered by the UGIs and NBS and stress the role of urban green areas as a win-win solution for enhancing urban social life and reducing climate risk [
11,
12,
13]. UGIs are indeed also known as the “triple dividend” of adaptation due to their capacity in reducing anthropogenic and natural losses, generating economic benefits, and providing further values in terms of social, environmental, and cultural upgrades [
14,
15,
16].
According to this remark, this triple set of benefits can be assessed through the balance between the ecological ones (especially referred to the climate impacts reduction), the benefits related to human well-being and life support, those related to cultural and social services, and the benefits directly generated by the market [
8,
17].
Following this triple set of benefits, UGIs planning has been strongly encouraged by relevant policies and measures such as the 2030 Agenda for Sustainable Development: the Paris Agreement, Sustainable Development Goals, New Urban Agenda, and Sendai Framework for Disaster Risk Reduction [
3,
18]. In addition, the EU Commission has launched specific founding tools such as InvestEU, which is a climate-dedicated financing program developed under the Cohesion Policy 2020–2027. This founding tool supports investments, eco-schemes, and advisory services, and implements the EU Framework Program and the Climate Knowledge and Innovation Community for overcoming the existing barriers in planning for climate adaptation.
Despite the recommendation of such relevant international bodies, and despite the considerable plan of action made by both EU policies and funding, several barriers still exist to make UGI an effective strategy in coping with climate change effects [
19,
20]. There is indeed a lack of knowledge with respect to standardizing criteria for measuring the positive impacts of ecosystem services, as well as a lack of providing standardized indexes for simulating cost-benefits scenarios [
21,
22]. Further barriers come from the difficulties in managing the interactions between planning, setting, implementing, and maintaining UGIs at different scales dynamically [
20]. Therefore, criticalities also come from the lack of studies dealing with the integrated values of use and non-use of ESs, and, by extension, of the UGIs [
17].
Further remarks concern the value of ESs [
17,
20,
23,
24]. As for Robert Costanza’s studies: «most ecosystem services are public goods (non-rival and non-excludable) or common pool resources (rival but non-excludable), which means that privatization and conventional markets work poorly, if at all. In addition, the non-market values estimated for these ecosystem services often relate more to use or non-use values rather than exchange values» [
17].
This is because the capacity of UGIs in providing ecosystem services in the urban environment hinges on the site-specific characteristics, such as the ecological efficiency of the existing green spaces, their connectivity and diversity, and the characteristics of site topography, local climate, urban patterns, and land use [
13,
15,
25,
26,
27,
28,
29,
30]. Other constraints on UGIs’ planning stem from the social and economic environment, including the different perceptions of the UGIs’ benefit by the local population, especially when related to the non-use value. These latter include existence values, bequest values, and option values, which are all strictly connected.
The above-mentioned constraints and barriers depend on the fact that cities are complex self-organizing systems. Therefore, the UGIs’ climate responsiveness depends on several diverse conditions, which are generated locally [
12,
19,
25]. Differences in the value of the urban environment, as well as the way physical constraints interact with both the social-economic environment and local regulatory contexts, make it difficult to predict the effective impacts arising from UGIs’ planning in different urban settings [
29]. This lack of knowledge is mainly related to a data gap in the measurement of the ecological capacity of urban green spaces in providing ecosystem services, as well as studies concerning the linkages between ecosystem services and urban land use [
29,
31,
32,
33].
The difficulty in standardizing criteria and indexes is the main barrier to the transition of UGIs from an empirical design approach to a new one, more analytical, and effective one. To fill this gap, scholars have begun to explore new areas of study aimed at implementing measures and standards [
8,
9,
21,
32,
34]. Over the past decade, the literature on UGIs has therefore been implemented by other analytical methods to better understand the ecology of the urban context, including the accounting for ecosystem services and the simulation models to forecast the efficiency of UGIs [
13]. Attention has been given to the ranking of ecosystem services [
18,
28], and to the study of the urban green spaces in terms of vegetation composition and biodiversity. Further studies have developed methods for achieving a more effective cost–benefit balance in implementing ecosystem services and UGIs [
11,
17,
20,
21,
23], as well as the co-benefits generated by the UGIs [
17,
20,
23,
24,
35,
36].
According to these remarks, the objective of this paper is to provide a GIS-based framework to support decision-making in assessing different planning scenarios for UGI’s at an urban district scale. The main challenge of this study is implementing a practical, effective method to support the decision-maker in evaluating urban regeneration intervention strategies aimed at improving the ecological efficiency of urban green surfaces in the densely populated urban fabric. Our framework can represent a useful tool in evaluating the benefits and costs of solutions for transforming ineffective green soils into ecologically effective green areas. The goal of our research is consistent with the EU Adaptation Strategy, Action 4, which aims to bridge the knowledge gap for some key unknowns, including information on damage from climate change and the benefits and costs of adaptation [
4].
This paper is based on previous research [
33,
37] that has provided a GIS model to extract the ecological-efficient urban green spaces within the existing ones. In the present study, we implement the above-mentioned findings by simulating the potential cost–benefit ratio of upgrading inefficient areas through the planting of new vegetation species which comply with the vegetation efficiency index [
26,
33,
37].
The research method consists of the following steps: first, we apply a GIS-based model to assess the ecological efficiency of the existing urban green spaces in the study area; then we extract the ecologically inefficient green spaces, specially selected among the dismissed open spaces with pervious surfaces; then we simulate the upgrade of all these areas through a vegetation upgrade; finally, we fix a threshold for the planting and operational costs, and we propose two different scenarios for comparing the UGIs potential after improving ecological efficiency in the study area. The resulting discussion highlights the different UGI options coming from the scenarios produced.
We test this approach on the urban districts of the northeastern area of the municipality of Napoli (Italy), which is characterized by a high population density and several abandoned green spaces which can be planned as part of a UGI.
This method can represent a useful tool to support the planner in evaluating the ecological benefits of investing money in transforming open spaces into green spaces. The different scenarios coming from the application demonstrate that the method is scalable at the urban district level, and it supports the typical qualitative planning approach for designing UGI. Further results come from the capacity of scaling the ecologically efficient urban green areas with respect to the number of inhabitants, i.e., defining a sort of regulatory proposal for UGIs.
2. Materials and Methods
2.1. Preliminaries
Against this background, this paper adopts the European Commission’s definition of green infrastructure, which is a «strategically planned network of natural and semi-natural areas with other environmental features designed and managed to deliver a wide range of ecosystem services» [
38]. Here, green infrastructure comprises a wide range of existing green areas that mutually cooperate to deliver a range of ESs, according to both the ecological capacity and connectivity of the areas themselves [
15]. According to this assumption, the study defines urban green spaces as «public and private open spaces in urban areas, primarily covered by vegetation, which are directly (e.g., active or passive recreation) or indirectly (e.g., positive influence on the urban environment) available for the users» [
39].
A further assumption comes from the definition of ecological efficiency as provided in [
33,
36]. We also assume that ecologically efficient green areas are more suitable for producing ESs [
23]. In these papers, this term is used to indicate the capacity of the existing urban green areas to provide ESs with a specific reference to climate regulation.
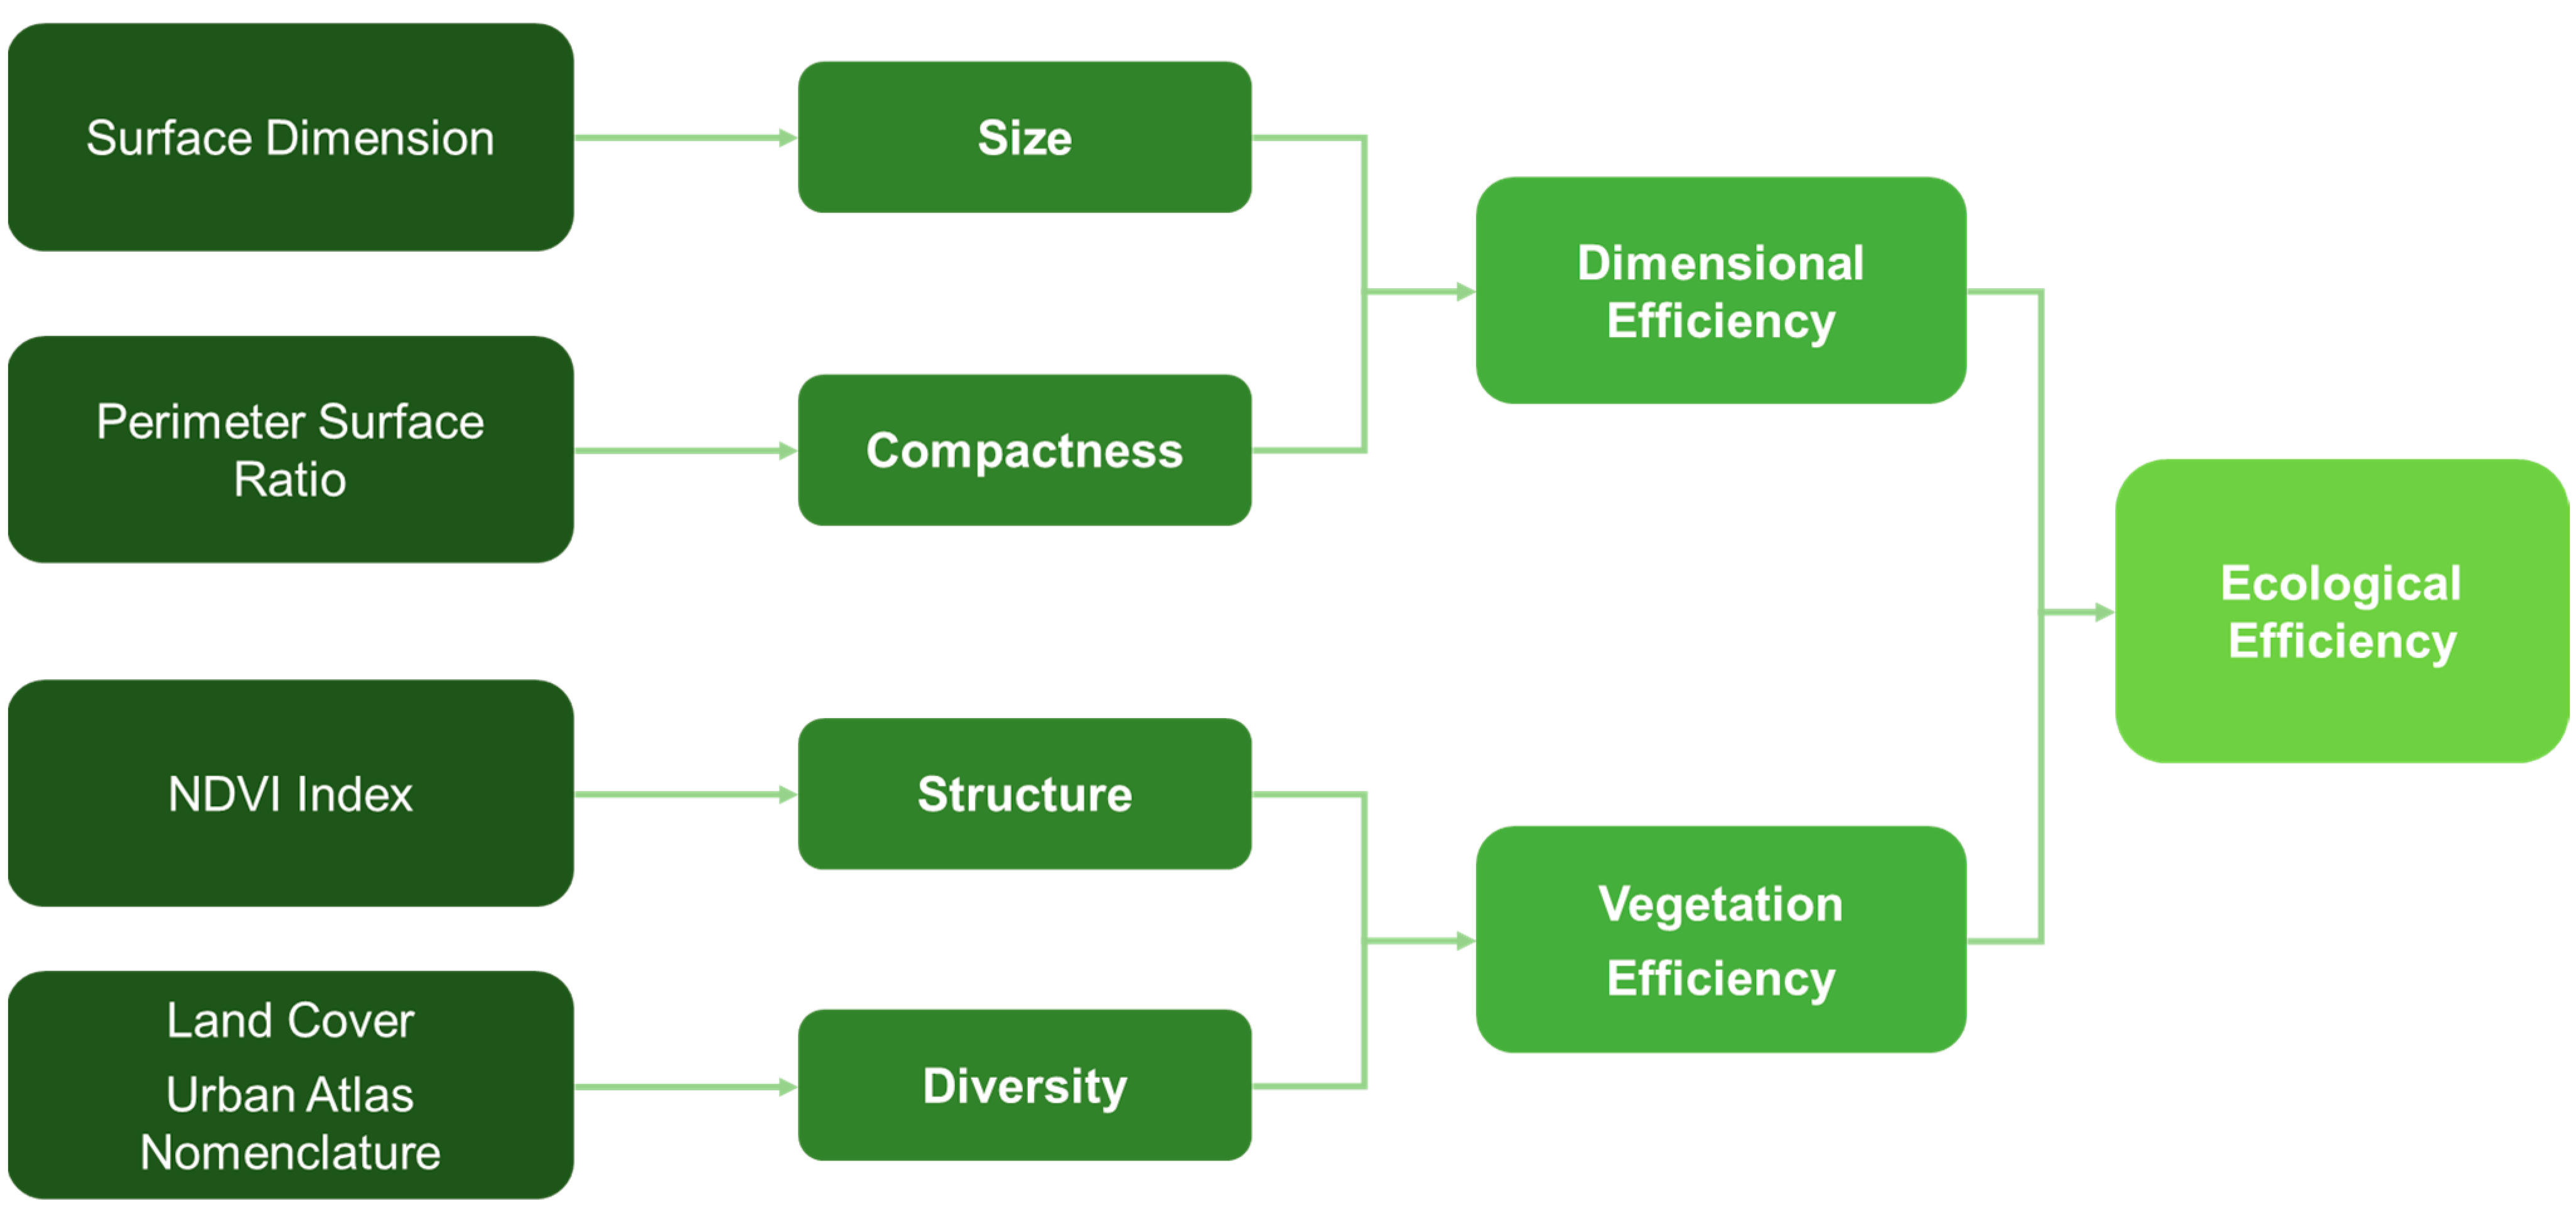
In operational terms, we proposed a GIS framework model that evaluates the ecological efficiency of urban green areas with the aim of selecting those able to provide ecosystem services to sustain green infrastructure at an urban district level (
Figure 1) [
33]. This model works on the interrelation of four indicators of size, shape, vegetation structure, and vegetation diversity. In this model, we assessed the ecological efficiency of urban green spaces by defining two intermediate indexes named dimension efficiency and vegetation efficiency. The dimension efficiency is measured considering the dimensional characteristics of the urban green area through the indicators of size and compactness; the vegetation efficiency is measured by considering the vegetation characteristics through the indicators of vegetation structure (measuring the presence of photosynthetic activity) and vegetation diversity (measuring the biodiversity potential).
The model is applied to a topographic dataset of urban areas on a scale of 1:5000. The study works on the remote sensing Sentinel-2 normalized difference vegetation index and Copernicus land use spatial datasets.
The findings of the previous research [
33,
37] are the logical roots of the present paper.
2.2. The Study Area
The proposed model was applied and tested in a study area located in the northern area of Naples, Italy (
Figure 2). This area includes four urban districts (Miano, Piscinola, Scampia, Secondigliano) which are all characterized by a high population density and a good availability of green areas per inhabitant (
Table 1).
Until the Word War II, this territory was characterized by the presence of the ancient farmhouses of Miano, Piscinola, and Secondigliano, while the Scampia district was planned as a new residential settlement in the 1970s. The residential development of the four districts has led to the current configuration. Here, the modern residential complexes add up to the cores of the ancient structure, as well as to the new functional enclosures (industries, prisons, cemeteries, barracks), to the transport infrastructures, and to the interstitial voids still present.
This area can be described as a sort of urban-to-rural transect, where a relevant number of pervious soils still exist.
The study area was selected considering the characteristics related to the green component and to the population density.
Table 1 shows the main characteristics of the four districts, i.e., a high population density (inhabitants per hectare) and a relevant rate of green areas.
In addition, a study conducted in [
37] shows that the four districts are characterized by a significant percentage of critical surfaces, due to the considerable population and built density. All districts present a high impact level of heat waves thanks to a relevant percentage of impervious soils, and because of the amount of ecologically inefficient surfaces that may be subject to transformation (
Figure 3).
In fact, the four districts are all characterized by high levels of ecological efficiency. This latter exceeds 30% in the districts Miano and Secondigliano and reaches values above 50% in Scampia and Piscinola (
Figure 3) [
37].
The topographic map on a scale of 1:5000 provided by the Campania Region in 2011 shows that many of the inefficient green areas in the four districts are uncultivated or abandoned green surfaces with the presence of spontaneous vegetation. These areas are primarily transition areas or hubs that can both be important elements in enhancing connectivity within an urban green infrastructure due to their position, their physical characteristics, and/or their ecological efficiency [
33]. The interest in this type of area is therefore justified by the interest in applying the ecological efficiency model for a better understanding of the cost–benefit ratio for improving the level of ecological efficiency of the existing green areas.
2.3. The Proposed Framework
The logical overview of our framework is shown in
Figure 4.
The first activity is given by the selection of the study area and its partitioning in N subzones. The input data are given by the topographic and remote sensing spatial datasets of the study area. The topographic data are used to extract the urban green elements, and the remote sensing data are used to create the raster of the NDVI index. The urban green areas extraction component uses the topographic data to create the spatial dataset of the urban green areas.
Then, the ecological efficiency model is executed to obtain the ex-ante ecological efficiency map of the study area, which represents the status quo of the ecological efficiency of public green areas in the study area.
According to the assumption given in [
17], that benefits provided by ecosystems are to be evaluated with respect to the presence of people (human capital), their communities (social capital), and their built environment (built capital), we measure the ecological benefit as the surface of ecological efficient greenery per inhabitant.
The
ecological benefit analysis component measures the ecological benefit index for each subzone; this measure is obtained from the number of square meters of ecologically efficient urban greenery per inhabitant. If N
i is the number of inhabitants in the
ith subzone and A
i is the total area, measured in square meters, of ecologically efficient public green areas included in the subzone, then we define the
ecological benefit index EB
i provided by ecologically efficient public green areas on the population living in the
ith subzone by:
In the following step, the ecologically inefficient public green areas located in each subzone are examined to evaluate the optimal transformation actions for increasing their ecological efficiency. Based on the assumption that decision-makers constraints are the budget for financial resources and a catalog of planting and maintenance costs per square meter of tree species, the planting operations start from the subzones with the least ecological benefit. Here, the transformation of the not-efficient areas into ecologically efficient ones have been upgraded by calculating the costs of planting and maintenance of new tree species in these areas.
Subsequently, the evaluation model of the ecological efficiency of public green areas is re-executed to obtain the ex-post ecological efficiency map. The ecological benefits and costs of the transformations are calculated for each subzone.
Finally, the cost–benefit analysis component assesses the benefits and the costs of the transformation. In addition to the ex-ante and ex-post ecological benefits, the total population living in the subzone and the population density are calculated in index ΔEBi to evaluate the costs and benefits of the project. The index ΔEBi measures the difference between the ecological benefit measured ex-post and the one measured ex-ante in the ith subzone, and index Ci, which gives the total expense of all the transformations carried out on inefficient public green areas located in the ith subzone. The higher the ΔEBi index, the greater the benefit to residents of ecologically efficient greenspaces, after the transformation of inefficient public greenspaces has taken place. The lower the value of Ci, the lower the cost of transformation in this sub-zone.
2.4. The Preparation of the Test Environment
Our GIS-based framework was implemented using ESRI ArcGIS desktop suite 10.8 and the ESRI Arcpy Python library.
To test the framework, the spatial datasets requested to execute the ecological efficiency model were acquired from institutional sources (
Table 2).
All spatial datasets were converted in the projected coordinate system UTM European Terrestrial Reference System 1989, and cut on the perimeter of the study area.
All the layers corresponding to public green areas have been extracted from the topographic spatial database and from the Copernicus land use dataset; they refer to wooded, cultivated, uncultivated, and urban public green areas.
The NDVI raster dataset, sourced from a Sentinel-2 satellite with the resolution of 10 m multispectral 13-band imagery, was obtained in the function of the near-infrared (NIR—Band8) and red (RED—Band4) Sentinel-2 bands, using the formula:
To calculate the ecological benefit (EB) index in each district, the number of residents in the district was used; the number was obtained by adding the number of residents in the census sections belonging to the district.
To evaluate the unit costs of planting and maintaining tree species, the regional price list for public works for the year 2022 of the Campania Region was acquired. It contained the direct and indirect unit costs per square meter of maintenance and plant works defined for the different types of tree species in the year 2022. The evaluation of the types of transformation interventions was carried out by taking the average unit costs of planting and maintaining tree species in young and adult age into consideration in order to carry out the real intervention costs with sufficient approximations.
3. Results
After extracting the green zones covering the study area given by the four districts Miano, Piscinola, Scampia, and Secondigliano, we executed the ecological efficiency classification model ex-ante.
Figure 5 shows the ex-ante ecological efficiency map of the four districts of the study area.
Table 3 shows that Piscinola has the greatest benefit is with 39.47 square meters per inhabitant of ecologically efficient green spaces, while Miano is the district with the least benefit is with 12.34 square meters per inhabitant.
The thematic map in
Figure 6 shows the spatial distribution of the uncultivated areas and the other ecologically inefficient surfaces. The map highlights the presence of three extended uncultivated surfaces, two stepping zones, and a central corridor.
To increase the ecologically efficient areas, it is necessary to provide a Land Use Change (LUC). Therefore, we selected all areas classified as “uncultivated” by the general land use classification within the four districts and simulated their upgrade (
Table 4).
This upgrade is done through the hypothesis of operating planting works aimed at transforming “uncultivated” areas to “wooded” ones. According to [
33], we considered the vegetative diversity a key indicator for assessing the ecological efficiency of the existing green areas, and we measured it with the reference to five diversity classes of the General Land Use (GLU). This approach complies with the literature [
26,
36,
40,
41].
The increase of ecologically efficient surfaces resulting from the LUC is presented in
Table 5.
Figure 7 shows the distribution of ecologically efficient areas following the planting works.
As in
Table 6, Miano is the district which almost doubles the area of ecologically efficient areas with a 96.4% increase. Whereas Secondigliano has recorded an increase of only 5.2% having a benefit of 25.96 square meters per inhabitant of ecological efficient areas.
To assess the costs of the planting operations, the study considers the one-off costs and the ongoing costs, excluding the intangible costs, such as the administrative ones, the information costs, and the management costs [
20]. Thus, the costs related to the planting works are those related to the planting of new tree species, selected within the native ones, due to their greater possibilities for adaptation in terms of climate condition and ecosystems. A further criterion in cost calculation has been the age of the trees, which have be selected among those presenting a trunk between 12 and 25 cm in circumference. According to these criteria, the study selected the
Quercus Ilex species aged 8–10 years. This species grows better in poor soils, such as limestone, and copes with water shortages during hot and dry summers [
42,
43].
To improve the chances of successful planting and reduce maintenance costs, the study assumes an adaptive planting operation approach, respecting site-specific conditions [
42]. The choice of the Quercus Ilex is also consistent with the characteristics of the Campania Climatic Region.
The cost calculation is based on the price list of the Campania Region 2022, the average cost per square meter was synthesized to transform an uncultivated area into a wooded area.
Table 7 shows the costs divided into one-off costs (planting operations) and ongoing costs (annual maintenance) [
20]. The latter is calculated as the average costs required to carry out a pruning operation/year and a spollonatural operation/year.
To improve the benefit of ecologically efficient green space per inhabitant, we have identified two project strategies.
The first hypothesis does not foresee any limit to the budget of expenditure for the actions of planting and maintenance, while the second hypothesis forecasts an investment limit of up to three hundred million euros.
Concerning the maintenance costs, we estimated a period of 5 years from the year following planting.
Table 8 summarizes the results of the trial of the first solution.
The highest costs are incurred in the Piscinola district, thanks to the large amount of green space available.
Table 9 presents the overall cost and the amount of square meters per inhabitant for each district, reaching a cost of about 573 million euros for the entire study area.
In the second hypothesis, a cost limit of 300 million euros for the whole area of study was established. Here two different planning strategies were implemented. In the first strategy, the area north of the Scampia district was converted to connect existing ecological areas to the east and west. A further transformation was applied to the district of Miano to connect the ecological areas already present in the southern part of the district and creating a green belt along the perimeter.
Figure 8 shows the application of the first intervention strategy.
Following the experimentation of the first planning strategy, quite significant increases in the ecological benefit index were recorded. In
Figure 9, it is possible to monitor the growth of the index ex-ante and ex-post of the planting works for each district.
With the application of the first planning strategy, an overall increase of 24.63 square meters per inhabitant was recorded, which in percentage terms corresponds to about 22%.
The second strategy of planning deals with the strengthening of the southern area of Piscinola with the aim of creating a large core area. At the same time, as for the first planning strategy, the southern area of the Miano district has been transformed to connect the ecological areas already present, and to create a green belt along the perimeter of the district (
Figure 10).
The results obtained from the trial of the second planning strategy are shown in
Figure 11.
With the application of the second planning strategy, there was a slightly greater overall increase compared to the other strategy of 29.06 square meters per inhabitant, which in percentage terms corresponds to about 26%.
4. Discussion
The results discussion starts with the comment that the study area can be intended as a super-district made of four different districts. The application of the ecologically efficient model demonstrates that the ecologically efficient areas prevail over the inefficient ones (
Figure 3).
According to the remark that ecologically efficient areas provide ecological benefits [
41], the study assumes that the potential ecological benefits coming from these areas could be considered with reference to the number of inhabitants [
42]. Therefore, the presence of ecologically efficient areas is more significant when located in the most populated districts.
Table 3 allows the comparison of the extent of the inefficient surfaces within the study area by introducing the reference to the inhabitants as well as to the ecological benefits. According to this table, the districts of Piscinola and Scampia have the best balance of ecologically efficient areas in relation to the number of inhabitants. These results are consistent with the observation that the ecologically efficient areas are near to and clearly separated by the built areas in Piscinola and Scampia. Diversely, in Miano and Secondigliano, the position of efficient and inefficient green areas results in intermediate spaces in the built-up area.
Further comments concern the typologies of the inefficient areas. As for [
28], the literature defines stepping zones as «medium-sized areas which represent important elements for improving connectivity in the network due to their strategic location and/or their ecological efficiency» [
33]. According to the results of
Figure 5, in the Piscinola and Scampia districts, we can assimilate the existing inefficient areas into stepping zones, while in Miano and Secondigliano districts, there are few stepping zones and a prevalence of small zones «acting as a point connection to support the production of ES locally in the network» [
33]. The combining of
Figure 5 and
Table 3 is crucial to understanding the characteristics of the study areas, as well as the differences and similarities among the four districts.
In fact, the description of both qualitative and quantitative features of the four districts leads to a second group of results, which are mainly focused on orienting the decision on planning to the ecological efficiency upgrade.
The research question is about where and how it is most effective to operate within the study area with the aim of providing an ecologically efficient UGI. The combining of the results coming from
Figure 5 and
Figure 6, shows that the inefficient areas have a key location within the super-district, and they can play a great role in planning a UGI. In fact, in the districts of Piscinola and Scampia, there are several green areas located on the border of the study area that can be intended as potential core areas for a UGI. Therefore, in the Miano district, the inefficient green areas are in the middle of the study area, and their upgrade could potentially implement a green corridor of UGI. Furthermore, the inefficient areas in the Secondigliano district are scattered and few; therefore, their upgrade could represent a potential network of urban green hubs within the UGI.
According to this remark, the second part of the study is focused on comparing the results coming from the introduction of the operations cost as a further parameter of the decision about the ecologically efficient upgrade. This part runs on the hypothesis that the change in land use classes can be an effective improvement in moving inefficient areas to ecologically efficient ones. Notably, the study proposes to implement a LUC through planting operations aimed at moving the existing inefficient areas from the class of uncultivated areas to the wooden ones. As for the Copernicus nomenclature, uncultivated areas are those covered by herbaceous vegetation dominated by grasses or sporadically occurring shrubs, while the wooden class includes herbaceous vegetation partially covered by tree crowns, scattered shrubs, and scattered forestry trees not occupying >30% of total area.
This is because vegetation efficiency can be achieved more readily by planting operations aimed at supplementing existing vegetation with trees. Further, this approach can be easily replicated in other L.U. categories according to the specific requests of the physical context and of the decision-makers.
Therefore, we first established the average unit costs for planting and maintaining tree species of young and adult trees. Then, we simulated the change in all the areas selected as uncultivated in the four districts (
Figure 7). The increase of ecological-efficient surfaces varies within a range of 5.2% to 96.4% (
Table 6), according to the ex-ante percentage of uncultivated areas and the population density. The comparison between
Table 5 and
Table 6 shows that the Miano and Piscinola districts present the best performances, while Secondigliano still maintains a low level of performance. This is because the dimensions of uncultivated areas vary for the districts, so the effects of the planting operation are not the same.
The comparison between
Figure 5 and
Figure 6 helps to explain these differences. In fact, the position of the uncultivated areas in Miano and Piscinola is crucial in terms of enforcing the existing efficient areas. Here the LUC provides the full accomplishment of a UGI, due to the planting operations creating a robust core area in the southwestern part of the super-district and the implementation of new green corridors in between.
Table 8 shows the planting operation costs accounted for by districts. Here, the main costs are in the districts of Piscinola and Scampia due to the dimensions of uncultivated areas selected for the LUC, while the LUC for the Miano district accounts for 13.82% of the overall costs.
Table 9 shows the ecological benefits provided by the planting operations.
Based on these results, we fixed 300,000,000 € as the cost threshold for the LUC operations, including both one-off costs and ongoing costs.
We tested two different approaches. In the first case, we obtained a commensurate increase in ecological benefits for each district (
Figure 8). Despite the quantities of the uncultivated areas subjected to the planting operations,
Figure 9 shows that these costs do not implement the condition for creating a UGI in the case study area.
The second approach selects a specific typology of uncultivated areas corresponding to those that are described in the literature as core areas and green corridors [
26,
40]. In this case, the ecological benefits increase in the Miano district (
Figure 10). The biggest difference is shown in
Figure 11 where the planting operations contribute to creating a green corridor in-between the study area and enforcing the core areas on the green belt.


 ,
, 


