Abstract
In comparison to agglomeration economies, the negative externalities of agglomeration have received less attention. Based on the punishment data of illegal loans from Chinese bank branches, this paper focuses on the relationship between density and credit misallocation to enrich the study of the negative externalities of agglomeration. After controlling for city size and a variety of other possible factors, the empirical results suggest that increased density leads to increased credit misallocation, and this result passes a series of robustness tests, including IV estimation. Agglomeration causes credit misallocation primarily through rising house prices, which causes financial institutions to favor housing-related loans. During this process, the government’s reliance on land finance causes higher house prices and, as a result, more severe misallocation. However, agglomeration does not always lead to an increase in credit misallocation. There are also cases where agglomeration does not lead to an increase in credit misallocation, which suggests that we should pay attention to differences in key characteristics between cities when studying the externalities of agglomeration.
1. Introduction
The concentration of socio-economic activities in a certain space will not only occur as an economy of agglomeration but also cause an increase in the cost of agglomeration. We know a lot about the agglomeration economies from previous studies, such as better access to information in specific sectors, denser labor markets, improved access to specialized services, and better access to infrastructures (e.g., transportation and communication) and public facilities (e.g., hospitals and schools) [1,2,3,4,5,6]. However, there is relatively little empirical evidence on the negative externalities of agglomeration and how they differ depending on city characteristics.
The formation of cities is determined by a trade-off between agglomeration economies and urban costs, and much of the mainstream urban economic theory relies on or is based on this trade-off, which Thisse and Fujita [7] refer to as the fundamental trade-off of spatial economics. To empirically assess the fundamental trade-off, more evidence on agglomeration costs is needed, especially from developing countries, where the majority of future urban growth is expected to occur [8].
Agglomeration costs are generally considered to be the increased costs of over-concentration of population and industry, such as traffic congestion, high land prices, and air pollution [9,10,11,12]. These high and rising costs cancel out the productivity gains from agglomeration [13]. However, our understanding of the secondary hazards of agglomeration is limited. Credit allocation, for example, a factor with a significant impact on productivity, has yet to be included in the analysis of agglomeration outcomes. We do not know if agglomeration leads to credit misallocation and, thus, lower productivity. As a result, this paper attempts to quantify the costs of agglomeration from the perspective of credit misallocation to contribute to the study on agglomeration costs.
We choose Chinese cities as the subject of our study. On the one hand, the Chinese context is representative. China is the world’s second-largest economy, with a large population and a high level of urbanization that has drawn worldwide attention. On the other hand, China is an ideal setting for studying the effect of urban agglomeration on credit misallocation. China has experienced rapid urbanization since economic reform, accompanied by a large number of mobile populations moving from rural to urban areas and a significant geographic concentration of population and industries [14,15]. As for misallocation, Hsieh and Klenow [16] use counterfactual analysis to conclude that China’s manufacturing total factor productivity (TFP) could increase by 30–50% if the level of resource allocation in China were equal to that in the United States. Song and Wu [17] further estimate that capital misallocation implies aggregate revenue losses of 20 percent for Chinese firms. In China, the non-state sector, especially small and medium-sized enterprises (SMEs), faces significant financing challenges. Banks prefer to lend to large state-owned enterprises (SOEs) and real estate firms. The allocation of a given amount of capital across industries is severely distorted, which not only stifles factor productivity growth but also increases hidden financial risks. These circumstances provide an appropriate social setting for our research.
This paper specifically seeks to answer three questions. First, is high density to blame for the recent increase in credit misallocation in Chinese cities? Second, if there is a causal relationship, what is the mechanism underlying it? Third, is the effect of density on misallocation universal or heterogeneous? Is there a difference between developed and developing regions or between large and small cities? Answers to these questions will help shed more light on the underlying causes of credit misallocation. Using data from Chinese prefecture-level cities, we discover that house price inflation due to agglomeration is a significant cause of credit misallocation, but the magnitude of this effect varies by city. The finding will be useful in assessing the potential financial risks associated with rapid urbanization, which is common in Chinese cities and other rapidly urbanizing developing countries.
The rest of the paper is organized as follows. Section 2 offers the related literature and outlines the theoretical framework of the study. Section 3 discusses the empirical models and the measures of agglomeration and credit misallocation. Section 4 presents the empirical results, and Section 5 summarizes our findings.
2. Literature Review and Theoretical Analysis
2.1. Literature Review
There is a growing consensus that underdevelopment is caused not only by a lack of resources such as capital, skilled labor, entrepreneurship, or ideas but also by the misallocation or misuse of available resources [18]. Credit misallocation has been documented as a prevalent empirical phenomenon among various resource allocations, both in less developed economies in general and in China in particular [19,20]. Banking systems that are well-functioning can channel savings to the most productive investment projects, ensuring efficient credit allocation and enhancing economic growth [21,22]. When a large amount of financial resources flow to inefficient or ineffective sectors while funds for efficient sectors are insufficient, credit misallocation occurs.
It has been demonstrated that banks may not follow prudent credit risk analysis rules in their lending process, i.e., they do not prioritize economic factors such as firm productivity but instead discriminate or favor firms with specific characteristics. We primarily present three common cases of credit misallocation here. Firstly, corruption in financial intermediaries impedes the efficient allocation of capital to smaller firms, forcing them to forego profitable investment opportunities and, as a result, reduces firm growth [23]. Secondly, companies with bank or government ties may have easier access to funding than companies without such ties [24]. China is a typical dual-economy in which low-productivity state-owned enterprises (SOEs) receive a larger share of credit while high-productivity private enterprises (PEs) have limited access to credit [25,26]. Thirdly, there is zombie lending. Following a significant economic shock, weakly capitalized banks purposefully extend credit to borrowers known to be in distress in order to keep insolvent borrowers alive and avoid realizing losses on their balance sheets [27,28].
As Restuccia and Rogerson [29] point out, resource misallocation across heterogeneous firms in an economy reduces aggregate TFP. Misallocation differences across countries have a strong explanatory power for productivity differences [30], and changes in the degree of misallocation within a country over time are also important sources of long-term productivity changes [31,32,33]. The importance of credit misallocation raises two research questions. First, what are the underlying causes of the misallocation? Second, what is the mechanism of influence? In recent literature, two natural candidates have piqued the interest of researchers: capital market imperfections caused by financial frictions and non-market distortions caused by government policies [34]. In terms of financial frictions, Banerjee and Munshi [35] and Banerjee and Duflo [36] show that financial market imperfections lead to credit misallocation across producers (see Greenwood et al. [37] for a model where the level of financial development affects resource allocation across productive uses). In addition, studies on contracting [38,39] find that the dependence on connections in the lending process results from inadequacies in formal institutions, such as the legal system, that make arm’s-length contracting unreliable. In terms of policy distortions, some studies have discovered that the level of credit misallocation in China increases with the SOE share of the local economy; the “preference” for SOEs is a clear manifestation of the phenomenon of government intervention [40]. Furthermore, as a result of state power intervention, corruption may also cause credit misallocation, which reduces economic growth by diverting bank funds from good to bad projects [41].
After reviewing the literature, we discovered that previous studies did not fully investigate the underlying influencing factors behind credit misallocation. The impact of urban agglomeration, in particular, as an important form of the spatial organization of economic development, on credit misallocation is unknown. The extent to which urban agglomeration affects credit misallocation in specific development processes, which cities are more vulnerable to agglomeration in terms of credit allocation, and what measures can be taken to mitigate financial risks in urban development are all unknown. We then analyze and empirically verify these issues to clarify them.
2.2. Impact of Agglomeration on Credit Misallocation
Based on Minsky’s theory of process, we analyze the impact of agglomeration on credit misallocation in this section. For Minsky, the process is the issue, and his theory of process can be summarized as: “Success breeds excess breeds failure”. When times are good, investors take risks; the longer the good times last, the more risks investors take until they overdo it [42]. The specific process by which agglomeration affects credit misallocation is as follows.
Economic agglomeration in cities attracts more labor, which raises local housing demand. This is reflected not only in the direct effect of inflowing labor force housing acquisition but also in the indirect effect of local residents’ demand for improved housing as income levels rise. When there is limited real estate capacity, the inflow of labor increases the demand for property, causing housing prices to rise.
High housing price has imposed a heavy economic burden on residents, which has squeezed out consumer spending, resulting in a decline in market demand for manufacturing products; besides, rising housing price has pushed up the land price, leading to an increase in business costs and labor costs, pushing up the price of manufacturing products, thus resulting in a decline in the competitiveness of the manufacturing industry. Profit margins in the manufacturing industry are severely reduced in such a difficult environment. However, rising housing price results in high profits for the real estate industry. A booming real estate market is a good time for banks. Banks will relax their scrutiny of loans at this time out of a desire for profit, which will speed up the flow of funds to the real estate industry, resulting in insufficient investment in the manufacturing industry and a corresponding reduction in R&D investment [43]. Furthermore, when looking at different sectors within manufacturing firms, the sectors with bubbles frequently attract more capital and crowd out investments in other sectors [44,45]. Attracted by the high profits of the real estate industry, manufacturing firms choose to allocate more capital to the real estate market, which is unrelated to their core business. In addition, rising asset price increases the value of collateral, which increases borrowing to businesses with real estate collateral [46]. A large amount of loan capital is invested in the real estate industry, which promotes the boom and drives up housing prices, creating a circular dynamic that attracts capital. However, the productivity level of real estate and its related industries is much lower than that of other industries. As a result, the increase in investment associated with rising house prices reduces investment efficiency [43]. Rising house price results in a flow of resources to highly profitable but inefficient firms, while high-productivity firms are under-resourced, reducing credit allocation efficiency.
In conclusion, the following hypothesis is proposed in this paper: Agglomeration causes an increase in credit misallocation via rising house prices.
2.3. Agglomeration and Credit Misallocation in China
According to the National Bureau of Statistics of China, China’s urban resident population was 449.06 million in 2000, with an urbanization rate of only 36.22 percent. However, by 2020, China’s urban resident population had risen to 900.22 million, and the urbanization rate had risen to 63.89 percent. The urban population is rapidly increasing (see Figure 1), as is the degree of agglomeration. During this period, China’s housing price has been rapidly rising (see Figure 2). In 2000, the national average sales price of commercial property was RMB 2112 per square meter; by 2020, it had risen to RMB 9860 per square meter, more than 4.6 times higher than in 2000. Housing price in high-density cities, such as Beijing, Shanghai, Guangzhou, Shenzhen, Nanjing, Xiamen, and Hefei, has risen even faster. Highly inflated house price has deviated significantly from the use value of housing, there is a strong speculative trading atmosphere in the market, and the bubble has become increasingly visible, with significant cascading risks.
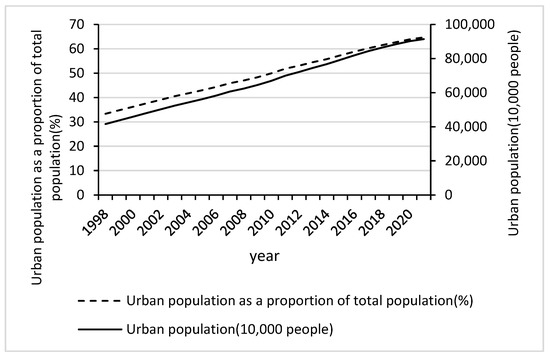
Figure 1.
China’s urbanization process1.
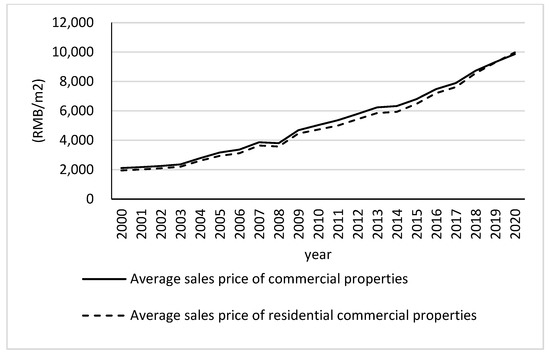
Figure 2.
China’s annual house price trends.
Soaring house prices drove the continued expansion of the construction and real estate sectors, which boomed exceptionally (see Figure 3). Specifically, the value added by the construction industry in 2018 was RMB 6180.8 billion, an increase of 11.2 times over RMB 553.4 billion in 2000; the value added by the real estate industry was RMB 25,593.7 billion, an increase of 14.6 times over RMB 1970.1 billion in 2000. In stark contrast to this boom is the continued downturn in manufacturing. There is no doubt that China has benefited greatly from its labor cost advantage when participating in global value chains. However, the competitive advantage is gradually eroding as rising house prices have led to higher labor costs, and at the same time, financing in the manufacturing sector has become increasingly difficult. Since the 2008 financial crisis, China’s central bank has continued to increase liquidity in the market, while the share of credit funds entering the real economy has not met expectations. As the real estate economy continues to grow, the crowding-out effect of the real estate bubble has become increasingly prominent. In 2019, China’s manufacturing sector accounted for only 17% of total loans across all sectors, a decrease of 8 percentage points from a decade ago2. The growth rate of fixed asset investment in manufacturing has also declined rapidly (see Figure 4), reaching a record low of 3.06 percent in 2017. Rising distortions in factor markets have led to a continued decline in the competitive advantage of China’s manufacturing sector. The profit growth of industrial enterprises above designated size3 has been sluggish for a long time. Between 2000 and 2020, the profits of China’s large industrial enterprises increased by a factor of nine, while those of real estate enterprises increased by a factor of 190. During this period, even manufacturing companies have increased their investment in real estate operations. According to the data, more than 46% of the 3582 listed A-share companies were involved in real estate investment in 2018.
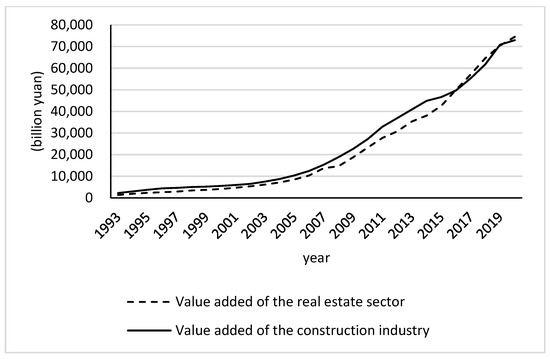
Figure 3.
China’s real estate value added and construction value added.
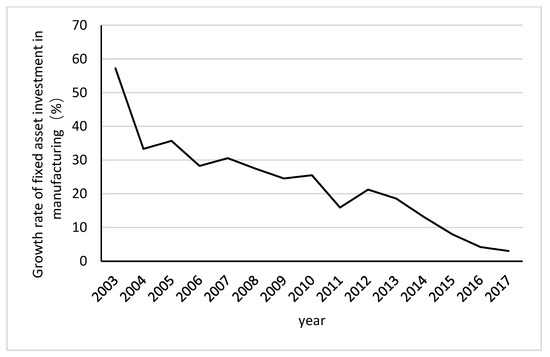
Figure 4.
Growth rate of fixed assets investment in China’s manufacturing4.
Rising house prices caused by rapid urbanization have drawn more resources into real estate and related industries. However, productivity is low in these industries, and resources are not allocated to more efficient firms. It is therefore reasonable to believe that part of the problem of slowing productivity growth in China lies in the diseconomies of agglomeration.
3. Econometric Specifications and Data
To gain an intuitive understanding of the basic facts of this paper, we plot binned scatterplots using data on urban population density and the total value of financial penalties issued by regulators to banks5 in prefecture-level cities in China from 2004 to 2019. As shown in Figure 5, the basic fact of this paper is that the higher the population density, the larger the financial penalties for violations (see Figure 5, left), and this positive relationship persists even after controlling for city size (see Figure 5, right).
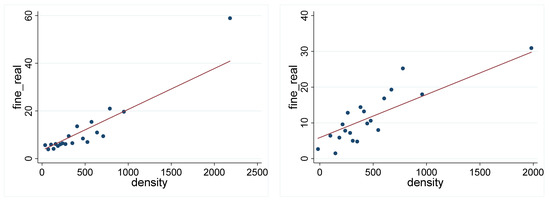
Figure 5.
The relationship between population density and the total value of financial penalties issued by regulators to banks6.
3.1. Model and Variables
We examine the total effect of density on credit misallocation using a traditional panel data method, namely the two-way fixed effects model. With reference to previous studies on the determinants of capital misallocation [25,47] and taking data availability into account, this article empirically examines the effect of density on credit misallocation by estimating the following equations.
where is the total value of financial penalties issued by regulators to banks, and deflated by Consumer Price Index (CPI), is the permanent resident population per unit area, and , are city fixed effect and year fixed effect. consists of a series of control variables. Firstly, we introduce population size (lnpop, the population of permanent residents in log) as one of the control variables because the number of banks and the total amount of fines imposed increase with the size of the city. Secondly, previous research shows that local governments have some degree of control over banks in China, allowing them to interfere with bank credit [40,48]. As such, we include the proportion of fiscal expenditure (fiscal, the ratio of fiscal expenditure to GDP). Thirdly, the capital requirements of businesses differ depending on their industry. The credit structure of commercial banks will change as the industrial structure changes. As a result, the industrial structure (IndStr, the ratio of value-added of the tertiary industry to value-added of the secondary industry) is further introduced into the model. Additionally, previous research shows that well-established financial systems allocate capital investment more efficiently than less developed ones [49], so we include financial development (fncdvl, the ratio of total deposit balance to GDP) as an additional control. Finally, we include internet development (Internet, the proportion of Internet broadband subscribers to the resident population). The rapid development of the Internet has facilitated the emergence of new financing channels, such as digital financial inclusion, which has improved access to capital for enterprises [50]. Note that i (i = 1… 285 cities) and t (t = 2004… 2019 years) denote city and year, respectively. All the regressions in this article have city fixed effects and time fixed effects, and the standard errors are clustered at city level.
3.2. Data
The corresponding data are described in detail below.
Our first set of data comes from China Banking and Insurance Regulatory Commission (CBIRC), which has made public all administrative penalties imposed on bank branches since 2004. These data only contain information on penalties imposed on banks, excluding penalties imposed on individuals. Each administrative punishment decision contains the name of the entity being punished and its legal person, the main facts about violations of laws and regulations, the legal provisions on which the punishment is based, the punishment decision, the authority that made the punishment decision, and the date of making the punishment decision.
Firstly, the samples were screened based on the main facts of violations. The samples that were punished due to the illegal issuance or use of loans were selected, including illegal issuance of loans, failure to use the loans according to the agreed purpose, inappropriate “three examinations of loans”7, and inappropriate post-loan management. Next, the total amount of fines for each penalty decision was calculated. Finally, by extracting the banks’ latitude and longitude information, we can pinpoint their cities and sum up fines to the city level to match our second set of data.
The second dataset was obtained from China City Statistical Yearbook, China Statistical Yearbook For Regional Economy, and statistical yearbooks at the provincial and city levels. Due to some missing values, we also referred to other data sources, such as the Wind Economic Database and the CEIC (https://insights.ceicdata.com/node/CN, accessed on 9 June 2022). This dataset provides information for both the independent and control variables.
For robustness testing, endogeneity analysis, mechanism testing, and heterogeneity testing, we also used some other variables in article8, which are described specifically when used. The majority of these variables are also from the second dataset, and a few variables that are not from the second dataset are described in detail later. The descriptive statistics of all variables are shown in Table 1. The correlation coefficient matrix of the variables is shown in Table 2. As can be seen from Table 2, there is no need to worry about the problem of multicollinearity.

Table 1.
Descriptive statistics.
Table 2.
Correlation coefficient matrix.
4. Empirical Results
In Section 4, we estimate the parameters of the aforementioned regression models using the two-way fixed effects model.
4.1. Benchmark Regression Results
Table 3 shows the benchmark regression results, reflecting the average impact of density on credit misallocation. The results show that the coefficient for density in Column (1) is positive and significant. This contradicts previous research findings. According to some previous studies, higher urban development densities are generally beneficial for productivity gains [51,52]. However, based on our empirical examination of Chinese cities, the findings of this study suggest that the pursuit of higher urban densities may result in efficiency loss.
Table 3.
Benchmark regression results: impact of density on credit misallocation.
To test the robustness of our results and obtain more reliable conclusions, we conducted several robustness tests. The first robustness test was to refine the sample. Some studies on regional disparities suggest that there is a statistical difference when municipalities are included and excluded from the samples. We deleted the four direct-administered municipalities from the samples. As shown in Column (2), the impact of density on misallocation was still significant. The municipality factor did not significantly change the results. The second robustness test made use of alternative density indicators. We substitute the population density with the employment density (see column (3) of Table 3) and the normalized cohesion index (see column (4) of Table 3), respectively. The employment density (density2) is the number of employment population9 per unit area. The normalized cohesion index10 (nCohesion10) measures the shape compactness of the urban footprints [53]. Additionally, we controlled for the GDP per capita (see column (5) of Table 3) based on the baseline regression and winsorized all variables at the 1st and 99th percentile (see column (6) of Table 3). As shown in the Table, the basic conclusions are still robust.
It is important to note that, in addition to fines, penalty decisions include the following types: confiscation, prohibition of banking jobs, disqualification, prohibition of doing business, warning, ordering the institution to correct their practices, and disciplinary punishment. However, we did not use these penalties for the alternative of fines as robustness tests. There are two reasons for this: Firstly, the higher the fine, the more serious the violation. Other penalties are qualitative in nature and difficult to quantify, making them unsuitable for use as a quantitative indicator of the severity of the violation. Secondly, most violations are punished with fines, which are supplemented by other penalties such as warnings or disqualification. If no fines are used as explanatory variables and only any of the other penalties are used, there is a risk of quantitative bias, resulting in biased estimation results.
4.2. Endogenous Test
Given the possibility of endogeneity issues, we use the instrumental variable methods to re-estimate the model. The relief degree of the land surface (Rdls) is used as an instrument for density. The relief degree of the land surface is an important factor in the macroscopic description of landforms and is often used as an exogenous variable in economic studies. On the one hand, there is a strong relationship between topographic relief and population density in China; on the other hand, topography is a natural phenomenon that is highly random and exogenous and thus can be considered independent of socio-economic factors. As a result, it is highly predictive of urban agglomeration but uncorrelated with credit misallocation. The data were obtained from http://www.geodoi.ac.cn/WebCn/doi.aspx?Id=887 (accessed on 9 June 2022). The re-estimation results show that the coefficients are significant in both stages, and the Cragg-Donald Wald F statistic is greater than 16.38, indicating that there is no need to be concerned about weak instrumental variables. Table 4 displays the results of the second-stage regression. It demonstrates that the positive relationship between agglomeration and credit misallocation is still robust. To enhance the robustness of the conclusion, we add the average wages of employees in urban units (Salary) as an additional instrumental variable for density. The estimation results show that the coefficients are significant in both stages, and the Cragg-Donald Wald F statistic is greater than 16.38, indicating that weak instrumental variables are not a concern. The results of the second stage regression are shown in Column (2) of Table 4, and the results further demonstrate the robustness of our finding.
Table 4.
IV estimates of the effects of density on credit misallocation.
4.3. Mechanism Analysis
We then investigated how agglomeration affects credit misallocation. Specifically, we examined whether population density affects credit misallocation through the crowding-out effect brought about by house prices. In this analysis, we replaced the explained variable fine with HsPr_real and Hsinr. HsPr_real represents the average sales price of commercial properties, which is the ratio of sales to the sales area of commercial housing and is deflated by CPI. Hsinr is the ratio of house price to GDP per capita, which is used to reflect the extent to which the level of house price matches the level of residents’ income. Table 5 shows the results of the mechanical tests.
Table 5.
Mechanism tests: impact of density on credit misallocation.
In Table 5, the coefficient of density is positive and significant in Column (1), indicating that urban agglomeration leads to rising housing prices; the coefficient of HsPr_real is positive and significant in Column (2), indicating that high house prices cause the credit misallocation. The mediating effect of the housing price-to-income ratio is broadly similar. The coefficient of density is positive and significant in Column (3), indicating that urban agglomeration leads to a rising housing price-to-income ratio; and the coefficient of Hsinr is positive and significant in Column (4), indicating that high housing price-to-income ratio causes the credit misallocation. By analyzing the administrative penalties imposed by the CBIRC, we found that the banks’ violations do mainly involve the real estate sector and consist of two main types of violations: firstly, help to finance projects related to real estate enterprises for non-compliance with the regulations; and secondly, irregularly granted personal loans actually flowing into real estate, such as inadequate management of business loans and mortgage loans for second-hand properties. This confirms our analysis and warns of the misallocation of credit caused by rising house prices. The conclusion that lowering the cost of congestion in housing can make cities run more efficiently is consistent with Grover’s [13] viewpoint.
Much of the existing research suggests that the issue of land finance cannot be ignored when discussing the issue of house prices in China [54,55]. Land finance refers to the reliance of local governments on revenues from the sale of land use rights to sustain local fiscal expenditures. Under China’s current fiscal system, local governments are heavily dependent on land finance for their revenue, and it is the ‘rational choice’ of local governments to push up property prices in order to obtain higher land revenue. In order to maximize land revenue, local governments try to raise land prices, which will undoubtedly increase the construction costs of real estate developers, thus causing a sharp rise in property prices. Taking this fact into account, this paper uses a sub-sample regression to test the heterogeneous effect of land finance on the intermediate mechanism of this paper, and the regression results are shown in Table 6. The higher a region’s public budget expenditure is, the higher its revenue tends to be, and revenue is mainly derived from land finance. We therefore use the share of local public budget expenditure in GDP (fiscal) to measure the extent to which cities rely on land finance. The samples were divided into two groups based on the median value, and the regression results for samples less than the median value are shown in column (1) of Table 6, and those greater than the median value are shown in column (2) of Table 6. We find that the effect of density on house prices (housing price-to-income ratio) is significantly positive regardless of the level of reliance on land finance. However, the increase in house prices (housing price-to-income ratio) due to increased density is more severe in areas with a high reliance on land finance. As a result, rather than relying on short-term macroeconomic policy, fiscal and taxation reforms must be implemented first in order to construct an effective long-term mechanism for the stable development of the real estate market.
Table 6.
Heterogeneous intermediary effects: impact of density on fine.
4.4. Heterogeneity Analysis
In this section, we analyze the heterogeneity of impacts from four perspectives, including the city’s economic development, size, manufacturing capacity, and reliance on land finance.
Given China’s wide disparities in regional economic development, the impact of urban agglomeration may also differ by region. Manufacturing industries in developed regions are more productive and may be more tolerant of rising production costs caused by rising house prices. At the same time, developed regions have a higher level of financial development and advantages in terms of the financial sector size, financial factor concentration, and the effectiveness of financial services for the real economy, making it relatively easy to finance manufacturing industries. According to commercial bank nonperforming loan (NPL) statistics for 2019, the five regions with the lowest NPL ratios11 (Beijing, Shanghai, Zhejiang, Jiangsu, and Guangdong) all belonged to developed regions. In comparison to less developed regions, the rise in house prices is less likely to crowd out the manufacturing sector, and the degree of credit misallocation is likely to be lower. Therefore, it is necessary to identify the heterogeneous effects in regions with different levels of economic development. We divided all cities into two groups: eastern cities (region = 1) and other cities (region = 0), and then regressed each group separately. Cities in the eastern region are close to the coastline and are representative of the developed regions, while the other regions are relatively less developed. The results of the regressions, shown in columns (1)–(2) of Table 7, indicate that the effect of density on fines is not significant in the eastern region, while it is significantly positive in the other regions, reflecting the credit allocation advantage of developed regions. It implies that not all cities are suited to compact development. Pursuing compact development in an area with little economic development may result in serious credit misallocation issues.
Table 7.
Heterogeneous effects: impact of density on credit misallocation.
An urban agglomeration is closely related to city size, which varies across prefecture-level cities in China. To further investigate the relationship between urban agglomeration and credit misallocation, this paper divides the total sample into two sub-samples: first-tier/new first-tier cities (large cities, level = 1) and other cities (small and medium-sized cities, level = 0)12, the results of which are shown in columns (3)–(4) of Table 7. The findings indicate that agglomeration has a significantly negative effect on credit misallocation in large cities, implying that agglomeration in large cities is more efficient and can alleviate the problem of credit misallocation. The effect of population density on credit misallocation is significantly positive for small and medium-sized cities, indicating that credit misallocation caused by increased density occurs primarily in small and medium-sized cities. Yao et al. [56] also discovered the heterogeneous effects for each city type when studying the relationship between agglomeration economies and urban efficiency in China. They found that higher population density and compact urban form benefit the urban economic efficiencies of large cities but not the technical efficiency of small cities. Our results are consistent with this finding.
We mentioned in the mechanism analysis that high house prices crowd out manufacturing, causing capital to flow to low-productivity but high-profit real estate firms, resulting in a misallocation of credit. To further test this hypothesis, we take manufacturing capacity into account and investigate whether the positive relationship between urban agglomeration and credit misallocation is influenced by manufacturing capacity. The path of influence can be further confirmed if urban agglomeration does not lead to credit misallocation in cities with sufficient capacity, whereas it does in cities with insufficient capacity. We divide all cities into two groups based on their manufacturing capacity utilization (Caputilise), sufficient capacity (Caputilise <= 0.90), and insufficient capacity (Caputilise > 0.90), and run regressions for each of the two groups, with the results shown in columns (1)–(2) of Table 8. The results show that the impact is significantly positive for cities with insufficient manufacturing capacity but not significant for cities with sufficient manufacturing capacity, supporting our research hypothesis. This indicates that, in cities with insufficient capacity, encouraging urban compactness inhibits the expansion of land-intensive manufacturing, resulting in misallocation and loss of efficiency.
Table 8.
Heterogeneous effects: impact of density on fine.
In Section 4.3, we discussed the moderating effect of land finance on intermediate mechanisms. We discovered that increased density leads to a greater increase in house prices in areas with a high reliance on land finance. Following that, we examine whether heterogeneous effects of land finance on aggregate effects exist, i.e., whether differences in cities’ reliance on land finance result in differences in the externalities of urban agglomeration in terms of credit misallocation. We divide the total sample into two groups, one with a high reliance on land finance and one with a low reliance on land finance, and run regressions on both groups separately. The regression results are shown in Table 8’s columns (3)–(4), and they show that increased density has no effect on credit misallocation in cities with low reliance on land finance, but it has a significant positive effect in cities with high reliance on land finance. This result is consistent with the result in Section 4.3, indicating that high density does not always result in credit misallocation and that misallocation can be avoided when cities reduce their reliance on land finance.
5. Discussion and Conclusions
The majority of empirical research on urban agglomeration externalities is for the developed countries (e.g., USA and Europe), which differ in key aspects from much of the developing world. These countries have high levels of urban economic development and tend to have higher productivity, which likely mitigates agglomeration diseconomies. However, in some developing countries, agglomeration may bring serious negative externalities. Scholars have begun to highlight the variation in the externalities of agglomeration across countries [57,58,59]. Empirical studies from various countries are important for adding nuance to our understanding of cities and economic growth, but they are insufficiently sophisticated. A major knowledge gap has arisen due to the limited understanding of agglomeration externalities in developing countries. Filling this knowledge gap is important as most of the future urban growth is expected to be in developing countries [59].
This research looks at a country with a different economic background than high-productivity and developed economies. In our analysis of the relationship between urban agglomeration and credit misallocation in the 285 cities in China, we find that the various measures of agglomeration correlate positively with credit misallocation. The population density of cities, employment density, and urban compactness are all significantly associated with credit misallocation, even when estimated using instrumental variables. The increase in housing demand caused by agglomeration leads to higher house prices. Banks preferred housing-related loans as a result of the difference in profitability between industries (manufacturing vs. real estate). More capital flowed to low-productivity firms, leading to a misallocation of credit. Moreover, the government’s reliance on land finance resulted in more severe house price inflation and, as a result, a more severe resource misallocation.
However, agglomeration does not necessarily lead to increased credit misallocation, and the impact is heterogeneous for different types of cities. For developed cities (Tier 1/New Tier 1, or eastern cities), cities with sufficient manufacturing capacity or low reliance on land finance, agglomeration does not lead to credit misallocation problems. The results of this study demonstrate the contingent nature of agglomeration externalities and the importance of city characteristics in determining urban agglomeration externalities. In China, manufacturing industries in large cities are more productive and more tolerant of increased production costs than those in smaller cities. Moreover, large cities have higher levels of financial development. As a result, manufacturing in large cities is relatively less negatively affected by rising house prices and is less likely to lead to the misallocation of credit. However, in smaller cities where manufacturing productivity is lower, and high house prices due to agglomeration exert a larger pressure on manufacturing, it is not surprising that increased density leads to a misallocation of credit. This reveals that the impact of agglomeration externalities in countries or regions with different development characteristics needs more research.
Our findings imply that, while encouraging compact development patterns, the government should be wary of the agglomeration costs associated with population clustering. The policy implications are twofold. On the one hand, when increasing urban density, governments should consider the specific characteristics of their cities (e.g., productivity, industry level, institutional context). Not all increases in city density are beneficial, and it would be prudent to tailor the direction and strategy of urban development to the specific characteristics of cities. On the other hand, governments should concentrate on regulatory instruments that reduce volatility. Typically, residential investment and house price cycles tend to lead to credit and business cycles [60,61,62]. Given the importance of house prices and credit dynamics in shaping endogenous boom–bust cycles for the real economy [63], appropriate government interventions and institutional constraints are needed to stabilize this instability and mitigate the harm caused by volatility. Minsky called them “thwarting institutions” in that they thwarted instability [42]. Related research suggests that “Thwarting institutions” (such as housing purchase restrictions and bank supervision) are effective in mitigating credit misallocation [64,65]. However, the Chinese government’s reliance on land finance exacerbates the credit misallocation effect, amplifying volatility. This should serve as a wake-up call to governments in developing countries where urbanization is accelerating.
Author Contributions
Conceptualization, Y.T.; Methodology, L.L.; Software, L.L.; Formal analysis, L.L.; Resources, H.C.; Data curation, H.C.; Writing—original draft, L.L.; Writing—review and editing, L.L.; Supervision, Y.T.; Funding acquisition, H.C. All authors have read and agreed to the published version of the manuscript.
Funding
This research received no external funding.
Institutional Review Board Statement
Not applicable.
Informed Consent Statement
Not applicable.
Data Availability Statement
Data are available from the authors upon request.
Conflicts of Interest
The authors declare no conflict of interest.
Notes
| 1 | |
| 2 | It is only since 2012 that foreign-owned financial institutions have been implementing the statistical system for classifying loans by sector. Prior to that, foreign capital was not included in the industrial classification of loan statistics. Furthermore, the earliest available data on loan balances by sector is from 2009. |
| 3 | For more information on the industrial enterprises above the designated size, please visit the website (https://data.stats.gov.cn/easyquery.htm?cn=C01&zb=A0E020U&sj=2021, accessed on 9 June 2022). |
| 4 | Data source: (1) China Statistical Yearbook; (2) Yearbook of the Chinese Investment in Fixed Assets. |
| 5 | Please see Section 3.2 data of this paper for more details about the variables and data. |
| 6 | Notes: Stata’s binScatter command is used for drawing. For a detailed explanation of this command, please refer to Michael Stepner’s (2014) binscatter: Binned Scatterplots in Stata: https://michaelstepner.com/binscatter/binscatter-StataConference2014.pdf (accessed on 27 February 2023). We divide all samples equally into 20 groups according to population density and record the median of population density as x (x1, x2, …, x20), and then calculate the average (y) of fines respectively in each group. Finally, the combination of (x, y) is the corresponding point in the scatter plot. |
| 7 | “Three examinations of loans” is the abbreviation of “investigation before loan, examination during loan, and inspection after loan”. |
| 8 | The following variables will be introduced later in the paper: density2, region, level, Caputilise, Hspr_real, Hsinr, Rdls, nCohesion10, lnpcgdp, Salary. |
| 9 | Persons Employed in Various Units in Districts under City at Year-end. |
| 10 | For a detailed description and calculation of the variable, please refer to Liu and Tian [53]. |
| 11 | It should be noted that Tibet has the lowest NPL rate, but it is not included in our regression sample because of the lack of statistics. |
| 12 | Cities are classified into several categories based on their commercial attractiveness. The detailed categories can be found at https://www.yicai.com/news/101063860.html (accessed on 13 June 2022). |
References
- Eberts, R.W.; McMillen, D.P. Agglomeration economies and urban public infrastructure. Handb. Reg. Urban Econ. 1999, 3, 1455–1495. [Google Scholar]
- Andersson, R.; Quigley, J.M.; Wilhelmsson, M. Agglomeration and the spatial distribution of creativity. Pap. Reg. Sci. 2005, 84, 445–464. [Google Scholar] [CrossRef]
- Baltzopoulos, A. Agglomeration Externalities and Entrepreneurship—Micro-Level Evidence from Sweden. CESIS Electronic Working Paper No. 190. 2009. Available online: https://static.sys.kth.se/itm/wp/cesis/cesiswp190.pdf (accessed on 27 February 2023).
- Boix, R.; Trullén, J. Knowledge, networks of cities and growth in regional urban systems. Pap. Reg. Sci. 2007, 86, 551–574. [Google Scholar] [CrossRef]
- Combes, P.-P.; Gobillon, L. The empirics of agglomeration economies. In Handbook of Regional and Urban Economics; Elsevier: Amsterdam, The Netherlands, 2015; Volume 5, pp. 247–348. [Google Scholar]
- Davis, M.A.; Fisher, J.D.; Whited, T.M. Macroeconomic implications of agglomeration. Econometrica 2014, 82, 731–764. [Google Scholar]
- Thisse, J.-F.; Fujita, M. (Eds.) Increasing Returns and Transport Costs: The Fundamental Trade-off of a Spatial Economy. In Economics of Agglomeration: Cities, Industrial Location, and Globalization, 2nd ed.; Cambridge University Press: Cambridge, UK, 2013; pp. 99–148. [Google Scholar] [CrossRef]
- United Nations. World Urbanization Prospects; Department of Economic and Social Affairs Population Division: New York, NY, USA, 2018. [Google Scholar]
- Brinkman, J.C. Congestion, agglomeration, and the structure of cities. J. Urban Econ. 2016, 94, 13–31. [Google Scholar] [CrossRef]
- Cheng, Z. The spatial correlation and interaction between manufacturing agglomeration and environmental pollution. Ecol. Indic. 2016, 61, 1024–1032. [Google Scholar] [CrossRef]
- Combes, P.-P.; Duranton, G.; Gobillon, L. The Costs of Agglomeration: House and Land Prices in French Cities. Rev. Econ. Stud. 2019, 86, 1556–1589. [Google Scholar] [CrossRef]
- Ge, Y. Regional Inequality, Industry Agglomeration and Foreign Trade: The Case of China. WIDER Research Paper. 2006. Available online: https://www.researchgate.net/profile/Ying-Ge-11/publication/252653403_Regional_Inequality_Industry_Agglomeration_and_Foreign_Trade_The_Case_of_China/links/00b7d532cf59e73a1c000000/Regional-Inequality-Industry-Agglomeration-and-Foreign-Trade-The-Case-of-China.pdf (accessed on 27 February 2023).
- Grover, A.; Lall, S.V.; Maloney, W.F. Agglomeration Economies, Productivity, and the Persistence of Place. In Place, Productivity, and Prosperity: Revisiting Spatially Targeted Policies for Regional Development; The World Bank: Washington, DC, USA, 2022; pp. 11–44. [Google Scholar] [CrossRef]
- Ge, Y. Globalization and Industry Agglomeration in China. World Dev. 2009, 37, 550–559. [Google Scholar] [CrossRef]
- Li, D.; Lu, Y.; Wu, M. Industrial agglomeration and firm size: Evidence from China. Reg. Sci. Urban Econ. 2012, 42, 135–143. [Google Scholar] [CrossRef]
- Hsieh, C.-T.; Klenow, P.J. Misallocation and manufacturing TFP in China and India. Q. J. Econ. 2009, 124, 1403–1448. [Google Scholar] [CrossRef]
- Song, Z.; Wu, G.L. Identifying Capital Misallocation; Work Paper; University Chicago: Chicago, IL, USA, 2015. [Google Scholar]
- Banerjee, A.V.; Moll, B. Why Does Misallocation Persist? Am. Econ. J. Macroecon. 2010, 2, 189–206. [Google Scholar] [CrossRef]
- Duranton, G.; Ghani, S.E.; Goswami, A.G.; Kerr, W.; Ghani, S.E.; Kerr, W.R. Effects of Land Misallocation on Capital Allocations in India. SSRN Scholarly Paper No. 2677021. 2015. Available online: https://papers.ssrn.com/abstract=2677021 (accessed on 27 February 2023).
- Pan, S.; Shi, K.; Wang, L.; Xu, J. Excess liquidity and credit misallocation: Evidence from China. China Econ. J. 2017, 10, 265–286. [Google Scholar] [CrossRef]
- Levine, R. Financial development and economic growth: Views and agenda. J. Econ. Lit. 1997, 35, 688–726. [Google Scholar]
- Levine, R. Finance and growth: Theory and evidence. Handb. Econ. Growth 2005, 1, 865–934. [Google Scholar]
- Beck, T.; Demirgüç-Kunt, A.; Maksimovic, V. Financial and legal constraints to growth: Does firm size matter? J. Financ. 2005, 60, 137–177. [Google Scholar] [CrossRef]
- Charumilind, C.; Kali, R.; Wiwattanakantang, Y. Connected Lending: Thailand before the Financial Crisis. J. Bus. 2006, 79, 181–218. [Google Scholar] [CrossRef]
- Boyreau-Debray, G.; Wei, S.-J. Pitfalls of a State-Dominated Financial System: The Case of China; National Bureau of Economic Research: Cambridge, MA, USA, 2005. [Google Scholar]
- Song, Z.; Storesletten, K.; Zilibotti, F. Growing like china. Am. Econ. Rev. 2011, 101, 196–233. [Google Scholar] [CrossRef]
- Acharya, V.V.; Crosignani, M.; Eisert, T.; Steffen, S. Zombie lending: Theoretical, international, and historical perspectives. Annu. Rev. Financ. Econ. 2022, 14, 21–38. [Google Scholar] [CrossRef]
- Bruche, M.; Llobet, G. Preventing zombie lending. Rev. Financ. Stud. 2014, 27, 923–956. [Google Scholar] [CrossRef]
- Restuccia, D.; Rogerson, R. Misallocation and productivity. In Review of Economic dynamics; Elsevier: Amsterdam, The Netherlands, 2013; Volume 16, pp. 1–10. [Google Scholar]
- Buera, F.J.; Kaboski, J.P.; Shin, Y. Finance and development: A tale of two sectors. Am. Econ. Rev. 2011, 101, 1964–2002. [Google Scholar] [CrossRef]
- Chen, K.; Irarrazabal, A. The role of allocative efficiency in a decade of recovery. Rev. Econ. Dyn. 2015, 18, 523–550. [Google Scholar] [CrossRef]
- Fujii, D.; Nozawa, Y. Misallocation of Capital during Japan’s Lost Two Decades. Development Bank of Japan Working Paper, 1304. 2013. Available online: https://www.dbj.jp/ricf/pdf/research/DBJ_DP_1304.pdf (accessed on 27 February 2023).
- Gopinath, G.; Kalemli-Özcan, Ş.; Karabarbounis, L.; Villegas-Sanchez, C. Capital allocation and productivity in South Europe. Q. J. Econ. 2017, 132, 1915–1967. [Google Scholar] [CrossRef]
- Wu, G.L. Capital misallocation in China: Financial frictions or policy distortions? J. Dev. Econ. 2018, 130, 203–223. [Google Scholar] [CrossRef]
- Banerjee, A.; Munshi, K. How efficiently is capital allocated? Evidence from the knitted garment industry in Tirupur. Rev. Econ. Stud. 2004, 71, 19–42. [Google Scholar] [CrossRef]
- Banerjee, A.V.; Duflo, E. Growth theory through the lens of development economics. Handb. Econ. Growth 2005, 1, 473–552. [Google Scholar] [CrossRef]
- Greenwood, J.; Sanchez, J.M.; Wang, C. Financing development: The role of information costs. Am. Econ. Rev. 2010, 100, 1875–1891. [Google Scholar] [CrossRef]
- McMillan, J.; Woodruff, C. Interfirm relationships and informal credit in Vietnam. Q. J. Econ. 1999, 114, 1285–1320. [Google Scholar] [CrossRef]
- Johnson, S.; McMillan, J.; Woodruff, C. Courts and relational contracts. J. Law Econ. Organ. 2002, 18, 221–277. [Google Scholar] [CrossRef]
- Wei, X.; Chen, Y.; Zhou, M.; Zhou, Y. SOE preference and credit misallocation: A model and some evidence from China. Econ. Lett. 2016, 138, 38–41. [Google Scholar] [CrossRef]
- Park, J. Corruption, soundness of the banking sector, and economic growth: A cross-country study. J. Int. Money Financ. 2012, 31, 907–929. [Google Scholar] [CrossRef]
- Palley, T.I. A theory of Minsky super-cycles and financial crises. Contrib. Political Econ. 2011, 30, 31–46. [Google Scholar] [CrossRef]
- Chen, T.; Liu, L.X.; Zhou, L.-A. The Crowding-Out Effects of Real Estate Shocks—Evidence from China. SSRN Scholarly Paper No. 2584302. Social Science Research Network. 2015. Available online: https://ssrn.com/abstract=2584302 (accessed on 27 February 2023).
- Miao, J.; Wang, P. Asset bubbles and credit constraints. Am. Econ. Rev. 2018, 108, 2590–2628. [Google Scholar] [CrossRef]
- Bleck, A.; Liu, X. Credit expansion and credit misallocation. J. Monet. Econ. 2018, 94, 27–40. [Google Scholar] [CrossRef]
- Stein, J.C. Prices and trading volume in the housing market: A model with down-payment effects. Q. J. Econ. 1995, 110, 379–406. [Google Scholar] [CrossRef]
- Wurgler, J. Financial markets and the allocation of capital. J. Financ. Econ. 2000, 58, 187–214. [Google Scholar] [CrossRef]
- Cheng, M.; Guo, P.; Jin, J.Y.; Geng, H. Political uncertainty and city bank lending in China: Evidence from city government official changes. Emerg. Mark. Rev. 2021, 49, 100802. [Google Scholar] [CrossRef]
- Marconi, D.; Upper, C. Capital Misallocation and Financial Development: A Sector-Level Analysis. Bank of Italy Temi di Discussione (Working Paper) No. 1143. 2017. Available online: https://ssrn.com/abstract=3066694 (accessed on 27 February 2023).
- He, G.; Shen, L. Whether Digital Financial Inclusion Can Improve Capital Misallocation or Not: A Study Based on the Moderating Effect of Economic Policy Uncertainty. Discret. Dyn. Nat. Soc. 2021, 2021, e4912836. [Google Scholar] [CrossRef]
- Boyko, C.T.; Cooper, R. Clarifying and re-conceptualising density. Prog. Plan. 2011, 76, 1–61. [Google Scholar] [CrossRef]
- Holman, N.; Mace, A.; Paccoud, A.; Sundaresan, J. Coordinating density; working through conviction, suspicion and pragmatism. Prog. Plan. 2015, 101, 1–38. [Google Scholar] [CrossRef]
- Liu, L.; Tian, Y. Compact urban form and human development: Retest based on heterogeneous effects. Int. J. Environ. Res. Public Health 2022, 19, 2198. [Google Scholar] [CrossRef]
- Pan, J.-N.; Huang, J.-T.; Chiang, T.-F. Empirical study of the local government deficit, land finance and real estate markets in China. China Econ. Rev. 2015, 32, 57–67. [Google Scholar] [CrossRef]
- Fu, Q. When fiscal recentralisation meets urban reforms: Prefectural land finance and its association with access to housing in urban China. Urban Stud. 2015, 52, 1791–1809. [Google Scholar] [CrossRef]
- Yao, Y.; Pan, H.; Cui, X.; Wang, Z. Do compact cities have higher efficiencies of agglomeration economies? A dynamic panel model with compactness indicators. Land Use Policy 2022, 115, 106005. [Google Scholar] [CrossRef]
- Ahfeldt, G.M.; Pietrostefani, E. The Compact City in Empirical Research: A Quantitative Literature Review. 2017. Available online: http://eprints.lse.ac.uk/id/eprint/83638 (accessed on 27 February 2023).
- Chauvin, J.P.; Glaeser, E.; Ma, Y.; Tobio, K. What is different about urbanization in rich and poor countries? Cities in Brazil, China, India and the United States. J. Urban Econ. 2017, 98, 17–49. [Google Scholar] [CrossRef]
- Grover, A.; Lall, S.V.; Timmis, J. Agglomeration Economies in Developing Countries [Working Paper]; World Bank: Washington, DC, USA, 2021. [Google Scholar] [CrossRef]
- Leamer, E.E. Housing Is the Business Cycle; National Bureau of Economic Research: Cambridge, MA, USA, 2007. [Google Scholar]
- Leamer, E.E. Housing Really Is the Business Cycle: What Survives the Lessons of 2008–09? J. Money Credit Bank. 2015, 47, 43–50. [Google Scholar] [CrossRef]
- Crowe, C.; Dell’Ariccia, G.; Igan, D.; Rabanal, P. How to deal with real estate booms: Lessons from country experiences. J. Financ. Stab. 2013, 9, 300–319. [Google Scholar] [CrossRef]
- Dong, F.; Xu, Z. Cycles of credit expansion and misallocation: The Good, the Bad and the Ugly. J. Econ. Theory 2020, 186, 104994. [Google Scholar] [CrossRef]
- Chen, T.; Liu, L.; Xiong, W.; Zhou, L.-A. Real Estate Boom and Misallocation of Capital in China; Work Paper; Princeton University: Princeton, NJ, USA, 2017; Volume 9. [Google Scholar]
- Chortareas, G.E.; Girardone, C.; Ventouri, A. Bank supervision, regulation, and efficiency: Evidence from the European Union. J. Financ. Stab. 2012, 8, 292–302. [Google Scholar] [CrossRef]
Disclaimer/Publisher’s Note: The statements, opinions and data contained in all publications are solely those of the individual author(s) and contributor(s) and not of MDPI and/or the editor(s). MDPI and/or the editor(s) disclaim responsibility for any injury to people or property resulting from any ideas, methods, instructions or products referred to in the content. |
© 2023 by the authors. Licensee MDPI, Basel, Switzerland. This article is an open access article distributed under the terms and conditions of the Creative Commons Attribution (CC BY) license (https://creativecommons.org/licenses/by/4.0/).