Article

Application of GPR Prospection to Unveil Historical Stratification inside Monumental Buildings: The Case of San Leonardo de Siete Fuentes in Santu Lussurgiu, Sardinia, Italy

1
Department of Civil and Environmental Engineering, and Architecture (DICAAR), University of Cagliari, 09123 Cagliari, Italy
2
Now at Department of Geosciences, University of Malta, MSD 2080 Msida, Malta
3
Independent Researcher, 09100 Cagliari, Italy
*
Author to whom correspondence should be addressed.
Land 2023, 12(3), 590; https://doi.org/10.3390/land12030590
Submission received: 6 February 2023 / Revised: 23 February 2023 / Accepted: 27 February 2023 / Published: 1 March 2023
(This article belongs to the Special Issue Application of Georadar Mapping for Landscape Archaeology)

Abstract

:
Stratigraphy is a fundamental classification tool for archaeology on which modern excavation techniques are based, and essentially consists of a sedimentological, pedological and archaeological interpretation of the multiple cultural layers found while digging; this concept can be adopted when studying monumental buildings and, in particular, their hidden parts or elements. The precious and delicate surfaces of monuments need non-invasive techniques such as geophysical methods and in the present article, the use of GPR technique has been exploited through a dataset collected over the nave of the church of San Leonardo de Siete Fuentes in Sardinia. First, the georadar results have been jointly analyzed by means of the B- and C-scans, in which some most significant patterns were detected and analyzed by looking at their signal features over the investigated volume. Following the analysis, elements from the signal attribute analysis and horizon detection and visualization, with a 3D approach, were used. To strengthen the reliability of the GPR results, a thermal infrared survey was simultaneously carried out. Thanks to the integrated geophysical and historical analysis of the monument, the ancient layout of the church has been reconstructed and other targets of potential archaeological interest identified

1. Introduction

Stratigraphy is a key concept to modern archaeological theory and practice; modern excavation techniques are based on stratigraphic principles [1]. The idea that the features of an archaeological site are to be found in a stratified state is of primary importance in the investigation of these sites by archaeological excavation [2]. For the interpretation of archaeological sites, anthropic and natural or geological, stratifications must be considered [2]. Analyzing a site is conducted in archaeology by grouping single contexts together in ever larger groups, by reason of their relationships, to reconstruct a sequence and chronology of anthropic modifications. A stratified sequence is important, among others, to distinguish separate occupations within the same site and to aid with evaluating the degree of preservation of the archaeological occurrences accumulated at the site.
The same concepts can be adopted when studying monumental buildings and, in particular, their hidden parts or elements. In fact, current monumental buildings are the results of the phases of construction and modification activities resulting from changes in use. This is the case with historic public edifices such as churches or other religious architectures. For this reason, non-destructive surveys and geophysical methods are widely used to tease apart the complex formation histories of prehistoric and historical monuments.
The applications of non-invasive sensing techniques to explore the internal volumes of precious and delicate targets are now a quite common research and professional field.
Geophysical applications for archaeology and cultural heritage sites include electrical resistivity [3,4,5,6,7,8,9,10], induction electromagnetics [7,10,11,12], magnetics [13,14] seismics [15,16,17,18], thermography [19,20,21], multispectral [22,23,24,25], ground-based radar interferometry [26,27,28,29], and aerial and satellite remote sensing [30,31,32,33,34,35,36].
Among these, Ground Penetrating Radar (GPR) is one of the most flexible and diffuse methods due to its effectiveness (provided adequate environmental conditions) in identifying shallow archaeological features with a high spatial resolution [37,38,39,40,41,42,43,44,45,46,47,48,49,50,51,52,53,54,55,56]. GPR methods comprise numerous techniques of measure which mainly differ in the use of reflected or transmitted electromagnetic signals to study inaccessible domains of the medium. In half-space investigations, the most diffuse applications involve the use of zero-offset acquisitions moving the GPR device in contact with the ground surface and recording the electromagnetic signals backscattered by the underlying scenario. Reflections, refractions, and diffractions are generated in correspondence to the variations of the electromagnetic properties of the materials, depending on the differences in velocity between the two subdomains. The velocity of the microwave signal, on which contrast is mostly based the above-mentioned interaction, depends on both the electric and magnetic properties of the materials. In particular, the dielectric constant (εr) and the magnetic permittivity (μr) play a fundamental role, according, in good approximation, to the following equation [57]:
v = c μ r ε r
where v is the electromagnetic velocity in the medium and c is the light speed in the vacuum. It is worth noting that the dielectric constant is the leading parameter of this equation in most cases. When a target inside of the background medium has edges or dimensions comparable with the radar wavelength (that is, related to the velocity of the signal), diffraction is produced and electromagnetic waves are scattered in various directions. Even the minimum size of a recognizable target (spatial resolution) strongly depends on the wavelength of the electromagnetic signal and is a function of the depth, having better resolutions for the shallowest domains. The signal attenuation across a medium is mostly due to the frequency of each component of the electromagnetic waves and to the properties of the crossed material, especially its electrical conductivity.
GPR archaeological datasets are typically processed with quite common steps to avoid artifacts that could bring misleading interpretations. These steps include the compensation of the radar signal attenuation at the receiver, due to geometrical spreading and material absorption, and the cutting of spurious frequencies outside the emitting range of the GPR antenna. Radar focusing by data migration is also common but requires a reliable knowledge of the velocities across the investigated volumes to avoid over- or under-compensation.
In recent times, by adopting developments from seismics, GPR attribute analysis has been applied to increase the interpretability of experimental datasets [58,59,60,61]. Finally, even processing typical of urban utility search and geological prospecting, such as horizon detection, has been recently applied to very subtle targets such as buried human footprints [62]. Both of these groups of techniques will be applied in the present experimentation.
To exploit GPR ability in reconstructing useful information for the historical stratification of monuments, an experimental survey on the church of San Leonardo de Siete Fuentes in Santu Lussurgiu, Sardinia, is presented in the following sections.

2. Materials and Methods: The Site of Study

2.1. The Fabric of San Leonardo de Siete Fuentes in Santu Lussurgiu, Sardinia, Italy

Description of the Fabric

The church of San Leonardo, as it appears today, is a beautiful, late Romanesque architecture in well-squared basalt ashlars (Figure 1). The sacred building, East-oriented, has a modest gabled façade with two rectangular portals on the West side [63,64].
The façade is divided horizontally by round arches which separate the lower part with two portals from the upper tympanum. The tympanum is crowned by hanging round arches on corbels, below which an oculus is present. The lower part is divided in the middle by a half pilaster. Two larger half pilasters mark the borders of the façade; on the right one, there are traces of probable connecting structures with surrounding buildings. The portals are of the architrave and round lunette type. The left portal has a non-raised lunette, while the right portal has the raised lunette of an ashlar. The two portals present stylistic differences, however, they are similar, and their similarity was desired by the most recent builders [63,64].
The building has a rectangular plan with a square apse; still Romanesque outside, but with gothic features inside, such as the ribs section and the cross vault. However, there are Romanesque characters in the diagonal arches in the center, in the cruciform keystone without drooping gem, and in the peduncles decorated with stylized human heads, perhaps referable to the four evangelists. Little can be said, however, of the open window in the apse, since the current one is the result of a reconstruction restoration during years 1947-52 [63,64,65].
A portal similar to the left one of the principal façade was placed halfway up the north elevation, while a third entrance, similar to the previous two, was made in the South elevation originally in an alternate position and distinguished by two Maltese crosses carved in marble dice. In the past, this southern portal was walled up and a new portal was opened opposite to the northern one. The stylistic features of all these portals are very similar to the left one on the main façade. On the upper side of both the North and South walls, a single window was opened.
Across time, a single-wall bell tower was built with two bells. Executed in cut stone with a similar face to that of the first building stages, it was placed in continuation of the southern side of the church, towards the East. In the internal space, a small sacristy was created, accessible from the new little door open on the right wall of the apse [63,64].

2.2. The Problem of Dating the Building Stages: History of the Church of San Leonardo and of the Critics

2.2.1. Critics and History on the First Building Stages

During the Middle Ages, the building underwent several expansion interventions, but scholars don’t have unanimous ideas regarding its construction phases. The dating ranges shift from the middle XII century for the first layout and a subsequent expansion in the second half of the XIII, suggested by Dionigi Scano (1907) [66], Guido Crudeli (1952) [65], Raffaello Delogu (1953) [67], and Roberto Coroneo (1993) [68], to the new chronologies that place the first phase in the mid-13th by G. Deplano in 2008 [69], and the latter in the middle of the following century by Coroneo in 2005 [63,64].
Certainly, there was a priory in San Leonardo in the mid-twelfth century, when the document–sheet number 163 of the Condaghe of Trullas–mentions an entity called Septem Funtanas, but not better specified (in fact, the document does not specify whether it was a monastery, village, other), which shared the ownership of three farms (Olvesa, Arkennor and Bionis) and some servants with four Benedictine monasteries (Trullas, Saccargia, Tergu and Plaiano) and some Sardinian nobles [64,70]. A little further on, in sheet number 165, the foundation known as Septem Funtanas, perhaps the same as 163, shared with the Benedictine priory of San Nicola of Trullas the property of the «saltu de Serra de Nuke», under the jurisdiction of the agricultural settlement of Scano Montiferru [64,70].
From a stylistic point of view, and based on the details of the remaining parts, the classic thesis places the first layout of San Leonardo at a period following the foundation of Santa Maria di Bonarcado (first half of the 12th century), but prior to Santa Maria di Uta, which was perhaps carried out at the end of the 12th century or in the first years of the successes [64].

2.2.2. Historical Documents Related to the Expansion

In historiography, the expansion is dated to the passage of ownership of the church to the Hospitallers of Saint John (current Knights of Malta) and, therefore, to the second half of the XIII century, based on the assumption of the arrival of the Order in Sardinia in 1267, proposed by Damiano Filia [71]. Others move the date of this second phase a little later [66,67,68], using as a term of comparison the churches with a square apse, such as the Santa Maria Maddalena of Silì or the Santa Chiara of Oristano, dated or referring to various periods of the fourteenth century, as shown in Section 2.2.3. (Stylistic comparison with other monuments in the region of known building time (for dating to XIV the most part of the structure) [64]. Only for Roberto Coroneo can the restructuring of the church can be placed in the first quarter of the fourteenth century and completed in 1341, when the pontifical documentation provides certain news of a monastery [63].
The church certainly belonged to the Knights of Malta from 1343 to 1808, when it was expropriated and confiscated with all its properties by the Italian state (at the time known as the Kingdom of Sardinia) [64]. The presence of hospitaller knights in Sardinia is attested in documents from the first decades of the thirteenth century [70]. Little more than a century after the establishment of the Order, the Johannites arrived in Sardinia and had begun their activity by building–according to their mission–churches, convents, and hospitals. Despite the importance and notoriety achieved by the Order in a very short time, the documentation on their presence in Sardinia is very scarce and, moreover, very difficult to find [70].
The first sure memory of a Jerusalemite prior at Settefontane is dated 23 June 1343, in which the Hospitaller Buono appears («fratre Buono priore sive preceptore domus Sancti Leonardi de Septem Fontanis de Sardinea dicti ordinis»), dependent on the great priory of Pisa, the same friar Bono de Coicio, preceptor Septem Fontium, who made a payment to the Holy See in the year 1341 (die IIII mensis iulii habui et recepi a frate Bono de Coicio preceptore Septem Fontium et terrarum aliorum locorum modici valoris bosane diocesis pro solucione dictarum decimarum triennalium alfonsinorumminutorum lib. XXX) [64].
In 1362, it was explicitly stated that the San Leonardo was already in charge of the other properties of the Order in Sardinia; this implies that the reorganization of the Sardinian Hospitallers Johannite assets around the same domus of Sette Fontane had been redefined and completed [64,72].
As shown by a parchment of consecration (found during a renovation in the modern age and preserved in the Bosa Chapter Archive), the altar of San Leonardo was consecrated by the bishop of Bosa, Andrea, in June 1357 [64,69]. During the demolition of the fourteenth-century altar, which we do not have news about, a silver case was found under the sacred stone containing some relics and a membranous strip in which the dedication of the altar was read in 1357 at San Leonardo: «In the Year of the Lord 1357, month of June, this altar and the church were consecrated by Andrew, bishop of Bosa, in honor of the Almighty God, of the Blessed Mary, Mother of God, of the saints and of the blessed Leonard Confessor, and the relics of Saint Julian, Saint John and Saint Ambrose are contained» [73]. It was the consequence of the restoration and reconstruction works of the curia of Sette Fontane mentioned in a document of 1362, and which were carried out by the hospitaller friar Marco de Vita, who had also covered the expenses for the repairs. These works had been commissioned by the sovereign Mariano IV himself, who left the task to the priors of that time and their successors to continuare fabricam, evidently not yet completed [64,69].
A fourteenth-century document, preserved in the Municipal Archives of Cagliari, has been recently rediscovered and studied by Emanuele Melis. It is the dispute that arose between the inhabitants of Sette Fontane and the Johannite prior of San Leonardo, which was resolved thanks to the intervention of king Mariano IV of Arborea in October 1362 [72].
Then, the church of San Leonardo was enlarged, with the widening of the nave and the addition of the square apse, over twenty years of work between 1335 (completion of the square chapel in the cathedral of Oristano) and 1357 (consecration of the new altar). During the construction, in order to officiate Mass in the new building, it was a good idea to proceed first with the construction of the apse where the altar was inserted and then complete the rest of the building, adding the roof as the final step. The document of 1362 explicitly states that the factory had not yet been completed in that year. Furthermore, the task was left to future priors to continue fabricam. This could explain the off-axis positioning of the apse wall, which, from the plans, is not parallel to the façade, but also further delays the chronology until the 1380s, at almost the same time as the completion of the San Gavino of San Gavino Monreale [64].

2.2.3. Stylistic Comparison with Other Monuments in the Region of Known Building Time (for Dating to XIV the Most Part of the Current Structure)

Various churches with square apse are distributed in the central part of the island (Oristano, Silì, San Gavino Monreale, Mogoro, Sardara), as well as another to the south (Sant’Agata a Quartu S.Elena) and two to the north (churches of Taniga and Bosove, both near Sassari). In principle, they are dated or referred to various periods of the fourteenth century and, more properly, between the completion of the chapel of San Bartolomeo in the cathedral of Oristano mentioned in 1335, and the consecration of San Gavino in San Gavino Monreale in 1387. The Gothic window of the cathedral of Oristano–as well as the analogous ones in the churches of Santa Chiara, San Martino and Santa Maria Maddalena of Silì, in the same city and surroundings of Oristano,– are to be placed within the first half of the fourteenth century, when the semicircular apse was eliminated and built the transept with chapels, including that of San Bartolomeo which was mentioned as still under construction in the will of the king Ugone II (1335) [63,64].
The church of Santa Chiara in Oristano also has a quadrangular apse with a cross vault: it was founded ex novo in 1343, while the façade had already been completed before the summer of 1353. Inside, it preserves the tomb of Queen Costanza of Saluzzo, who died in 1348 [63,64].
The church of Santa Maria Maddalena of Silì (Oristano) appears for the first time in the aforementioned will of 1335 [63,64].
The San Gavino, in the town of the same name, began in 1347 (date engraved on an ashlar of the apse) and consecrated by the bishop of Terralba, Francesco Pasarino began on 25 October 1387, as it appears in the inscription of the internal frescoes [63,64].
Similarities of the window of the apse of San Leonardo can instead be made with the mullioned window of the apse of San Leonardo of Bosove, Santa Agata of Quartu Sant’Elena, the prospectus of Santa Maria delle Grazie of Iglesias, or with the opening closed in the facade of Santa Maria Assunta of Guspini [63,64].

2.2.4. Critics on the First-Stage Building

According to art historians and critics, a first single-nave hall with a semicircular apse could date back to the mid-12th century, to be enlarged in the 14th century with the demolition of the northern and eastern walls with the construction of the current quadrangular apse [66,67,68]. The primitive church was much smaller than the current one; it had a single rectangular nave of 4.23 m per 13.47 m, presumably ending to the east with a semicircular apse and with wooden roof trusses [65]. The façade had a tympanum, delimited by corner pilasters and tripartite by pilasters. There was a single entrance on monolithic jambs, a smooth architrave, surmounted by a semicircular arch raised by an ashlar, corresponding to the right portal of the current façade [63,64].
In the primitive church–perfectly oriented along the east-west axis–the lower part of the façade can be recognized as incorporated in the current building in which the right portal opens, including the hanging arches immediately above and the row of upper cantons, limited by two ashlars with oblique cuts [65,70,74]. The rectangular nave was closed to the east by a semicircular apsidiole, according to a design faithful to the Sardinian Romanesque models, presenting horizontal arching, probably a tympanum pediment, corner pilasters, and a flat shoe-molding base [65].
The design of the right portal, with a semicircular arch raised by an ashlar and surmounted by a cornice, is found in many churches with façades built or rebuilt between the middle of the 12th and the first quarter of the 13th. It is found, in fact, in many Sardinian Romanesque churches built by the mid-twelfth century, for the most part linked to monasteries (Trullas, Bonarcado, Plaiano, Soliu, etc.) or even cathedral churches (Santa Giusta, Olbia, Orotelli, Castro, Bisarcio, Ardara) due to a very rich clientele [63,64]. The same conformation of the portal is visible in small chapels with a single nave, quite similar in plan to the primitive San Leonardo, such as San Gregorio of Solarussa, Santa Maria of Norbello, St. Peter of Bidonì, St. Peter of Sindia, San Pietro of Onanì, Sant’Antonio of Ossi, Santa Vittoria of Tissi, built between the second half of the 12th century and the first half of the following [63,64].

3. Materials and Methods: The Experimental Framework

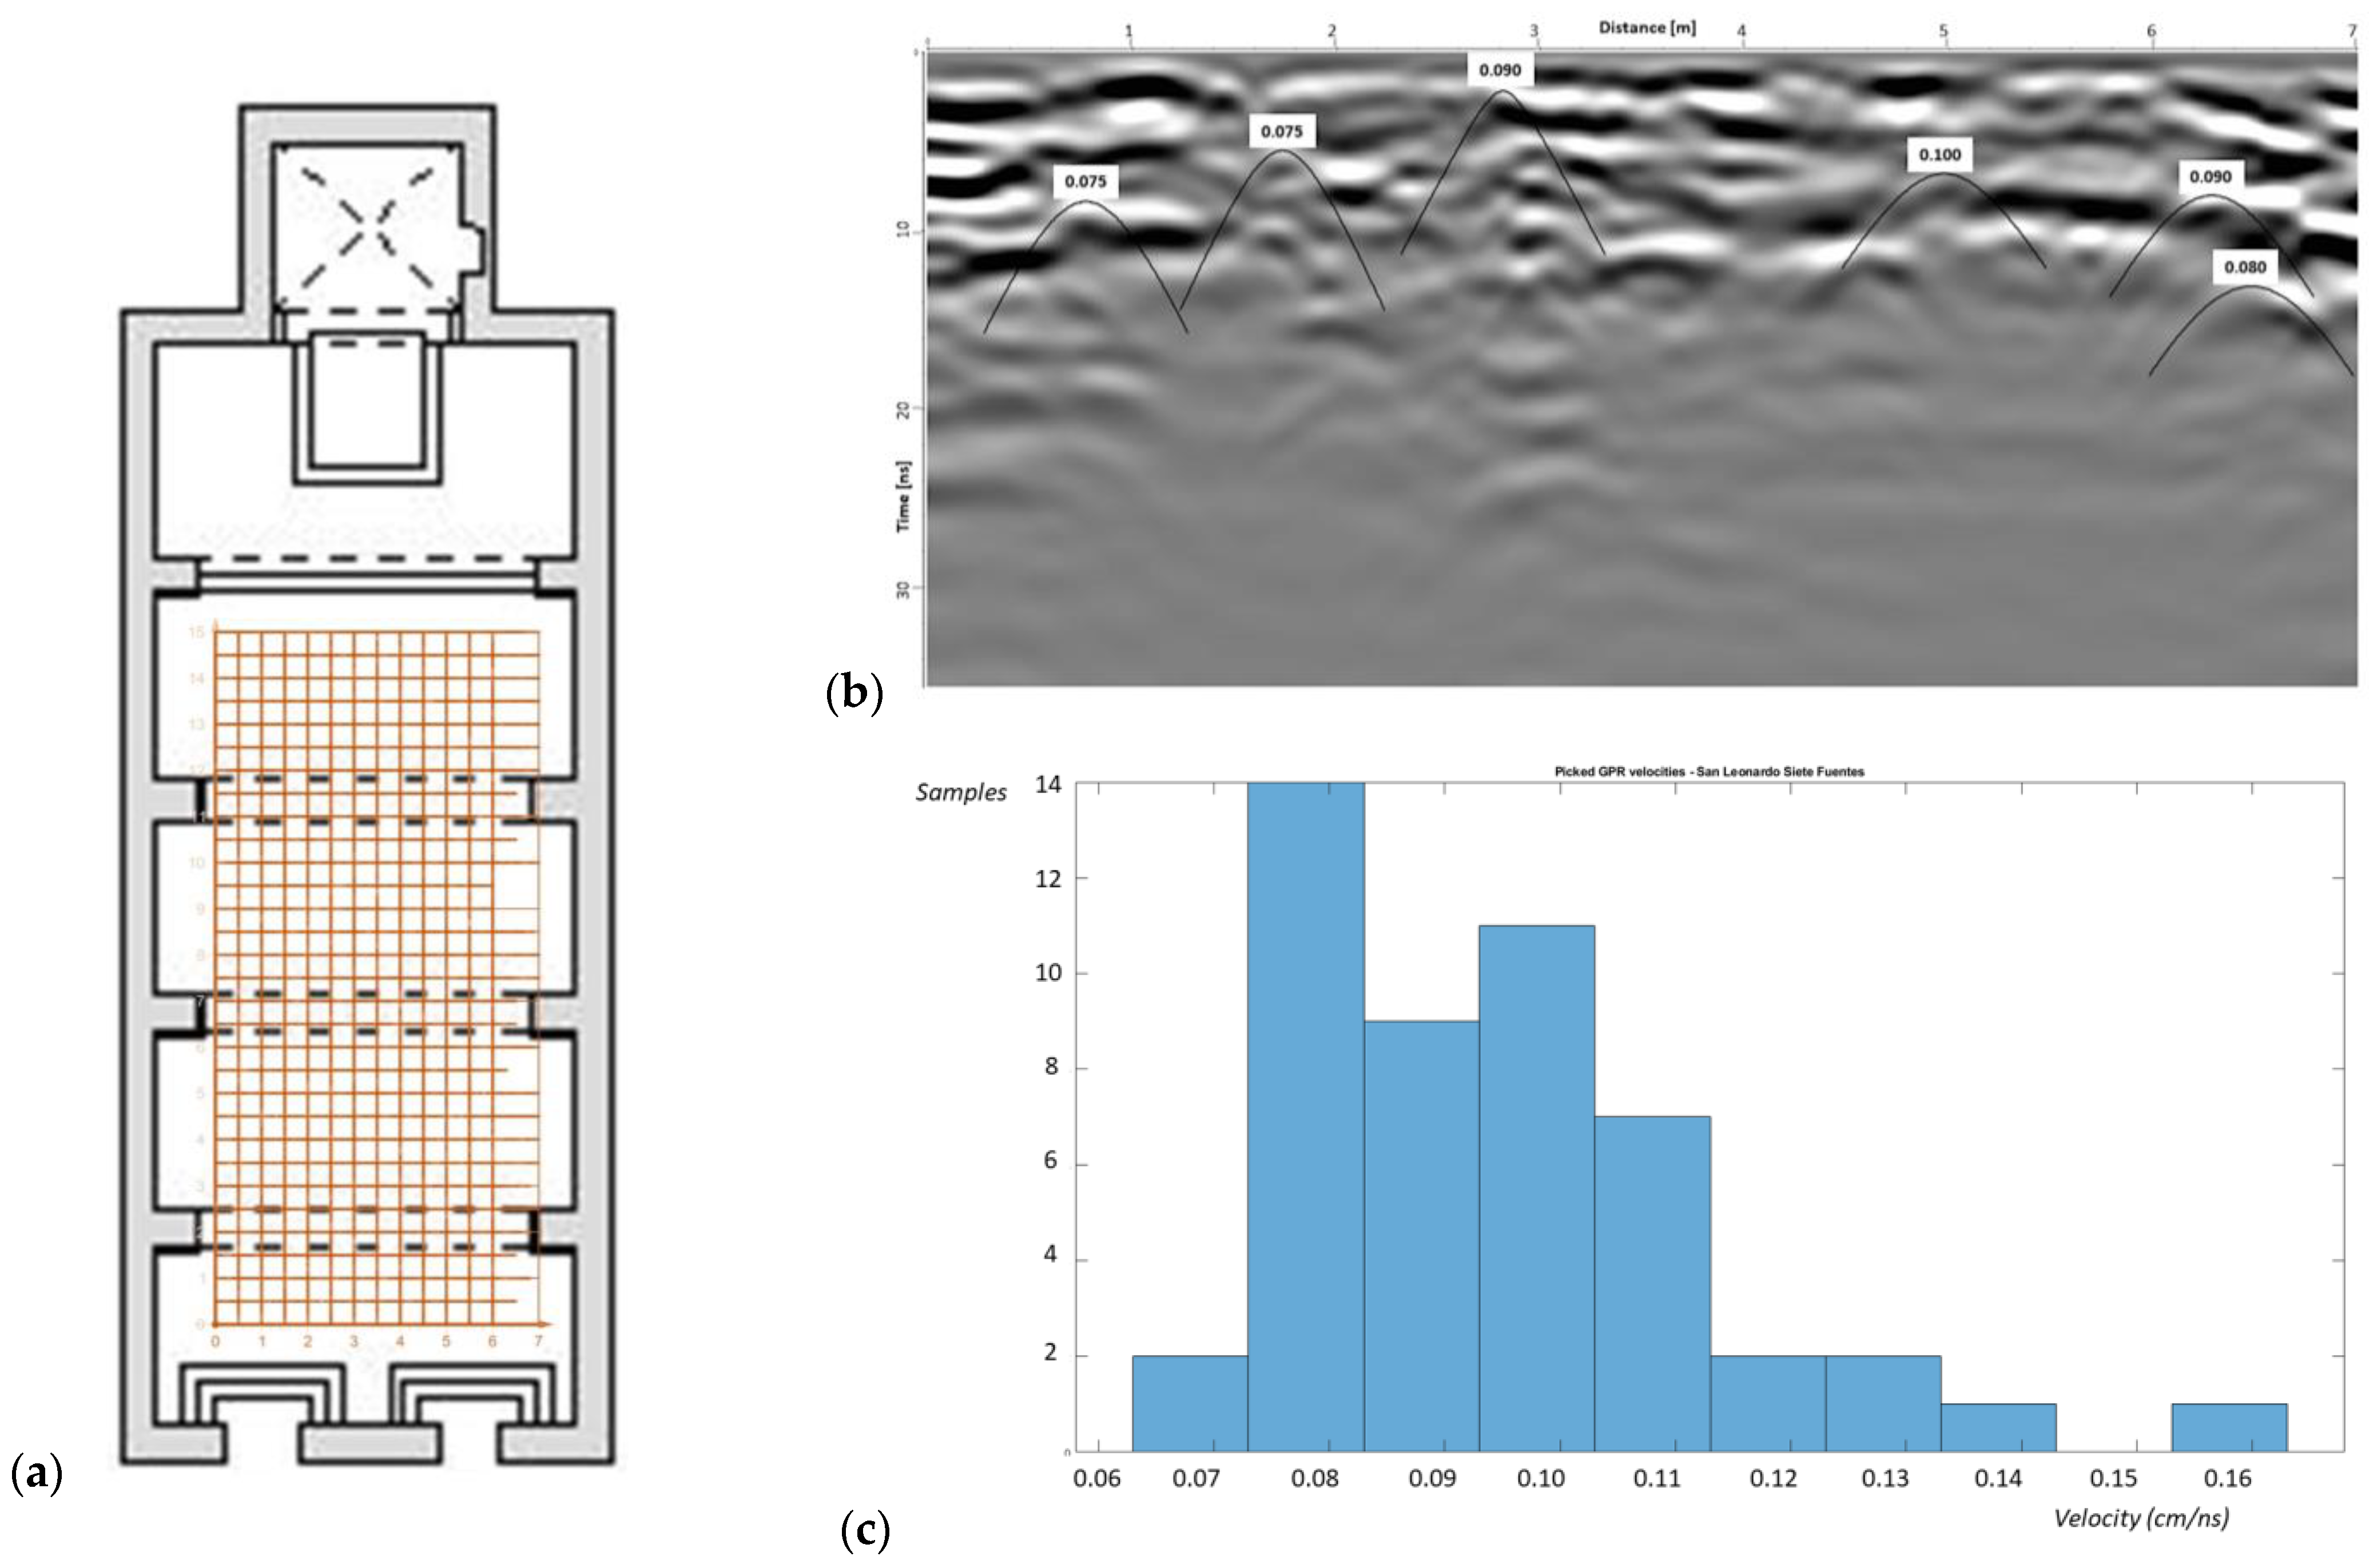
3.1. GPR Analysis: Acquisition and Standard Processing

The GPR profiles were collected inside the nave of the San Leonardo church with an orientation that is parallel and perpendicular to the axis of the hall, maintaining a regular grid spaced 50 cm (Figure 2a). The survey was conducted in a monostatic configuration using a 200 MHz IDS antenna connected to the GSSI SIR 3000 console.
The experimental dataset was processed according to the following main steps [75]:
  • Remove header gain
  • Subtract-mean (dewow)
  • Move start-time
  • Background removal
  • Divergence compensation
  • Energy decay
  • Bandpass Butterworth (50–700 MHz)
  • Multiplication
  • Declipping plateau
  • Time-to-depth conversion
  • Signal envelope by Hilbert transform (only for C-scans or depth-slices)
Before performing point 10 of the processing flow, electromagnetic wave velocity was investigated by fitting the diffraction hyperbolas recognizable in the GPR dataset (Figure 2b). From their statistical analysis, it is impossible to clearly recognize a single velocity able to represent the whole investigated volume; in fact, in Figure 2c we can see that there is a large span between 0.08 and 0.11 cm/ns in which most of the sampled velocities are distributed. To avoid artifacts in shape reconstruction due to velocity inhomogeneity, the migration was not applied to the dataset and time-to-depth conversion was calculated using 0.1 cm/ns as a mean velocity for an approximative depth indication in the following analyses.

3.2. IR Thermography: Technique and Acquisitions

Infrared thermography is a non-contact technique by which is possible to measure remotely the infrared radiation emitted by the investigated objects. For the data collection, a digital infrared camera acquires the images, known as thermograms, at the electromagnetic frequency range of thermal-infrared waves where the bodies at common environmental temperatures have the maximum of electromagnetic emission. From the acquired thermograms, and depending on the acquisition setup, it is possible to obtain a reliable estimation of the main physical properties of the materials; in particular, both the thermal properties (e.g., conductivity, diffusivity, effusivity and specific heat) and spectral properties (emissivity, absorption, reflection and transmission coefficients) of the material can be assessed [76]. These physical properties are indirectly connected to target characteristics such as porosity, superficial roughness, and moisture. In particular, in the church of San Leonardo, a passive thermographic survey was carried out which avoided the possibility to retrieve quantitative data, but was still useful for allowing a quantitative diagnosis of the environmental conditions inside the church and of the materials differentiation in the façade. The was carried out via a digital thermal camera (FLIR System AB model P30 PAL). The measurements were acquired indoor and outdoor with different points of view.

4. Results and Discussion

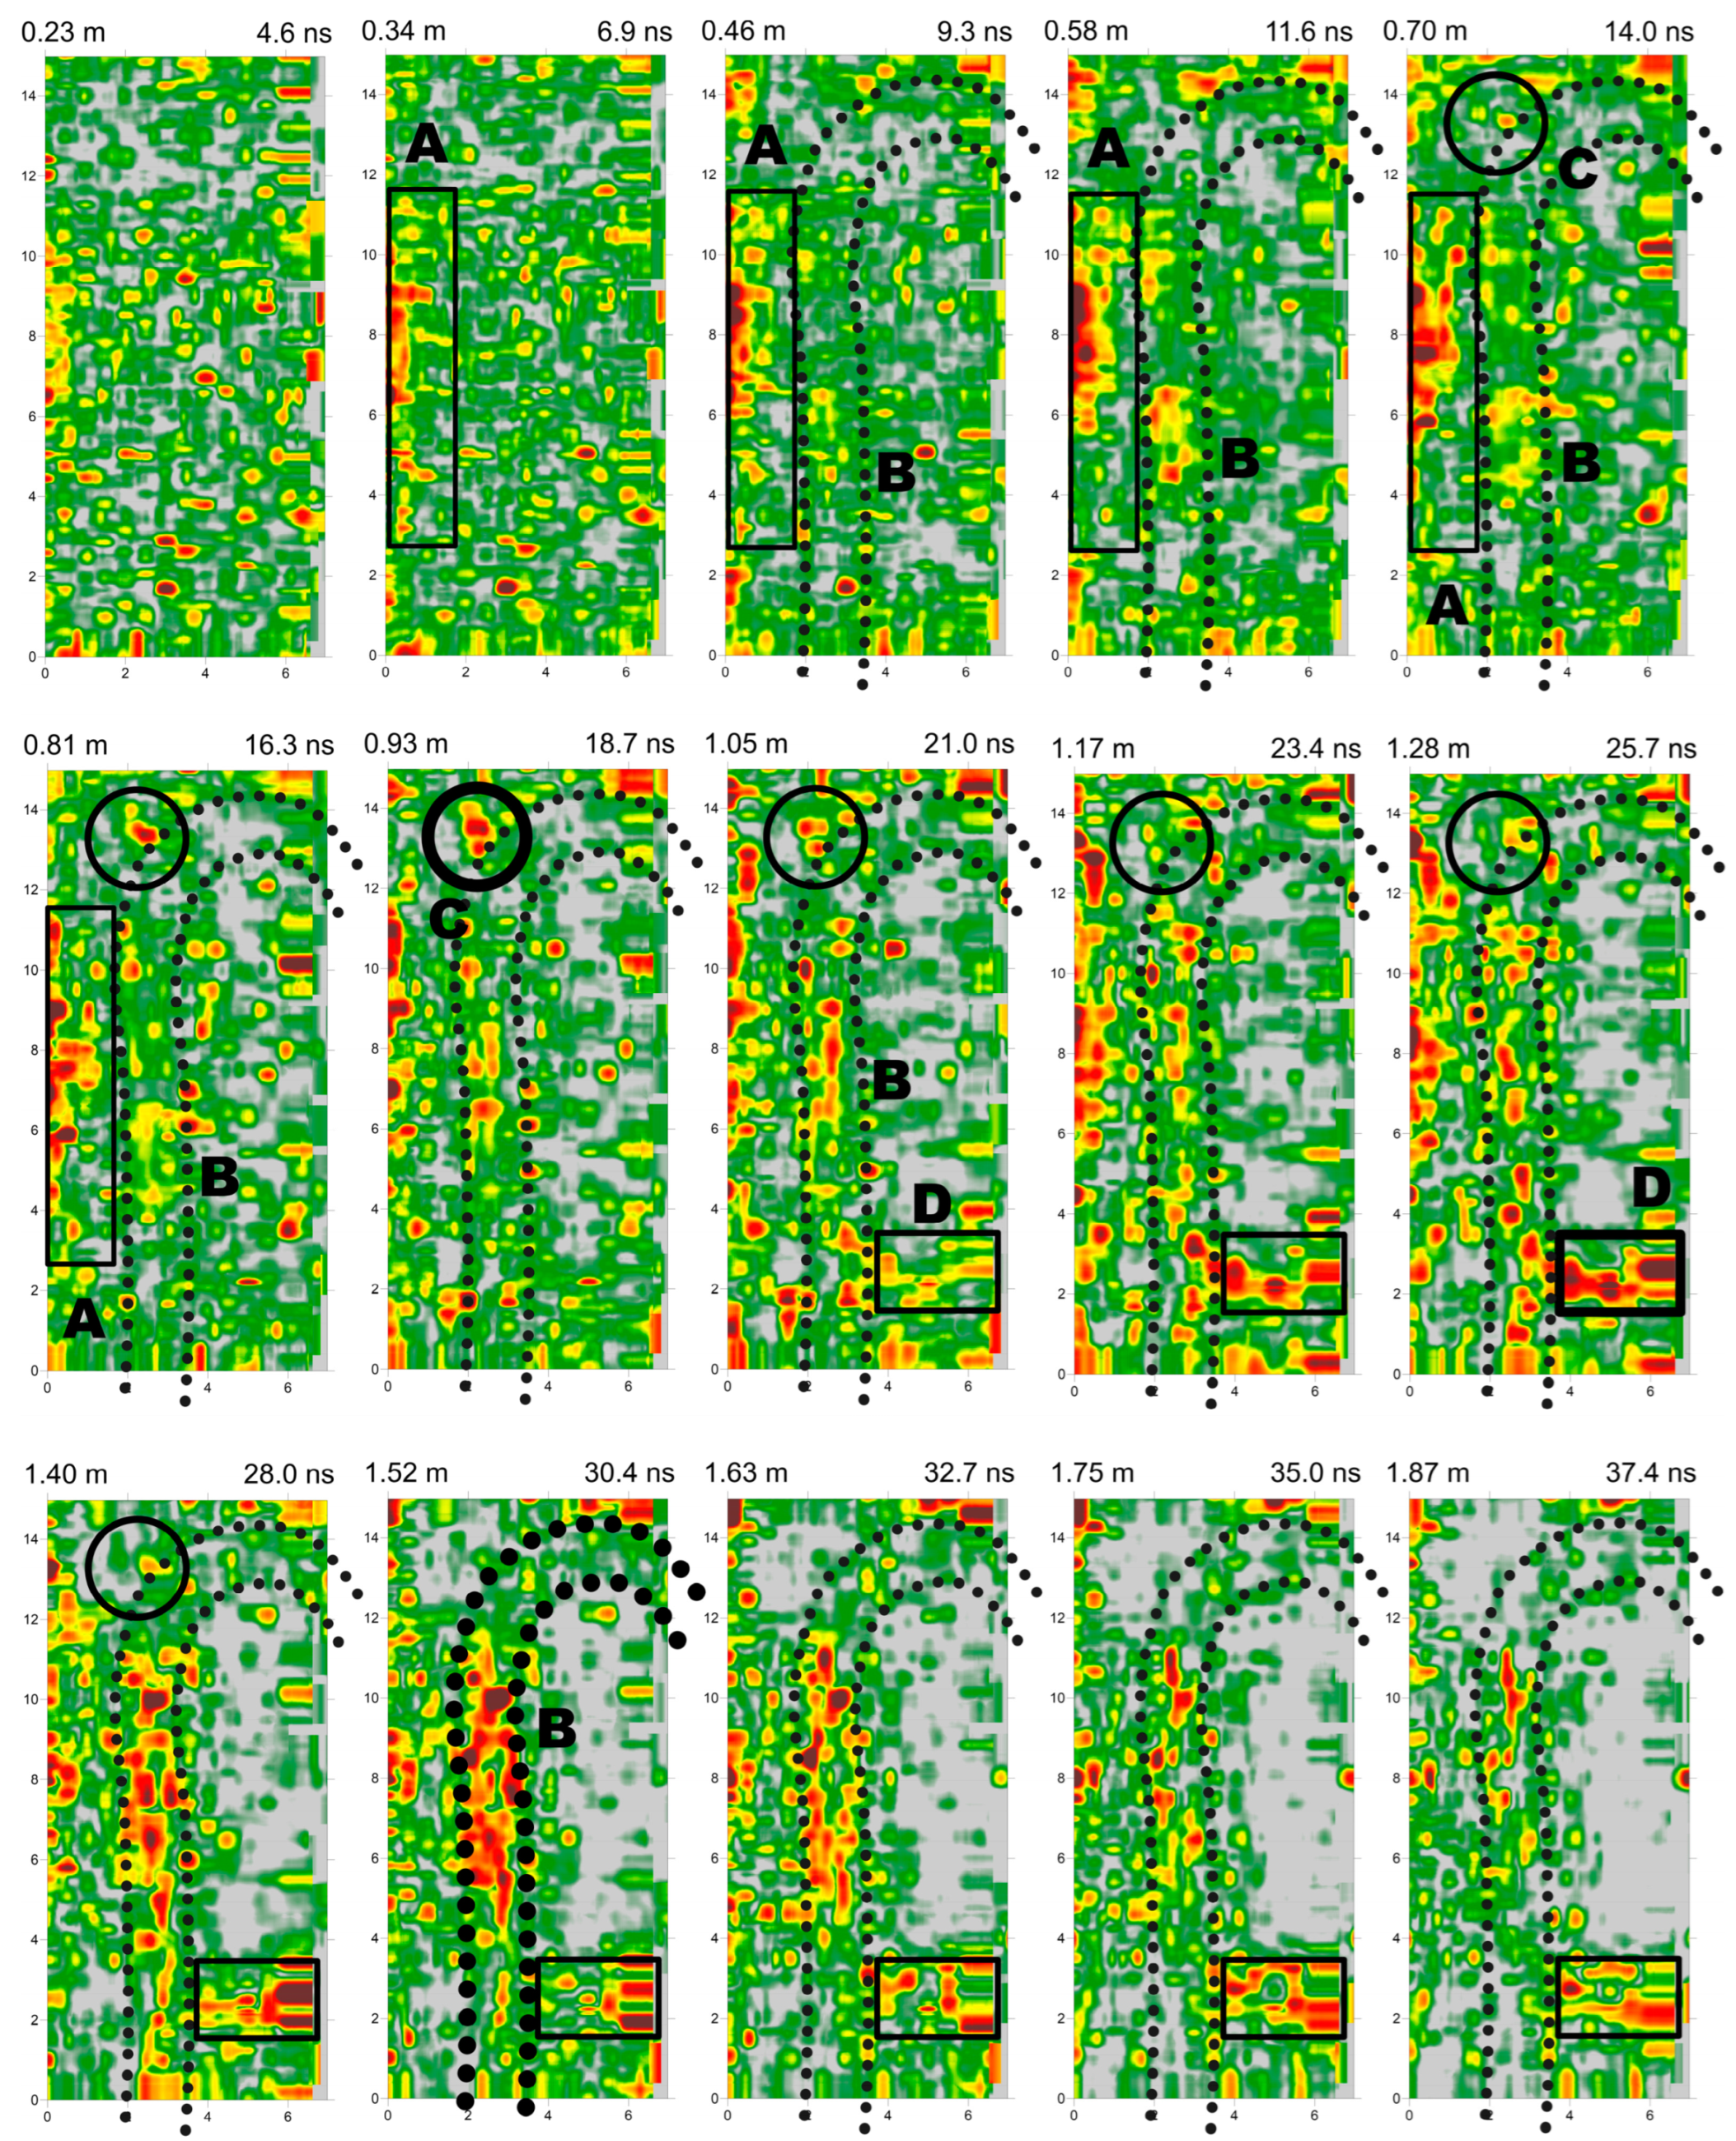
4.1. 2D Geophysical Results and Discussion

Looking at the depth slices starting from the surface, we can distinguish some highly reflective events distributed across the investigated volume (Figure 3). The four most interesting among are bounded and indicated with capital letters as they appear on maps. On the most superficial C-scan (0.11 to 0.23 m depth), many small spots are present with a chaotic distribution so they are considered of no interest for our study, while on the second C-scan (0.23–0.34 m) some of them begin clustering on the left (North) side of the map with a pattern that is indicated with A and I still visible until 1.63 m (but partially also until the last map at 1.87 m, even if its amplitudes are maximum at 58–70 cm depth). In the third C-scan (0.34–0.46 m) a second reflective pattern (B) starts forming just on the right of the A anomaly; even this feature present down to the deepest C-scan, but can also be recognized in a big hook shape across the various depths and with an inhomogeneous behavior in terms of amplitudes because some of its sectors have strong reflections from the most superficial layers to the bottom (with a bigger persistency than the A anomaly), while others present strong signals only at certain depths and some others are visible only as a local maximum amplitude pattern with respect to a lower amplitude local background. The third anomaly (C, coordinates X = 1–3 m, Y = 12–14 m) is visible as a weak spot at the 70 cm depth-slice, presents its maximum amplitude at 93 cm, and gradually disappears with a low amplitude persistency between about 1.05 to 1.40 m depth. The fourth anomaly, indicated with D, starts at the 93–105 cm depth slice and is the strongest reflective pattern until the end of the investigated C-scans; it is included in a rectangular region on the bottom-right (south-west) side of the nave in closeness to one of the two main entrances of the church; on its right, it is clearly visible a unidirectional effect due to absence of longitudinal GPR profiles in correspondence to the buttresses.
To better characterize the nature of the anomalies detected in the C-scan analysis, some of the most significant transversal radargrams (before signal enveloping) are commented on in Figure 4: starting from the top side (East) of the GPR maps, four B-scans are presented that are crossing the anomalies to be analyzed (Figure 4a).
The first radargram (Figure 4b) was collected at 13.5 m from the origin (bottom-left) of the survey map: the first significant GPR event crossed is the C anomaly, located with a red circle in the referencing map (Figure 4a): detected by the C-scans analysis at depths ranging 70-140 cm, we can notice that going down from the surface we first find a continuous interface (light green dotted line) over which the pavement is built and immediately below a strong sub-horizontal signal (on the order of 1 m long); just below that reflection, a single diffraction hyperbola is present. This intense 3D signal could be due to the presence of burials or anomalous structures with respect to the filling soil, with a highly reflective cover element co-planar with the pavement foundation surface. The analysis of the wave shape in correspondence to this anomaly suggests an inversion of polarity at the first interface to return to normal polarity at the bottom, confirming the idea of a partially air-filled cavity [42,77,78,79,80,81]. In this case, it is important to be aware that the geometry of the interface below the void is recognized in a distorted way by radargrams because of the significantly different wave velocity among ground and air. A second significant spatial pattern of the GPR signal in the 13.5 m radargram is an oblique horizon (B, light blue dotted line) with its deepest part in the middle of the radar section and going close to the pavement surface on the right (south) margin; this is identifiable with the upper part of the hooked pattern recognized in the GPR maps (C anomaly, potentially linked to the ancient fabric of the church), and indicated in the referencing map as a dotted double blue line (Figure 4a). At the bottom part of the pane, a continuous irregular horizon is identified with a black dotted line, and is probably the foundation level of the ancient structures.
In Figure 4c (12.5 m GPR profile), two continuous horizons are still present on the top and on the bottom of the radargram, indicated as in the previous case with light green and black dotted lines. Between them, on the right side of the image, many GPR signals are present and, from our interpretation, still belong to the B anomaly; the oblique horizon is still visible, probably due to lateral reflections, and the strongest signals are concentrated in the middle of the B-scan with a composition of many diffraction events.
In Figure 4d (6 m of longitudinal coordinate), the black horizon on the bottom is still detectable with continuity, while the light green one on the top is more difficult to follow and most recognizable in the middle of the GPR profile. Within this image, the first group of diffractive/reflective events is found immediately at the start of the profile and is corresponding to the very strong GPR signals, located on the left side of the C-scans at depths between about 30 and 90 cm, indicated with A. This 3D pattern is a collection of multiples and diffractive events, and most probably originated from the current northern wall and pillars foundation works. About one meter to the right of this A anomaly, we can distinguish some other high-amplitude events identified by the B anomaly, and in the right (south) part of the image three sub-horizontal horizons indicated with orange and blue dotted lines: the orange linear patterns will be present with a slightly modified shape even in the next B-scan presented.
In Figure 4e (2.5 m radargram), the upper and lower horizons present behavior similar to Figure 4d. The A anomaly is still present but with lower extension and amplitudes, and the B (hooked shape in the C-scans) anomaly is recognizable; the extension of low amplitude events belonging to the B anomaly (light yellow filling in Figure 4e) is more or less the same as from the radargram at 6 m, but here it is a clearly distinguishable interface (light blue dotted line) at its middle height indicating a discontinuity in the material from the top, probably filling soil with small stones (on the order of about 10 cm width), to the bottom part that can be constituted by the ancient stone wall foundation. Another strong and spatially relatively concentrated reflection is planimetrically recognized in C-scans with D (X = 4–7 m, Y = 1.5–3.5 m), from 1.10 m depth down to the bottom of the analyzed depth-slices (maximum amplitude at 1.28 m depth). Located on the right side of the radargram, this signal is composed of a very low curvature arc (orange dotted line), just below the pavement foundation level (0.5 m), with two diffraction events on its sides; a second planar and horizontal interface (again orange dotted line) is detectable at about 1.3 m. The fact that the space between the two orange lines has no contrasting behavior with regard to its surrounding medium leads to the thought that if it is related to any built structures, these should be filled with the same soil as the background. It is interesting to compare this radargram with the previous one (6 m), just outside the planimetric location of the D anomaly: as already noted, in this second B-Scan, at similar depths to the first one, two interfaces are still present but they present a more irregular surface, making it possible to consider them the results of artificial activities linked to the construction of the D anomaly originating target. As in the case of the C anomaly, even this intense GPR signal could be due to the presence of burials or in any case anomalous structures with respect to the filling soil, with a highly reflective cover element co-planar with the pavement foundation surface.

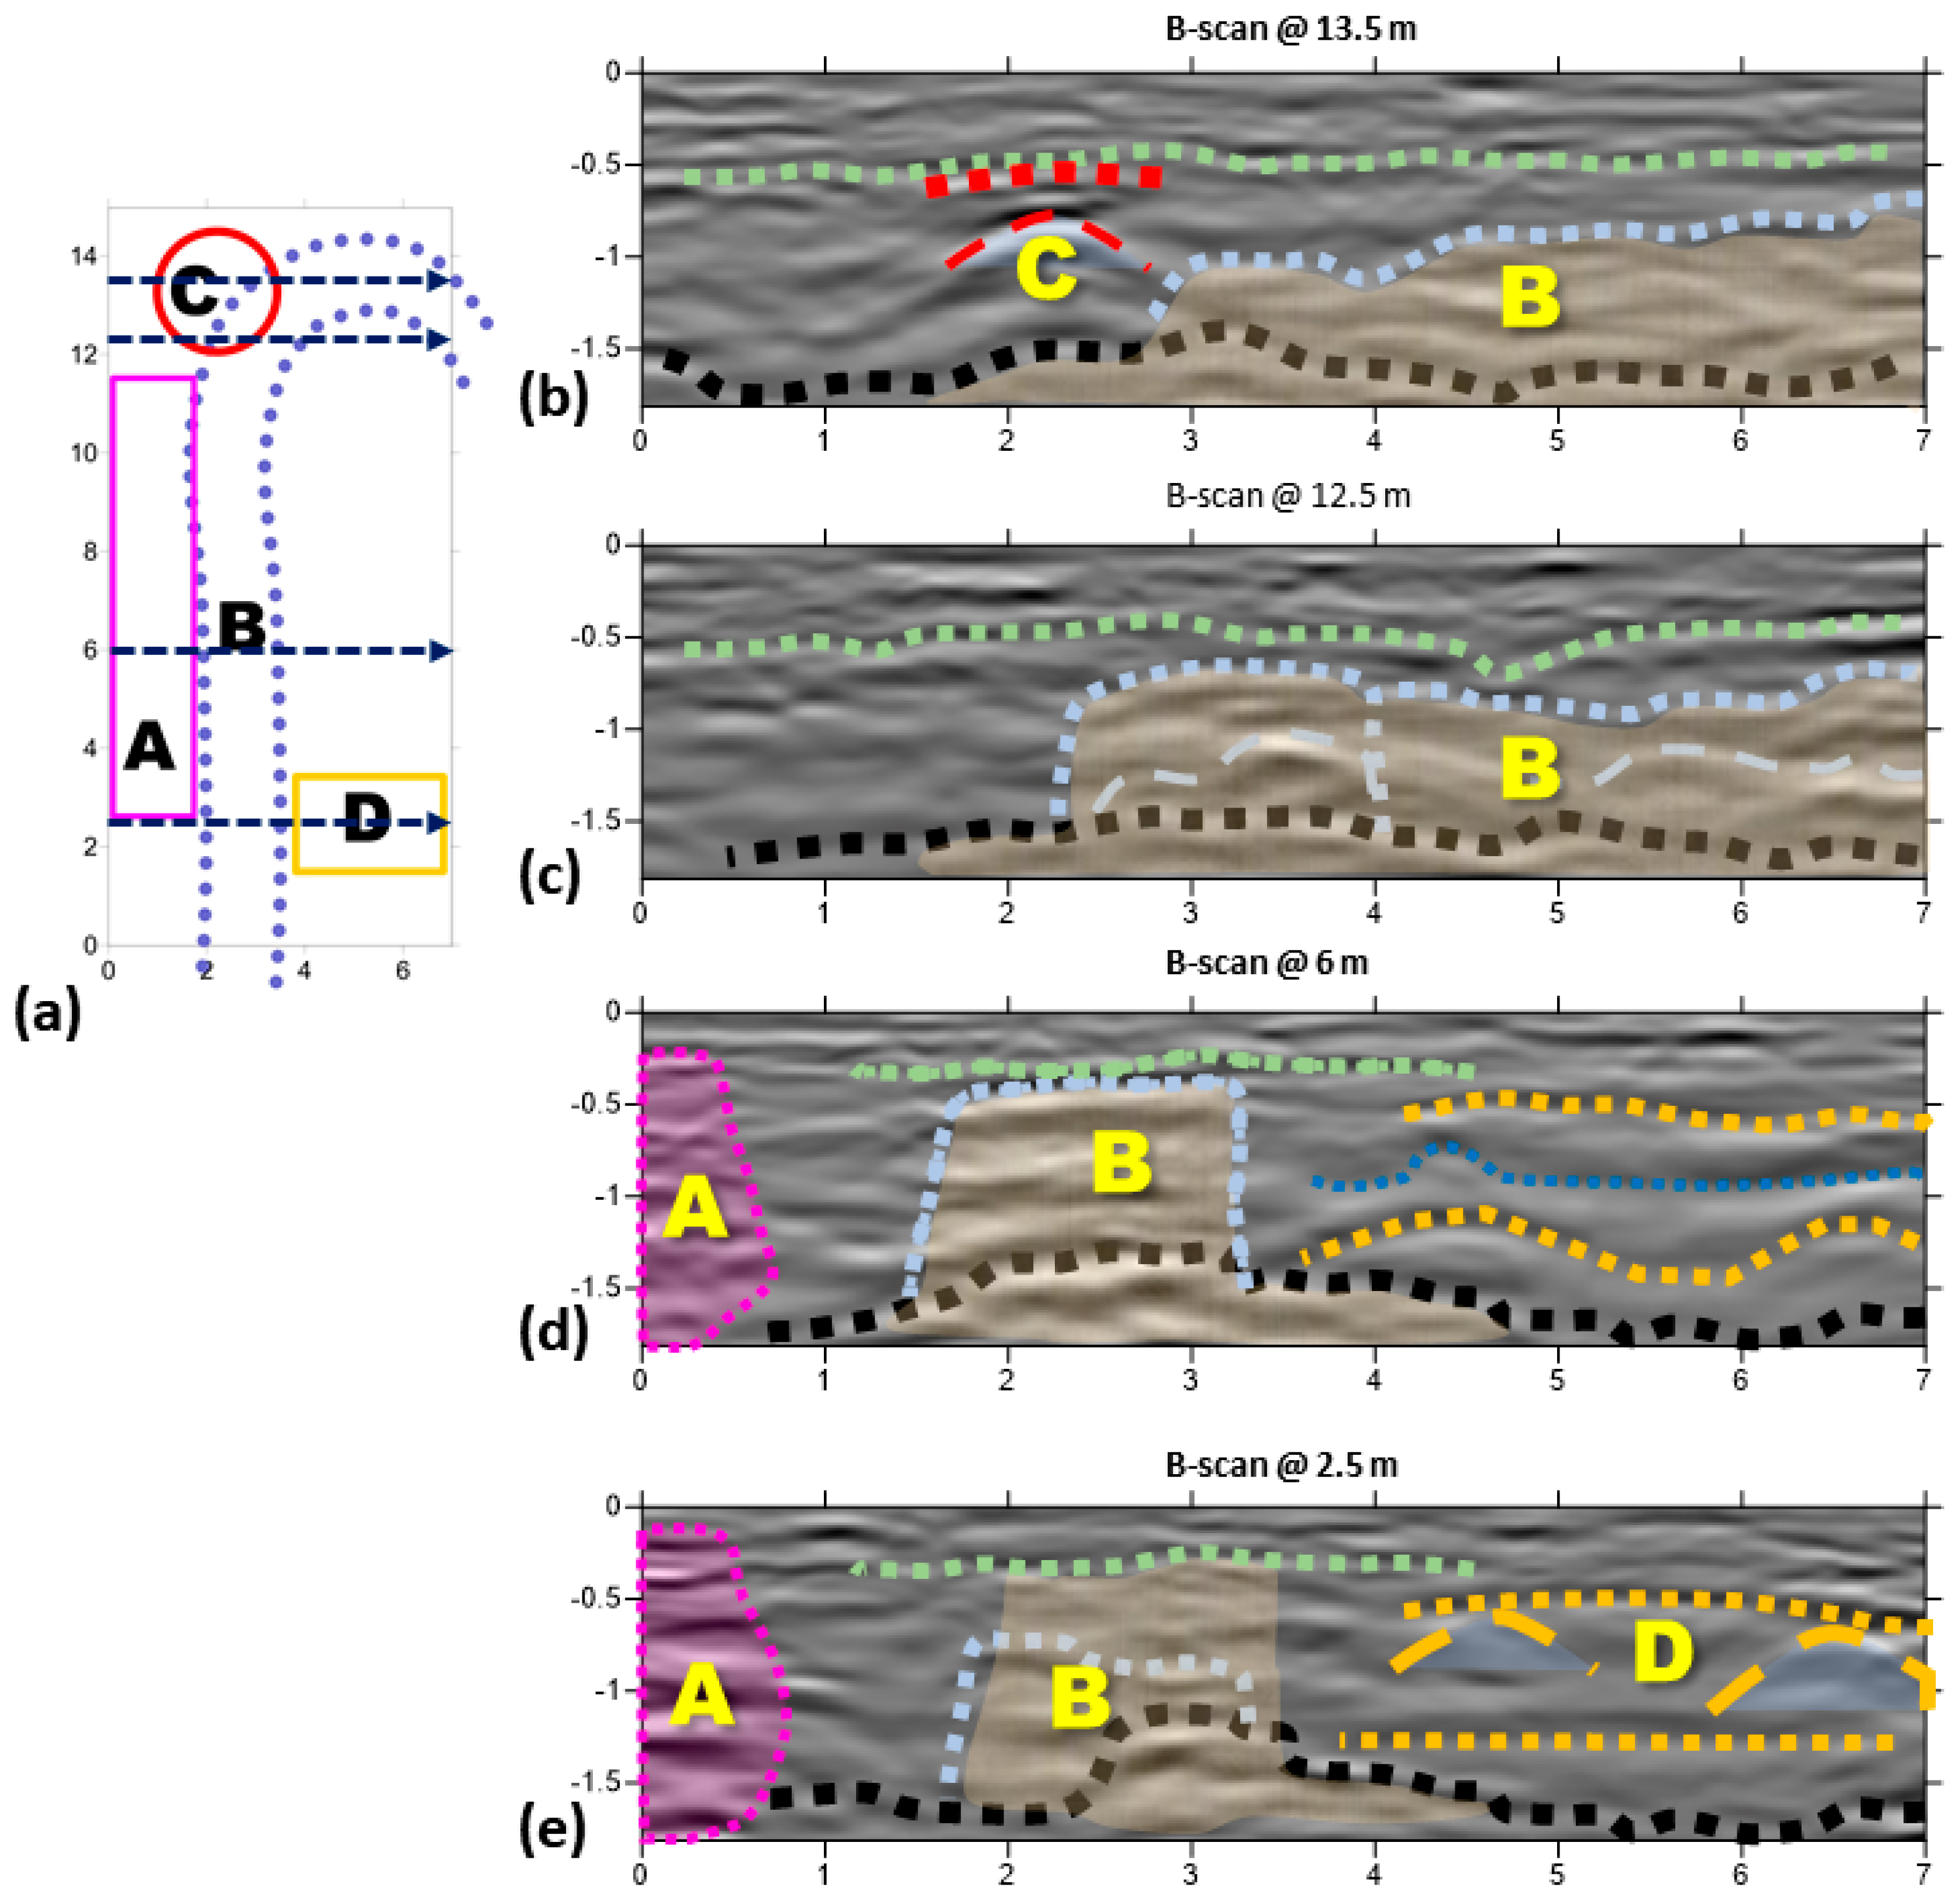
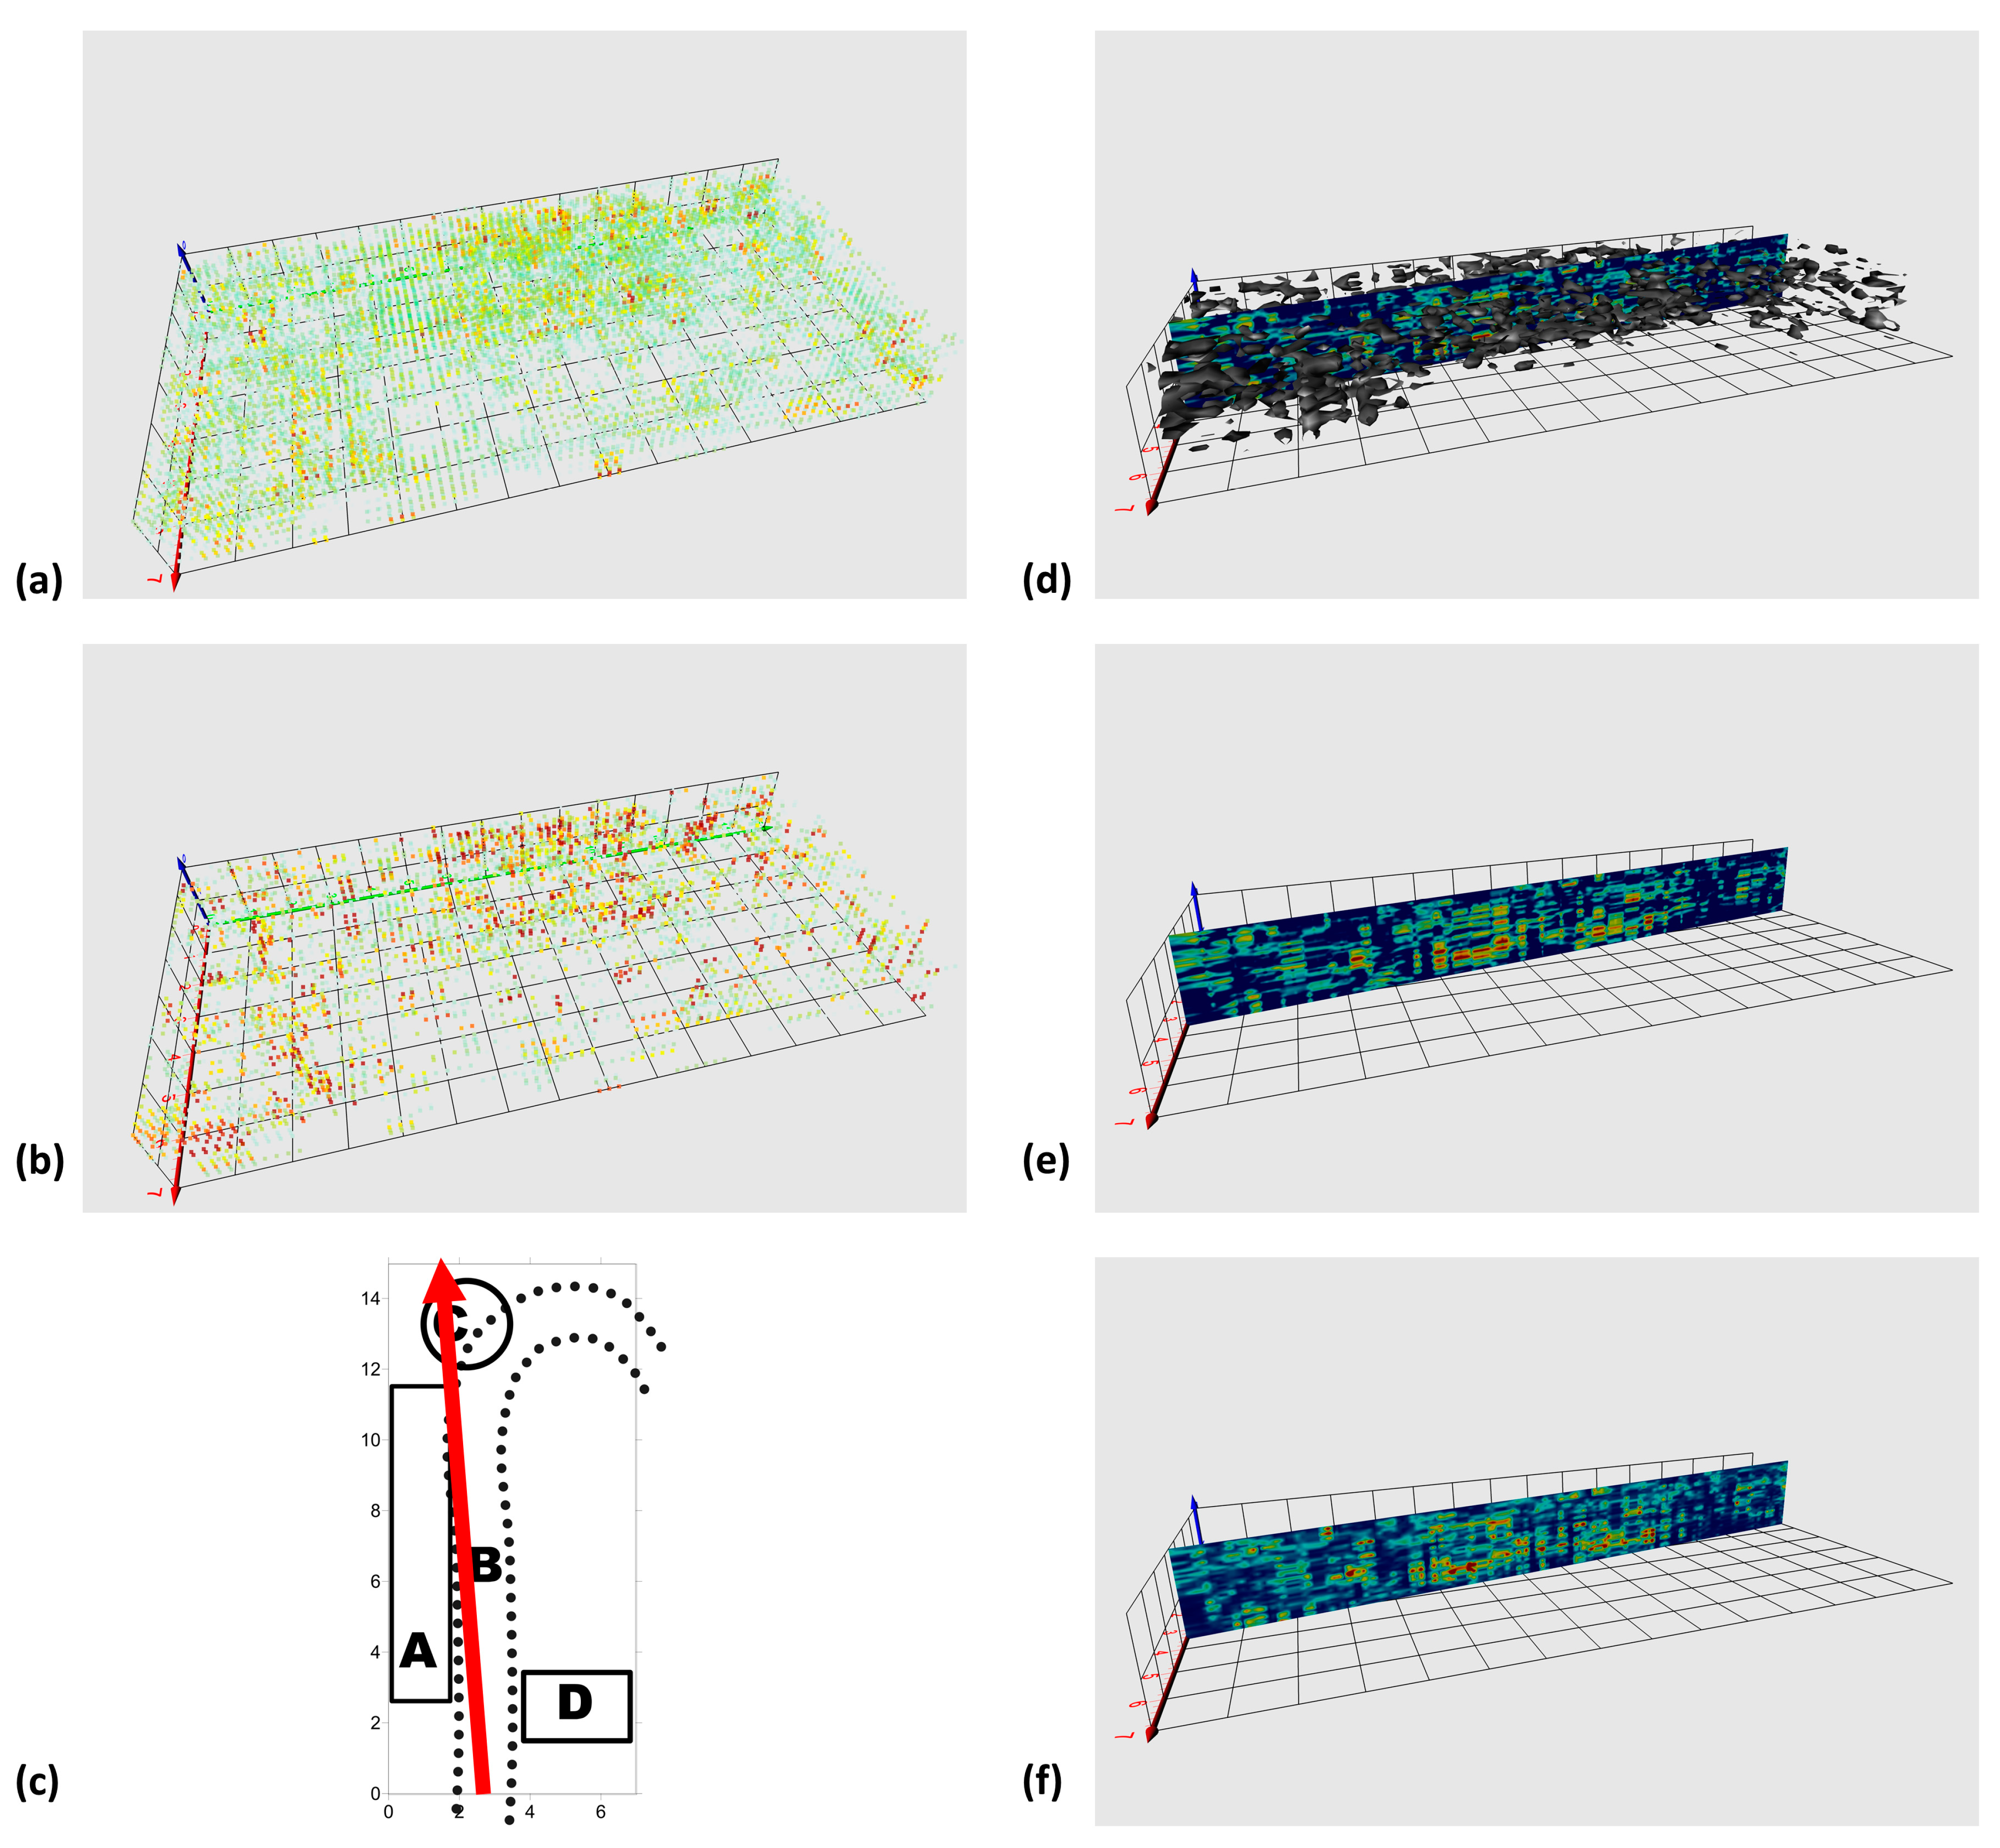
4.2. Further 2D and 3D Analysis

Additional analyses have been performed exploiting the GPR information within the 3D software environment Voxler in which the longitudinal and transversal radargrams were imported. Two kinds of interpolation parameters were used to further investigate electromagnetically homogeneous volumes (amplitudes) and main interfaces (variances) [82,83]. In Figure 5a,b, three-dimensional scatterplots of the highest amplitudes and variances are displayed. From these and from the 3D isosurfaces of Figure 5d, it is possible to notice that GPR reflections are scattered among the whole dataset, with the exception of the volumes inside the B anomaly not influenced by the D anomaly. As for the upper and lower parts of the B anomaly in Figure 4e, this could be due to different preparation works of the grounds under the pavements that were performed before the first fabric building and after its demolition and enlargement. Nevertheless, a certain level of high-energy data clustering is observable for the main anomalies analyzed till now. In Figure 5e,f, the virtual cross-sections originated by the oblique interpolation of the GPR dataset are proposed for amplitudes and variances, respectively. Thanks to these, we can inspect the GPR signal behavior in correspondence to the main side of the hook (B anomaly); we can appreciate a (almost regular) bottom horizon and a large variability of the vertical thickness of the volumes most interested by GPR events.
Finally, the B anomaly is investigated by means of the horizons manual picking in ReflexW software; in the transversal B-scans, the GPR signals with the highest amplitudes are recognized and exported to create a 3D interpolated representation of the possible building stratification inside the church of San Leonardo. In Figure 6a,b, two three-dimensional visualizations are proposed to appreciate the volumes interested by the B and C anomalies, while in Figure 6c, we can read, point by point, the depths of these GPR events. The global pattern of the B anomaly shows the plan of the original fabric, constituted by an 11 m long and 4 m large (inside measurements) single nave with a semicircular apse having the external vertex at about 14 m).

4.3. Further Discussion

The GPR investigation has confirmed the presence of a circular-shaped apse–previously only hypothesized. Even the extension of the ancient structure is, in great part, confirmed with little difference on the southern wall, for which Crudeli supposed a slightly longer extension [65]. In Figure 7, a diachronic plan of the church of San Leonardo is proposed: for the existing structures, the dating has been done on the basis of historic-artistic studies in the literature confirmed by modern critics. For the features under the current pavement, the results of the GPR survey are summarized as a characterization of the most important geophysical features in terms of signs of the ancient uses and building activities of the site. The investigated subsoil is mostly describable in three categories: soil (or anthropogenic sediments) with a relatively fine stone granulometry (probably due to foundation works of the old church pavement), soil (or anthropogenic sediments) with medium dimensions stones (probably due to raw ground or the presence of big stone chippings linked to the demolition of the old fabric), and a highly disturbed soil with the presence of ruins of the old church and signs of its demolition. Within these background soils, two localized radar features are indicated to potentially have archaeological significance: both have shown radar responses compatible with burials and should be investigated with direct samplings. Geophysical results tend to exclude the presence of large voids such as collective burials or a crypt (with the exception of the partial presence of air in correspondence of anomaly C). Regarding the possible archeological features inside the investigated area, it is worth noting (even if not represented in Figure 7) the potential cultural significance of the first interface (dashed light green lines in Figure 4b–e) 20-30 cm just underneath the current pavement that could be the sign of an old pavement (the historical raising of the nave floor is known from previous studies [63]) or the boundary of the foundation works of the current finishing.
The thermal images acquired to support this investigation are able to give us some important pieces of information. First, many elements of the church present localized humidity (Figure 8a–c), that is also the probable condition of the subsoil under the pavement which led to the high variability of the microwave signal velocity [84,85] retrieved by the hyperbola picking during GPR processing (Section 3.1). This variability of soil moisture brings two important issues to be taken into account: the high variability of the electromagnetic speed leads to a possible approximation of local depth estimations and, by this, of the horizon analysis. Furthermore, the variability in humidity leads to a similar variability in electrical conductivity and, therefore, to the different attenuation of the GPR signal point by point. A second piece of information given by the thermographic survey is that the thermal properties of stone ashlars used for the two main building stages of the church of San Leonardo are almost identical (Figure 8d).
Finally, in Figure 9, a graphical study of the façade is shown with the identification of the works belonging to the first fabric, bounded by a red line in Figure 9a, thanks to the different dimensions of the stone ashlars and the mortar joints between the two building stages. In Figure 9b, a reconstruction of the original façade is shown with a symmetric design with respect to the entrance and second half pilaster, localized in correspondence to the one currently in the middle of the façade, but significantly larger of this (like the one still present on the right side. This symmetric design is in agreement with the GPR results (Figure 7), with the supposed disassembled stone masonry exactly placed on the corner between the current façade and the reconstructed track of the ancient church.

5. Concluding Remarks

To exploit the GPR ability in reconstructing useful information for the historical stratification of monuments, an experimental survey on the pavement of the nave of the church of San Leonardo de Siete Fuentes in Santu Lussurgiu, Italy has been presented within this manuscript.
For this purpose, the georadar information has been first gathered with the joint analysis of B- and C-scans, in which some most significant patterns were detected and analyzed by looking at their signal features over the investigated subsurface.
To our knowledge, for the first time with monumental buildings, very rare interpretation aiding tools have been used in the second stage on an experimental dataset: elements from the signal attribute analysis and horizon detection and visualization, with a three-dimensional approach.
Finally, to give more robust and incisive information, the GPR results have been interpreted and commented on in the context of a thermal infrared survey and a historical-artistic analysis of the monument.
Thanks to the integrated geophysical and historical analysis of the monument, the ancient layout of the church has been reconstructed and other targets of potential archaeological interest identified.

Author Contributions

Conceptualization, L.P.; methodology, L.P.; software, L.P.; validation, L.P. and M.R.; formal analysis, L.P.; investigation, L.P. and M.R.; resources, L.P. and M.R.; data curation, L.P. and M.R.; writing—original draft preparation, L.P. and M.R.; writing—review and editing, L.P. and M.R.; visualization, L.P. and M.R.; supervision, L.P.; project administration, L.P.; funding acquisition, L.P. All authors have read and agreed to the published version of the manuscript.

Funding

This research received no external funding.

Data Availability Statement

The data presented in this study are available on reasonable request from the corresponding author.

Acknowledgments

The authors thanks Luigi Noli for the help in data collection and Gaetano Ranieri for achieving the permissions to carry out the survey. A preliminary version of this work was presented at IWAGPR 2021 conference, IEEE [75].

Conflicts of Interest

The authors declare no conflict of interest.

References

  1. Stratigraphy (Archaeology) @ Wikipedia.org. Available online: https://en.wikipedia.org/wiki/Stratigraphy_(archaeology) (accessed on 28 January 2023).
  2. Harris, E.C. Principles of Archaeological Stratigraphy, 2nd ed.; Academic Press: London, UK, 1989. [Google Scholar]
  3. Compare, V.; Cozzolino, M.; Mauriello, P.; Patella, D. Resistivity probability tomography imaging at the Castle of Zena, Italy. EURASIP J. Image Video Process. 2009, 2009, 693274. [Google Scholar] [CrossRef] [Green Version]
  4. Papadopoulos, N.G.; Sarris, A.; Parkinson, W.A.; Gyucha, A.; Yerkes, R.W.; Duffy, P.R.; Tsourlos, P. Electrical resistivity tomography for the modelling of cultural deposits and geomophological landscapes at Neolithic sites: A case study from Southeastern Hungary. Archaeol. Prospect. 2014, 21, 169–183. [Google Scholar] [CrossRef]
  5. Piroddi, L.; Vignoli, G.; Trogu, A.; Deidda, G.P. Non-destructive Diagnostics of Architectonic Elements in San Giuseppe Calasanzio’s Church in Cagliari: A Test-case for Micro-geophysical Methods within the Framework of Holistic/integrated Protocols for Artefact Knowledge. In Proceedings of the 2018 Metrology for Archaeology and Cultural Heritage (MetroArchaeo), Cassino, Italy, 22–24 October 2018; pp. 17–21. [Google Scholar]
  6. Fischanger, F.; Catanzariti, G.; Comina, C.; Sambuelli, L.; Morelli, G.; Barsuglia, F.; Ellaithy, A.; Porcelli, F. Geophysical anomalies detected by electrical resistivity tomography in the area surrounding Tutankhamun’s tomb. J. Cult. Herit. 2019, 36, 63–71. [Google Scholar] [CrossRef]
  7. Cozzolino, M.; Gentile, V.; Mauriello, P.; Peditrou, A. Non-destructive techniques for building evaluation in urban areas: The case study of the redesigning project of Eleftheria square (Nicosia, Cyprus). Appl. Sci. 2020, 10, 4296. [Google Scholar] [CrossRef]
  8. Piroddi, L.; Calcina, S.V.; Trogu, A.; Ranieri, G. Automated Resistivity Profiling (ARP) to explore wide archaeological areas: The prehistoric site of Mont’e Prama, Sardinia, Italy. Remote Sens. 2020, 12, 461. [Google Scholar] [CrossRef] [Green Version]
  9. Barbieri, A.; Regala, F.T.; Cascalheira, J.; Bicho, N. The sediment at the end of the tunnel: Geophysical research to locate the Pleistocene entrance of Gruta da Companheira (Algarve, Southern Portugal). Archaeol. Prospect. 2022, 1–18. [Google Scholar] [CrossRef]
  10. Deiana, R.; Deidda, G.P.; Cusí, E.D.; van Dommelen, P.; Stiglitz, A. FDEM and ERT measurements for archaeological prospections at Nuraghe S’Urachi (West-Central Sardinia). Archaeol. Prospect. 2022, 29, 69–86. [Google Scholar] [CrossRef]
  11. Vacilotto, A.; Deiana, R.; Mozzi, P. Understanding Ancient Landscapes in the Venetian Plain through an Integrated Geoarchaeological and Geophysical Approach. Remote Sens. 2020, 12, 2973. [Google Scholar] [CrossRef]
  12. Ranieri, G.; Calcina, S.V.; Piroddi, L. Preventive geophysical surveys for the evaluation of the archaeological risk: Examples from the region of the ancient Pylos (western Peloponnese, Greece). In Proceedings of the 2021 21st International Conference on Computational Science and Its Applications (ICCSA), Cagliari, Italy, 13–16 September 2021; pp. 242–250. [Google Scholar]
  13. Gaffney, C.; Gaffney, V.; Neubauer, W.; Baldwin, E.; Chapman, H.; Garwood, P.; Moulden, H.; Sparrow, T.; Bates, R.; Locker, K.; et al. The Stonehenge hidden landscapes project. Archaeol. Prospect. 2012, 19, 147–155. [Google Scholar] [CrossRef]
  14. Pisciotta, A.; Vitale, G.; Scudero, S.; Martorana, R.; Capizzi, P.; D’Alessandro, A. A lightweight prototype of a magnetometric system for unmanned aerial vehicles. Sensors 2021, 21, 4691. [Google Scholar] [CrossRef]
  15. Forte, E.; Pipan, M. Integrated seismic tomography and ground-penetrating radar (GPR) for the high-resolution study of burial mounds (tumuli). J. Archaeol. Sci. 2008, 35, 2614–2623. [Google Scholar] [CrossRef]
  16. Abu Zeid, N.; Corradini, E.; Bignardi, S.; Nizzo, V.; Santarato, G. The Passive Seismic Technique ‘HVSR’as a Reconnaissance Tool for Mapping Paleo-soils: The Case of the Pilastri Archaeological Site, Northern Italy. Archaeol. Prospect. 2017, 24, 245–258. [Google Scholar] [CrossRef]
  17. Pirinu, A.; Balia, R.; Piroddi, L.; Trogu, A.; Utzeri, M.; Vignoli, G. Deepening the knowledge of military architecture in an urban context through digital representations integrated with geophysical surveys. The city walls of Cagliari (Italy). In Proceedings of the 2018 Metrology for Archaeology and Cultural Heritage (MetroArchaeo), Cassino, Italy, 22–24 October 2018; pp. 211–215. [Google Scholar]
  18. Cardarelli, E.; De Donno, G.; Oliveti, I.; Scatigno, C. Threedimensional reconstruction of a masonry building through electrical and seismic tomography validated by biological analyses. Near. Surf. Geophys. 2018, 16, 53–65. [Google Scholar] [CrossRef] [Green Version]
  19. Sfarra, S.; Marcucci, E.; Ambrosini, D.; Paoletti, D. Infrared exploration of the architectural heritage: From passive infrared thermography to hybrid infrared thermography (HIRT) approach. Mater. Construcción 2016, 66, e094. [Google Scholar] [CrossRef] [Green Version]
  20. Piroddi, L.; Calcina, S.V.; Fiorino, D.R.; Grillo, S.; Trogu, A.; Vignoli, G. Geophysical and remote sensing techniques for evaluating historical stratigraphy and assessing the conservation status of defensive structures heritage: Preliminary results from the military buildings at San Filippo Bastion, Cagliari, Italy. In ICCSA 2020. Lecture Notes in Computer Science; Gervasi, O., Murgante, B., Misra, S., Garau, C., Blečić, I., Taniar, D., Apduhan, B.O., Rocha, A.M., Tarantino, E., Torre, C.M., et al., Eds.; Springer Nature: Cham, Switzerland, 2020; Volume 12255, pp. 944–959. [Google Scholar]
  21. Martorana, R.; Capizzi, P. Joint Investigation with Ground Penetrating Radar and Infrared Thermography as a Diagnostic Support for the Restoration of Two Wall Mosaics in the Church of St. Mary of the Admiral in Palermo, Italy. Heritage 2022, 5, 2298–2314. [Google Scholar] [CrossRef]
  22. Liang, H. Advances in multispectral and hyperspectral imaging for archaeology and art conservation. Appl. Phys. A 2012, 106, 309–323. [Google Scholar] [CrossRef] [Green Version]
  23. Legnaioli, S.; Lorenzetti, G.; Cavalcanti, G.H.; Grifoni, E.; Marras, L.; Tonazzini, A.; Salerno, E.; Pallecchi, P.; Giachi, G.; Palleschi, V. Recovery of archaeological wall paintings using novel multispectral imaging approaches. Herit. Sci. 2013, 1, 33. [Google Scholar] [CrossRef] [Green Version]
  24. Piroddi, L.; Ranieri, G.; Cogoni, M.; Trogu, A.; Loddo, F. Time and spectral multiresolution remote sensing for the study of ancient wall drawings at san salvatore hypogeum, Italy. In Proceedings of the 22nd European Meeting of Environmental and Engineering Geophysics, Near Surface Geoscience 2016, Barcelona, Spain, 4–8 September 2016; p. 5. [Google Scholar]
  25. Piroddi, L.; Calcina, S.V.; Trogu, A.; Vignoli, G. Towards the definition of a low-cost toolbox for qualitative inspection of painted historical vaults by means of modified DSLR cameras, open source programs and signal processing techniques. In ICCSA 2020. Lecture Notes in Computer Science; Gervasi, O., Murgante, B., Misra, S., Garau, C., Blečić, I., Taniar, D., Apduhan, B.O., Rocha, A.M., Tarantino, E., Torre, C.M., et al., Eds.; Springer Nature: Cham, Switzerland, 2020; Volume 12255, pp. 971–991. [Google Scholar]
  26. Tapete, D.; Casagli, N.; Fanti, R. Radar interferometry for early stage warning on monuments at risk. In Landslide Science and Practice; Margottini, C., Canuti, P., Sassa, K., Eds.; Springer: Berlin, Germany, 2013; pp. 619–625. [Google Scholar]
  27. Montuori, A.; Luzi, G.; Stramondo, S.; Casula, G.; Bignami, C.; Bonali, E.; Bianchi, M.G.; Crosetto, M. Combined use of ground-based systems for Cultural Heritage conservation monitoring. In Proceedings of the 2014 IEEE Geoscience and Remote Sensing Symposium, Québec City, QC, Canada, 13–18 July 2014; pp. 4086–4089. [Google Scholar]
  28. Calcina, S.V.; Piroddi, L.; Ranieri, G. Vibration analysis of historic bell towers by means of contact and remote sensing measurements. Nondestruct. Test. Eva. 2016, 3, 331–359. [Google Scholar] [CrossRef]
  29. Piroddi, L.; Calcina, S.V. Integrated vibration analysis for historical dome structures: A complementary approach based on conventional geophysical methods and remote sensing techniques. In ICCSA 2020. Lecture Notes in Computer Science; Gervasi, O., Murgante, B., Misra, S., Garau, C., Blečić, I., Taniar, D., Apduhan, B.O., Rocha, A.M., Tarantino, E., Torre, C.M., et al., Eds.; Springer Nature: Cham, Switzerland, 2020; Volume 12255, pp. 928–943. [Google Scholar]
  30. Chase, A.F.; Chase, D.Z.; Awe, J.J.; Weishampel, J.F.; Iannone, G.; Moyes, H.; Yaeger, J.; Brown, M.K.; Shrestha, R.L.; Carter, W.E.; et al. Ancient Maya regional settlement and inter-site analysis: The 2013 west-central Belize LiDAR survey. Remote Sens. 2014, 6, 8671–8695. [Google Scholar] [CrossRef] [Green Version]
  31. Inomata, T.; Triadan, D.; López, V.A.V.; Fernandez-Diaz, J.C.; Omori, T.; Bauer, M.B.M.; Hernandez, M.G.; Beach, T.; Cagnato, C.; Aoyama, K.; et al. Monumental architecture at Aguada Fénix and the rise of Maya civilization. Nature 2020, 582, 530–533. [Google Scholar] [CrossRef]
  32. Tapete, D.; Fanti, R.; Cecchi, R.; Petrangeli, P.; Casagli, N. Satellite radar interferometry for monitoring and early-stage warning of structural instability in archaeological sites. J. Geophys. Eng. 2012, 9, S10–S25. [Google Scholar] [CrossRef]
  33. Agapiou, A.; Lysandrou, V.; Lasaponara, R.; Masini, N.; Hadjimitsis, D.G. Study of the variations of archaeological marks at neolithic site of Lucera, Italy using high-resolution multispectral datasets. Remote Sens. 2016, 8, 723. [Google Scholar] [CrossRef] [Green Version]
  34. Moriarty, C.; Cowley, T.D.; Wade, C.; Nichol, C.J. Deploying multispectral remote sensing for multi-temporal analysis of archaeological crop stress at Ravenshall, Fife, Scotland. Archaeol. Prospect. 2019, 26, 33–46. [Google Scholar] [CrossRef] [Green Version]
  35. Chen, F.; Lasaponara, R.; Masini, N. An overview of satellite synthetic aperture radar remote sensing in archaeology: From site detection to monitoring. J. Cult. Herit. 2017, 23, 5–11. [Google Scholar] [CrossRef]
  36. Chen, F.; Masini, N.; Yang, R.; Milillo, P.; Feng, D.; Lasaponara, R. A space view of radar archaeological marks: First applications of COSMO-SkyMed X-band data. Remote Sens. 2015, 7, 24–50. [Google Scholar] [CrossRef] [Green Version]
  37. Orlando, L. Georadar data collection, anomaly shape and archaeological interpretation–a case study from central Italy. Archaeol. Prospect. 2007, 14, 213–225. [Google Scholar] [CrossRef]
  38. Papadopoulos, N.; Sarris, A.; Yi, M.J.; Kim, J.H. Urban archaeological investigations using surface 3D ground penetrating radar and electrical resistivity tomography methods. Explor. Geophys. 2009, 40, 56–68. [Google Scholar] [CrossRef]
  39. Conyers, L.B.; Leckebusch, J. Geophysical archaeology research agendas for the future: Some ground-penetrating radar examples. Archaeol. Prospect. 2010, 17, 117–123. [Google Scholar] [CrossRef]
  40. Piro, S.; Campana, S. GPR investigation in different archaeological sites in Tuscany (Italy). Analysis and comparison of the obtained results. Near. Surf. Geophys. 2012, 10, 47–56. [Google Scholar] [CrossRef]
  41. Lasaponara, R.; Leucci, G.; Masini, N.; Persico, R. Investigating archaeological looting using satellite images and georadar: The experience in Lambayeque in North Peru. J. Archaeol. Sci. 2014, 42, 216–230. [Google Scholar] [CrossRef]
  42. Conyers, L.B. Analysis and interpretation of GPR datasets for integrated archaeological mapping. Near. Surf. Geophys. 2015, 13, 645–651. [Google Scholar] [CrossRef] [Green Version]
  43. Piro, S.; Goodman, D.; Zamuner, D. New Results from a Project of Urban Geophysics. GPR Surveys of Palatino’s Archaeological Area (Roma, Italy). In Proceedings of the Near Surface Geoscience 2015-21st European Meeting of Environmental and Engineering Geophysics, Turin, Italy, 6–10 September 2015; Volume 2015, No. 1. pp. 1–5. [Google Scholar]
  44. Zhao, W.; Forte, E.; Levi, S.T.; Pipan, M.; Tian, G. Improved high-resolution GPR imaging and characterization of prehistoric archaeological features by means of attribute analysis. J. Archaeol. Sci. 2015, 54, 77–85. [Google Scholar] [CrossRef]
  45. Trinks, I.; Hinterleitner, A.; Neubauer, W.; Nau, E.; Löcker, K.; Wallner, M.; Gabler, M.; Filzwieser, R.; Wilding, J.; Schiel, H.; et al. Large-area high-resolution ground-penetrating radar measurements for archaeological prospection. Archaeol. Prospect. 2018, 25, 171–195. [Google Scholar] [CrossRef]
  46. Persico, R.; D’Amico, S.; Matera, L.; Colica, E.; De Giorgio, C.; Alescio, A.; Sammut, C.; Galea, P. GPR Investigations at St John’s Co-Cathedral in Valletta. Near Surf. Geophys. 2019, 17, 213–229. [Google Scholar] [CrossRef]
  47. Orlando, L.; Michetti, L.M.; Belelli Marchesini, B.; Papeschi, P.; Giannino, F. Dense georadar survey for a large-scale reconstruction of the archaeological site of Pyrgi (Santa Severa, Rome). Archaeol. Prospect. 2019, 26, 369–377. [Google Scholar] [CrossRef]
  48. Verdonck, L.; Launaro, A.; Vermeulen, F.; Millett, M. Ground-penetrating radar survey at Falerii Novi: A new approach to the study of Roman cities. Antiquity 2020, 94, 705–723. [Google Scholar] [CrossRef]
  49. Gustavsen, L.; Stamnes, A.A.; Fretheim, S.E.; Gjerpe, L.E.; Nau, E. The effectiveness of large-scale, high-resolution ground-penetrating radar surveys and trial trenching for archaeological site evaluations—A comparative study from two sites in Norway. Remote Sens. 2020, 12, 1408. [Google Scholar] [CrossRef]
  50. Tonning, C.; Schneidhofer, P.; Nau, E.; Gansum, T.; Lia, V.; Gustavsen, L.; Filzwieser, R.; Wallner, M.; Kristiansen, M.; Trinks, I. Halls at Borre: The discovery of three large buildings at a Late Iron and Viking Age royal burial site in Norway. Antiquity 2020, 94, 145–163. [Google Scholar] [CrossRef]
  51. Colica, E.; Antonazzo, A.; Auriemma, R.; Coluccia, L.; Catapano, I.; Ludeno, G.; D’Amico, S.; Persico, R. GPR investigation at the archaeological site of Le Cesine, Lecce, Italy. Information 2021, 12, 412. [Google Scholar] [CrossRef]
  52. Manataki, M.; Vafidis, A.; Sarris, A. GPR data interpretation approaches in archaeological prospection. Appl. Sci. 2021, 11, 7531. [Google Scholar] [CrossRef]
  53. Persico, R.; Colica, E.; Zappatore, T.; Giardino, C.; D’Amico, S. Ground-Penetrating Radar and Photogrammetric Investigation on Prehistoric Tumuli at Parabita (Lecce, Italy) Performed with an Unconventional Use of the Position Markers. Remote Sens. 2022, 14, 1280. [Google Scholar] [CrossRef]
  54. Masini, N.; Sogliani, F.; Sileo, M.; Abate, N.; Danese, M.; Vitale, V.; Lasaponara, R.; Piro, S. Fusion and integration of heterogeneous close range remote sensing and geophysical data. The case of Grumentum. In Proceedings of the 2021 International Conference on Metrology for Archaeology and Cultural Heritage (MetroArchaeo 2021), Milan, Italy, 20–22 October 2021; p. 5. [Google Scholar]
  55. Neubauer, W.; Eder-Hinterleitner, A.; Seren, S.; Melichar, P. Georadar in the Roman civil town Carnuntum, Austria: An approach for archaeological interpretation of GPR data. Archaeol. Prospect. 2002, 9, 135–156. [Google Scholar] [CrossRef]
  56. Colombero, C.; Comina, C.; Rocchietti, D.; Garbarino, G.B.; Sambuelli, L. Ground penetrating radar surveys in the archaeological area of Augusta Bagiennorum: Comparisons between geophysical and archaeological campaigns. Archaeol. Prospect. 2022, 29, 451–464. [Google Scholar] [CrossRef]
  57. Jol, H.M. Ground Penetrating Radar Theory and Applications, 1st ed.; Elsevier: Amsterdam, The Netherlands, 2008. [Google Scholar]
  58. Tronicke, J.; Villamor, P.; Green, A.G. Detailed shallow geometry and vertical displacement estimates of the Maleme Fault Zone, New Zealand, using 2D and 3D georadar. Near Surf. Geophys. 2006, 4, 155–161. [Google Scholar] [CrossRef]
  59. Marcak, H.; Golebiowski, T. Analysis of GPR trace attributes and spectra for LNAPL contaminated ground. In Proceedings of the Near Surface 2006-12th EAGE European Meeting of Environmental and Engineering Geophysics, Helsinki, Finland, 4–6 September 2006; p. 5. [Google Scholar]
  60. Zhao, W.; Forte, E.; Pipan, M.; Tian, G. Ground penetrating radar (GPR) attribute analysis for archaeological prospection. J. Appl. Geophys. 2013, 97, 107–117. [Google Scholar] [CrossRef]
  61. Zhao, W.; Forte, E.; Pipan, M. Texture attribute analysis of GPR data for archaeological prospection. Pure Appl. Geophys. 2016, 173, 2737–2751. [Google Scholar] [CrossRef]
  62. Wiewel, A.; Conyers, L.B.; Piroddi, L.; Papadopoulos, N. An experimental use of ground-penetrating radar to identify human footprints. ArcheoSciences 2021, 45, 143–146. [Google Scholar] [CrossRef]
  63. Coroneo, R. La chiesa di San Leonardo di Siete Fuentes. In Santu Lussurgiu. Dalle Origini Alla Grande Guerra; Mele, G., Ed.; Solinas: Nuoro, Italy, 2005; Volume 1, pp. 45–58. [Google Scholar]
  64. Rassu, M. La Chiesa di San Leonardo di Siete Fuentes; Iskra: Ghilarza, Italy, 2011. [Google Scholar]
  65. Crudeli, G. Chiesa di San Leonardo di Siete Fuentes in territorio di Santu Lussurgiu. In Studi Sardi; Cedam: Padova, Italy, 1952; pp. 477–490. [Google Scholar]
  66. Scano, D. Storia dell’arte in Sardegna dall’XI al XIV Secolo; Stabilimenti Tipografici Gaetano Montorsi: Cagliari, Italy, 1907. [Google Scholar]
  67. Delogu, R. L’architettura del Medioevo in Sardegna; La Libreria dello Stato: Roma, Italy, 1953. [Google Scholar]
  68. Coroneo, R. Architettura Romanica Dalla Metà del Mille al Primo ‘300 [Storia dell’arte in Sardegna]; Ilisso: Nuoro, Italy, 1993. [Google Scholar]
  69. Deplano, G. L’Ordine di Malta in Sardegna nel Trecento. In Templari e Ospitalieri in Sardegna; Rassu, M., Ed.; Grafica del Parteolla: Dolianova, Italy, 2008; pp. 67–88. [Google Scholar]
  70. Rassu, M. L’Ordine di Malta in Sardegna; Artigianarte: Cagliari, Italy, 1996. [Google Scholar]
  71. Filia, D. La Sardegna Cristiana: Storia Della Chiesa, 2, Dal Periodo Giudicale al 1720; Tipografia U. Satta: Sassari, Italy, 1913. [Google Scholar]
  72. Melis, E. L’Ordine di San Giovanni di Gerusalemme a San Leonardo. Un documento inedito dall’archivio medioevale dell’Ospedale di San Leonardo. Nae 2005, 4, 59–63. [Google Scholar]
  73. Melis, E. Alcuni documenti medievali della Domus sive Preceptoria di San Leonardo di Sette Fontane. Quad. Bolotanesi 2008, 34, 111–152. [Google Scholar]
  74. Ruggieri, A. Le croci scolpite nella chiesa di San Leonardo di Siete Fuentes. In Militia Christi e Templari in Sardegna; Rassu, M., Ed.; Domusdejanas: Selargius, Italy, 2010; pp. 149–162. [Google Scholar]
  75. Piroddi, L. GPR prospection at the San Leonardo de Siete Fuentes’ church, Santu Lussurgiu, Italy. In Proceedings of the 2021 11th International Workshop on Advanced Ground Penetrating Radar (IWAGPR), Valletta, Malta, 1–4 December 2021; pp. 1–5. [Google Scholar]
  76. Avdelidis, N.P.; Moropoulou, A. Applications of infrared thermography for the investigation of historic structures. J. Cult. Herit. 2004, 5, 119–127. [Google Scholar] [CrossRef]
  77. Damiata, B.N.; Steinberg, J.M.; Bolender, D.J.; Zoëga, G. Imaging skeletal remains with ground-penetrating radar: Comparative results over two graves from Viking Age and Medieval churchyards on the Stóra-Seyla farm, northern Iceland. J. Archaeol. Sci. 2013, 40, 268–278. [Google Scholar] [CrossRef]
  78. Testone, V.; Longo, V.; Mameli, P.; Rovina, D. Geophysical prospection pilot in rock-cut tombs: The case study of Anghelu Ruju necropolis (Sardinia). Archaeol. Prospect. 2018, 25, 271–277. [Google Scholar] [CrossRef]
  79. Alsharahi, G.; Faize, A.; Louzazni, M.; Mostapha, A.M.M.; Bayjja, M.; Driouach, A. Detection of cavities and fragile areas by numerical methods and GPR application. J. Appl. Geophys. 2019, 164, 225–236. [Google Scholar] [CrossRef]
  80. Armstrong, B.J.; Edwards-Baker, S.; Penzo-Kajewski, P.; Herries, A.I. Ground-penetrating radar analysis of the Drimolen early Pleistocene fossil-bearing palaeocave, South Africa. Archaeol. Prospect. 2021, 28, 419–433. [Google Scholar] [CrossRef]
  81. Berezowski, V.; Moffat, I.; Shendryk, Y.; MacGregor, D.; Ellis, J.; Mallett, X. A multidisciplinary approach to locating clandestine gravesites in cold cases: Combining geographic profiling, LiDAR, and near surface geophysics. Forensic. Sci. Int. Synerg. 2022, 5, 100281. [Google Scholar] [CrossRef]
  82. Douglas, S.S.; Everett, M.E. 3D polarimetric GPR coherency attributes and full-waveform inversion of transmission data for characterizing fractured rock. Geophysics 2009, 74, J23–J34. [Google Scholar]
  83. Catakli, A.; Mahdi, H.; Al-Shukri, H. Texture analysis of GPR data as a tool for depicting soil mineralogy. In Proceedings of the 2011 IEEE Applied Imagery Pattern Recognition Workshop (AIPR), Washington, DC, USA, 11–13 October 2011; pp. 1–8. [Google Scholar]
  84. Topp, G.C.; Davis, J.L.; Annan, A.P. Electromagnetic determination of soil water content: Measurements in coaxial transmission lines. Water Resour. Res. 1980, 16, 574–582. [Google Scholar] [CrossRef] [Green Version]
  85. Greaves, R.J.; Lesmes, D.P.; Lee, J.M.; Toksoz, M.N. Velocity variations and water content estimated from multi-offset, ground-penetrating radar. Geophysics 1996, 61, 683–695. [Google Scholar] [CrossRef]
Figure 1. The church of San Leonardo de Siete Fuentes: localization of Santu Lussurgiu (a); aerial view of the church inside the wood of San Leonardo (b); plan view and elevations from a survey of 1952 (c) [65]; main façade to the East (d); southern wall with the walled entrance (e); north-eastern view with the rectangular apse (f); internal view of the nave (g); internal view of the cross vaulted apse (h).
Land 12 00590 g001
Figure 2. GPR survey lines inside the nave of the church of San Leonardo (a). Picking of diffraction hyperbolas in a B-scan (b). Histogram of the EM wave velocities detected in the GPR dataset (c).
Land 12 00590 g002
Figure 3. Depth- and time-slices of the GPR signal from the surface to 37.4 ns (around 1.9 m deep).
Land 12 00590 g003
Figure 4. Recognition of GPR anomalies in the transversal radargrams. Sketch map with the indication of GPR anomalies in bolded capital letters and location of the four analyzed radargrams (a). B-scans with the indication of the progressive vertical planimetric coordinates and the graphical comment of the four main anomalies (using the same color conventions as in the sketch map) (be). The depth and horizontal coordinates are expressed in meters.
Land 12 00590 g004
Figure 5. 3D analysis of the complete GPR dataset. Scatterplot of GPR amplitudes (a); scatterplot of data variance (b); referencing map of the following virtual sections of the dataset (c); GPR cross-section with 3D isovalues of amplitudes (d); GPR cross-section of amplitude data (e); GPR cross-section of the variance of data (f).
Land 12 00590 g005
Figure 6. 3D manual recognition of possible archaeological features by interpolating GPR horizons picked from transversal radargrams. 3D visualization of the recognized horizon surface belonging to the envelope of anomalies B and C, which appear fused inside a unique pattern (a,b). Map with the depth from the floor surface of the reconstructed volumes (larger depth values for deeper targets) (c).
Land 12 00590 g006
Figure 7. Archaeological interpretation based on stylistic, historic, and geophysical analyses.
Land 12 00590 g007
Figure 8. Thermographic images of the church of San Leonardo: the presence of localized humidity is recognizable at the internal attachment of the wooden roof to the walls, (a,b), and at the bottom of the jambs of the northern lateral entrance (c) by the shift of the thermal regime due to the different thermal inertia of the dry and humid stones which, in these cases, leads to higher thermal emissions; the materials of the façade is homogeneous despite the different building times of its parts (d).
Land 12 00590 g008
Figure 9. A stylistic study of the main façade: the legacy of the first fabric can be recognized (red line) by the different dimensions of the ashlars, smaller in the extension, and of the bigger mortar joints (a); reconstruction of the original façade, based on the results of the geophysical and historic-artistic investigations (b).
Land 12 00590 g009
Disclaimer/Publisher’s Note: The statements, opinions and data contained in all publications are solely those of the individual author(s) and contributor(s) and not of MDPI and/or the editor(s). MDPI and/or the editor(s) disclaim responsibility for any injury to people or property resulting from any ideas, methods, instructions or products referred to in the content.

