Abstract
The high-density urban form and building arrangement of modern cities have contributed to numerous environmental problems. The calm wind area caused by inappropriate building arrangements results in pollutant accumulation. To realize a practical design and improve urban microclimate, we investigated the spatial relationship between roads, buildings, and open space using the machine learning technique. First, region growing and k-means clustering were employed to identify roads and buildings. Based on the image masking program, we selected training areas according to the land use map. Second, we used the multiple-point statistics technique to create new urban fabric images. Viewing the training image as a prior model, our program constantly reproduced morphological structures in the target area. We intensified the similarity with training areas and enriched the variability among generated images. Third, Hausdorff distance and multidimensional scaling were applied to achieve a quality examination. The proposed method was performed to fulfill an urban renovation design in Xi’an, China. Based on the historical record, we applied computational fluid dynamics to simulate air circulation and ventilation. The results indicate that the size of calm wind area is reduced. The wind environment is significantly improved due to the rising wind speed.
1. Introduction
Urbanization has been increasingly recognized as a global phenomenon and trend. Its main characteristics include rapid population growth, dramatic urban sprawl, increasing building density, and high-density urban forms [1]. However, the slow airflow caused by the high-density urban form not only impacts the comfort of pedestrians but also reduces the volume of air infiltration [2]. A wide range of calm and low-speed wind areas are created. Because of the weak airflow, vehicle pollutants cannot be effectively diluted. The stagnation of air pollutants results in an increase in the apparent temperature as well as the risk of respiratory diseases [3,4]. Based on an investigation conducted by Kalnay and Cai [5], urbanization and land use transition are key reasons for local and regional climate change. Recent research has highlighted the importance of urban renovation design in improving urban microclimate and wind environment. Strengthening urban ventilation is considered an effective way to alleviate urban environmental problems [6].
Existing urban wind environment studies have four research scales: regional, urban, block, and individual buildings [7]. First, the regional scale is broadly applied in urban design and land use planning. In general, regional-scale studies focus on the natural topography and external wind conditions. Based on the natural ventilation potential, researchers suggest practical designs for the urban form, industry management, and population density. Rasouli et al. applied particle image velocimetry to explain a wind velocity field in a complex terrain [8]. Based on the wind tunnel experiment, the wind environment associated with complex terrain and urban canopy layer was extensively studied. Guo et al. employed computational fluid dynamics (CFD) to perform numerical simulations in large-scale mountainous terrains [9]. Based on ventilation paths, a framework was designed to superimpose the wind path on the temperature map.
The second way to investigate the wind environment concentrates on the urban scale. Combined with the overall urban plan, study results are widely used in urban interior space, land use planning and urban form control [10]. Based on the existing wind circulation system, urban-scale studies emphasize the potential ventilation corridors produced by urban form and land use. Using a wind environment simulation, Panagiotou et al. analyzed cities with typical geometric shapes [11]. The relationship between urban form and wind velocity field was investigated. Based on an analysis of the thermal environment, Liu et al. found the core factors of the wind environment in Kaifeng City [12]. Remote sensing and a geographic information system were applied to design an urban ventilation corridor. Ng et al. studied dense urban forms and the availability of field wind in Hong Kong [3]. A high-resolution density map was drawn to describe urban surface roughness.
Third, wind environment research at the block scale highlights the urban microclimate. Generally, the length of a block ranges from 10 to 1000 m. Thus, the heat island effect and smog with a horizontal range of less than 2 km have attracted attention. The block-scale studies focus on the effectiveness of building density, building arrangement, building height, street width, green space, and park distribution [13]. In 2008, Testu et al. selected 22 typical residential blocks and simulated their microclimate [14]. The correlation between building volume and wind environment was quantitatively analyzed. The result revealed a strong relationship between the total building coverage and average wind speed. By adjusting the building coverage, a method was devised to produce an acceptable wind environment for residential blocks. Hong and Lin investigated six typical configurations of building layouts and tree arrangements [15]. Based on the computational simulation, the urban form with a square space articulated by buildings and oriented toward the prevailing wind provided a desirable path to speed up the airflow. Using a block in Hong Kong as an example, Weerasuriya et al. adopted a wind tunnel experiment to study the effect of twisting wind flow on air ventilation [16]. The result indicated that building density has a remarkable impact on wind speed. Du et al. used Hong Kong Polytechnic University as a case study [17]. The low-speed wind environment was improved at the pedestrian level through a general framework and detailed guidelines. In 2021, Zhu et al. studied three virtual building layouts: buildings in rows, buildings in square clusters and buildings in a checkerboard pattern [18]. In accordance with the computer simulation, buildings in rows lead to the highest accumulation of street-level pollution.
Fourth, wind environment research at the individual building scale has been applied to the design of building facades, to guide building direction and to control building spacing. The research problem is the influence of architectural geometry on the short-range wind field. To improve pedestrian comfort, Yuan et al. incorporated a CFD simulation into practical architectural design [19]. Tsanga et al. classified the facades of high-rise buildings into several groups [20]. The relationship between the wind environment and building size was quantitatively analyzed. According to their study, a single wider building has a negative effect on airflow. In comparison, high-rise buildings played a positive role in near-field ventilation. Based on CFD simulations, Hang et al. evaluated the influences of building density, building height, wind direction, and other factors on air circulation [21].
On the basis of the discussions stated above, urban form and building arrangement play an essential role in the urban wind environment. Based on practical measurements, laboratory experiments and numerical simulation, researchers have been devoted to finding sensitive factors to facilitate air circulation and mitigate pollutant concentration. However, incorporating the research results into urban renovation design is a challenging task in reality. It is time-demanding and labor-intensive to simultaneously control building size, building arrangement, road networks and open space in practical applications.
In recent years, artificial intelligence has attracted considerable attention from the urban planning community [22,23]. It is effective to use machine learning and deep learning techniques to objectively investigate the land use transition and urban sprawl in modern cities [24]. Using digital images as the data source, researchers apply pattern recognition, object detection, and semantic segmentation programs to analyze green space, building density, and urban landscapes [25,26,27]. With the development of deep learning, image generation and synthesis have become active topics [28,29]. Given training images as the input, the computer program automatically outputs numerous realistic images. The spatial structure and morphological characteristics of training images are well conserved and reproduced in the target domain.
In this study, we explored a method for applying machine learning techniques to achieve urban renovation design. With the objective of improving the wind environment at the block scale, a group of urban fabric images were generated by the computer program. There were three fundamental steps. First, we applied region growing and k-means clustering to separately identify roads and buildings. To obtain accurate training instances, the urban fabric image was masked according to the land use map. Second, a multiple-point statistics program was used to create new urban fabric images. Our program continuously reproduced the spatial structures in the target area. The similarity between training images and the variability between generated images were simultaneously increased. Third, we conducted Hausdorff distance and multidimensional scaling to examine the generated images. The distance between image patches becomes an indicator of the morphological consistency. We tested the proposed method with an example from Xi’an, China. The building density and arrangement in the residential block were updated. A computational fluid dynamics program was launched to simulate the wind environment. The results imply that the proposed method significantly reduces the calm wind area. Rising wind speed becomes a key factor for facilitating air circulation and mitigating pollutant concentrations. There are two main objectives of this paper: (1) A machine learning-based framework is proposed to create new urban fabric images. Three basic components include image preprocessing, image generation and quality examination; (2) We fulfilled an urban renovation design in Xi’an, China. The building density, building arrangement and open space were upgraded in the research area in order to solve the wind environment problem.
2. Data and Methods
2.1. Data and Research Area
As the capital of Shaanxi Province, Xi’an is the most populous city in Northwest China. Known as Chang’an for much of its history, Xi’an is one of the four great ancient Chinese capitals. Xi’an is located in the middle of the Guanzhong Plain, which is a flood plain created by the eight surrounding rivers. The urban area of Xi’an is located at 34°16′ N and 108°56′ E. Xi’an has a temperate climate which is affected by the East Asian monsoon. Summer is characterized by hot and humid conditions while winter is cold and dry. In recent decades, Xi’an has experienced a drastic expansion of area and population. By the end of 2022, the city contained 11 districts and two counties. Over the past 30 years, the urban area has extended by 554.23 km2. The present urban area is 10,752 km2. The total population is more than 13 million and the total urban population is over 9 million. The rapid expansion of Xi’an brings serious climatic and environmental problems. The smog and heat island effect have attracted considerable attention. Unreasonable land use, urban form and building arrangements have significantly affected the urban microclimate and air quality.
Figure 1 shows the location of Xi’an. The research area is Xujiazhuang. As a typical urban form in Xi’an, the building layout in Xujiazhuang is messy and insensible because of the long history of unplanned construction. Both infrastructure conditions and life quality have been declining. In recent years, high-density buildings and intensive-flow populations have created numerous environmental, traffic, safety, and management issues. Therefore, this phenomenon has heightened the need for urban update and renewal. By comparison, Xujiazhuang’s neighboring areas have been successfully renovated in recent years. Regular road networks, appropriate building arrangements and large open space have a positive effect on the urban microclimate. The comparison between Xujiazhuang and its neighboring communities is highlighted in Figure 2. Therefore, the residential blocks in the neighborhood provide an ideal example for the renovation design in Xujiazhuang.
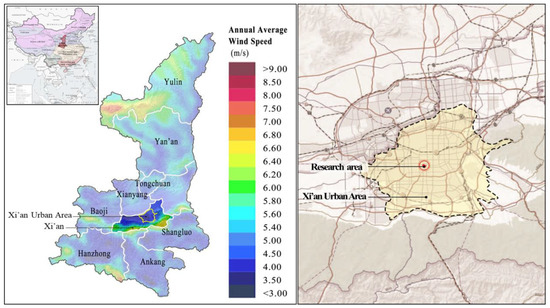
Figure 1.
The locations of Xi’an, China.
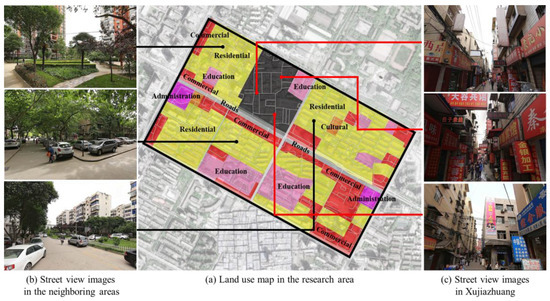
Figure 2.
Street view images of the research area and its neighboring blocks in Xi’an.
Satellite images and street view images of the research area were gathered from Beidou, China (https://map.baidu.com (accessed on 7 February 2023)). The original image of the urban fabric comes from a platform called the China Urban Planning Industry Forum (http://www.caup.net/ (accessed on 7 February 2023)). To study the land use in the research area, we followed the guidelines enacted by the Chinese government. There are six categories in the land use map: residential, commercial, cultural, education, administration, and roads.
In this work, the historical data of wind speed and direction were collected from 31 October 2012 to 31 October 2022. The wind speed was measured using a device the height of which was 10 m above the ground. As Table 1 shows, the average wind speed in Xi’an is 2.3 m/s. Figure 3 provides the probability distribution of wind direction. The most frequent direction is northeast, which accounts for 14.8%.

Table 1.
Wind speed measurement in Xi’an, 2012–2022.
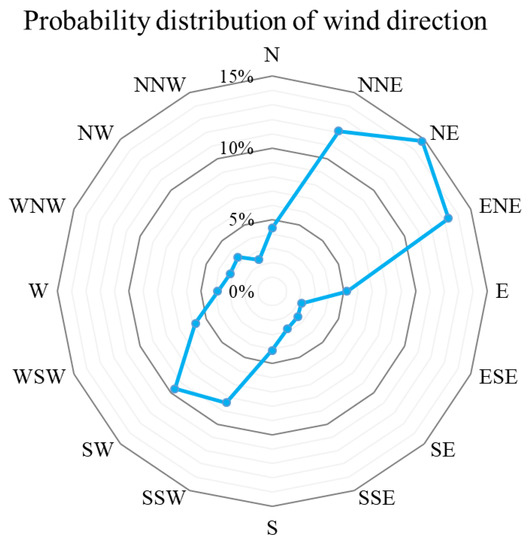
Figure 3.
Probability distribution of wind direction in Xi’an, China.
2.2. Research Method
2.2.1. Image Generation Technique in the Context of Urban Planning
The core contribution of this paper is to design a machine learning framework to understand and reproduce the spatial relationship between roads, buildings and open space. There are three steps: (1) image preprocessing; (2) image generation; and (3) image quality evaluation.
- (1)
- Image preprocessing with region growing and k-means clustering
The urban fabric image exhibits the basic relationship between roads, buildings and open space. However, there are many noise points and spurs in the original image. Though it does not impact the manual inspection, the noise creates a difficulty for the computer program. Thus, we performed the preprocessing step to remove the disturbance.
The preprocessing step had three components. At first, we detected roads with the region growing algorithm. As the skeleton of the modern city, the road network is recognized as an essential part of urban renovation design. The basic idea of region growing is to calculate the similarity between neighboring pixels [30]. One key benefit is to conserve the long-range structure and connected components. This enables the region growing program to become an appropriate choice with which to find roads from the original image. Three elements are involved in the region growing program. First, the program selects one pixel in the original image as the seed point. To ensure the initial pixel belongs to the road, we manually specified the seed point in the urban fabric image. Second, the difference between the seed point and a neighboring point was calculated. If the difference was lower than a threshold, the program would add the neighboring point into a dataset. Otherwise, the mismatching point was not collected. In our application, the original urban fabric image was grayscale. Therefore, the region growing program compared the intensities of two image pixels and adopted Euclidean distance to calculate the difference. Third, we iteratively performed the neighbor checking step until the point dataset did not grow. Distance tolerance is an important parameter. Based on our test, we specified the threshold as four to produce an acceptable result.
Next, we adopted the k-means clustering technique to identify buildings. The spatial arrangement of buildings is a key part of urban design. Similar to the region growing program, the difference between two image pixels was employed to distinguish buildings and open space. As a milestone technique in the field of machine learning, the k-means clustering program is dedicated to exploring the relationship between training instances [31]. Similar samples are allocated into one group. The primary steps of k-means clustering include: (1) The program randomly selected k points as the initial medoids; (2) For every image pixel, Euclidean distances with the two medoids were calculated. The program assigned each point to the group with the minimum distance; (3) The medoid vectors were upgraded according to members in each group. The geometrical center became the new medoid; (4) We repeatedly conducted steps (2) and (3) until the iteration number reached a threshold. As the only parameter in k-means clustering, the value of represents the number of clusters. We configurated because the target of the clustering program was to distinguish buildings and open space. There are two pixel groups in the clustering result.
Finally, we improved the urban fabric image in accordance with the land use map. The quality of the training image is a key element in our machine learning framework. Because the objective was to renovate a residential area, the uncorrelated areas were removed from the urban fabric image. Based on the image masking technique, we retained the urban form in the residential areas.
In summary, the original urban fabric image contains many noise points and disturbances. The grayscale difference between the image pixels became a core factor in the preprocessing program. At first, we performed the region growing procedure to detect the road network. An important benefit is capturing the road structure with long-range connectivity. Next, k-means clustering was conducted to identify buildings and open space. Our program automatically found the optimal threshold to distinguish image pixels. Finally, the program carried out the image masking to further improve the fabric image. With the intention of providing a high-quality image to the subsequent steps, we removed uncorrelated areas based on the land use map.
- (2)
- The image generation method inspired by multiple-point statistics
In the following paragraphs, we launch the image generation step to plan roads, buildings and open space in the target area. The multiple-point statistics (MPS) technique was activated. As an interdisciplinary method, MPS occurs at the intersection of computer science, statistics and Earth science [32]. Viewing a training image as a prior model, the core idea of MPS is to detect the relationship between several neighboring points and regenerate the spatial structures in the target domain. Compared with other image generation techniques, the key advantages of MPS include: (1) It is effective at identifying the high-order relationship between multiple image pixels. The morphologically complex structures can be captured and reproduced; (2) The main object of MPS is the image with a limited number of possible values; (3) There are a few user-defined parameters in MPS; (4) MPS does not have a high demand for training data. It is worth noting that the major task of this study was to create new urban fabric images. There are only three values in the fabric image: roads, buildings and open space. Moreover, we did not have a large number of training instances. It is time-consuming to collect numerous high-quality images in the practical application. Therefore, the characteristics of urban fabric images allow MPS to become a valuable choice in this scenario.
There are two steps within MPS. First, we visited an unknown point in the target area and collected informed points in the neighborhood. Assuming the number of points is N, the values of known points constitute a conditioning instance . Here, is the value of the -th point. Moreover, the relative locations were gathered. MPS created a location vector . Second, a searching procedure was performed to find the matching structure in the training image. The program visited a point in the training image. Based on the location vector, a training instance was produced. Because there was a categorical variable in the image, we employed Hamming distance to distinguish two vectors. The definition of Hamming distance is shown below:
The MPS program continuously tests the point in the training image until the distance between and is lower than a threshold. The unknown point is predicted by pasting the matching structure from the training image to the target area. The preceding program was repeatedly performed until there was no uninformed point in the target domain. The technical details are discussed by Zuo et al. [32]. Based on their investigation, the number of conditioning points and the value of a distance threshold were specified as 30 and 0.1 in this work.
- (3)
- Image quality evaluation with Hausdorff distance and multidimensional scaling
Aiming at mitigating the subjectivity in the manual inspection, we introduced the distance metric to fulfill an objective morphological evaluation. The program adopts Hausdorff distance to quantify the similarity between training and generated images. The basic four steps are listed as follows. First, we extracted image patches from the training and generated images. The urban structures were individually stored in the two datasets and . and are the number of instances in two sets, respectively. Second, the distance between one element and a dataset was computed. For example, the distance between an example and set is defined as:
In this work, Hamming distance was used to distinguish two patterns. Third, we represent the distance between and as the average value.
Fourth, the maximum operation was adopted to ensure the symmetry of the distance metric. A noticeable phenomenon is that is not equal to in Equation (4). This does not satisfy the axiom of distance. Therefore, we employed the maximum function. The Hausdorff distance between and is represented as:
Hausdorff distance is effective at quantifying the consistency between training and generated images. A small value of distance indicates there is a favorable agreement. The spatial structures and building layout are well reproduced by the MPS program.
In addition, we applied multidimensional scaling (MDS) to achieve data visualization. The relationship between training structures and generated structures is explicitly depicted. As a classical manifold learning technique, MDS focuses on projecting the data samples from the high-dimensional space into the low-dimensional space. In the feature space, each node represents a spatial structure or an image patch. The instances with similar urban fabric are close. In this paper, we calculated the distance between every two instances in and . A distance matrix of size (A + B) × (A + B) was produced. Based on the similarity matrix, we carried out MDS to create a scatter plot. The dispersals of training and generated patches became a key indicator of the image generation quality. Reference [33] provides a detailed explanation of Hausdorff distance and MDS.
2.2.2. Simulation Method of Wind Environment at the Block Scale
Sufficient airflow is a major drive of pollutant diffusion and residents’ comfort. Air and life quality are heavily dependent on the urban ventilation system. We evaluated the wind environment with the concept of a calm wind area. The definition of calm wind area is an area the wind speed of which is lower than a specified value. The percentage of calm wind area denotes the ratio of the calm wind area to the total open area. According to Ye et al. [34], an airflow of less than 1 m/s would have a negative effect on pollutant dilution and residents’ comfort. Thus, 1 m/s was applied to define the calm wind area in this work. The low proportion of calm wind area causes a pleasant wind environment in the city.
This study employed CFD to simulate the wind environment and find the calm wind area. The basic steps were as follows:
- (1)
- Building a mathematical model. We selected the flow equation, specified wind parameters and established the boundary condition. The Navier–Stokes equation was employed to describe the fluid motion. The wind speed and direction are discussed in Section 2.1. To simplify the parameter specification, we applied the default setting in the commercial software Ansys Fluent.
- (2)
- Constructing 3D geometric models. Based on the actual size, we created the geometric models of the terrain and buildings. To address the complicated and irregular shape, simplified models associated with the main geometrical features were produced.
- (3)
- Generating a computing grid. To realize a high-resolution simulation, the continuous flow field was partitioned into discrete cells. In this work, a square of size 5 m × 5 m was applied as the operation element.
- (4)
- Performing CFD simulation. Based on the materials mentioned above, numerical simulation was launched. We conducted the finite element method to solve the Navier–Stokes equations. The velocity field of wind was visualized as the output.
2.2.3. Detailed Workflow of the Urban Fabric Image Generation Based on Machine Learning
Aiming at achieving urban renovation design and alleviating the microclimate issue, we designed a machine learning framework to generate urban fabric images. The spatial relationship between roads, buildings and open space is automatically understood by the computer program. Then, we consistently reproduced suitable structures in the target area. Constrained by existing roads and buildings, the program carefully arranged new buildings into appropriate positions. As Figure 4 shows, there are four major modules in the proposed method.
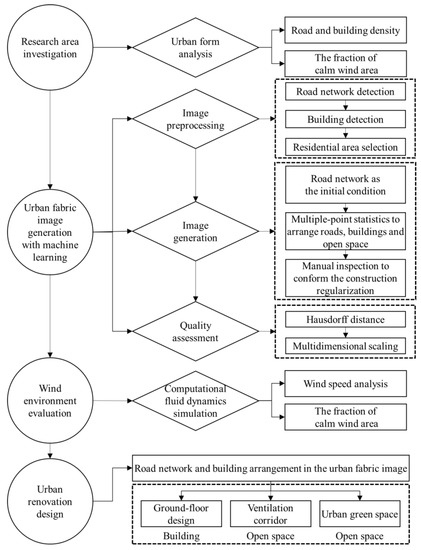
Figure 4.
Framework of the proposed method.
- (1)
- Research area investigation. Analyzing the current situation is an essential step in scientific research. In this work, we focused on a residential block in Xi’an, China. The high building density and improper layout significantly slow down the airflow and ventilation. By comparison, residential blocks in the surrounding areas provide a reliable example for our renovation design and machine learning programs. Therefore, the urban form in the neighboring areas was used as the training image. The building arrangement was viewed as a prototype by the downstream procedures.
- (2)
- Urban fabric image generation with machine learning. There were three steps. First, the image preprocessing step extracted roads and buildings from the original fabric image. The disturbance and uncorrelated areas were removed. Second, we performed the multiple-point statistics program to realize image generation. The spatial structures in the training image were pasted into the target area. Third, the quality assessment step focused on examining the generated images from the perspective of morphology. Hausdorff distance and multidimensional scaling were implemented to quantify the affinity between training and generated images.
- (3)
- Wind environment evaluation. To assess the wind environment, we activated CFD to simulate the air circulation in the research area. The calm wind area and wind speed became key descriptors for the effectiveness of our design.
- (4)
- Urban renovation design. The planning proposal was refined based on the urban fabric image generated by the proposed method. The open ground-floor space, green space and water course were carefully designed to further optimize the wind environment.
3. Results
3.1. Urban Image Preprocessing
Figure 5a shows the urban fabric image from the open-access website. In this image, black and gray are used to express the buildings and roads. The open space is represented by white. The target area (Xujiazhuang) that needs to be upgraded is highlighted by the cyan rectangle. It should be noted that the cyan rectangle is not a part of the fabric image. Apparently, the morphological characteristics of the target area are significantly different from the neighboring areas. The building density is 53.55% in Xujiazhuang. By comparison, the building density is 26.86% in the neighboring areas. In particular, the buildings account for 28.99% of the surrounding residential blocks. Moderate density has a positive effect on air flow and circulation. Moreover, the size of individual buildings is considerably larger in Xujiazhuang. The building arrangement results in a serious environmental problem in the target area.
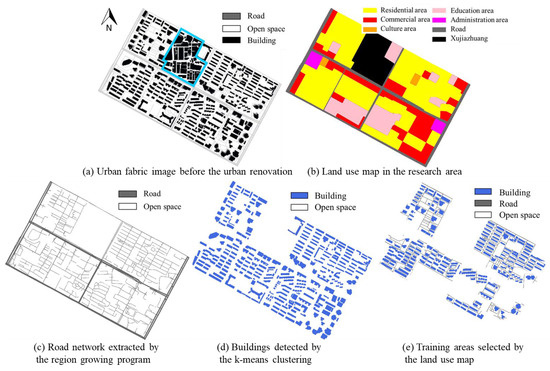
Figure 5.
Urban fabric images in the preprocessing step.
Aiming at creating a clean image without noise, we separately extracted the road and building from the original image. The program outputs the road network image using the region growing technique. The type of road is expressed by its width. Compared with the pedestrian path in the residential area, the high-level roads are wider and have more lanes. The main streets are in the east, west, and south sides of the research area. Their widths range from 10 to 20 m. In accordance with the road network, we found that the transportation connectivity is favorable in the north and southwest sides. Roads are regularly planned in the residential area. In contrast, the southeast area has complex and irregular networks. Inappropriate road planning leads to traffic congestion and carbon emission problems.
Next, we applied k-means clustering to partition buildings and open spaces. Figure 5d shows the result. Apparently, there is an intensive variation in terms of building density, size and layout. Buildings along the main streets are large in size with diverse shapes. Moreover, the morphological diversity has gradually decreased with the rising distance to the main street. In the west and north areas, there is suitable spacing between roads and buildings. By comparison, the building layout is irregular in the southeast part.
Based on the phenomenon stated above, the urban form experiences a strong shift. The road structure and building layout continuously change with the varying locations. The main reason for the non-stationarity is the land use category in each block. According to the regulation established by the Chinese government, we partitioned the research area into six categories. The land use map is shown in Figure 5b. The color of each category is recommended by the Chinese criterion. In particular, Xujiazhuang is emphasized by black. In the land use map, the proportion of the residential area is 47.72%. It should be noted that the core task is to renovate a residential block. The uncorrelated structures in the fabric image not only provide useless information but also create a computational burden. Therefore, we utilized an image masking technique. Based on the semantics of land use property, we collected the urban fabric in the residential area. The result is shown in Figure 5e. Regular building arrangements provide favorable examples to the downstream machine learning program.
3.2. Urban Fabric Image Generation
In this section, we performed MPS to generate new urban fabric images. The proposed program automatically understands the spatial relationship between roads, buildings and open space. Suitable structures are consistently reproduced in the target area. To inspire the MPS program, we provided four initial conditions using expert drawings. The detailed information is explained in Figure 6a–d. It should be noted that the buildings in the top-right area belong to a middle school. They are not a part of Xujiazhuang. Accordingly, the target area has different road networks. There is no building in the initial state. The volume of roads has progressively increased. In these four maps, road densities are 0%, 1.69%, 2.04% and 4.8%, respectively.
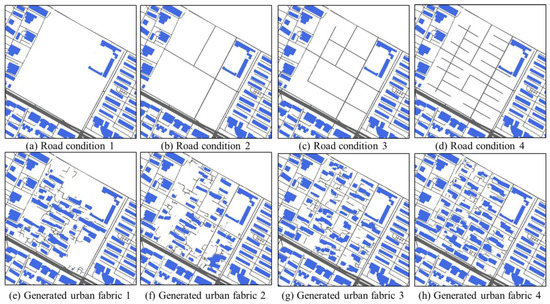
Figure 6.
Initial road networks and generated urban fabric images.
Based on the training image in Figure 5e and the road maps in Figure 6, MPS was launched to assign buildings into suitable positions. For each initial condition, the program generated 30 realizations. To provide reliable outputs, we selected models according to the regulations and standards compiled by the local authority. The generated images are shown in Figure 6e–h. In accordance with the visual inspection, MPS is capable of creating the building layout and urban fabric. The volume, density and direction of new buildings are consistent with the neighboring area. The spatial structure is well conserved and reproduced in the target area. Moreover, our program can reserve the entrances, roads and square space in the city block.
Next, we compared the fabric images motivated by different road networks. Based on the visual inspection, MPS not only reproduces spatial structures but also respects the conditioning data. On one hand, our program can generate the urban fabric without any initial condition. On the other hand, MPS adaptively predicts building locations according to the varying road networks. The buildings have suitable spacing to the road. In addition, a high value of initial road density creates a strong constraint to MPS. The building density has gradually risen with the increasing proportion of the initial road. For example, the building density in Figure 6e is 18.94%. By comparison, the building separately accounts for 19.01%, 23.54%, and 27.88% in Figure 6f–h. It should be noted that the building density is 28.99% in Figure 5e. Therefore, a proper initial condition is beneficial for generating high-quality urban fabric and building arrangements.
3.3. Morphological Evaluation of Urban Fabric Images
Prior to evaluating the wind environment, we examined the morphological characteristics of urban fabric images. Hausdorff distance was applied to assess the image quality. The technical details are discussed in Section 2.2.1. A small distance implies that there is a high similarity and consistency between two images. Based on Figure 6e–h, Hausdorff distances between the training and generated images are 0.053, 0.052, 0.052 and 0.050. There are two findings: (1) There is an impressive consistency between the target and neighboring areas. For each image patch in our design, it is easy to find similar structures in the training image; (2) Intense constraint has a positive influence on improving image generation quality. The Hausdorff distance has reduced with the development of initial road density.
We selected Figure 6h as the MPS generation result. Next, MDS was activated. From the image generation perspective, there are two variabilities within the new images: similarity and diversity. On one hand, a competitive result should have similar characteristics to the training image. The building density, direction and arrangement are supposed to agree with the surrounding residential area. On the other hand, there should be a suitable difference between generated images. Generating images is not directly pasting the urban fabric into the target area. Several new structures are necessary to enrich the design proposal.
Figure 7 presents the MDS result. In the feature space, each node represents an image patch. There are four findings: (1) The instances close to the cloud center have a small proportion of roads and buildings. The high-density areas are allocated at the edge of the cloud; (2) Two close points indicate two patches have similar structures. For instance, patches associated with high building density and low road density are in the upper left area of Figure 7. By comparison, the structures with a few buildings and many roads are assigned to the bottom left side. Moreover, the medium-density and high-density residential blocks are on the right side of the point dispersal; (3) The orange and blue points belong to the same distribution. Since there is no significant difference, we could conclude that MPS successfully reproduces urban structures in the target area; (4) The orange points corresponding to generated images have a vast coverage. Proper variability exists within the new images. Based on the previous explanation, MDS is effective at investigating spatial structures in the context of urban design. The generated image exhibits suitable similarity as well as diversity. Our program not only reproduces the urban form in the neighboring area but also enlarges the morphological variability.
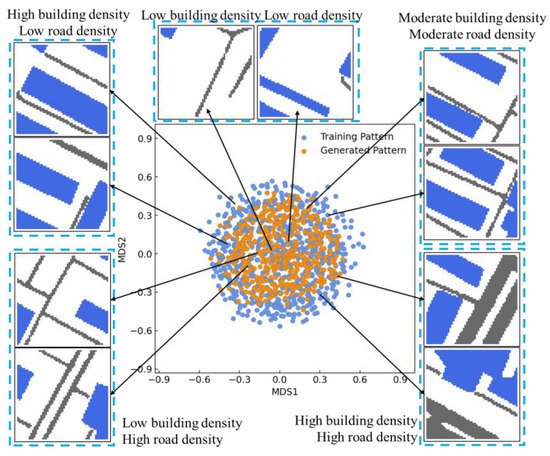
Figure 7.
Multidimensional scaling result on the urban fabric images.
3.4. Building Arrangement Evaluation in the Context of Wind Environment
In this section, we focus on the wind environment in the research area. Prior to simulating the air circulation, it is necessary to convert 2D fabric images into 3D building models. Therefore, we specified the height of each building. As Figure 8a,c display, the present heights in Xujiazhuang were measured by practical observation. Next, we carefully specified the building height based on our fabric image. According to the construction regulation and residential demands, we defined the building height in our design. We chose 3 m as the standard height of a floor. Figure 8b,d exhibit 3D models in our planning design. The heights of the buildings which are close to the street range from 21 to 84 m. The number of floors for most residential buildings is six or seven. Compared with Figure 8c, the average building height is increased in Figure 8d.
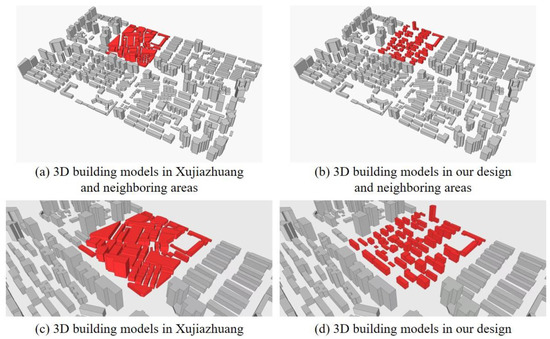
Figure 8.
Three-dimensional (3D) building models in Xujiazhuang and our design.
Based on 3D models, we performed CFD simulations. Section 2.2.2 discusses the technical details. Figure 9 presents the computation result. Apparently, the yellow and green areas imply that the air circulation is accelerated by the proposed method. The probability distributions of wind speed are shown in Figure 10. As discussed in Section 2.2.2, 1 m/s was employed as the threshold to define the calm wind area. Therefore, the percentage of calm wind areas decreases from 97% to 89%. Moreover, the percentage of areas whose speed is lower than 0.5 m/s decreases from 74% to 59%. Table 2 provides the statistics of the wind speed. The average wind speed rises from 0.36 m/s to 0.49 m/s. The reduction of low-speed wind area and the increase of wind speed play a key role in mitigating the urban microclimate problem.
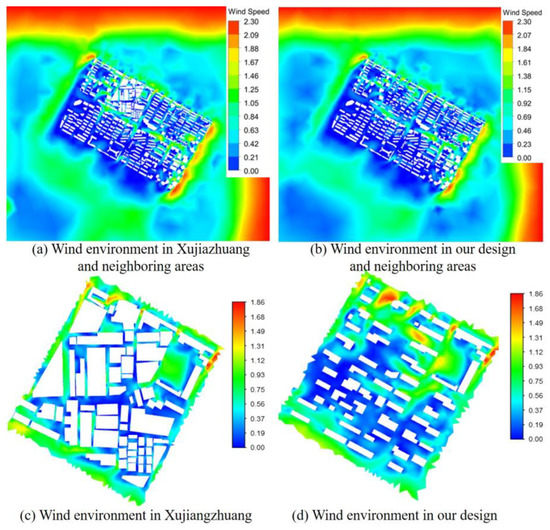
Figure 9.
Wind environment simulation by CFD.
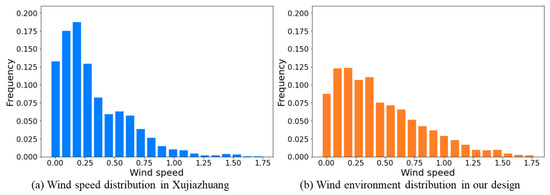
Figure 10.
Wind speed distributions in Xujiazhuang and our design.
Table 2.
Statistics of wind speed in Xujiazhuang and our design.
The main reason for a desirable wind environment embodies two aspects. First, the building density dramatically decreases in our design. The machine learning program controls the building density to 27.88%. By comparison, buildings account for 53.55% of Xujiazhuang. An increasing volume of open space has a positive effect on air flow. Second, there are low-density areas on the north side of our design. The building space provides an effective ventilation entrance and corridor. This structure is helpful to guide airflow and improve diffusion efficiency.
Although the new building arrangement alleviates the wind environment, the target block has calm wind areas in our design. There are three causes: (1) The average wind speed in Xi’an is relatively slow. A wind of 2.3 m/s is not sufficient to produce powerful ventilation; (2) The building direction is not consistent with the prevailing wind direction. Based on the record in Section 2.1, the most frequent wind direction in Xi’an is northeast. However, the buildings are generally oriented east–west in order to supply daylight and air to the inhabitants; (3) Aiming at satisfying the residential demand, we increased the building height and decreased the density. Multiple tall buildings have a negative impact on air circulation.
4. Urban Renovation Design Proposal
The core contribution of this paper is to apply machine learning programs to generate urban fabric images. The building density and arrangement were automatically determined by the computer program. In this section, we refined the urban renovation design proposal according to Figure 6h, Figure 8d and Figure 9d. There are three improvements. First, we focused on the building structure. An open ground-floor space was used to further facilitate air circulation. Second, we allocated the urban green space to alleviate the heat island effect and enhance pedestrian comfort. Third, water courses were designed to alleviate the thermal issue as well as provide the aesthetic landscape.
4.1. The Open Ground-Floor Space of the Individual Building
The open ground-floor space has recently become a prevalent concept in China. The enclosing walls are removed to facilitate ventilation and increase visibility. Moreover, the open ground floor provides an opportunity for social activity and exercise. In this work, we focused on the buildings in the calm wind area. As Figure 11a shows, the buildings associated with the open ground-floor space are emphasized by orange. The blue curves indicate the airflow. It is clear that the open ground-floor space provides a feasible way to enhance air circulation.
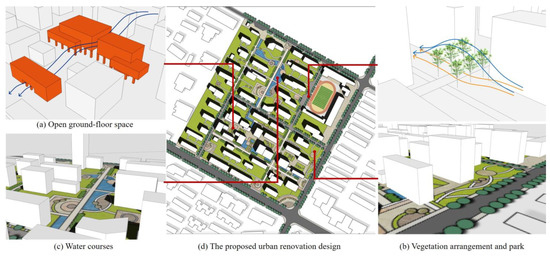
Figure 11.
The final urban renovation design proposal in the research area.
4.2. Green Space Planning and Vegetation Arrangement
Green space is essential for improving the urban microclimate. It can reduce air pollution, solve the heat island effect and reduce noise pollution. We planned the urban green space based on the urban fabric image in Figure 6h, 3D building models in Figure 8d and wind simulation in Figure 9d. Our design follows two main principles. At first, we plant grass and trees along the ventilation path. The streamlined pattern is designed to promote air circulation and control temperature. As shown in Figure 11b, the tree canopy plays a key role in enhancing pedestrian comfort. When the wind meets the canopy, it is partitioned into two streams on the windward side. The lower stream is helpful to speed up the airflow and reduce the apparent temperature.
The second principle in our proposal is to design parks in the open space. As Figure 11b exhibits, two community parks are located on the north and east sides of our design. In the north park, the pedestrian path agrees with the prevailing wind direction. In contrast, the east park provides adequate exercise facilities.
4.3. Water Courses and Landscapes
Water courses are an integral part of the modern city because they not only support the urban cooling system but also enhance the aesthetic value. In our proposal, a waterway runs through from the north side to the east side. The water course is highlighted in blue in Figure 11c. It has various shapes to connect with the park, squares, buildings and roads. A range of landscapes are built. In the north side of our design, the water courses and park constitute a large outdoor space. The combination of park and waterway not only facilitates air circulation but also satisfies the recreational and aesthetic requirement.
Based on the preceding designs, we propose a complete renovation design proposal. A group of design elements are carefully considered to meet the residents’ needs and alleviate the environmental problem. The final plan is summarized in Figure 11.
5. Conclusions
In this study, we proposed a machine learning-based framework to achieve an urban renovation design. There are two primary research objectives. On one hand, a three-step program is suggested to create new urban fabric images. Although there are many ways to draw fabric images, the core contribution of our method is to enable the computer program to automatically understand the spatial relationship between roads, buildings and open space. On the other hand, we achieved an urban renovation design in Xi’an, China. In particular, the urban microclimate and wind environment problems attracted our attention. Aiming at speeding up air circulation, the urban form was carefully upgraded in the research area.
There are three fundamental steps in the proposed method. First, we preprocessed the original urban fabric image. Region growing and k-means clustering were separately applied to detect roads and buildings. The program identified the example blocks according to the land use map. Second, the multiple-point statistics program was employed to understand the spatial relationship between roads, buildings and open space. The program reproduced suitable building arrangements in the target area. Third, we examined the morphological characteristics of the generated images. Hausdorff distance and multidimensional scaling were used to compare the training and generated images.
Our method was tested with a residential block in Xujiazhuang, Xi’an, China. Based on the neighboring areas, which are successfully modernized, the proposed program created new urban fabric images. Compared with the historical layout in Xujiazhuang, the building density and arrangements were substantially improved in our design proposal. A computational fluid dynamics program was conducted to simulate air circulation in the research area. The result indicates that the percentage of calm wind area is considerably reduced. Rising wind speed has a positive effect on air circulation and ventilation.
It is worth noting that the investigation in this work is an ongoing project. As mentioned in the introduction section, there are four research scales studying the effect of urban morphology on the wind environment. An applicable progression of this paper is to explore the urban renovation design at regional and urban scales. In the large-scale urban morphology study, there is a complicated relationship between human settlements and natural environment. A wide range of physical and social factors should be taken into account. Further research in the development of machine learning techniques would be of great help in understanding the spatial structure and characteristics of a metropolitan area, city, town and village.
Author Contributions
Conceptualization, C.Z. and C.L.; methodology, C.Z. and J.C.; Software C.L. and R.X.; validation, C.L. and J.Z.; writing-original draft preparation, C.Z. and C.L.; writing-review and editing, J.C. and J.Z. All authors have read and agreed to the published version of the manuscript.
Funding
This research was funded by Natural Science Foundation of Shaanxi Province, grant number 2022JQ-227, and Fundamental Research Funds for the Central Universities of China, grant number 300102341308.
Data Availability Statement
All data generated or analyzed during this study are included in this published article. The wind data of Xi’an is downloaded from https://rp5.ru (accessed on 7 February 2023). The satellite images and street view images of the study area are derived from Beidou, China (https://map.baidu.com (accessed on 7 February 2023)). The original image of urban texture comes from the platform shared by the China Urban Planning Industry Forum (http://www.caup.net/ (accessed on 7 February 2023)).
Conflicts of Interest
The authors declare no conflict of interest.
References
- Shen, J.; Gao, Z.; Ding, W.; Yu, Y. An investigation on the effect of street morphology to ambient air quality using six real-world cases. Atmos. Environ. 2017, 164, 85–101. [Google Scholar] [CrossRef]
- Sung, U.-J.; Eum, J.-H.; Son, J.-M.; Oh, J.-H. Planning Strategies of Wind Corridor Forests Utilizing the Properties of Cold Air. Land 2021, 10, 607. [Google Scholar] [CrossRef]
- Ng, E.; Yuan, C.; Chen, L.; Ren, C.; Fung, J.C.H. Improving the wind environment in high-density cities by understanding urban morphology and surface roughness: A study in Hong Kong. Landsc. Urban Plan. 2011, 101, 59–74. [Google Scholar] [CrossRef]
- Yang, J.; Wang, Y.; Xue, B.; Li, Y.; Xiao, X.; Xia, J.; He, B. Contribution of urban ventilation to the thermal environment and urban energy demand, Different climate background perspectives. Sci. Total Environ. 2021, 795, 148791. [Google Scholar] [CrossRef]
- Kalnay, E.; Cai, M. Impact of urbanization and land-use change on climate. Nature 2003, 423, 528–531. [Google Scholar] [CrossRef] [PubMed]
- He, B.; Ding, L.; Prasad, D. Enhancing urban ventilation performance through the development of precinct ventilation zones: A case study based on the Greater Sydney, Australia. Sustain. Cities Soc. 2019, 47, 101472. [Google Scholar] [CrossRef]
- Ren, C.; Yuan, C.; He, Z.; Ng, Y. A study of air path and its application in urban planning. Urban Plan. Forum 2014, 3, 52–60. (In Chinese) [Google Scholar]
- Rasouli, A.; Hangan, H.; Siddiqui, K. PIV measurements for a complex topographic terrain. J. Wind. Eng. Ind. Aerodyn. 2009, 97, 242–254. [Google Scholar] [CrossRef]
- Guo, F.; Zhang, H.; Fan, Y.; Zhu, P.; Wang, S.; Lu, X.; Jin, Y. Detection and evaluation of a ventilation path in a mountainous city for a sea breeze: The case of Dalian. Build. Environ. 2018, 145, 177–195. [Google Scholar] [CrossRef]
- Yuan, C. Urban Wind Environment; Springer: Singapore, 2018; pp. 43–51. [Google Scholar]
- Panagiotou, I.; Neophytou, M.; Hamlyn, D.; Britter, R.E. City breathability as quantified by the exchange velocity and its spatial variation in real inhomogeneous urban geometries: An example from central London urban area. Sci. Total Environ. 2013, 442, 466–477. [Google Scholar] [CrossRef]
- Liu, D.; Zhou, S.; Wang, L.; Chi, Q.; Zhu, M.; Tang, W.; Zhao, X.; Xu, S.; Ye, S.; Lee, J.; et al. Research on the planning of an urban ventilation corridor based on the urban underlying surface taking Kaifeng city as an example. Land 2022, 11, 206. [Google Scholar] [CrossRef]
- Blocken, B. 50 years of computational wind engineering: Past, present and future. J. Wind. Eng. Ind. Aerodyn. 2014, 129, 69–102. [Google Scholar] [CrossRef]
- Tetsu, K.; Masao, M.; Yoshihide, T.; Mochida, A. Wind tunnel tests on the relationship between building density and pedestrian-level wind velocity: Development of guidelines for realizing acceptable wind environment in residential neighborhoods. Build. Environ. 2008, 43, 1699–1708. [Google Scholar]
- Hong, B.; Lin, B. Numerical studies of the outdoor wind environment and thermal comfort at pedestrian Level in housing blocks with different building layout patterns and trees arrangement. Renew. Energy 2015, 73, 18–27. [Google Scholar] [CrossRef]
- Weerasuriya, A.U.; Tse, K.T.; Zhang, X.; Kwob, K.C.S. Integrating twisted wind profiles to air ventilation assessment (AVA): The current status. Build. Environ 2018, 135, 297–307. [Google Scholar] [CrossRef]
- Du, Y.; Mak, C.M. Improving pedestrian level low wind velocity environment in high-density cities: A general framework and case study. Sustain. Cities Soc. 2018, 42, 314–324. [Google Scholar] [CrossRef] [PubMed]
- Zhu, L.; Ranasinghe, D.; Chamecki, M.; Brown, M.J.; Paulson, S.E. Clean air in cities: Impact of the layout of buildings in urban areas on pedestrian exposure to ultrafine particles from traffic. Atmos. Environ. 2021, 252, 118267. [Google Scholar] [CrossRef]
- Yuan, C.; Ng, E. Practical application of CFD on environmentally sensitive architectural design at high density cities: A case study in Hong Kong. Urban Clim. 2014, 8, 57–77. [Google Scholar] [CrossRef]
- Tsang, C.W.; Kwok, K.C.S.; Hitchcock, P.A. Wind tunnel study of pedestrian level wind environment around tall buildings: Effects of building dimensions, separation and podium. Build. Environ. 2012, 49, 167–181. [Google Scholar] [CrossRef]
- Hang, J.; Wang, Q.; Chen, X.; Sandberg, M.; Zhu, W.; Buccolieri, R.; Sabatino, S.D. City breathability in medium density urban-like geometries evaluated through the pollutant transport rate and the net escape velocity. Build. Environ. 2015, 94, 166–182. [Google Scholar] [CrossRef]
- Allam, Z.; Dhunny, Z.A. On Big Data, artificial intelligence and smart cities. Cities 2019, 89, 80–91. [Google Scholar] [CrossRef]
- Kamrowska-Załuska, D. Impact of AI-based tools and urban big data analytics on the design and planning of cities. Land 2021, 10, 1209. [Google Scholar] [CrossRef]
- Koutra, S.; Ioakimidis, C.S. Unveiling the Potential of Machine Learning Applications in Urban Planning Challenges. Land 2023, 12, 83. [Google Scholar] [CrossRef]
- Ibrahim, M.R.; Haworth, J.; Cheng, T. URBAN-i: From urban scenes to mapping slums, transport modes, and pedestrians in cities using deep learning and computer vision. Environ. Plan. B Urban Anal. City Sci. 2021, 48, 76–93. [Google Scholar] [CrossRef]
- Abarca-Alvarez, F.J.; Campos-Sanchez, F.S.; Osuna-Perez, F. Urban Shape and Built Density Metrics through the Analysis of European Urban Fabrics Using Artificial Intelligence. Sustainability 2019, 11, 6622. [Google Scholar] [CrossRef]
- Li, X.J.; Cai, B.Y.; Ratti, C. Using street-level images and deep learning for urban landscape studies. Landsc. Archit. Front. 2018, 6, 20–29. [Google Scholar] [CrossRef]
- Fedorova, S. Generative adversarial networks for urban block design. arXiv 2021, arXiv:2105.01772. [Google Scholar]
- Wu, A.N.; Stouffs, R.; Biljecki, F. Generative adversarial networks in the built environment: A comprehensive review of the application of GANs across data types and scales. Build. Environ. 2022, 223, 109477. [Google Scholar] [CrossRef]
- Gonzalez, R.; Woods, R. Digital Image Processing, 4th ed.; Pearson: New York, NY, USA, 2017; pp. 826–858. [Google Scholar]
- Bishop, C. Pattern Recognition and Machine Learning; Springer: New York, NY, USA, 2006; pp. 423–429. [Google Scholar]
- Zuo, C.; Yin, Z.; Pan, Z.; MacKie, E.J.; Caers, J. A tree-based direct sampling method for stochastic surface and subsurface hydrological modeling. Water Resour. Res. 2020, 56, e2019WR026130. [Google Scholar] [CrossRef]
- Scheidt, C.; Fernandes, A.M.; Paola, C.; Caers, J. Quantifying natural delta variability using a multiple-point geostatistics prior uncertainty model. J. Geophys. Res. Earth Surf. 2016, 121, 1800–1818. [Google Scholar] [CrossRef]
- Ye, Z.; Chen, Y. Wind environment oriented urban block spatial design—Aa case study of CAUP are, Tongji University. In Proceedings of the 5th Conference on Urban Development and Planning, Qinhuangdao, China, 22–23 June 2010; pp. 294–298. [Google Scholar]


Disclaimer/Publisher’s Note: The statements, opinions and data contained in all publications are solely those of the individual author(s) and contributor(s) and not of MDPI and/or the editor(s). MDPI and/or the editor(s) disclaim responsibility for any injury to people or property resulting from any ideas, methods, instructions or products referred to in the content. |
© 2023 by the authors. Licensee MDPI, Basel, Switzerland. This article is an open access article distributed under the terms and conditions of the Creative Commons Attribution (CC BY) license (https://creativecommons.org/licenses/by/4.0/).