Article

Urban Grassland Afforestation as a Public Land Management Tool for Environmental Improvement: The Example of Krakow (Poland)

by
Miłosz Podwika
,
Krystyna Ciarkowska
* and
Katarzyna Solek-Podwika
Soil Science and Agrophysics Department, University of Agriculture in Krakow, Aleja Mickiewicza 21, 31-120 Krakow, Poland
*
Author to whom correspondence should be addressed.
Land 2023, 12(5), 1042; https://doi.org/10.3390/land12051042
Submission received: 6 April 2023 / Revised: 5 May 2023 / Accepted: 10 May 2023 / Published: 10 May 2023

Abstract

:
Afforestation can play a significant role in greenhouse gas emission reduction through increased carbon (C) sequestration in the biomass and soil. However, its environmental effects, especially through changes in soil characteristics as a result of afforestation, are still poorly understood. In this work, we studied the response of grassland soils derived from two different parent materials to afforestation. We measured the basic soil properties, including pH, C accumulation, nutrient contents and enzyme activity, in soils from grasslands and mature forests. We focused on the parameters associated with organic matter and the changes resulting from afforestation. We established that in the humus layers, habitat played a more important role in creating the soil properties, including organic-C accumulation, than land use (forest vs. grassland). We created models to explain the C storage in the soils, which indicated the substantial role of certain conditions in promoting the stabilisation of the organic matter, such as pH, and the amount of clay, humines and residue. We determined negative changes in the soil properties when compared with grassland and forest soils, but we found increased C storage, which counteracts the increased emission of carbon dioxide into the atmosphere. The results of our work may be of use for afforestation planners and urban managers.

1. Introduction

The UN Food and Agriculture Organization (FAO) defines afforestation as either the establishment of forests on historically treeless areas or on land cleared of native forests for at least 50 years [1]. Forests are essential for our health and wellbeing, and the health of the planet. They are rich in biodiversity and are hugely important in the fight against climate change. The afforestation strategy contributes to achieving the EU’s biodiversity objectives, as well as the greenhouse gas emissions reduction target of at least 55% by 2030, and climate neutrality by 2050 [2].
The effects of afforestation depend on geographical latitude and local conditions. In African countries (e.g., Nigeria), the shift from savannah to forest can be successful as far as the mitigation of climate change is concerned, but only when the forests are restored, and not when new tree plantations are introduced. In the latter case, because forests absorb more incoming radiation than grasslands, the trees can cause warming rather than cooling. The afforestation of savannahs can also create problems with the water supply for local people in dry seasons, because trees take up much more water than grasses [3]. A study on the effects of the afforestation of grasslands in the Southern Hemisphere (e.g., Argentina), and specifically on the hydrological cycle, indicated that changes in the local climate could occur as a result of the high water loss from tree plantations from evaporation [4].
In the Northern Hemisphere, afforestation is considered to be one the prominent ways to contribute to preserving the environment; in addition, it creates opportunities for new types of activities, such as recreation and tourism. In the past, afforestation has mainly been aimed at increasing wood production, whereas nowadays, it is expected to play a substantial role in reducing greenhouse gas emissions through increased carbon (C) sequestration in the woody biomass via plant photosynthesis, and in the soil organic matter via humification [5,6].
C input can differ significantly between the grassland and forest ecosystems, with the residual organic C in the mineral soil decreasing in the early stages of forest stand development due to there being little production of litterfall or root debris [7,8]. Therefore, it is essential to evaluate whether investment in afforestation will lead to the desired environmental effects, because these can differ depending on the size and structure of the forest, the soil type, the selection of different tree species, and the future management, which itself depends on the species, site conditions, disturbance regime and functions. For this reason, an accurate assessment of changes in the soil following afforestation should be viewed as a major factor in afforestation planning [7,9,10,11].
Within the boundaries of cities, forests are often planted for their recreational functions, and their management is aimed at preserving the sustainability of the stands, with timber harvesting being of marginal importance [12]. While urban forests are made as accessible as possible to the city’s residents, in economic terms, they offer a rare opportunity to store C in an urban setting, while improving the ecological functions of the urban area, enabling the city to make greater use of natural ecosystem services, such as the biodegradation of pollutants, reduced runoff, and mitigation of the effects of climate change, thereby improving the quality of life of the city’s residents. Although increases in afforestation in cities are still being promoted, there are concerns that urban soil and environmental conditions may limit the success of afforestation in these areas [13].
To date, although the effects of afforestation on ecosystem properties have been well documented, the conclusions of authors have been ambiguous. Some authors have emphasised the beneficial role of planted forests in terms of C storage [8,14,15], nutrient dynamics [1,6,16,17,18] and enzyme activity [10,19,20], whereas others have indicated a decrease in C stocks [14], increased soil acidification, nutrient depletion, and a decrease in the C ratio in humic and fulvic acids, and thus lower humus stabilisation after the land-use change [12,21]. Other authors have reported no significant changes in soil properties as the result of grassland afforestation [21,22,23,24].
There is still a lack of comprehensive information regarding the main factors affecting the trajectories of changes resulting from urban grassland afforestation under Central European climatic conditions. To fill this gap, we aimed to (i) compare selected properties of grasslands and mature forests in the same areas; (ii) establish the main factors affecting the properties of urban soils under grassland and forest from two different habitats; and (iii) evaluate which soil properties determined the accumulation of C in the forest soils. By realising these aims, we planned to also check the working hypothesis that assumed that the soil properties of both the grassland and mature forest were more related to the habitats than to the change in use.

2. Materials and Methods
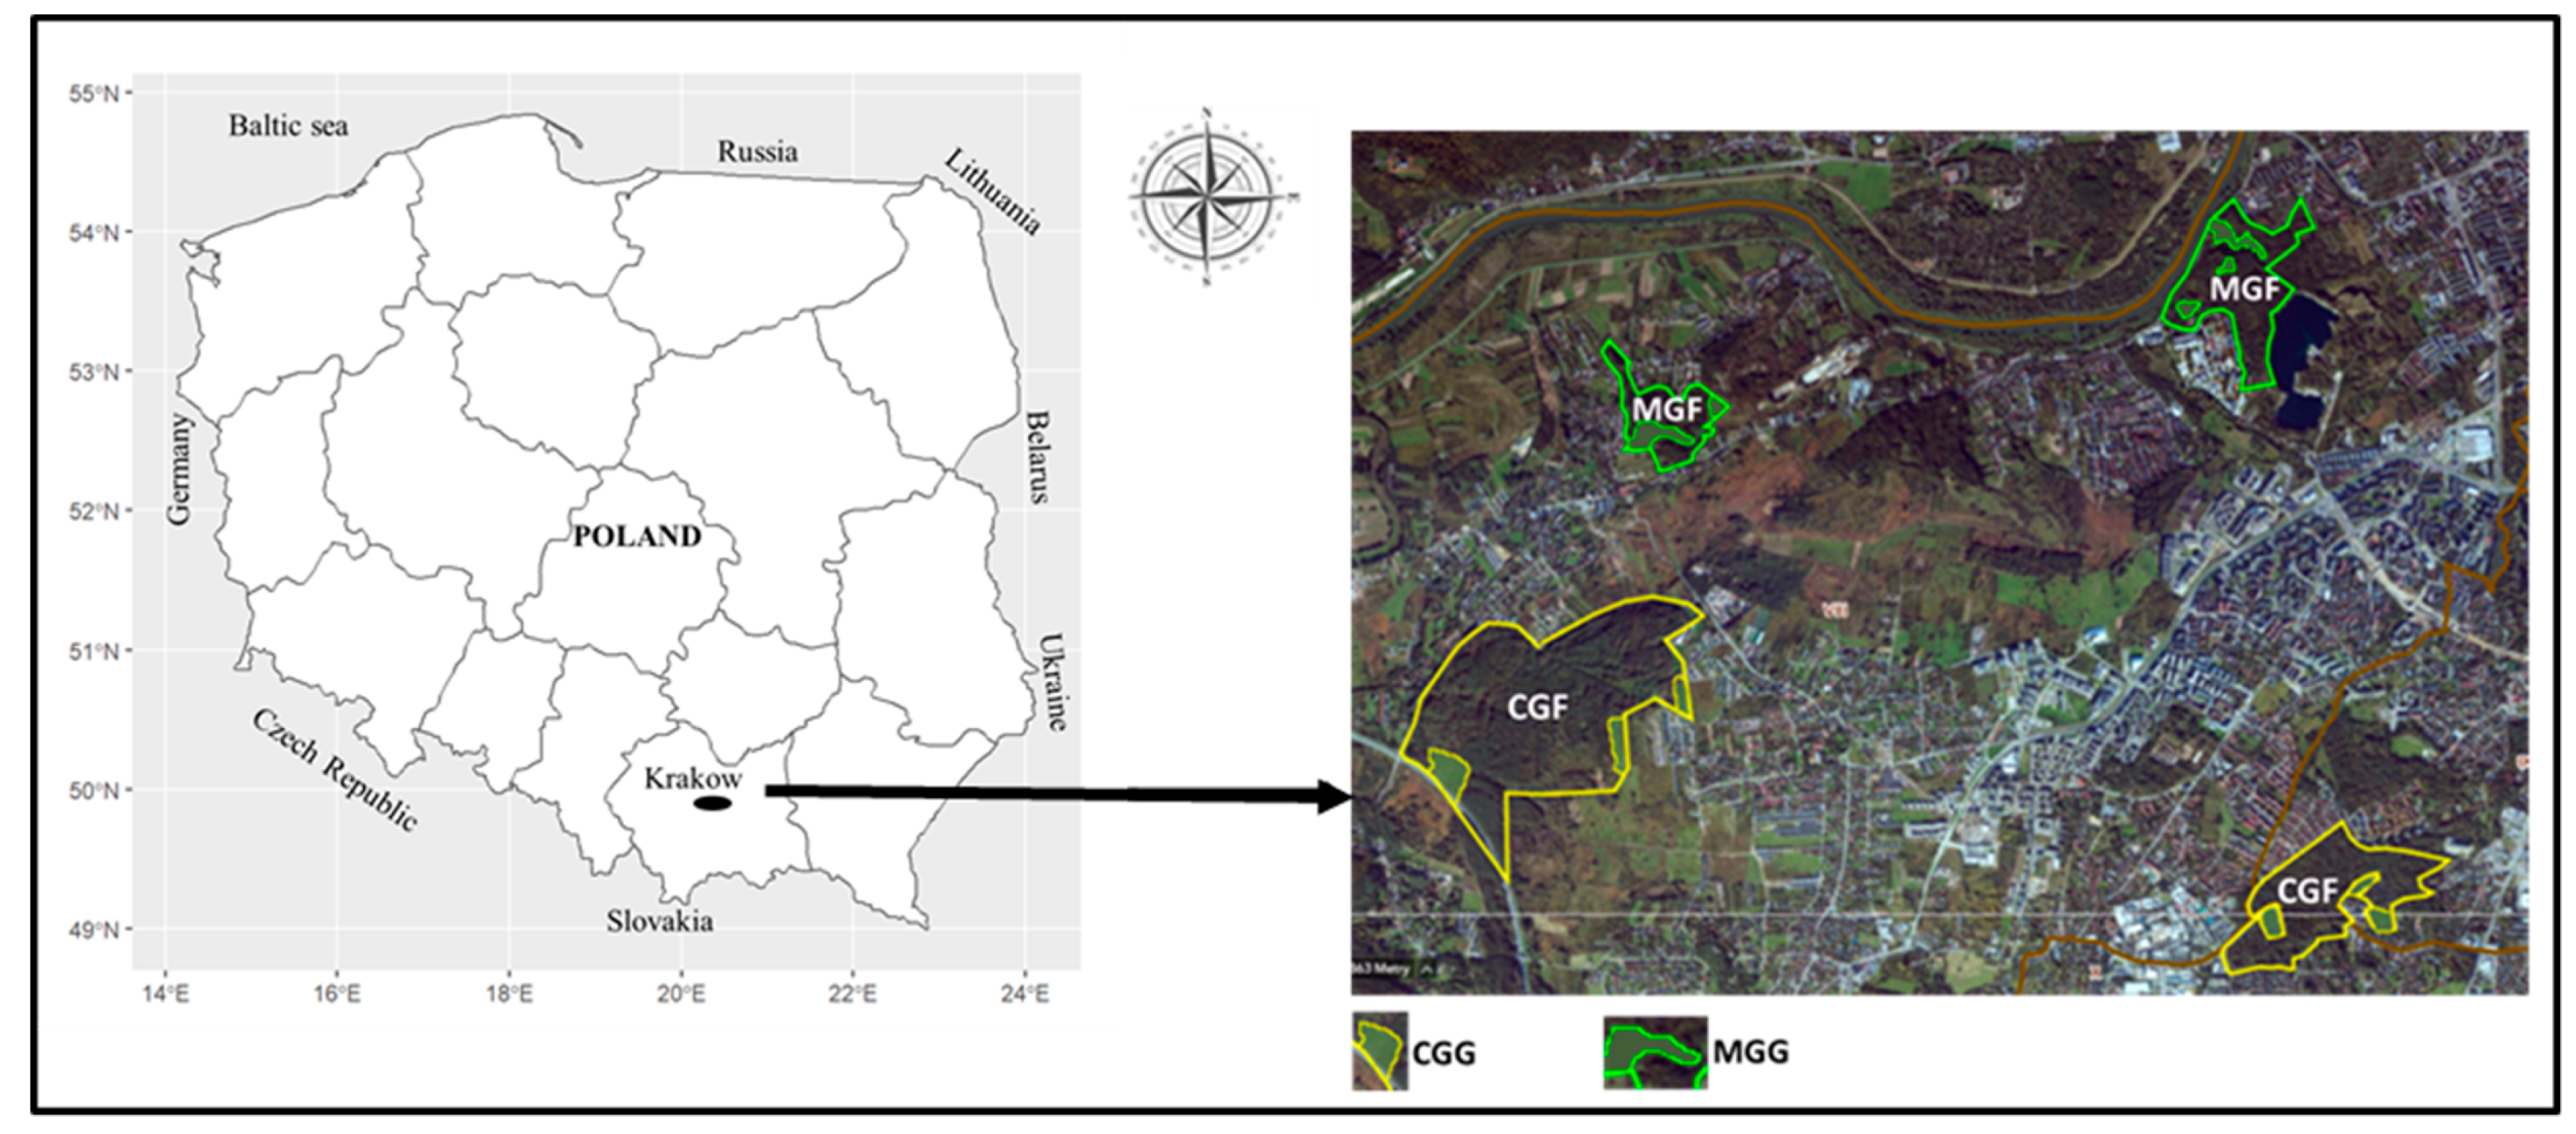
2.1. Study Area

The study area was located within the borders of Krakow, the second largest city in Poland, which covers an area of about 327 km2, and lies in the southern part of the country (50°03′ N, 19°56′ E). The average annual temperature in Krakow is about 9 °C, and the total annual precipitation amounts to 650 mm.
For the study, four stands were selected: two adjacent stands with coarsely textured soils, one covered with mixed forest (coarsely grained forest [CGF] soil) and the other with grassland (coarsely grained grassland [CGG] soil), as well as two neighbouring stands with medium-textured soils, one with mixed forest cover (medium-grained forest [MGF] soil) and the other used as grassland (medium-grained grassland [MGG] soil) (Figure 1). The differences in texture resulted from the different types of bedrock. The bedrock of the CGF and CGG stands were fluvioglacial sands deposited on Miocene clays, whereas the soils of the MGF and MGG stands derived from Jurassic limestone with an admixture of fluvioglacial sands. The afforestation of both areas was performed between 45 and 60 years ago. It was carried out in order to implement a government program aimed at increasing Poland’s forest cover to 30% of the country’s surface. The composition of the trees in both afforested areas was similar, with the dominant species being Quercus robur L., Pinus sylvestris L., Betula pendula Roth, Pinus nigra Arn., Acer pseudoplatanus L. and Acer platanoides L. The grassland vegetation communities of the coarse and medium-textured soils belonged to the class Molinio–Arrhenatheretea.

2.2. Sampling

In each of the four studied stands (CGF, CGG, MGF and MGG), we selected three areas of around 25 m2 each. Sampling was performed using an incremental methodology in order to obtain three composite samples, made out of nine subsamples, which were representative of the selected areas. In this way, we sampled the top (0–10 cm) and lower parts (10–30 cm) of the humus horizons, which gave us 18 samples from each stand (nine for each horizon), and thus a total number of 72 samples.

2.3. Methods

2.3.1. Field and Laboratory Analyses

In the field, when taking the samples, we recorded their colour based on Munsell chart. In the laboratory, the samples were divided into two parts. One was kept under natural humidity conditions in the fridge at 4 °C for two weeks prior to enzyme analysis, while the other part was air-dried. The air-dried soil was passed through a 2 mm sieve, and the following analyses were performed: soil texture, based on World Reference Base recommendations [25]; pH, potentiometrically in distilled water with a soil/water ratio of 1:2.5; basic cations (BCs) (calcium [Ca2+], magnesium [Mg2+], sodium [Na+] and potassium [K+]), measured after extraction in 1 mol dm−3 ammonium acetate (NH4OAc) and summed; and dehydrogenase activity (DHA), measured according to Cassida et al. [26], using 2,3,5-triphenyltetrazolium chloride, which after incubation at 37 °C for 24 h, was reduced to triphenyl formazan, which was extracted with methanol and assayed colorimetrically using a Beckman DU600 spectrophotometer at a wavelength of 450 nm. Available forms of phosphorus (P) and potassium (K) were obtained after extraction of the soil using a 0.03 m acetic acid (CH3-COOH) buffered solution (Egner and Riehm method), and the available Mg was extracted using a 0.02 m calcium chloride (CaCl2) solution based on the Schatschabel method [27]. All BCs and available P, K and Mg were measured using inductively coupled plasma atomic emission spectrometry (ICP-OES JY 238 ULTRACE). The organic C and total nitrogen (N) were estimated through dry combustion, using a LECO CNS-2000 analyser for simultaneously measuring the C, N and sulphur (S) in soil [28]. The soil organic matter (SOM) parameters, such as the residue (R), fulvic (FAs), humic acids (HAs), and humines (i.e., the insoluble fraction of humic substances), were measured after the organic matter was divided into fractions. First, the SOM was separated into fractions based on density, and using sodium iodide (NaI), with below 1.8 g cm−3 being defined as the R and above 1.8 g cm−3 being the heavy fraction [29]. The HAs and FAs were isolated from the dense fraction based on differences in their solubility, using 1 M sodium hydroxide (NaOH) as the extractant based on the recommendation of the International Humic Substance Society [30]. The Hus remained as non-extracted residues. The C content in all the fractions was determined via the Walkley–Black wet combustion method [31].

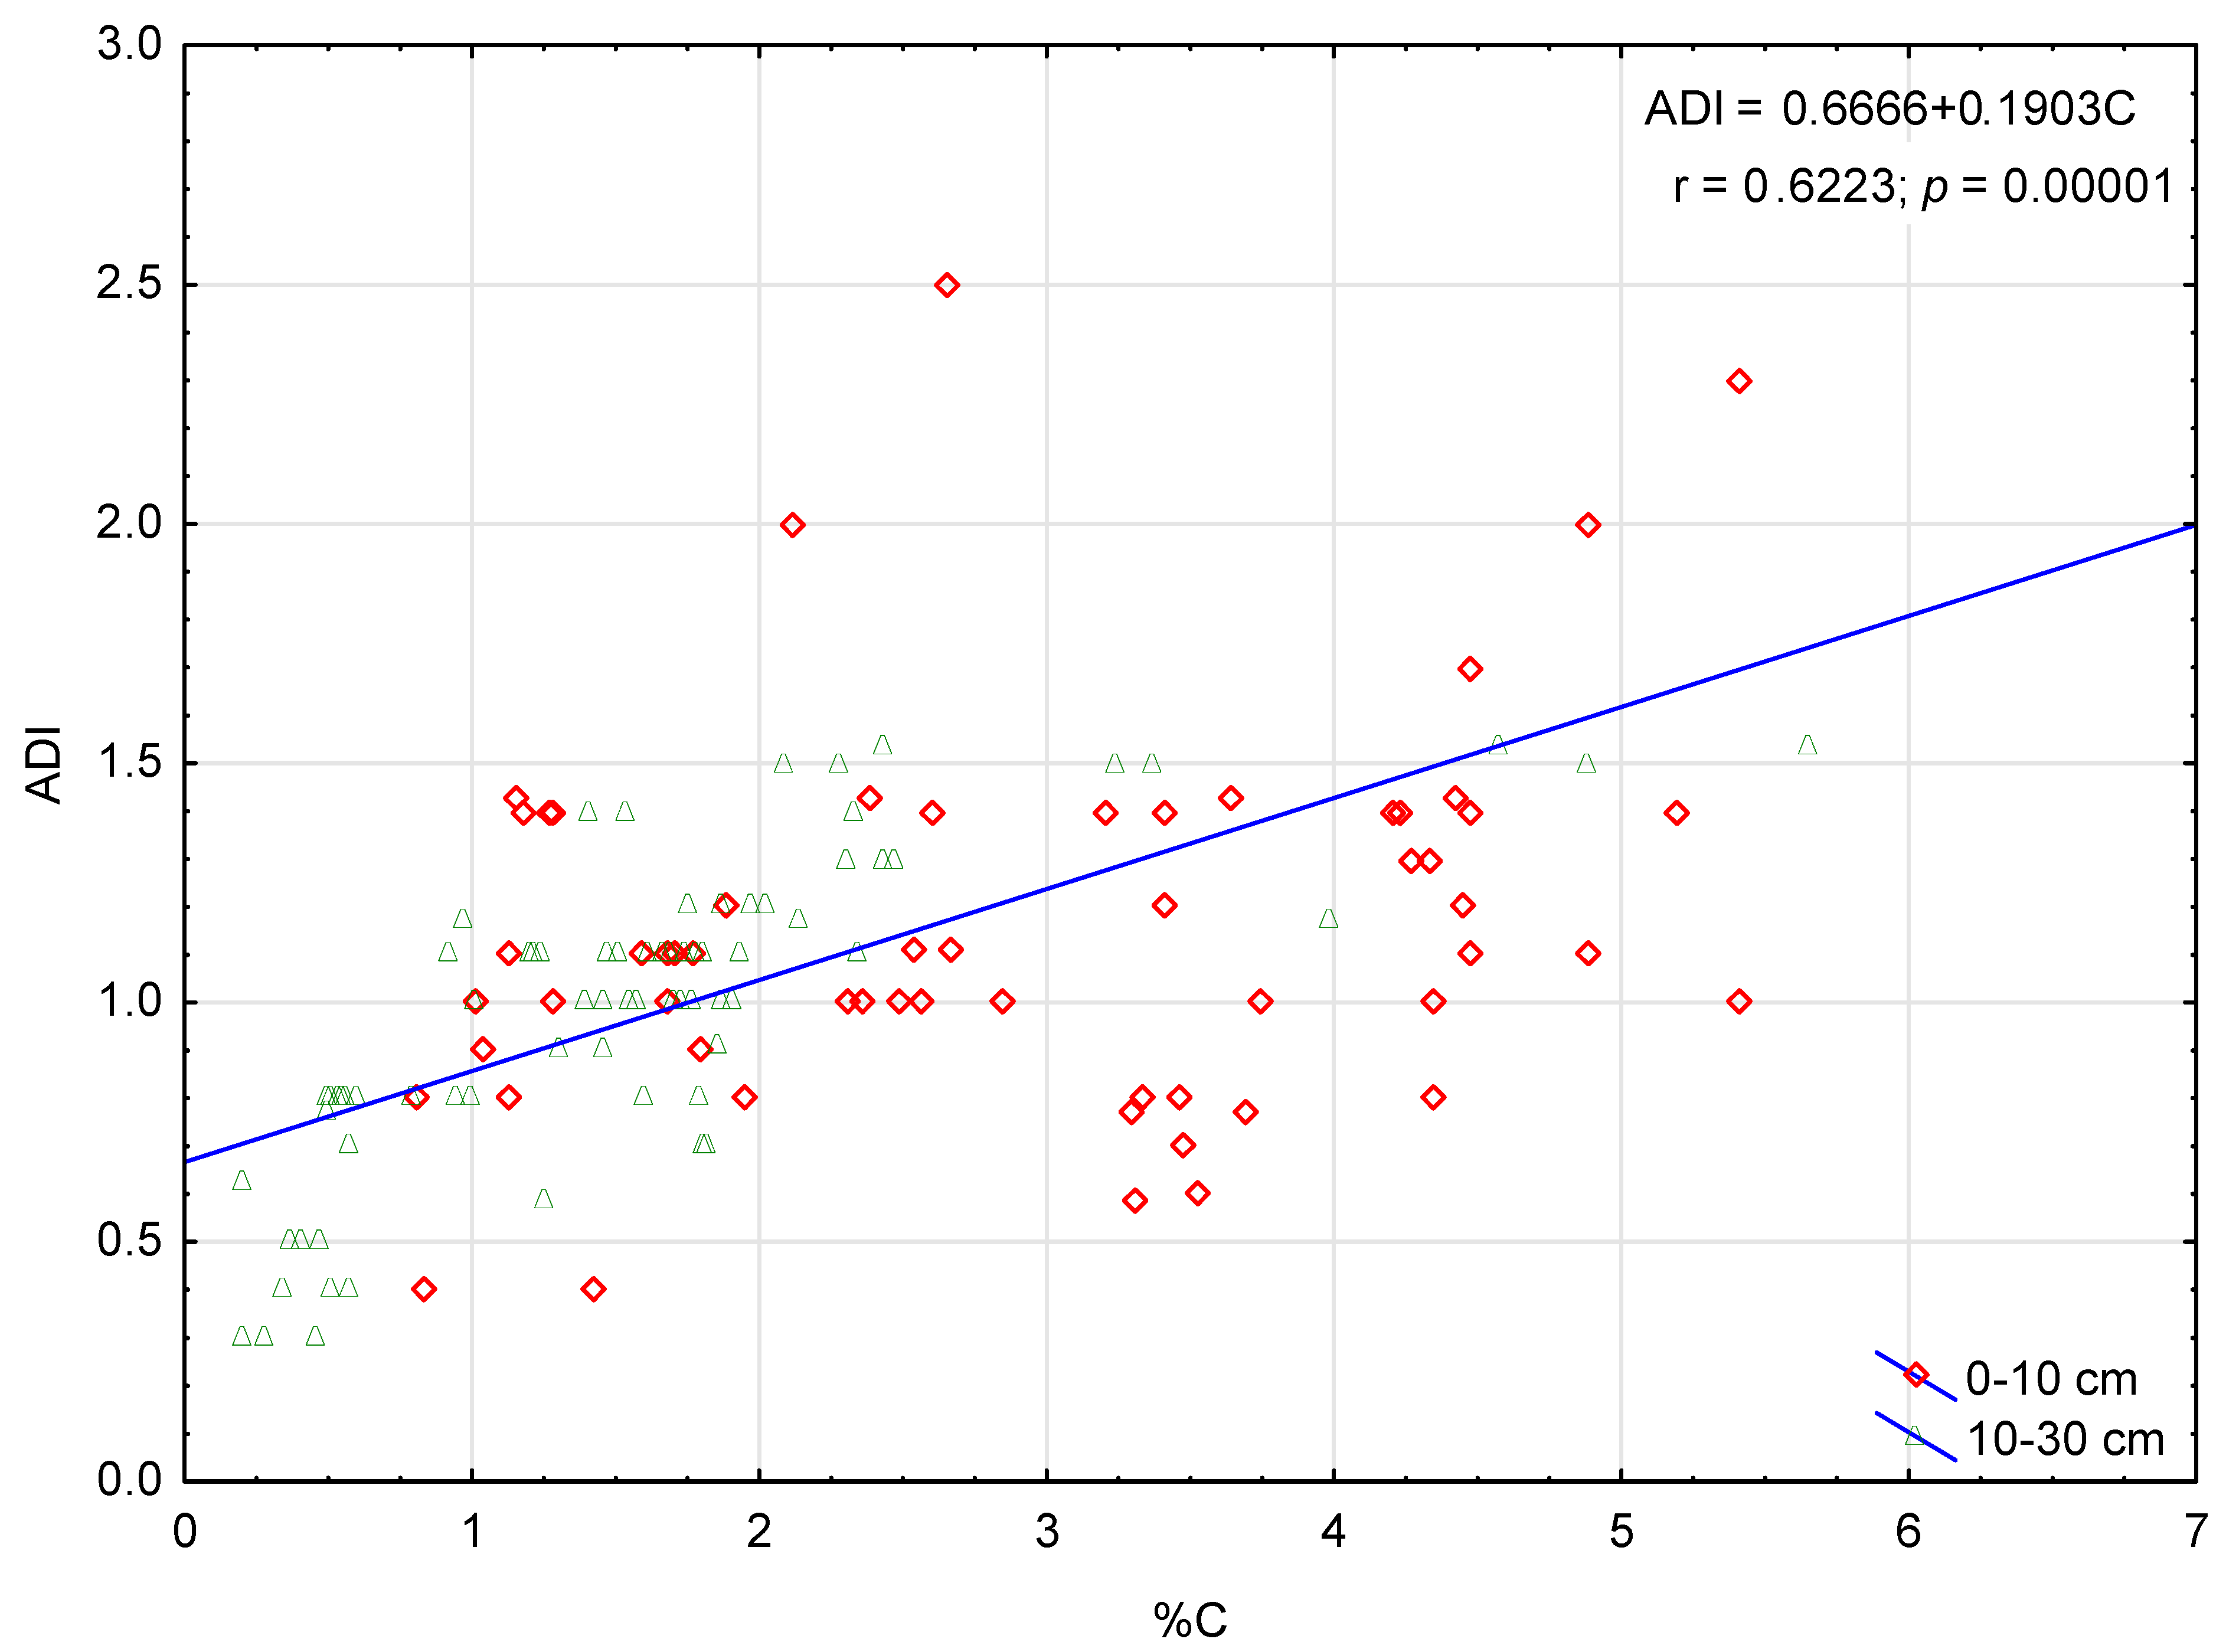
2.3.2. Statistical Methods and A Horizon Development Index Calculation (ADI)

Descriptive statistics, including the minimum, maximum, mean and standard deviation, were calculated. A one-way variance analysis with a Bonferroni correction post hoc (at α = 0.05) was used to estimate the least significant differences between the mean values of homogenous groups. In order to meet the principles of the analysis of variance (additivity, homogeneity of variance and normality of distribution), the data were subjected to logarithmic transformation prior to the analysis. A principal component analysis (PCA) and multivariate backwards regression analysis were employed to find a model that contained only the variables that best explained the C accumulation. The analyses were performed using Statistica v.13 [32] and Canoco 5.1 [33] software.
Based on the soil colour determined in the field, we calculated the values of the soil humus horizon (A horizon) index, according to Equation (1):
ADI = h o r i z o n   t h i c k n e s s V × C + 1
where V stands for value, and C stands for color chroma according to the Munsell chart [34].

3. Results

3.1. Basic Properties of Soils of Studied Stands

Both coarsely textured soils (CGF and CGG) had higher amounts of sand (80–98%) and lower amounts of clay (1–11%) than the medium-textured soils, where the amounts of sand and clay were in the range of 45–77% and 10–33%, respectively (Table 1). In the 0–10 cm horizons, the soil reaction varied from acidic to slightly acidic, ranging from 4.61 in the CGF soil to 6.89 in the MGG soil. Generally, lower pH values were observed in the coarsely textured soils than in the medium-textured soils, and among soils of the same texture, the pH values were lower in the forest soils (4.6 in CGF and 5.8 in CGG soils) than in the grassland soils (6.2 and 6.9 in the MGF and MGG soils, respectively). In the 10–30 cm horizon, the pH values were similar in all the soils (6.3–6.8) apart from the CGF soil, which had a mean pH value of 4.9. The sum of the BCs reflected the pH distributions, being the lowest in the CGF soil and the highest in the MGG soil in both studied horizons.
The DHA depended on the soil texture, being lower in the coarse- than in the medium-textured soils in both horizons. The amounts of available P fluctuated in both horizons across a wide range in soils within a single stand, with no significant changes between the soils of different stands, while the amounts of available K were usually higher in the soils from the grasslands than the forests, independent of texture. In the 0–10 cm horizons, the amounts of available Mg depended on the soil texture, being higher in the MGF and MGG soils (65.9 and 120 mg kg−1, respectively) than in the CGF (13.3 mg kg−1) or CGG (22.2 mg kg−1) soils. In the 10–30 cm horizon, a similar distribution of available Mg was observed among the soils, although in lower amounts.

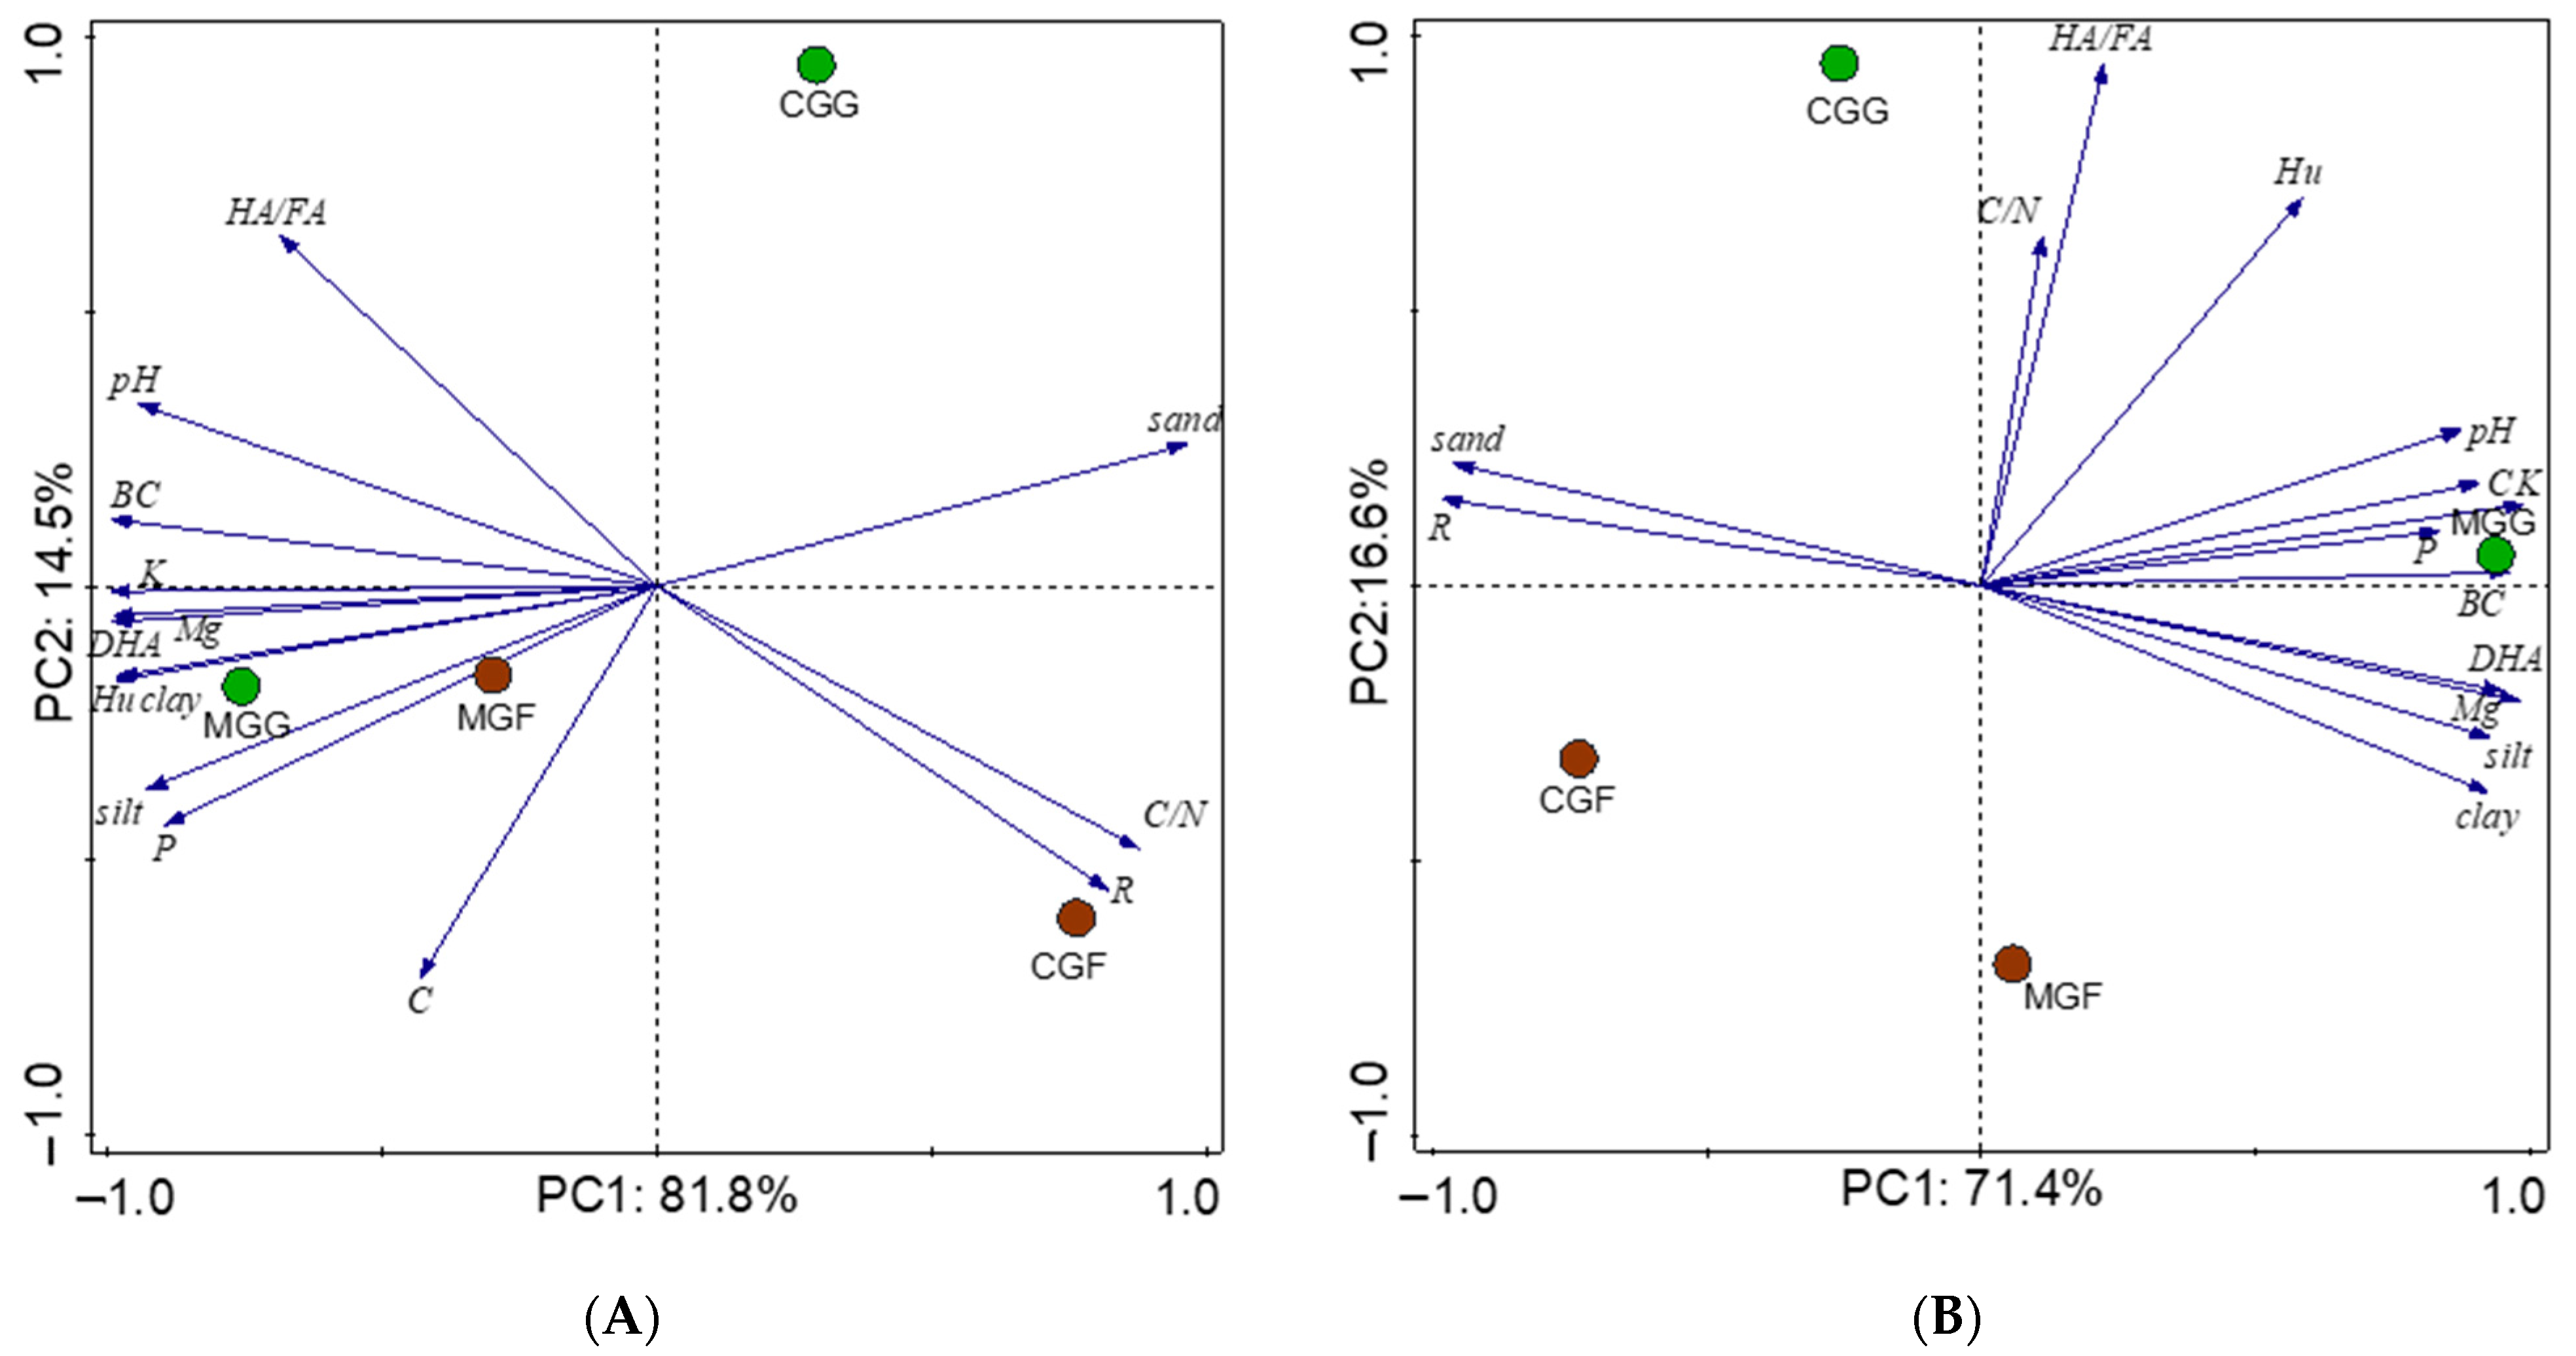
3.2. Results of the Principal Component Analysis

In both soil horizons (0–10 and 10–30 cm), the most important factor shaping the soil properties (Principal Component [PC]1) was the soil texture, despite its influence being much stronger in the upper part of the humus horizon (81.8% of the variance) than in the lower part (71.4% of the variance). With the heavier texture (medium-textured soils), besides silt and clay, there were strongly linked parameters, such as nutrients (BC, K, Mg, P), followed by higher pH, DHA and Hus, indicating the high stability of the SOM (Figure 2A,B), while in the coarse-textured soil, there were higher amounts of sand, and the SOM was less stabilised (higher R and C/N values).
The second factor (PC2) influencing the soil properties was of much lower significance. In the top horizons, it explained only 14.5% of the variance and, in the lower part of the humus horizons, it explained 16.6%. In both horizons, PC2 represented the differences resulting from the change in land use, separating the CGF and MGF soils from the MGG and CGG soils, as especially emphasised in the lower part of the humus horizons. Afforestation resulted in higher C accumulation in the soils, but lower C/N and HA/FA ratios compared to the grassland soils.

3.3. Soil Organic-Matter Parameters

The soil colour, determined under field humidity conditions, was darker in the top (0–10 cm) than in the lower (10–30 cm) horizons, independently of soil use and texture. This reflected a decrease in C content with soil depth. Within the same soil horizon, the colour differed more between soil texture than soil use at both soil depths. Generally, darker colours were found in the coarse-textured soils than the medium-textured soils when comparing soils from the same horizon. In the top part of the A horizons, the A-horizon development index (ADI) values were lower in the coarse-textured soils, varying from 0.93 (CGG) to 1.06 (CGF), than in the medium-textured soils, ranging from 1.41 (MGF) to 1.59 (MGG). In the subsequent horizon, the values were similarly lower in the coarse-textured than the medium-textured soils, at 0.73 (CGF) to 1.35 (MGG) (Table 2).
In the 0–10 cm horizons, the lowest amounts of C (1.79%, on average) were determined in the CGG soil, and the highest amounts (4.16%, on average) in the MGG soil, while in the 10–30 cm horizons, the amounts of C were similar in the CGF, CGG and MGF soils, being higher only in the MGG soil. The SOM properties, such as the amount of undecomposed components (R) and the HA/FA ratio, in the top horizons had higher values in the soils under forests than under grasslands, whereas the amounts of the most stable parts of the SOM, the Hus, were similar in the soils from all the stands, except for the MGG soil, which had the highest amount of Hus, at 0.99% (Table 2). The C/N ratio in this horizon was highest in the CGF soil (mean value = 13.0), falling to about 10 in the other soils. In the deeper horizon (10–30 cm), the features of the SOM differed, with the R being the highest in the MGG soil (0.47–3.3%), and the HA/FA and C/N ratios being lower under the forest stands than under the grasslands. The Hus increased from 0.11% in the CGF soil, through CGG and MGF, to 1.20% in the MGG soil (Table 2).

4. Discussion

4.1. Effect of Afforestation on Selected Basic Soil Properties

In the literature, soil properties such as pH, BC, nutrient availability and enzyme activity are often described as those that might be negatively affected by afforestation [1,16,24,35]. In fact, in our study, we observed a decrease in pH, the BC content and the available Mg, K and DHA as a result of afforestation, although there was an increase in the available P (albeit insignificant). Some chemical changes can be attributed to the enhanced mineralisation of nutrients associated with the SOM. A decrease in pH and BCs is a well-known effect of acid litter deposition on forest floors [16,36]. A decrease in DHA might result from both nutrient depletion and low pH values compared with the optimal conditions for microorganism activity. However, these negative changes are counteracted by the higher C storage in the SOM of forest soils than of grasslands. In this case, lower microbial activity in forest soils could potentially be considered an advantage, acting as a SOM protective agent, allowing for the increased storage of C in organic compounds. Our results are in line with observations on reforestation carried out in the USA, which indicated that reforesting lands occupying >500,000 km2 provided 10% of the US forest sector’s C sink and counterbalanced 1% of all US greenhouse gas emissions [5]. This is in contrast to results obtained in Nigeria, where the increase in soil C accumulation resulting from reforestation was only observed in the first few years, while the C storage diminished in soils under mature forests [3].

4.2. Role of Afforested Stands in C Accumulation and Soil Organic-Matter Stabilisation

We examined two different textures of soil, coarse and medium, from grasslands and mixed forest stands in order to determine the role of afforestation in C accumulation. It is generally understood that afforestation, after a certain time, usually results in higher C accumulation in the soil than in grassland soils [15,37]. The role of trees in this is related to the abundance of dead organic material being returned to the soil, the composition of root exudates, nutrient cycling and the conditions for humification [36]. It is also thought that the higher litter input and fine-root biomass partly contribute to the greater organic-C storage in forests [38]. Our study only partially confirmed these general observations. We observed higher accumulations of C in the top horizon of the coarse-textured forest soils than in the grassland soils, whereas the opposite was true in the medium-textured soils. Similarly, a study of two Norway spruce chronosequences on contrasting soils in Denmark found that sandy, nutrient-poor soils sequestered more C than more fertile and fine-textured soils, and so were more conducive to C sequestration in the Northern European region [39]. Multiple regression equations calculated for C storage have suggested that the main factors affecting this parameter allow for prediction of the capacity of the soil for C accumulation [40]. In the 0–10 cm horizons, the equations took the following forms:
CCGF = 6.189 + 1.180R + 1.537Hu + 1.397pH R2 = 0.987 p < 0.0001
(0.042) (0.000) (0.005) (0.029)
CMGF = −1.203 + 1.032HA/HF + 0.213clay + 0.011P + 2.349Hu − 0.110R R2 = 0.875 p < 0.0001
(0.031) (0.000) (0.000) (0.000) (0.000) (0.001)
The C accumulation in the coarse-textured afforested soil (CGF) was mainly affected by the SOM parameters Hus and Rs. The Hus are known to be the most stable part of SOM; thus, their presence was expected, while the importance of the inflow of fresh organic matter was represented by the R. The presence of pH in the equation is also not surprising, with the CGF soil being the most acidic among the studied soils, and any increase in the pH value being responsible for less leaching of humic substances from the soil. In forest soils, the amount and quality of the SOM modifies the soil acidity, but soil acidity can also affect the stability of organic matter, because the link between SOM and acidity operates in two directions. Any amount of SOM contributes to variations in the total acidity by providing exchange sites for protons, and/or the amount of soil acidity contributes to variations in the SOM through cation-bridging or other constraints on the microbial decomposition of the SOM [41]. These three parameters allowed for the prediction of high C accumulation because the corrected R2 was equal to 0.987 at p < 0.0001. The C storage in the medium-textured soil was affected by additional factors, some being the same as for the CGF soil, including SOM-related parameters, such as the HA/HF, Hus and R. However, the amount of clay and available P also affected C accumulation in the soils of this type. The presence of P and clay confirmed the general assumption that soils with finer textures have higher nutrient availability and build up the highest C stocks [39]. The amounts of available P did not differ significantly in our study, which was affected by a large standard deviation resulting from the wide dispersion of our results. However, insignificantly, the forest soils had higher mean values of P than the grassland soils in the 0–10 cm horizon. The increase in available P in the forest soils can be explained by various mechanisms, such as pumping from deeper to shallower horizons via root uptake, or by organic acids secreted by tree roots and their associated microorganisms (mycorrhizae), which can increase the availability of hardly soluble P minerals through a combination of lower pH and metal chelation [1,6].
In the 10–30 cm horizons, the amounts of C were similar, with higher amounts of C only determined in the medium-textured grassland soil, its amounts affected by the parameters described in the following equations:
CCGF = 0.840R + 0.035DHA + 2.027Hu R2 = 0.994 p < 0.0001
(0.840) (0.035) (0.903)
CMGG = 0.176BC + 1.585HA/FA + 1.164Hu R2 = 0.728 p < 0.001
(0.002) (0.001) (0.000)
Multiple regression analysis indicated that in the CGF soil, in addition to the SOM parameters (R, Hus), DHA played a substantial role in C accumulation. With the R being the first component of the equation with the highest coefficient, the microorganismal activity, expressed as DHA in this equation, was necessary for decomposing the fresh organic-matter residues. By considering these three components (R, Hus, DHA), the amount of C stored in the 10–30 cm horizon in the coarse-textured soil could be highly predicted, with the corrected R2 = 0.994 at p < 0.0001. The BCs appeared as a new component in the equation to explain the storage of C in the medium-textured forest soil, indicating the effect of BCs (mainly Ca) in the processes of SOM stabilisation through the formation of resistant aggregates [8]. Some authors, such as Mazurek et al. and Ciarkowska and Miechowka [34,41] found that the stabilisation of SOM in humus horizons can be described by the ADI. According to our ADI values, the SOM in the medium-textured soils was more stable, which is not surprising considering the higher pH values, and higher clay and nutrient contents. Higher values of ADI were calculated for the top part of the humus horizon in the CGF soil than for the CGG soil. This suggests that SOM stabilisation, which can be surprising and not coordinated with other SOM parameters, such as the C/N and HA/FA ratios and amounts of Hus, was significantly lower in the CGF than the CGM soil. This shows that the ADI relates more to C storage than SOM stabilisation [42], as proven in this study by a regression equation (ADI = 0.6666 + 0.1903C, r = 0.6223 at p = 0.00001), which indicated a positive relationship between the C content and the ADI value in the studied soils (Figure 3). The effect of plant cover on C storage and SOM stabilisation was highlighted by the results of the PCA. Soil use was the second factor found to shape the soil properties, but this was of low importance compared to the soil texture, with the effect of planting trees clearly resulting in the accumulation of greater amounts of SOM (albeit this was less stabilised than in the grassland soils). Such an effect can be explained by the greater mass of residues containing higher contents of slowly decomposable polymeric phenolic forms entering the soils in forests compared with grasslands. The influence of organic compounds characteristic of wood residues, such as lignin and condensed tannins, on SOM is described by the formation of humus with high R and C/N ratios and low HA/FA ratios [36].
According to a study conducted in central Spain, the storage and stability of SOM correlates with certain soil physical properties, such as porosity [40], indicating the importance of infiltration in C accumulation. Water–air soil properties were not included in our study, and the variables explaining C accumulation in the regression equations were selected from among the discussed soil properties, which were mainly of a chemical nature.

5. Conclusions

We examined differences in the properties of the top and subsequent parts of the humus horizons resulting from the afforestation of grasslands located within the borders of a city. We found that the soil cover from mature forest promoted positive (increased C accumulation) and negative (decreased nutrient contents, pH values and organic-matter stability) changes in the soil properties. The highest accumulation of organic C in the forests occurred in coarse-grained soil. By examining the main factors affecting the properties of soil humus horizons, we were able to confirm the hypothesis that assumed that the soil properties under both grasslands and forests would relate more to the habitats than to the shift in land use. However, because the effects of afforestation depend strongly on climate, soil type and forest management practices, we are aware that our results have limitations and should be treated as valid only for the study conditions.

Author Contributions

Conceptualization, K.C.; methodology, M.P. and K.S.-P.; validation, M.P., K.C. and K.S.-P.; investigation, M.P.; statistical elaboration K.C.; data curation, M.P.; writing—original draft preparation, M.P.; writing—review and editing, K.C.; supervision, K.S.-P.; funding acquisition, M.P. All authors have read and agreed to the published version of the manuscript.

Funding

This research received no external funding.

Data Availability Statement

The datasets are available from the corresponding author on request.

Conflicts of Interest

The authors declare no conflict of interest.

References

  1. Chen, L.F.; He, Z.-B.; Du, J.; Yang, J.-J.; Li, J. Impacts of afforestation on plant diversity, soil properties, and soil organic carbon storage in a semi-arid grassland of north western China. Catena 2016, 147, 300–307. [Google Scholar] [CrossRef]
  2. New EU Forest Strategy for 2030. Available online: https://environment.ec.europa.eu/strategy/forest-strategy_en (accessed on 30 March 2023).
  3. Ibrahim, K.M.; Muhammad, S.I. A review of afforestation efforts in Nigeria. Int. J. Adv. Res. Eng. Appl. Ascience 2016, 4, 24–37. Available online: https://www.researchgate.net/publication/291356792 (accessed on 3 April 2023).
  4. Nosetto, M.; Jobbagy, E.; Paruelo, J. Land-use change and water losses: The case of grassland afforestation across a soil textural gradient in central Argentina. Glob. Chang. Biol. 2005, 11, 1101–1117. [Google Scholar] [CrossRef]
  5. Navea, L.E.; Grant, M.; Domkec, G.M.; Hofmeistera, K.L.; Umakant Mishrae, U.; Perryc, C.H.; Waltersc, B.F.; Swanstonf, C.W. Refostation can sequster two petagrams of carbon in US topsoils in a century. Proc. Natl. Acad. Sci. USA 2018, 15, 2776–2781. [Google Scholar] [CrossRef]
  6. Chen, C.R.; Condron, L.M.; Xu, Z.H. Impacts of grassland afforestation with coniferous trees on soil phosphorus dynamics and associated microbial processes: A review. Forest Ecol. Manag. 2008, 255, 396–409. [Google Scholar] [CrossRef]
  7. Podwika, M.; Solek-Podwika, K.; Ciarkowska, K. Changes in the properties of grassland soils as a result of afforestation. iForest 2018, 11, 600–608. [Google Scholar] [CrossRef]
  8. Shi, S.-W.; Han, P.-F.; Zhang, P.; Ding, P.; Ma, C.-L. The Impact of Afforestation on Soil Organic Carbon Sequestration on the Qinghai Plateau, China. PLoS ONE 2015, 10, e0116591. [Google Scholar] [CrossRef]
  9. Hong, S.; Piao, S.; Chen, A.; Liu, Y.; Liu, L.; Peng, S.; Sardans, J.; Sun, Y.; Peñuelas, J.; Zeng, H. Afforestation neutralizes soil pH. Nat. Commun. 2018, 9, 520. [Google Scholar] [CrossRef]
  10. Podwika, M.; Solek-Podwika, K.; Kaleta, D.; Ciarkowska, K. The Effect of Land-Use Change on Urban Grassland Soil Quality (Southern Poland). J. Soil Sci. Plant Nutr. 2020, 20, 473–483. [Google Scholar] [CrossRef]
  11. Chirino-Valle, I.; Davis, M.R.; Condrom, L.M. Impact of different tree species on soil phosphorus immediately following grassland afforestation. J. Soil Sci. Plant Nutr. 2016, 16, 477–489. [Google Scholar] [CrossRef]
  12. An, J.; Chang, H.; Han, S.H.; Khamzina, A.; Son, Y. Changes in basic soil properties and enzyme activities along an afforestation series on the dry Aral Sea Bed, Kazakhstan. Forest Sci. Technol. 2020, 16, 26–31. [Google Scholar] [CrossRef]
  13. Downey, A.E.; Groffman, P.M.; Mejía, G.A.; Cook, E.M.; Sritrairat, S.; Karty, R.; Palmer, M.I.; McPhearson, T. Soil Carbon Sequestration in Urban Afforestation Sites in NewYork City. Urban For. Urban Green. 2021, 65, 127342. [Google Scholar] [CrossRef]
  14. Hong, S.; Guodong, H.; Yin, G.; Piao, S.; Dybzinski, R.; Cong, N.; Li, X.; Wang, K.; Peńuelas, J.; Zeng, H.; et al. Divergent responses of soil organic carbon to afforestation. Nat. Sustain. 2020, 3, 694–700. [Google Scholar] [CrossRef]
  15. Korkanç, S.Y. Effects of afforestation on soil organic carbon and other soil properties. Catena 2014, 123, 62–69. [Google Scholar] [CrossRef]
  16. Holubík, O.; Podrázský, V.; Vopravil, J.; Khel, T.; Remeš, J. Effect of agricultural lands afforestation and tree species composition on the soil reaction, total organic carbon and nitrogen content in the uppermost mineral soil profile. Soil Water Res. 2014, 9, 192–200. [Google Scholar] [CrossRef]
  17. Segura, C.; Jiménez, M.N.; Fernández-Ondoño, E.; Navarro, F.B. Effects of afforestation on plant diversity and soil quality in semiarid SE Spain. Forests 2021, 12, 1730. [Google Scholar] [CrossRef]
  18. Qiu, Z.; Shi, C.; Zhao, M.; Wang, K.; Zhang, M.; Wang, T.; Shi, F. Improving Effects of Afforestation with Different Forest Types on Soil Nutrients and Bacterial Community in Barren Hills of North China. Sustainability 2022, 14, 1202. [Google Scholar] [CrossRef]
  19. Oldfield, E.E.; Felson, A.J.; Wood, S.A.; Hallett, R.A.; Strickland, M.S.; Bradford, M.A. Positive effects of afforestation efforts on the health of urban soils. Forest Ecol. Manag. 2014, 313, 266–273. [Google Scholar] [CrossRef]
  20. Wang, K.; Zhang, Y.; Tang, Z.; Shangguand, Z.; Chang, F.; Jia, F.; Chen, Y.; He, X.; Shi, W.; Deng, L. Effects of grassland afforestation on structure and function of soil bacterial and fungal communities. Sci. Total Environ. 2019, 676, 396–406. [Google Scholar] [CrossRef]
  21. Kukuļs, I.; Kļaviņš, M.; Nikodemus, O. Changes in soil organic matter and soil humic substances following the afforestation of former agricultural lands in the boreal-nemoral ecotone (Latvia). Geoderma Reg. 2019, 16, e00213. [Google Scholar] [CrossRef]
  22. Mongil-Manso, J.; Navarro-Hevia, J.; San Martín, R. Impact of Land Use Change and Afforestation on Soil Properties in a Mediterranean Mountain Area of Central Spain. Land 2022, 11, 1043. [Google Scholar] [CrossRef]
  23. Sokołowska, J.; Józefowska, A.; Woźnica, K.; Zaleski, T. Succession from meadow to mature forest: Impacts on soil biological, chemical and physical properties—Evidence from the Pieniny Mountains, Poland. Catena 2020, 189, 104503. [Google Scholar] [CrossRef]
  24. Strand, L.T.; Fjellstad, W.; Jackson-Blake, L.; De Wit, H.A. Afforestation of a pasture in Norway did not result in higher soil carbon, 50 years after planting. Land. Urban Plan. 2021, 207, 104007. [Google Scholar] [CrossRef]
  25. IUSS Working Group WRB. World Reference Base for Soil Resources. In International Soil Classification System for Naming Soils and Creating Legends for Soil Maps, 4th ed.; International Union of Soil Sciences (IUSS): Vienna, Austria, 2022. [Google Scholar]
  26. Casida, L.E.; Klein, D.A.; Santoro, T. Soil dehydrogenase activity. Soil Sci. 1964, 98, 371–376. [Google Scholar] [CrossRef]
  27. Gorlach, E.; Mazur, T. Agricultural Chemistry: Basics of Nutrition and Principles of Fertilization; PWN: Warsaw, Poland, 2001; p. 125. (In Polish) [Google Scholar]
  28. Kowalenko, C. Assessment of Leco CNS-2000 analyzer for simultaneously measuring total carbon, nitrogen, and sulphur in soil. Commun. Soil Sci. Plant Anal. 2001, 32, 13–14. [Google Scholar] [CrossRef]
  29. Sohi, S.P.; Powlson, D.S.; Gaunt, J.L. A procedure for isolating soil organic matter fractions suitable for modelling. Soil Sci. Soc. Am. J. 2001, 65, 1121–1128. [Google Scholar] [CrossRef]
  30. Calderoni, G.; Schnitzer, M. Effects of age on the chemical structure of paleosol humic acids and fulvic acids. Geochim. Cosmochim Acta 1984, 48, 2045–2051. [Google Scholar] [CrossRef]
  31. Tan, K.T. Soil Sampling, Preparation and Analysis; Taylor &Francis Group: Boca Raton, FL, USA, 2005. [Google Scholar]
  32. Statistica (Data Analysis Software System), version 13.3; StatSoft Inc.: Tulsa, OK, USA, 2019.
  33. ter Braak, C.J.F.; Smilauer, P. Canoco Reference Manual and User’s Guide: Software for Ordination, version 5.0; Microcomputer Power: Ithaca, NY, USA, 2012. [Google Scholar] [CrossRef]
  34. Mazurek, R.; Kowalska, J.; Gasiorek, M.; Setlak, M. Micromorphological and physico-chemical analyses of cultural layers in the urban soil of a medieval city—A case study from Krakow, Poland. Catena 2016, 141, 73–84. [Google Scholar] [CrossRef]
  35. Chen, C.R.; Condron, L.M.; Davis, M.R.; Sherlock, R.R. Effects of afforestation on phosphorus dynamics and biological properties in a New Zealand grassland soil. Plant Soil 2000, 220, 151–163. [Google Scholar] [CrossRef]
  36. Ciarkowska, K.; Miechówka, A. The role of bilberry and Alpine lady-fern in soil formation within the Carpathian subalpine spruce forest stands. Geoderma 2017, 305, 162–172. [Google Scholar] [CrossRef]
  37. Xie, H.; Tang, Y.; Yu, M.; Wang, G.G. The effects of afforestation tree species mixing on soil organic carbon stock, nutrients accumulation, and understory vegetation diversity on reclaimed coastal lands in Eastern China. Global Ecol Cons. 2021, 26, e01478. [Google Scholar] [CrossRef]
  38. Chang, R.; Fu, B.; Liu, G.; Wang, S.; Yao, X. The effects of afforestation on soil organic and inorganic carbon: A case study of the Loess Plateau of China. Catena 2012, 95, 145–152. [Google Scholar] [CrossRef]
  39. Vesterdal, L.; Rosenoqvist, L.; Van der Salm, K.; Hansen, K.; Gronenberg, B.-J.; Johansson, M. Carbon Sequestration in Soil and Biomass Following Afforestation: Experiences from Oak and Norway Spruce Chronosequences in Denmark, Sweden and the Netherlands.19-53. In Environmental Effects of Afforestation in North-Western Europe; From Field Observations to Decision Support Edited by Gerrit, W.; Heil, Bart Muys, Karin Hansen; Springer: Dordrecht, The Netherlands, 2007. [Google Scholar]
  40. Recio-Vazquez, L.; Almendros, G.; Knicker, H.; Carral, P.; Álvarez, A.-M. Multivariate statistical assessment of functional relationships between soil physical descriptors and structural features of soil organic matter in Mediterranean ecosystems. Geoderma 2014, 230–231, 95–117. [Google Scholar] [CrossRef]
  41. Ciarkowska, K.; Miechówka, A. The effect of understory on cation binding reactions and aluminium behaviour in acidic soils under spruce forest stands (Southern Poland). Biogeochemistry 2019, 143, 55–66. [Google Scholar] [CrossRef]
  42. Sokołowska, J.; Józefowska, A.; Zaleski, T. Humus horizon development during natural forest succession process in the Polish Carpathians. J. Mt. Sci. 2022, 19, 647–661. [Google Scholar] [CrossRef]
Figure 1. Map of studied area with marked stands locations.
Land 12 01042 g001
Figure 2. PCA showing the relationship between the examined variables (selected soil parameters) and the soils from different stands in the (A) 0–10 cm and (B) 10–30 cm horizons. The following soil parameters were included in the PCA: sand, silt and clay; pH; organic C; available P, K and Mg; DHA; C/N ratio; and SOM parameters (R, Hus and the HA/FA ratio).
Land 12 01042 g002
Figure 3. Relationship between the ADI and organic C in the studied soils, with the correlation coefficient and regression equation for both the 0–10- and 10–30 cm horizons.
Land 12 01042 g003
Table 1. Basic properties of 0–30 cm horizons of soils from studied stands.
Basic Properties of 0–10 cm Horizons of Soils from Studied Stands
Parameters/StandsCGFCGGMGFMGG
Sand 80.0 98.0
87 ± 7.9   b
82.0 89.0
86.1 ± 2.5   b
55.0 73.0
67.5 ± 7.3   a
45.0 77.0
61 ± 13.1   a
Silt 1.0 10.0
6.9 ± 3.9   a
2.0 10.0
5.8 ± 2.5   a
9.0 19.0
13.3 ± 3.6   b
9.0 25.0
18.7 ± 6.9   c
Clay 1.0 10.0
6.7 ± 4.0   a
5.0 11.0
8.2 ± 1.8   a
15.0 26.0
19.3 ± 4.1   b
14.0 33.0
20.3 ± 9.0   b
pH 4.3 5.2
4.6 ± 0.4   a
3.4 6.4
5.8 ± 0.8   b
4.4 7.6
6.3 ± 1.2   bc
6.3 7.2
6.9 ± 0.4   c
BC 9.84 20.0
14.7 ± 3.3   a
  40.2 50.5
44.3 ± 3.4   b
20.1 160
99.6 ± 48.4   c
166 264
220 ± 35.7   d
DHA 15.7 26.6
21.7 ± 3.0   a
22.5 68.9
45.3 ± 14.8   a
29.2 423
186 ± 147   b
226 428
321 ± 70.7   c
P 2.49 56.7
20.3 ± 22.3   a
2.58 45.7
17.1 ± 19   a
3.66 84.9
23.9 ± 32.5   a
2.18 14.4
6.95 ± 5.04   a
K 3.01 4.14
3.42 ± 0.37   a
2.44 6.71
3.77 ± 1.78   a
2.71 5.97
3.87 ± 1.15   a
5.28 10.3
7.07 ± 2.16   b
Mg 0.99 27.1
13.3 ± 10.1   a
12.9 34.6
24.2 ± 8.3   ab
0.10 128
65.9 ± 44.4   c
86.5 155
120 ± 23.1   d
Basic Properties of 10–30 cm Horizons of Soils from Studied Stands
Parameters/StandsCGFCGGMGFMGG
Sand 80.0 98.0
86.4 ± 7.7   c
82.0 90.0
86.4 ± 3.0   c
55.0 76.0
68.9 ± 9.3   ab
47.0 65.0
55.7 ± 7.4   a
Silt 1.0 11.0
6.8 ± 3.9   a
4.0 10.0
6.1 ± 2.0   a
6.0 17.0
10.3 ± 3.8   ab
12.0 22.0
16.0 ± 4.3   b
Clay 1.0 10.0
6.8 ± 3.9   a
5.0 9.0
7.4 ± 1.3   a
10.0 29.0
19.6 ± 6.2   bc
23.0 31.0
28.3 ± 3.8   c
pH 4.5 5.6
4.9 ± 0.5   a
5.5 6.7
6.3 ± 0.5   b
5.0 7.9
6.8 ± 1.2   b
6.5 7.4
6.8 ± 0.4   b
BC       9.01 18.3
13.0 ± 3.1   a
42.6 53.5
46.6 ± 3.6   b
36.4 153
76.6 ± 31.9   b
110 240
177 ± 49.5   c
DHA 5.36 14.2
9.43 ± 3.39   a
4.33 25.2
13.7 ± 4.76   a
23.9 271
112 ± 81.4   ab
24.9 271
114 ± 109   b
P 2.49 51.0
17.9 ± 20.8   a
2.75 52.9
16.1 ± 18.1   a
2.66 54.2
17.6 ± 17.9   a
1.28 67.6
24.0 ± 29.0   a
K 1.62 3.41
2.35 ± 0.67   a
2.01 6.44
3.00 ± 1.23   b
2.23 3.72
2.72 ± 0.43   ab
2.67 5.58
3.90 ± 0.96   b
Mg 0.85 20.0
7.25 ± 8.70   a
10.3 27.8
17.4 ± 6.10   a
1.00 98.8
56.2 ± 25.0   b
83.8 117
101 ± 9.7   c
min m a x m e a n ± S D stands for the minimal and maximal values and arithmetic mean ± standard deviation; the same letters indicate a lack of significant differences among means at α = 0.05. Sand, silt and clay in %, DHA (dehydrogenase activity) in mg TPF/kg/24 h; P, K, Mg (available forms of potassium, phosphorous and magnesium) in mgkg; BC (sum of basic cations) in mmol(+)kg.
Table 2. Soil organic matter parameters.
Parameters/StandsCGFCGGMGFMGG
0–10 cm
Soil colour10YR 2-4/2-310YR 2-4/1-210YR 2-4/1-410YR 2-4/2-4
ADI 0.3 1.53
1.06 ±   0.29   a
0.4 1.40
0.93 ±   0.24   a
0.77 2.50
1.41 ±   0.46 ab
0.8 3.30
1.59 ±   0.72 b
C 1.02 4.48
2.88 ± 1.27   b
0.81 3.20
1.79 ± 0.67   a
1.18 3.75
2.48 ± 0.88   ab
3.11 4.89
4.16 ± 0.58   b
C/N 9.58 16.0
13.0 ± 1.8   b
8.11 14.0
10.5 ± 1.5   a
7.40 14.56
10.6 ± 2.1   a
7.53 12.50
9.9 ± 1.4   a
R 0.76 3.21
2.07 ± 0.90   ab
0.36 1.87
1.01 ± 0.44   a
0.61 12.0
2.14 ± 3.0   ab
1.14 6.27
2.80 ± 1.37   b
HA/FA 0.46 0.74
0.49 ± 0.09   a
0.63 2.35
1.28 ± 0.56   b
0.40 1.80
0.95 ± 0.57   ab
0.70 2.09
1.76 ± 0.49   b
Hu 0.09 0.23
0.16 ± 0.04   a
0.18 0.43
0.28 ± 0.08   a
0.05 1.13
0.36 ± 0.28   a
0.08 1.40
0.99 ± 0.58   b
10–30 cm
Soil colour10YR 4-5/2-410YR 3-4/2-310YR 4-5/3-810YR 3-4/4
ADI 0.3 1.20
0.73 ±   0.27   a
0.3 1.40
0.95 ±   0.35   ab
0.8 1.54
1.06 ±   0.23   b
1.1 1.54
1.35 ±   0.2   c
C     0.20 1.97
1.31 ± 0.68   a
0.46 2.48
1.48 ± 0.54   a
0.50 2.34
1.25 ± 0.59   a
1.74 4.88
3.24 ± 1.13   b
C/N 3.92 13.3
9.43 ± 3.39   a
5.00 13.8
9.68 ± 2.95   a
3.48 10.2
7.10 ± 1.80   a
7.80 16.0
10.8 ± 2.1   b
R     0.19 1.11
0.73 ± 0.37   a
0.16 1.14
0.67 ± 0.35   a
0.20 0.40
0.30 ± 0.05   a
0.47 3.30
1.89 ± 0.50   b
HA/FA 0.44 0.77
0.58 ± 0.08   a
0.79 2.33
1.38 ± 0.54   b
0.43 0.76
0.62 ± 0.10   a
0.59 1.85
1.22 ± 0.62   b
Hu 0.03 0.19
0.11 ± 0.08   a
0.18 0.43
0.28 ± 0.08   b
0.20 0.98
0.50 ± 0.25   c
0.75 1.55
1.20 ± 0.55   d
min m a x m e a n S D , the same letters indicate a lack of significant differences among means at α = 0.05, soil colour according to Munsell chart, C (organic carbon), R (residuum), Hu (humines) in %, ADI–A horizon development index.
Disclaimer/Publisher’s Note: The statements, opinions and data contained in all publications are solely those of the individual author(s) and contributor(s) and not of MDPI and/or the editor(s). MDPI and/or the editor(s) disclaim responsibility for any injury to people or property resulting from any ideas, methods, instructions or products referred to in the content.

