Article

The Changes of Desertification and Its Driving Factors in the Gonghe Basin of North China over the Past 10 Years

1
Key Laboratory of Environmental Change and Natural Disasters, Ministry of Education, Beijing Normal University, Beijing 100875, China
2
Engineering Research Center of Desertification and Blown-Sand Control, Ministry of Education, Beijing Normal University, Beijing 100875, China
3
Faculty of Geographical Science, Academy of Disaster Reduction and Emergency Management, Beijing Normal University, Beijing 100875, China
*
Author to whom correspondence should be addressed.
Land 2023, 12(5), 998; https://doi.org/10.3390/land12050998
Submission received: 11 April 2023 / Revised: 25 April 2023 / Accepted: 29 April 2023 / Published: 1 May 2023
(This article belongs to the Special Issue Rethinking the Man-Land Relations in China)

Abstract

:
Desertification is one of the most severe environmental and socioeconomic issues facing the world today. Gonghe Basin is located in the monsoon marginal zone of China, is a sensitive area of climate change in the northeastern of the Qinghai-Tibet Plateau in China, desertification issue has become very severe. Remote sensing monitoring provides an effective technical means for desertification control. In this study, we used Landsat images in 2010 and 2020 to extract desertification information to constructed the Albedo-NDVI feature space in the Gonghe Basin. And then analyzed temporal and spatial evolution of desertification and its driving factors using Geodetector in the Gonghe Basin from 2010 to 2020. The main conclusions are as follows: (1) Albedo-NDVI feature space method can accurately classify desertification information with accuracy of more than 90%, which was benefit to quantitative analysis of desertification. (2) The desertification situation in the Gonghe Basin had improved from 2010 to 2020, especially in the west of the basin, desertification land area decreased by 827.46 km2, and desertification intensity had been obviously reversed. (3) The changes of the desertification in the Gonghe Basin from 2010 to 2020 was affected by both natural and human factors, and the influence of human activities on desertification reversal had increased gradually. The results indicate that the desertification status in the Gonghe Basin had been effectively controlled, and can provide useful basis for the desertification combat in the Gonghe Basin.

1. Introduction

Desertification is defined as land degradation mainly characterized by aeolian activity in arid and semi-arid areas, due to the inharmonious man-land relationship [1]. Desertification has become one of the most severe ecological environmental issues, which causes economic losses of up to 540 billion RMB annually in the world [2,3,4]. The Gonghe Basin is one of the centralized distribution regions of desertification in the northeast of the Qinghai-Tibet Plateau [5], in which the ecological environment is fragile. Desertification has become increasingly prominent in the Gonghe Basin due to global climate change and unreasonable human activities, which not only affect the lives of local people but also pose a huge threat to the safety of the Longyangxia Reservoir, has hindered socioeconomic development [6,7]. Thus, it is urgent to strengthen research on desertification in this area.
Gonghe Basin is affected by the Asian monsoon circulation and the mid-latitude westerly circulation, and it is a part of the boundary between the deserts and loess in China [8]. Its unique geographical location provides an ideal research site for exploring the formation and changes of the aeolian activity environment. So far, multiple time scales research had been conducted on the formation, evolution, and driving mechanism of the aeolian activity in the Gonghe Basin [6,9,10]. The studies of desertification of the Gonghe Basin during its geological history mainly focused on geomorphological evolution, sedimentary strata, the history of aeolian activity, and the driving mechanisms [11,12]. Previous studies have shown that the oldest formation age of aeolian sand is 33.5 ± 2.1 ka BP in the Gonghe Basin, dune fields developed in the early and middle Holocene, and fixed in the late Holocene [10]. The formation of the aeolian sand environment in the Gonghe Basin is influenced by multiple factors, such as the evolution process of the geomorphology, regional climate, and wind strength, the main control factors were different in different periods [13,14].
The research about the modern process of desertification in the Gonghe Basin mainly includes different aspects such as aeolian landforms [15], wind conditions [16], spatial distribution and dynamic monitoring of desertification, driving mechanism of desertification and countermeasures for land desertification prevention and control [6,17,18,19]. Remote sensing images provide an effective data source for desertification monitoring and information extraction [20,21]. Collado et al. assessed the desertification process in the crop-rangeland boundary of Argentina by using remote sensing data [22]. Qi et al. analyzed the spatiotemporal changes of desertification from1986 to 2003 through supervised classification method in the agropastoral transitional zone of northern Shaanxi Province in China [23]. In the Gonghe basin, Yan et al. used Landsat data from 1975 to 2005 through visual interpretation to explore aeolian desertification trends and driving factors in the Longyangxia Reservoir next to the Yellow River [24]. Ma et al. used TM data from the three periods of 1990, 2000, and 2010 in the Gonghe Basin, it was concluded that the desertification situation was worsening from 1990 to 2010 [25]. However, previous monitoring methods were mainly based on visual interpretation and supervised classification, resulting in low utilization rate and classification accuracy of remote sensing information [24,26,27]. In recent years, many studies have used single indicator (e.g., NDVI, EVI, MSAVI) to assess desertification [28,29]. Nonetheless, due to the complex causes of desertification evolution, using a single index cannot comprehensively reflect desertification information [30]. The Albedo-NDVI feature space basing on the negative correlation between Albedo and NDVI established by Zeng et al. provides an efficient approach for quantitative analysis of desertification [31], which has been used in many desertified land, such as Moulouya basin in Morocco [32], central Mexico [33], Mongolian plateau [34], source region of Yellow River in China [35]. For the Gonghe Basin, there is lack of study on the desertification evolution process over the past 10 years, and short time scale desertification research is of practical significance in assessing the effectiveness of desertification prevention. There is relatively little research on desertification monitoring in the Gonghe Basin compared to other typical desertification regions, and only part of Gonghe Basin was studied, such as around the Longyangxia Reservoir, Gonghe county, and Guinan county [24,36,37,38]. Additionally, the research on the driving mechanism of desertification evolution in the Gonghe Basin mainly focuses on qualitative research [24,25,38], while quantitative research can better reveal the potential impact factors of desertification process.
In this study, we obtained two desertification monitoring indicators, Albedo and NDVI, to constructed Albedo-NDVI feature space basing on Landsat images. Additionally, we quantitatively explored the spatiotemporal evolution patterns of desertification and the underlying causes of desertification from 2010 to 2020 using Geodetector model, which provided a theoretical basis for desertification combat.

2. Materials and Methods
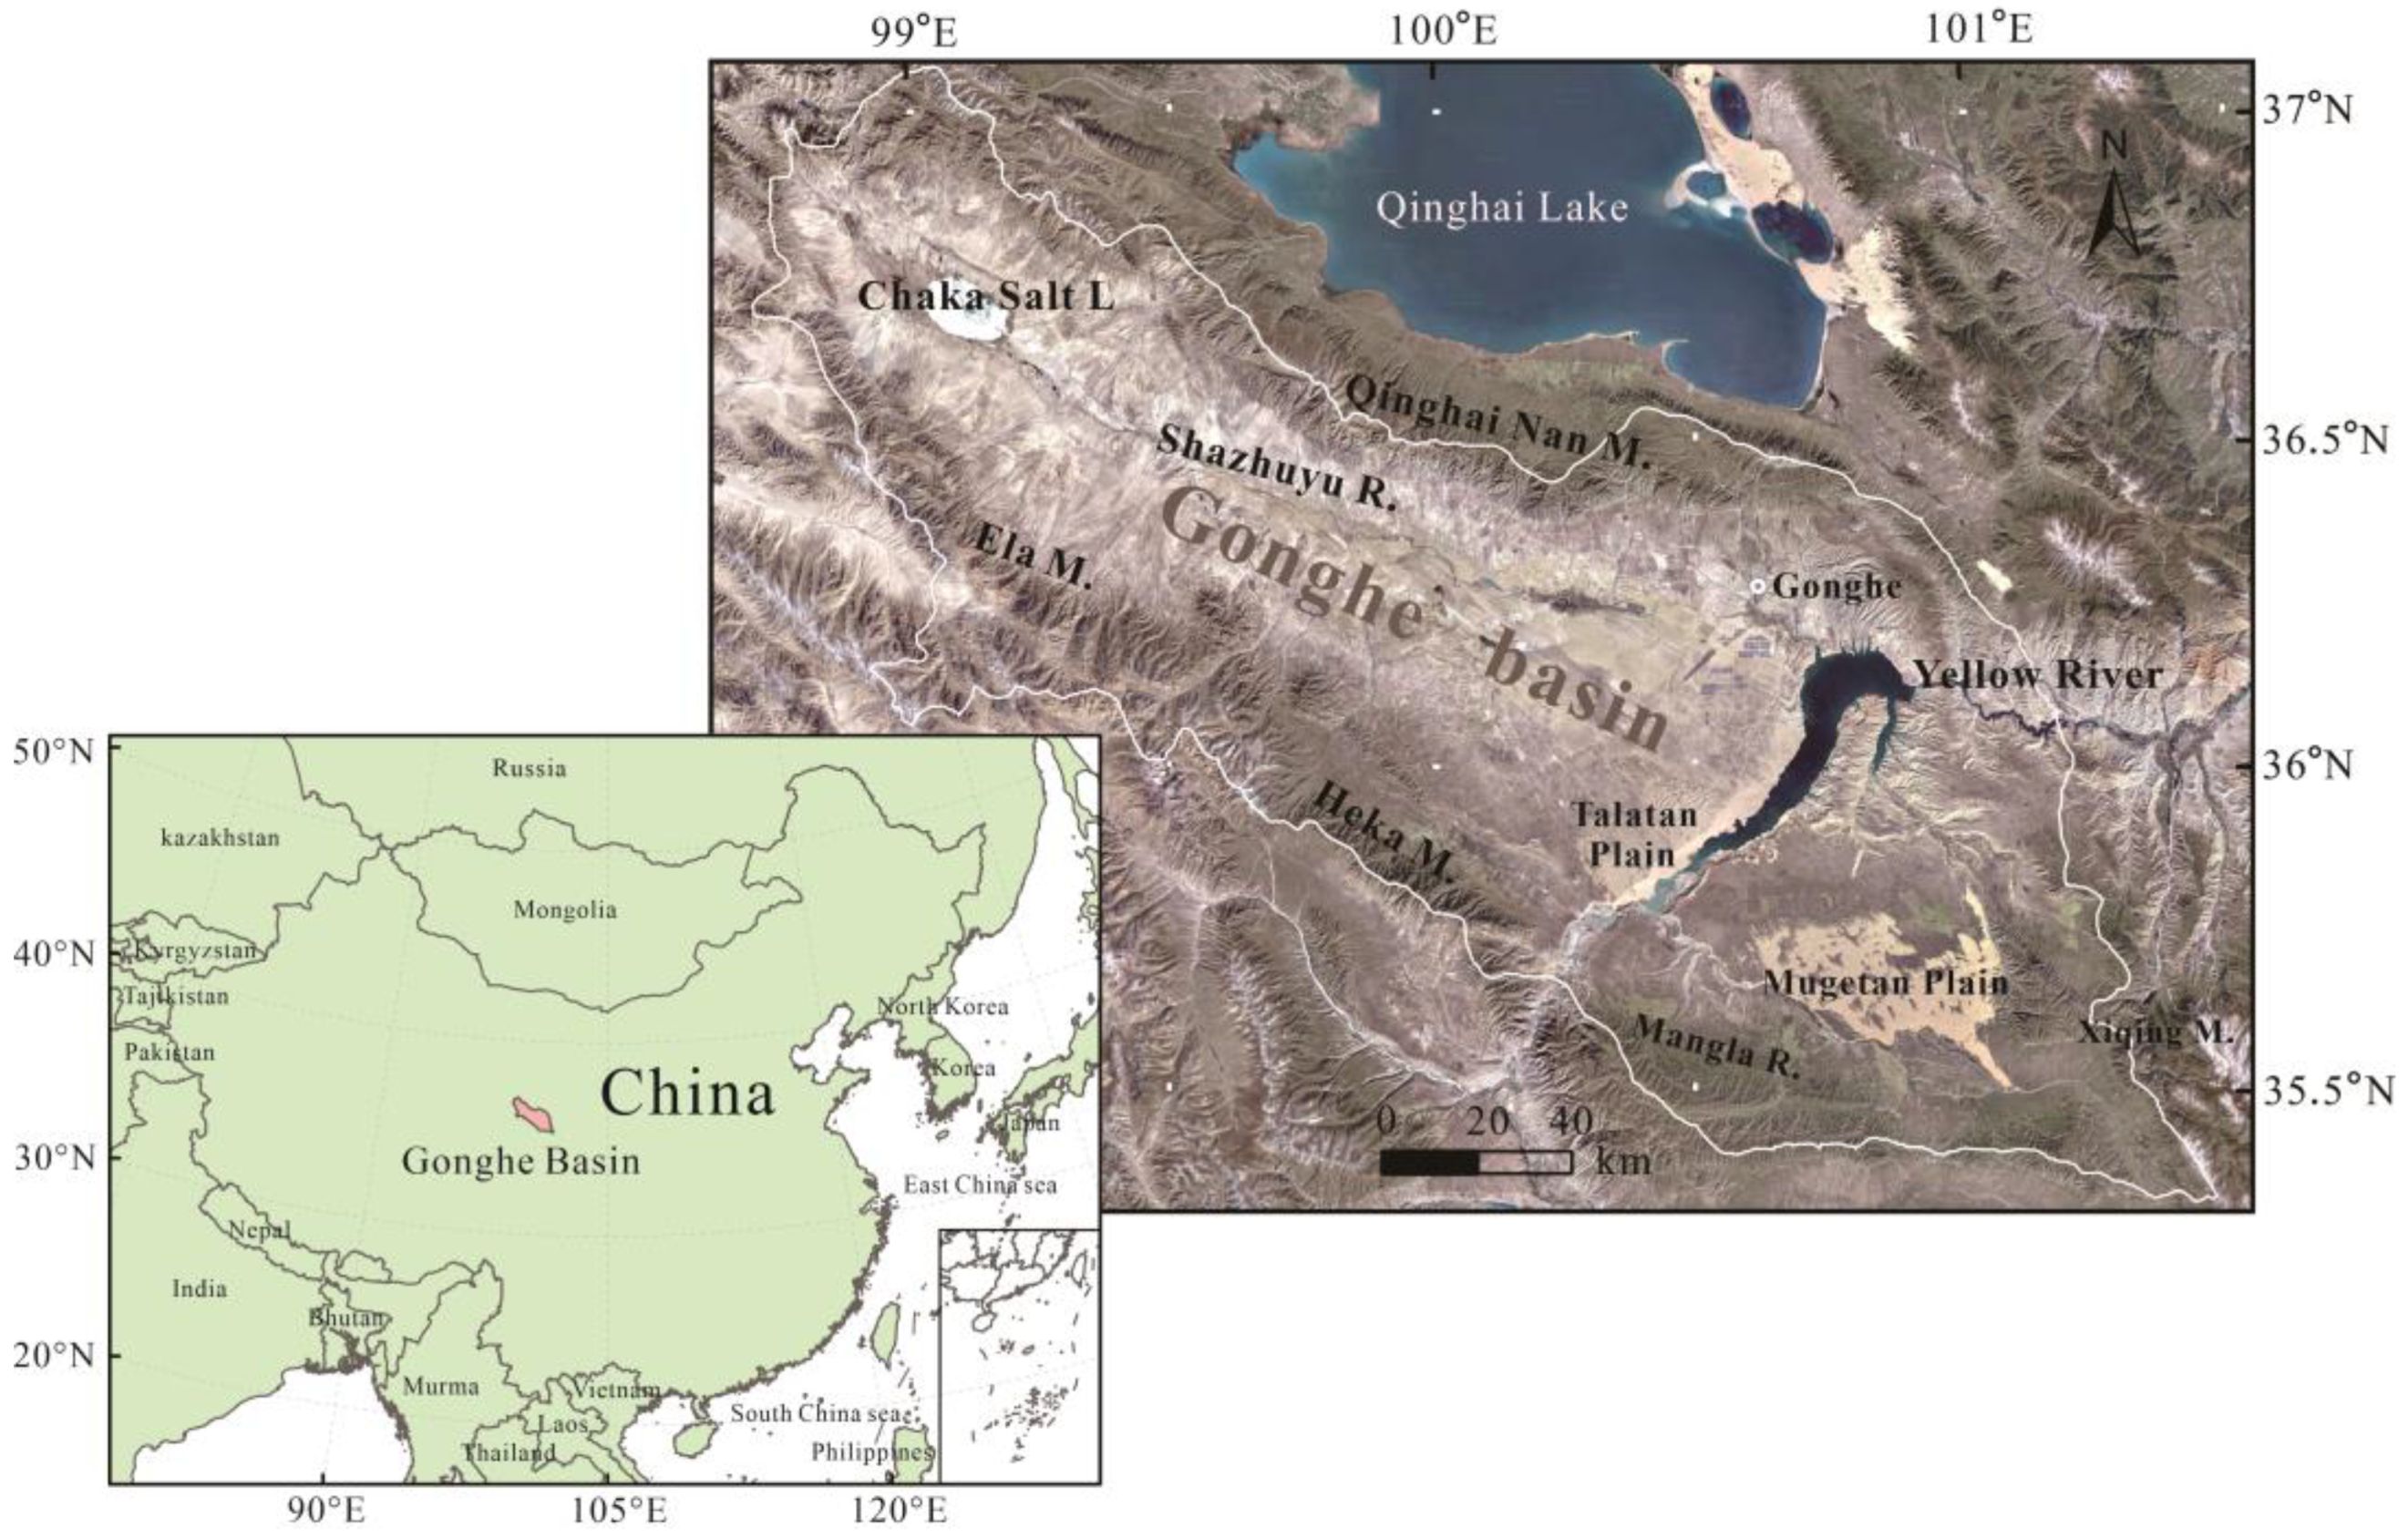
2.1. Study Area

The Gonghe Basin is surrounded by mountains on three sides, including the Qilian Mountains, Kunlun Mountains and Qinling Mountains (Figure 1), geographic coordinates are 35°27′–36°56′ N, 98°46′–101°22′ E, with an elevation of 2400–3200 m. It is administratively subordinate to Qinghai Province, including Gonghe county, Guinan county, Xinghai county and Wulan county. The dune fields in the Gonghe Basin are mainly spread in the central and eastern parts of the basin, such as Talatan Plain and Mugetan Plain, with moving dunes, sand ridges, and sand belts [9].
The climate type in the Gonghe Basin is a typical alpine and semi-arid climate, the annual average temperature is about 3.7 °C and annual precipitation is about 300 mm. 80% of the precipitation in the Gonghe Basin is mainly concentrated from May to September, accompanying high evaporation. Strong winds prevail in the Gonghe Basin, and the maximum wind velocity reaches 40 m s−1 in spring [39]. Aeolian activities are common in this area, resulting in wide dune fields and severe land desertification [10].

2.2. Data Sources

We used the Landsat TM/OLI images to monitor land desertification in the Gonghe Basin in our study, and the images were obtained from the geospatial data cloud platform (http://www.gscloud.cn/ (accessed on 10 February 2023)). A total of 8 images for 2010 (2009–2011) and 2020 were collected during the vegetation growing season (especially in June and August) with cloud coverage of less than 10%. These images were preprocessed mainly using ENVI5.3 software, including radiometric calibration and atmospheric correction. The vector boundary data of the Gonghe Basin was used to clip and mosaic the Landsat images to obtain the entire Landsat image of the Gonghe Basin.
The annual average temperature, annual precipitation and annual average wind velocity data from 2010 to 2019 were calculated basing the ERA5 data set on the Google Earth Engine (GEE) platform. Annual interpolation data for meteorological data and relevant regional socio-economic data included datasets of land use (1:100,000), population density (1 km) and GDP density (1 km) were downloaded from the Resource and Environment Science and Data Center (RESDC, https://www.resdc.cn/ (accessed on 5 March 2023)).

2.3. Methods

2.3.1. Normalized Difference Vegetation Index (NDVI)

NDVI is an important biophysical parameter that reflects the state of surface vegetation, with a range of −1 to 1, and the higher the vegetation coverage, the closer NDVI value is to 1. NDVI can be used to indicate vegetation growth status and reflect vegetation coverage, and we can calculate it using the reflectance of the following two bands in remote sensing images [40].
NDVI = (ρnir − ρred)/(ρnir + ρred)
where ρnir, ρred represent near infrared band and the red band, respectively.

2.3.2. Land Surface Albedo

Land Surface albedo is a physical parameter that reflects the reflection characteristics of the surface to solar shortwave radiation. With the aggravation of desertification, surface vegetation is severely damaged, and surface roughness increases, manifested as an increase in Albedo values in remote sensing images. The value of Albedo is between 0 and 1. In this study, we calculated Albedo using the calculation method proposed by Liang [41].
Albedo = 0.356 × ρblue + 0.130 × ρred + 0.373 × ρnir + 0.085 × ρswir1 + 0.072 × ρswir2 − 0.0018
where ρblue, ρred, ρnir, ρswir1 and ρswir2 represent blue band, red band, near infrared band and the shortwave infrared bands, respectively.

2.3.3. Data Normalization

The dimensions of NDVI and Albedo are different, so that Albedo-NDVI feature space cannot be directly established, we normalized the values of NDVI and Albedo to between 0 and 1. The NDVI and the Albedo values were normalized using following equations.
N = (NDVI − NDVImin)/(NDVImax − NDVImin)
A = (Albedo − Albedomin)/(Albedomax − Albedomin)
For NDVI, NDVImax, NDVImin refer to maximum and minimum values, respectively, N was the normalized value; For Albedo, Albedomax and Albedomin refer to maximum and minimum values, respectively, A was the normalized value.

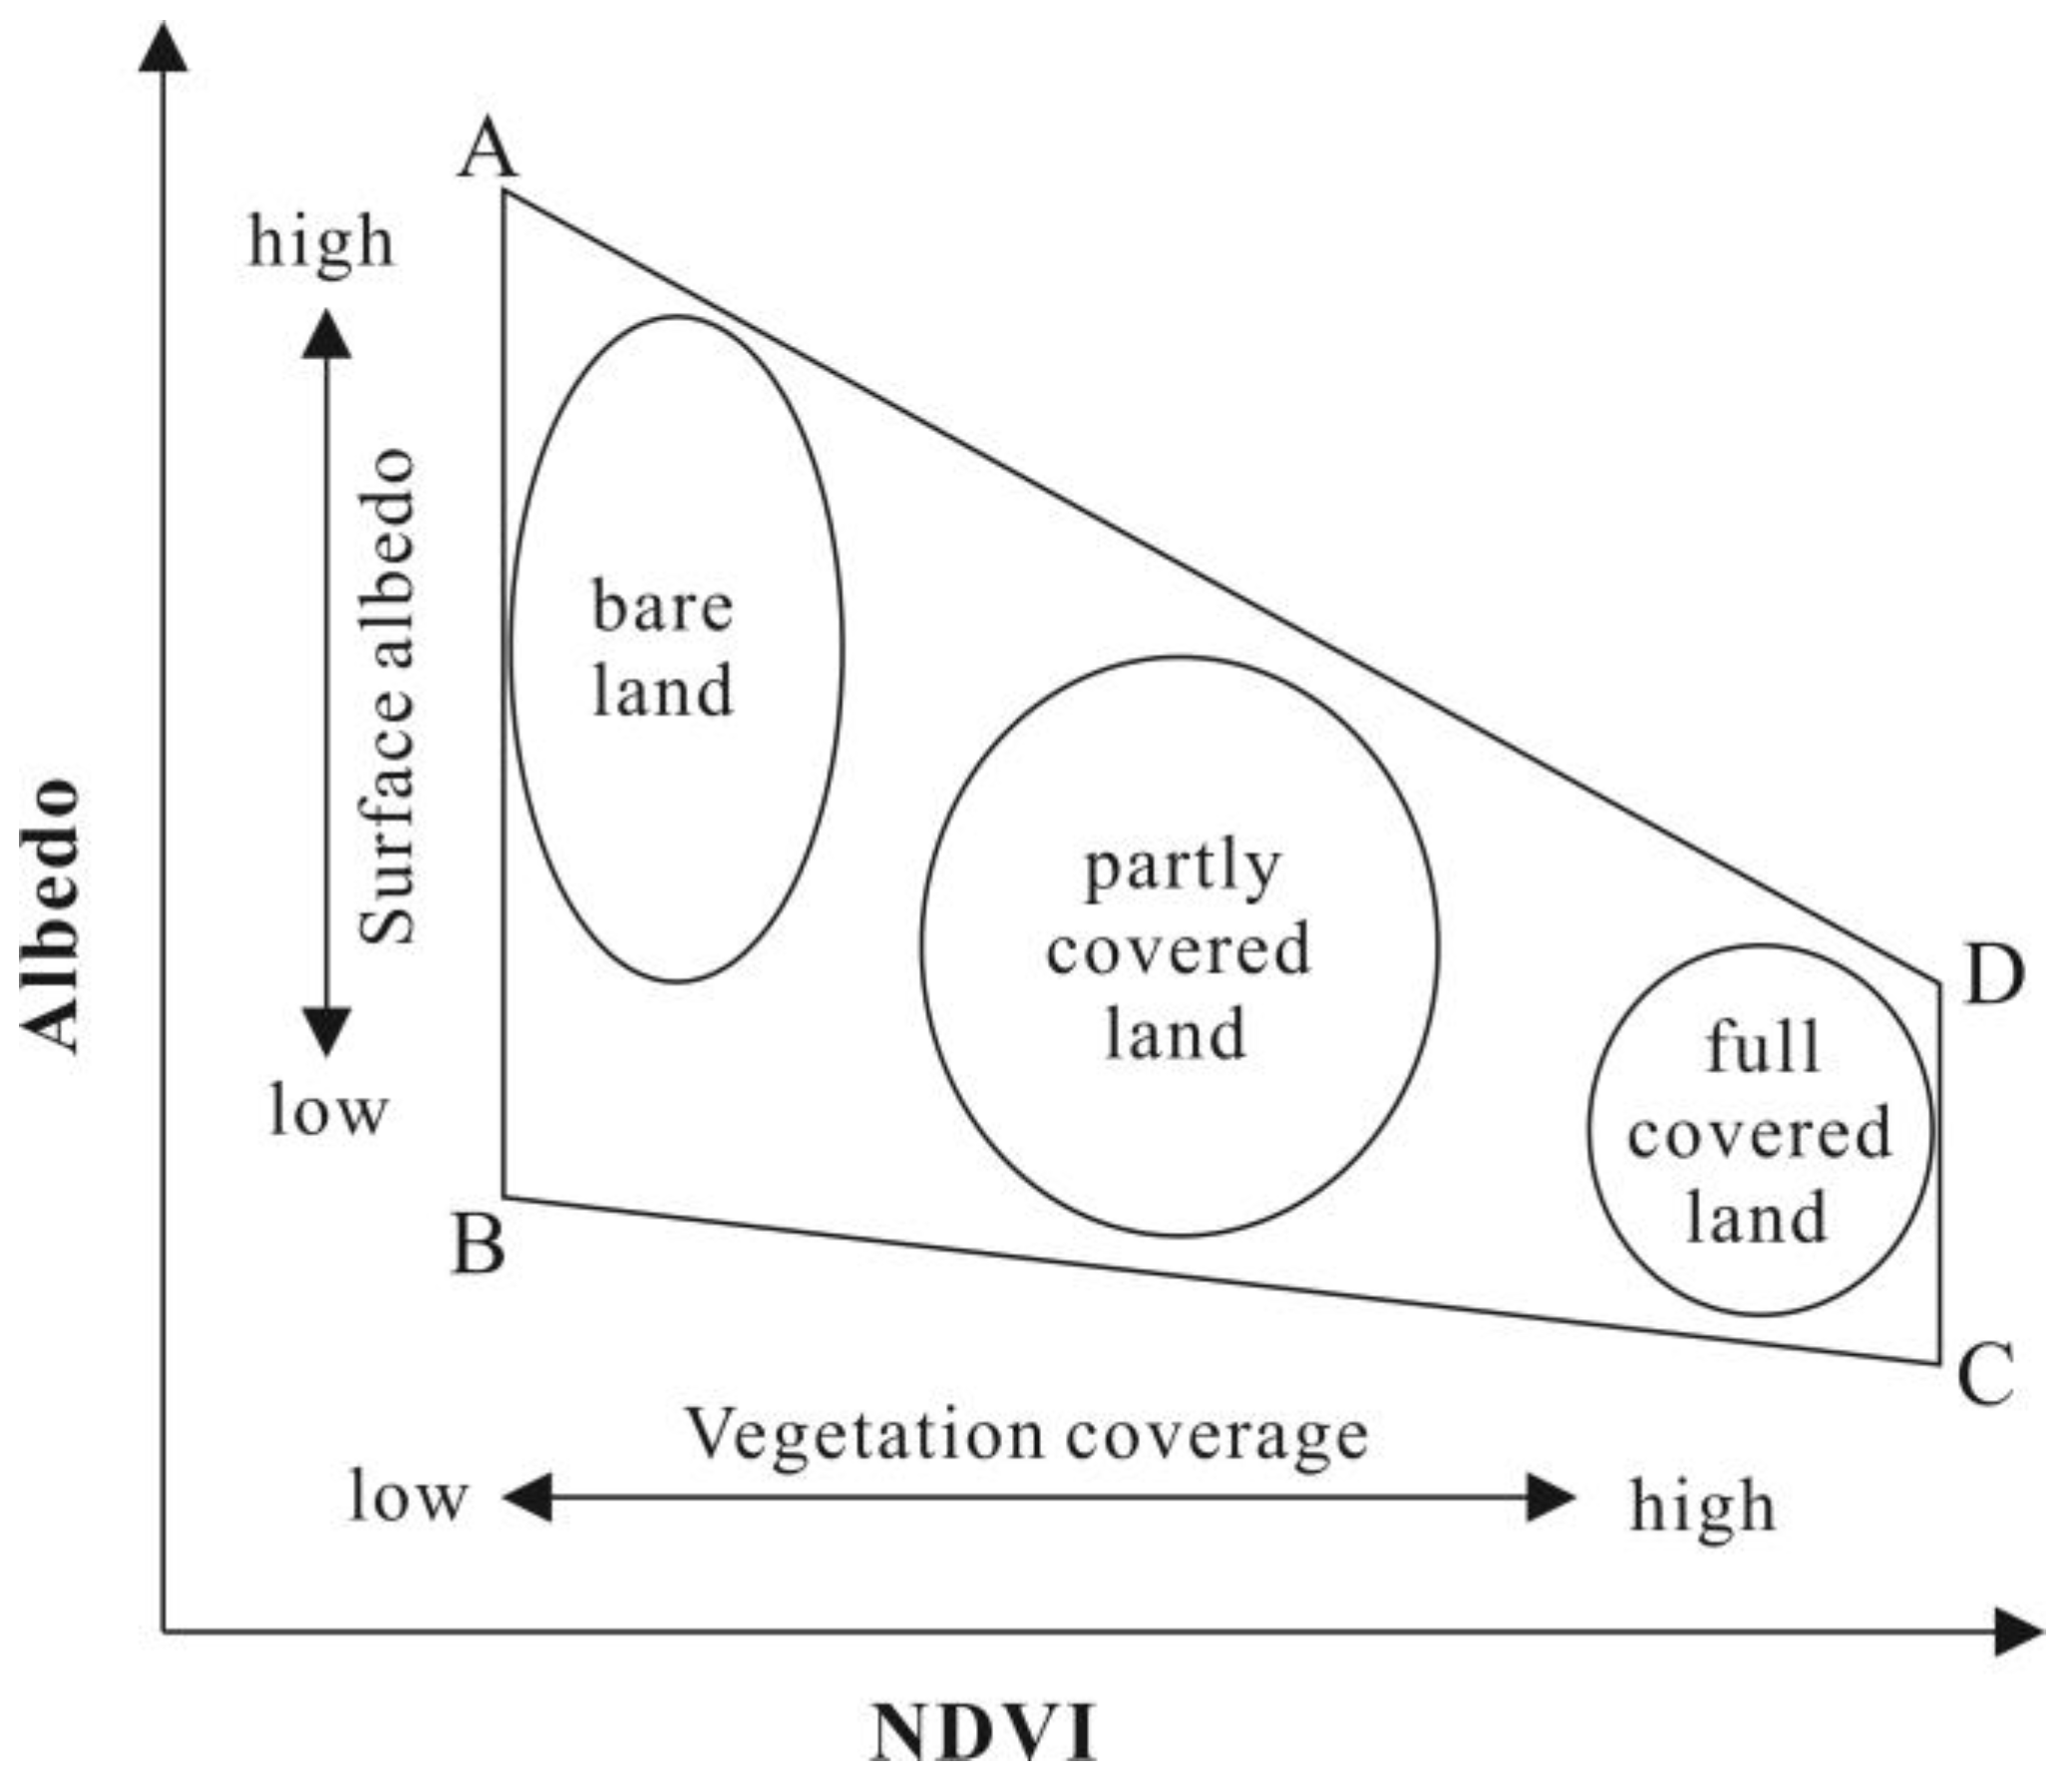
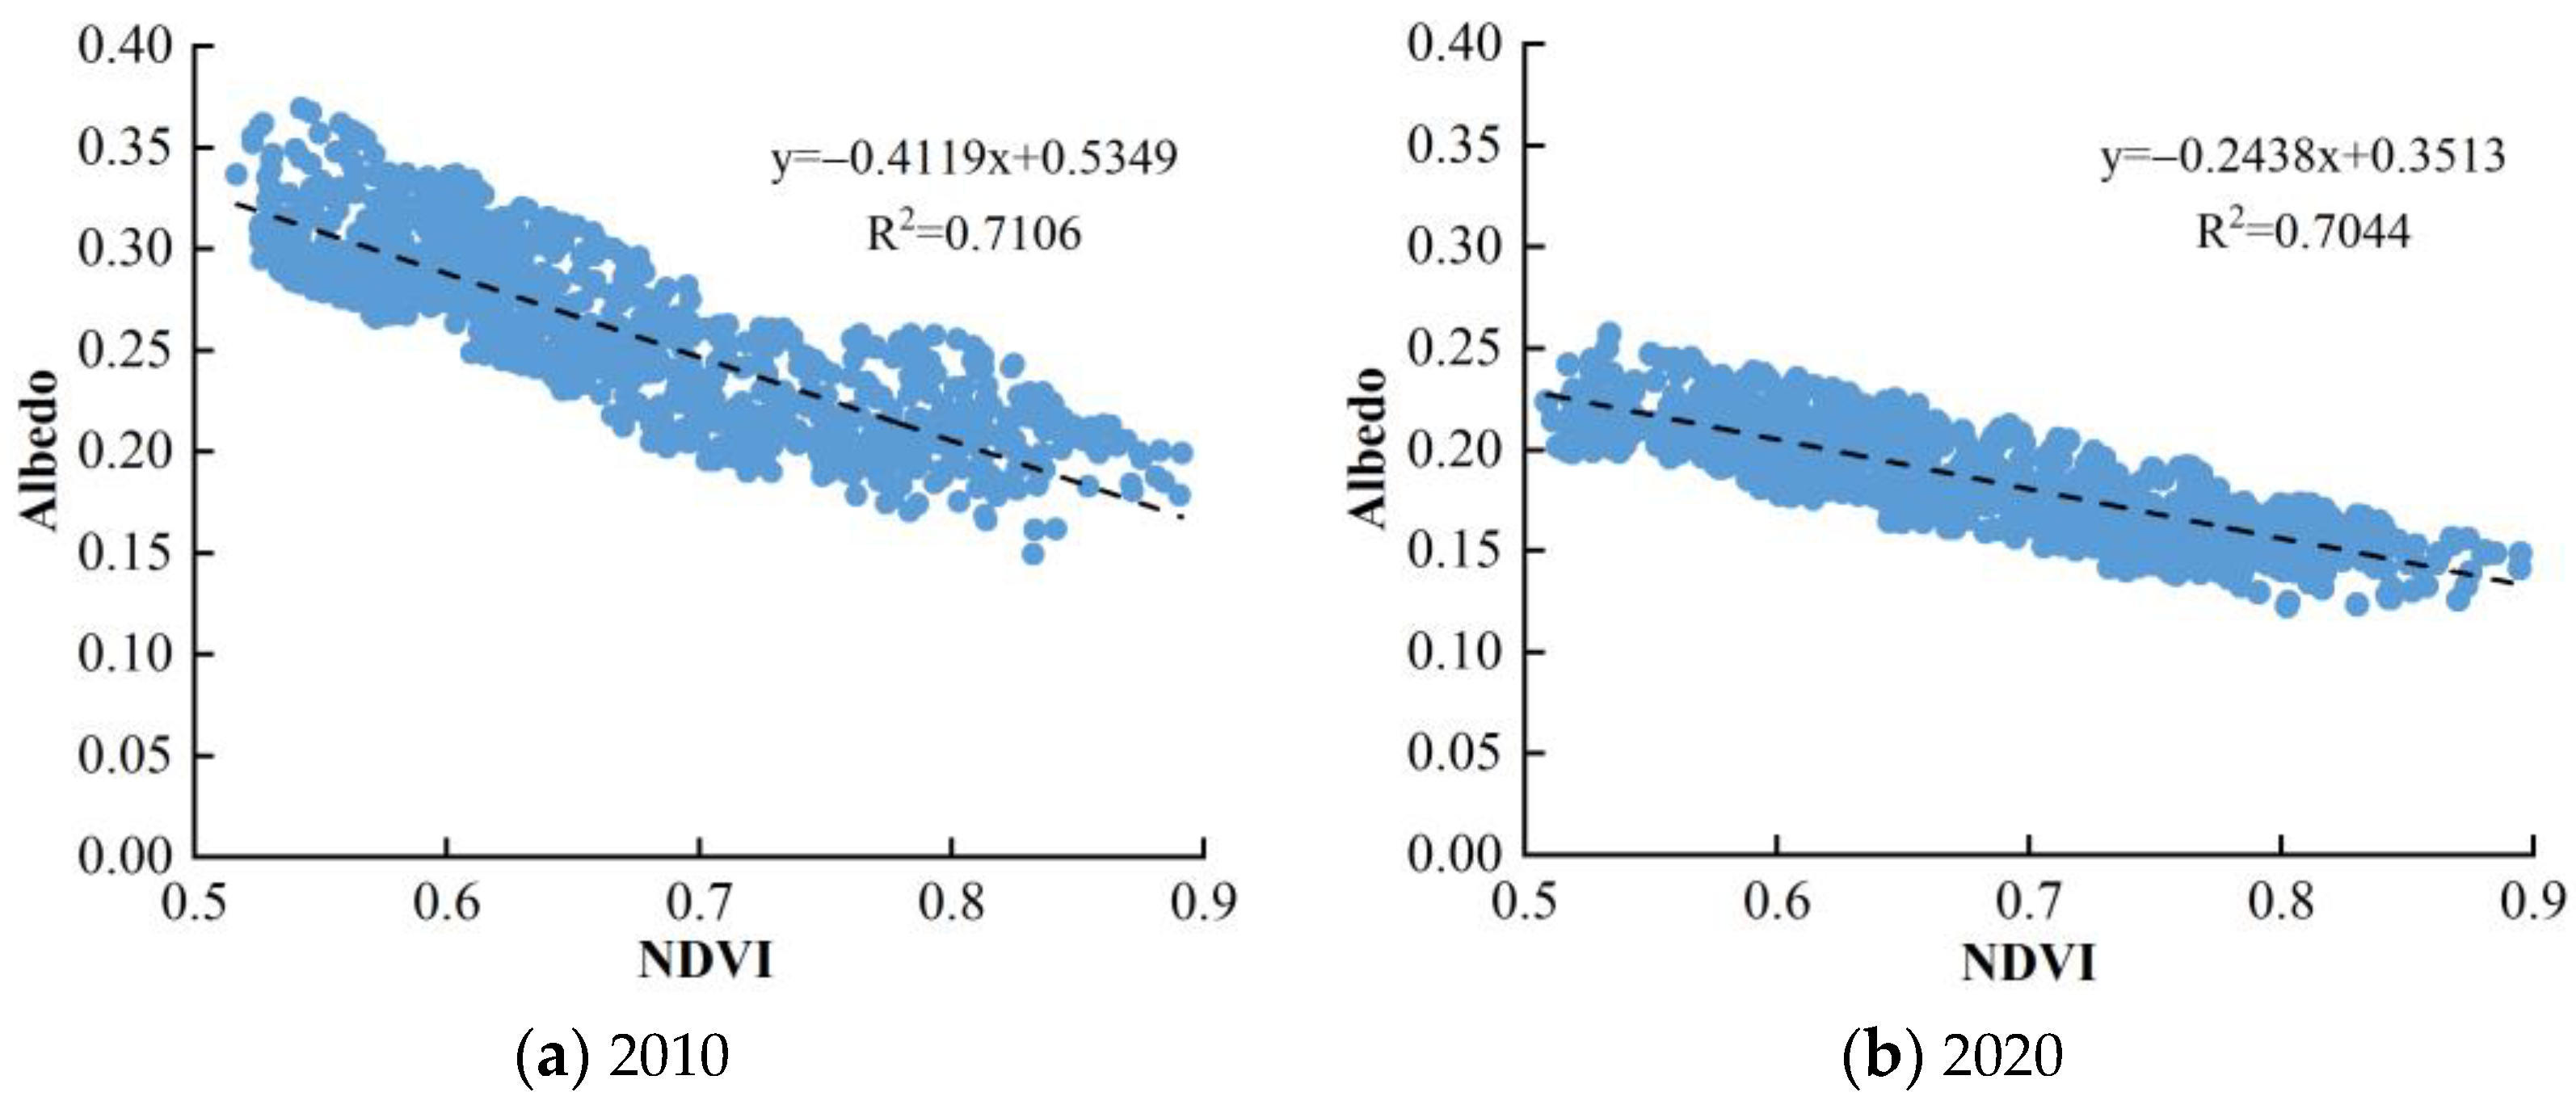
2.3.4. Albedo–NDVI Feature Space

Zeng et al. [31] conducted research on the feature space composed of NDVI and Albedo, and summarized the desertification situation under different vegetation coverage conditions in an ideal feature space (Figure 2). A, B, C, and D points represent the extreme states in the Albedo-NDVI feature space, respectively. A represents areas with severe drought and no vegetation cover, B represents areas with high water content and no vegetation cover, C represents areas with low water content and high vegetation cover, and D represents areas with high water content and high vegetation cover. The upper boundary AD represents a high albedo line, reflecting drought conditions, the bottom BC is the low albedo line, representing the condition of sufficient surface water. And the distribution of different land cover types presented by NDVI and Albedo has a significant distribution rule in the feature space, which can well distinguish water, high vegetation coverage land, low vegetation coverage land and completely bare land [42]. Overall, there is a significant negative correlation between Albedo and NDVI in the feature space.
Based on the ROI function of ENVI5.3 version, 900 sample points were randomly selected from different degrees of desertification land in the study area [30], extracting the NDVI and Albedo values after normalization in 2010 and 2020, respectively. And then selecting the NDVI values as independent variables, Albedo values as dependent variables, we can construct a linear regression equation between them.
Then the linear regression equation represents negative correlation between Albedo and NDVI was calculated using the following formula:
Albedo = k × NDVI + b
where k refers to the slope of the linear expression, and b refers to the parameter.

2.3.5. Desertification Difference Index (DDI)

Based on previous research findings [43], dividing the Albedo-NDVI feature space in the vertical direction representing the trend of desertification change can effectively distinguish different types of desertification land, represented by the Desertification Difference Index (DDI). we can use the following two formulas to calculate the DDI index for 2010 and 2020.
k × a = −1
DDI = a × NDVI − Albedo
where a represent the slope of DDI linear expression.

2.3.6. Accuracy Verification

Confusion matrix is also called error matrix, is an effective method for evaluating the accuracy of classification results. In the confusion matrix, each row represents the real category of desertification degree, and each column represents the prediction category [44]. We obtained evaluation indicators, including the overall accuracy (OA), producer’s accuracy (PA), user’s accuracy (UA), and Kappa coefficient, which can be used to verify the accuracy of the desertification classification results using Albedo-NDVI feature space method. The specific calculation formulas are as follows:
O A = i = 1 i = 5 X i i / N
P A = X i i / X i +
U A = X i i / X + i
K a p p a = [ N × i = 1 i = 5 X i i ( i = 1 i = 5 X + i + X + i ) ] N 2 i = 1 i = 5 X + i + X + i
where N refers to the total number of samples; Xii refers to the sample quantity in row i and column i, that is, the number of sample points correctly identified for a certain type of desertification degree; Xi+ refers to the sample quantity in row i, is the total real sample size of a certain type of desertification; and X+i refers to the sample quantity in column i, is the predicted total sample size of a certain type of desertification.

2.3.7. Desertification Land Transfer Matrix

The land transfer matrix has been widely applied in land use change. The land transfer matrix can reflect the transformation area from one degree of desertification land to another degree of desertification land within a certain period of time, and can reflect the transformation relationship between different degrees of desertification land [45]. In this study, we used the land transfer matrix to calculate the conversion areas between different grades of desertification land basing ArcGIS 10.8. The formula used is as follows:
S i j = [ S 11 S 12 S 1 n S 12 S 22 S 2 n S n 1 S n 2 S n n ]
where i and j represent different grades of land desertification, Sij represents the transition area from the grade i to j (km2), and n represents the number of desertification grades.

2.3.8. Dynamic Degree of Desertification Land

The dynamic degree indicates the area change of one grade of desertification land within a certain specific time range in a certain research area [46]. The formula is as follows:
K = u 2 u 1 u 1 × 1 t 2 t 1 × 100 %
where K represents the dynamic degree from 2010 to 2020, u1 refers to the initial area (km2), u2 represents the final area (km2), t1 and t2 represent the starting and end time, respectively.

2.3.9. Changes in Desertification Degree

The degree of desertification development was divided into five categories [30]: severe deterioration (desertification degree increased by more than one level), deterioration (desertification degree increased by one level), no change (desertification degree remained stable), restoration (desertification degree decreased by one level), obvious restoration (desertification degree decreased by more than one level).

2.3.10. Geodetector Model

The Geodetector is a widely used statistical model that reveal spatial variability and potential driving forces. Geodetector can detect the spatial heterogeneity of a single factor, and can also reveal possible causal relationships between two factors through calculating their consistency of spatial distribution [47]. This study takes the degree of desertification as the dependent variable Y, and selects independent variable indicators including temperature, precipitation, wind velocity, population density, GDP, and land use. The factor interpretation power in Geodetector is represented by the q value. The expressions used are as follows:
q = 1 h = 1 L N h σ h 2 N σ 2 = 1 S S W S S T
S S W = h = 1 L N h σ h 2 ,   S S T = N σ 2
where h refers to the stratification of the independent variable; Nh and N represent the number of units within layer h and the entire area, respectively; σh2 and σ2 represent the discrete variances of layer h and the entire area, respectively; SSW refers to the sum of intralayer variances; SST refers to the regional total discrete variance; q refers to the explanatory power of the independent variable to the degree of desertification, the range of q is between 0 and 1, the larger the q value represents the stronger the explanatory power of the selected factor.
The purpose of interaction detection is to assess whether interaction between two factors can increase the explanatory power of the degree of desertification or whether the impact of these factors on the degree of desertification is independent [48].

3. Results

3.1. Desertification Classification

The scatterplots of Albedo and NDVI in 2010 and 2020 are shown in Figure 3, there was presented a trapezoidal shape in the Albedo-NDVI feature space [46]. The R2 values of the linear regression equations were 0.7106 and 0.7044, respectively, the results indicated there was a significant negative correlation between Albedo and NDVI. Using Equation (6) to calculate the k value to obtain the final expression of the desertification difference index (DDI) in 2010 and 2020, as shown in Table 1.
DDI can be used to obtain the desertification classification, we used the natural breaks (Jenks) method combined with field survey data and Google Earth map to classify the desertification intensity into 5 categories, including extremely severe desertification, severe desertification, moderate desertification, slight desertification, and non-desertification. Finally, the spatial distribution maps of desertification degree in 2010 and 2020 were made by using ArcGIS 10.8 (Figure 4).
To test the accuracy of desertification land classification results, we used Landsat true color image and Google Earth map as reference data, randomly selected 20 sample points in different desertification types (100 points in total) to construct the confusion matrix through visual interpretation. The accuracy evaluation results are shown in Table 2, the overall evaluation accuracy was 94%, and Kappa coefficient was 0.93 in 2010. In 2020, the overall accuracy was 95%, Kappa coefficient was 0.94. The phenomenon of misclassification mainly occurred in slight desertification areas. Overall, the Albedo-NDVI feature space method has certain feasibility and applicability to evaluate desertification level.

3.2. Temporal Distribution Characteristics of Desertification

Table 3 shows the area, proportion, and dynamic changes of different desertification levels in the study area. As shown in Table 3, extremely severe desertification land areas had decreased by 2335.32 km2 from 2010 to 2020, with the proportion decreasing from 17.4% to 5.6% and the dynamic degree of 6.8%. Severe desertification, moderate desertification, and slight desertification have a slight increasing trend, with the area increasing 592.13 km2, 687.33 km2 and 227.40 km2, respectively, and their proportions had increased 3.0%, 3.5% and 1.1%, respectively. Meanwhile, the non-desertification land areas accounted for 19.9% in 2020, and the area increased by 827.46 km2. The dynamic degrees of the severe, moderate, slight and non-desertification land area were 1.3%, 1.5%, 0.5% and 2.7%, respectively.
In the past 10 years, there existed a certain upward trend in the non-desertification area. The moderate desertification had always accounted for a large proportion of the total study area, which was the main type of desertification in the Gonghe Basin. It can be concluded that the desertification status in the Gonghe Basin had generally improved from 2010 to 2020, and the degree of desertification had been mainly reversed from extremely severe to other degrees of desertification.

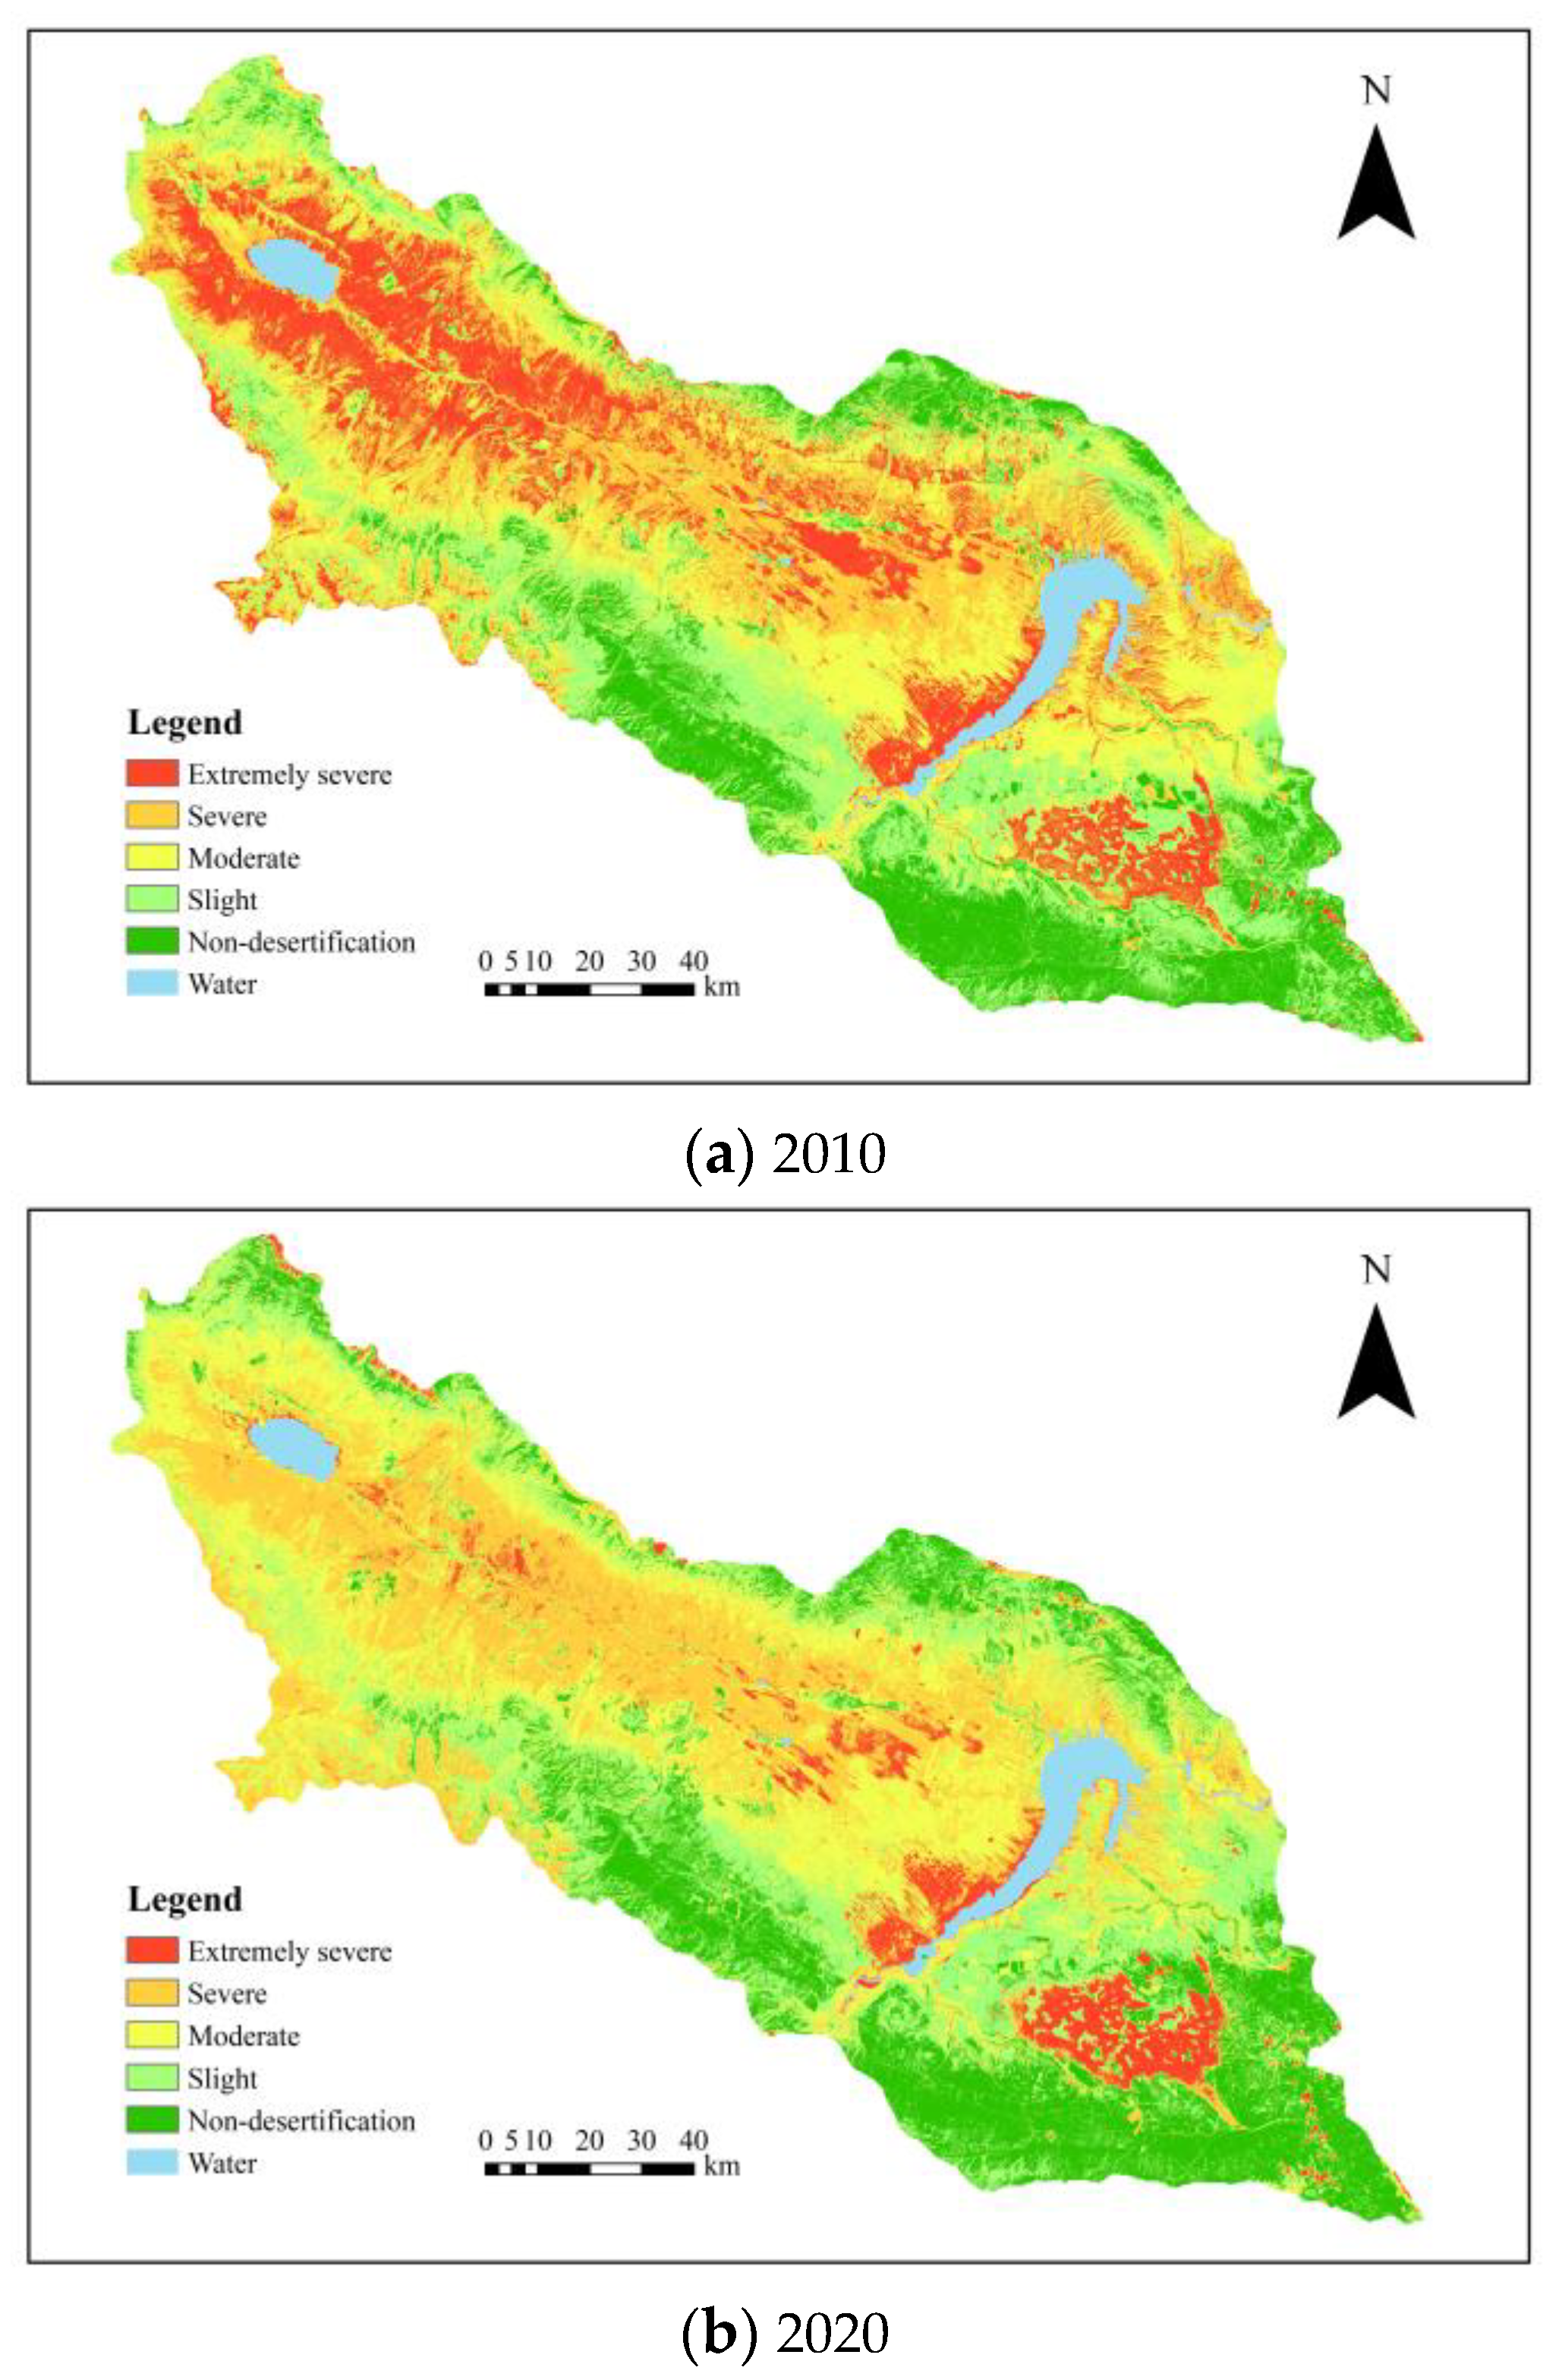
3.3. Spatial Distribution Characteristics of Desertification

According to the spatial distribution maps of desertification in the Gonghe Basin (Figure 4), we analyzed the dynamic changes in the spatial distribution pattern of desertification in the Gonghe Basin from 2010 to 2020. As shown in Figure 4, desertification was widespread in the Gonghe Basin, the lowlands in the central part of the basin were a concentrated distribution area of desertification, non-desertification areas were mainly spread in the south and southeast areas or on the mountains around the basin.
As shown in Figure 4a, there were large areas of extremely severe desertification around the Shazhuyu River, Mugetan, Talatan and other areas around the Longyangxia Reservoir in 2010. And in the periphery of extremely severe desertification, there were large areas of severe desertification, such as in the center of the basin or around the Longyangxia Reservoir. Moderate desertification was mainly spread in the east of Longyangxia Reservoir, such as Shagou Town, Longyangxia Town, etc. Slight desertification land was spread mainly in the southern and southeastern parts of the study area, such as the northern part of Heka Town and the northwest part of the mobile dunes in Mugetan. Non-desertification was distributed mainly in the Heka Town, Taxiu town, and Senduo town. Which were in the southern edge and southeast of the basin.
Compared with 2010, the overall desertification area had obviously reduced in 2020 (Figure 4b). The extremely severe desertification land spread in the western of the basin had been reduced significantly, mainly reversed to severe or moderate desertification. Meanwhile, the slight desertification and non-desertification land in the Gonghe Basin expanded to the south and southeast, and the non-desertification areas distributed around the northern marginal region increased during the study period.

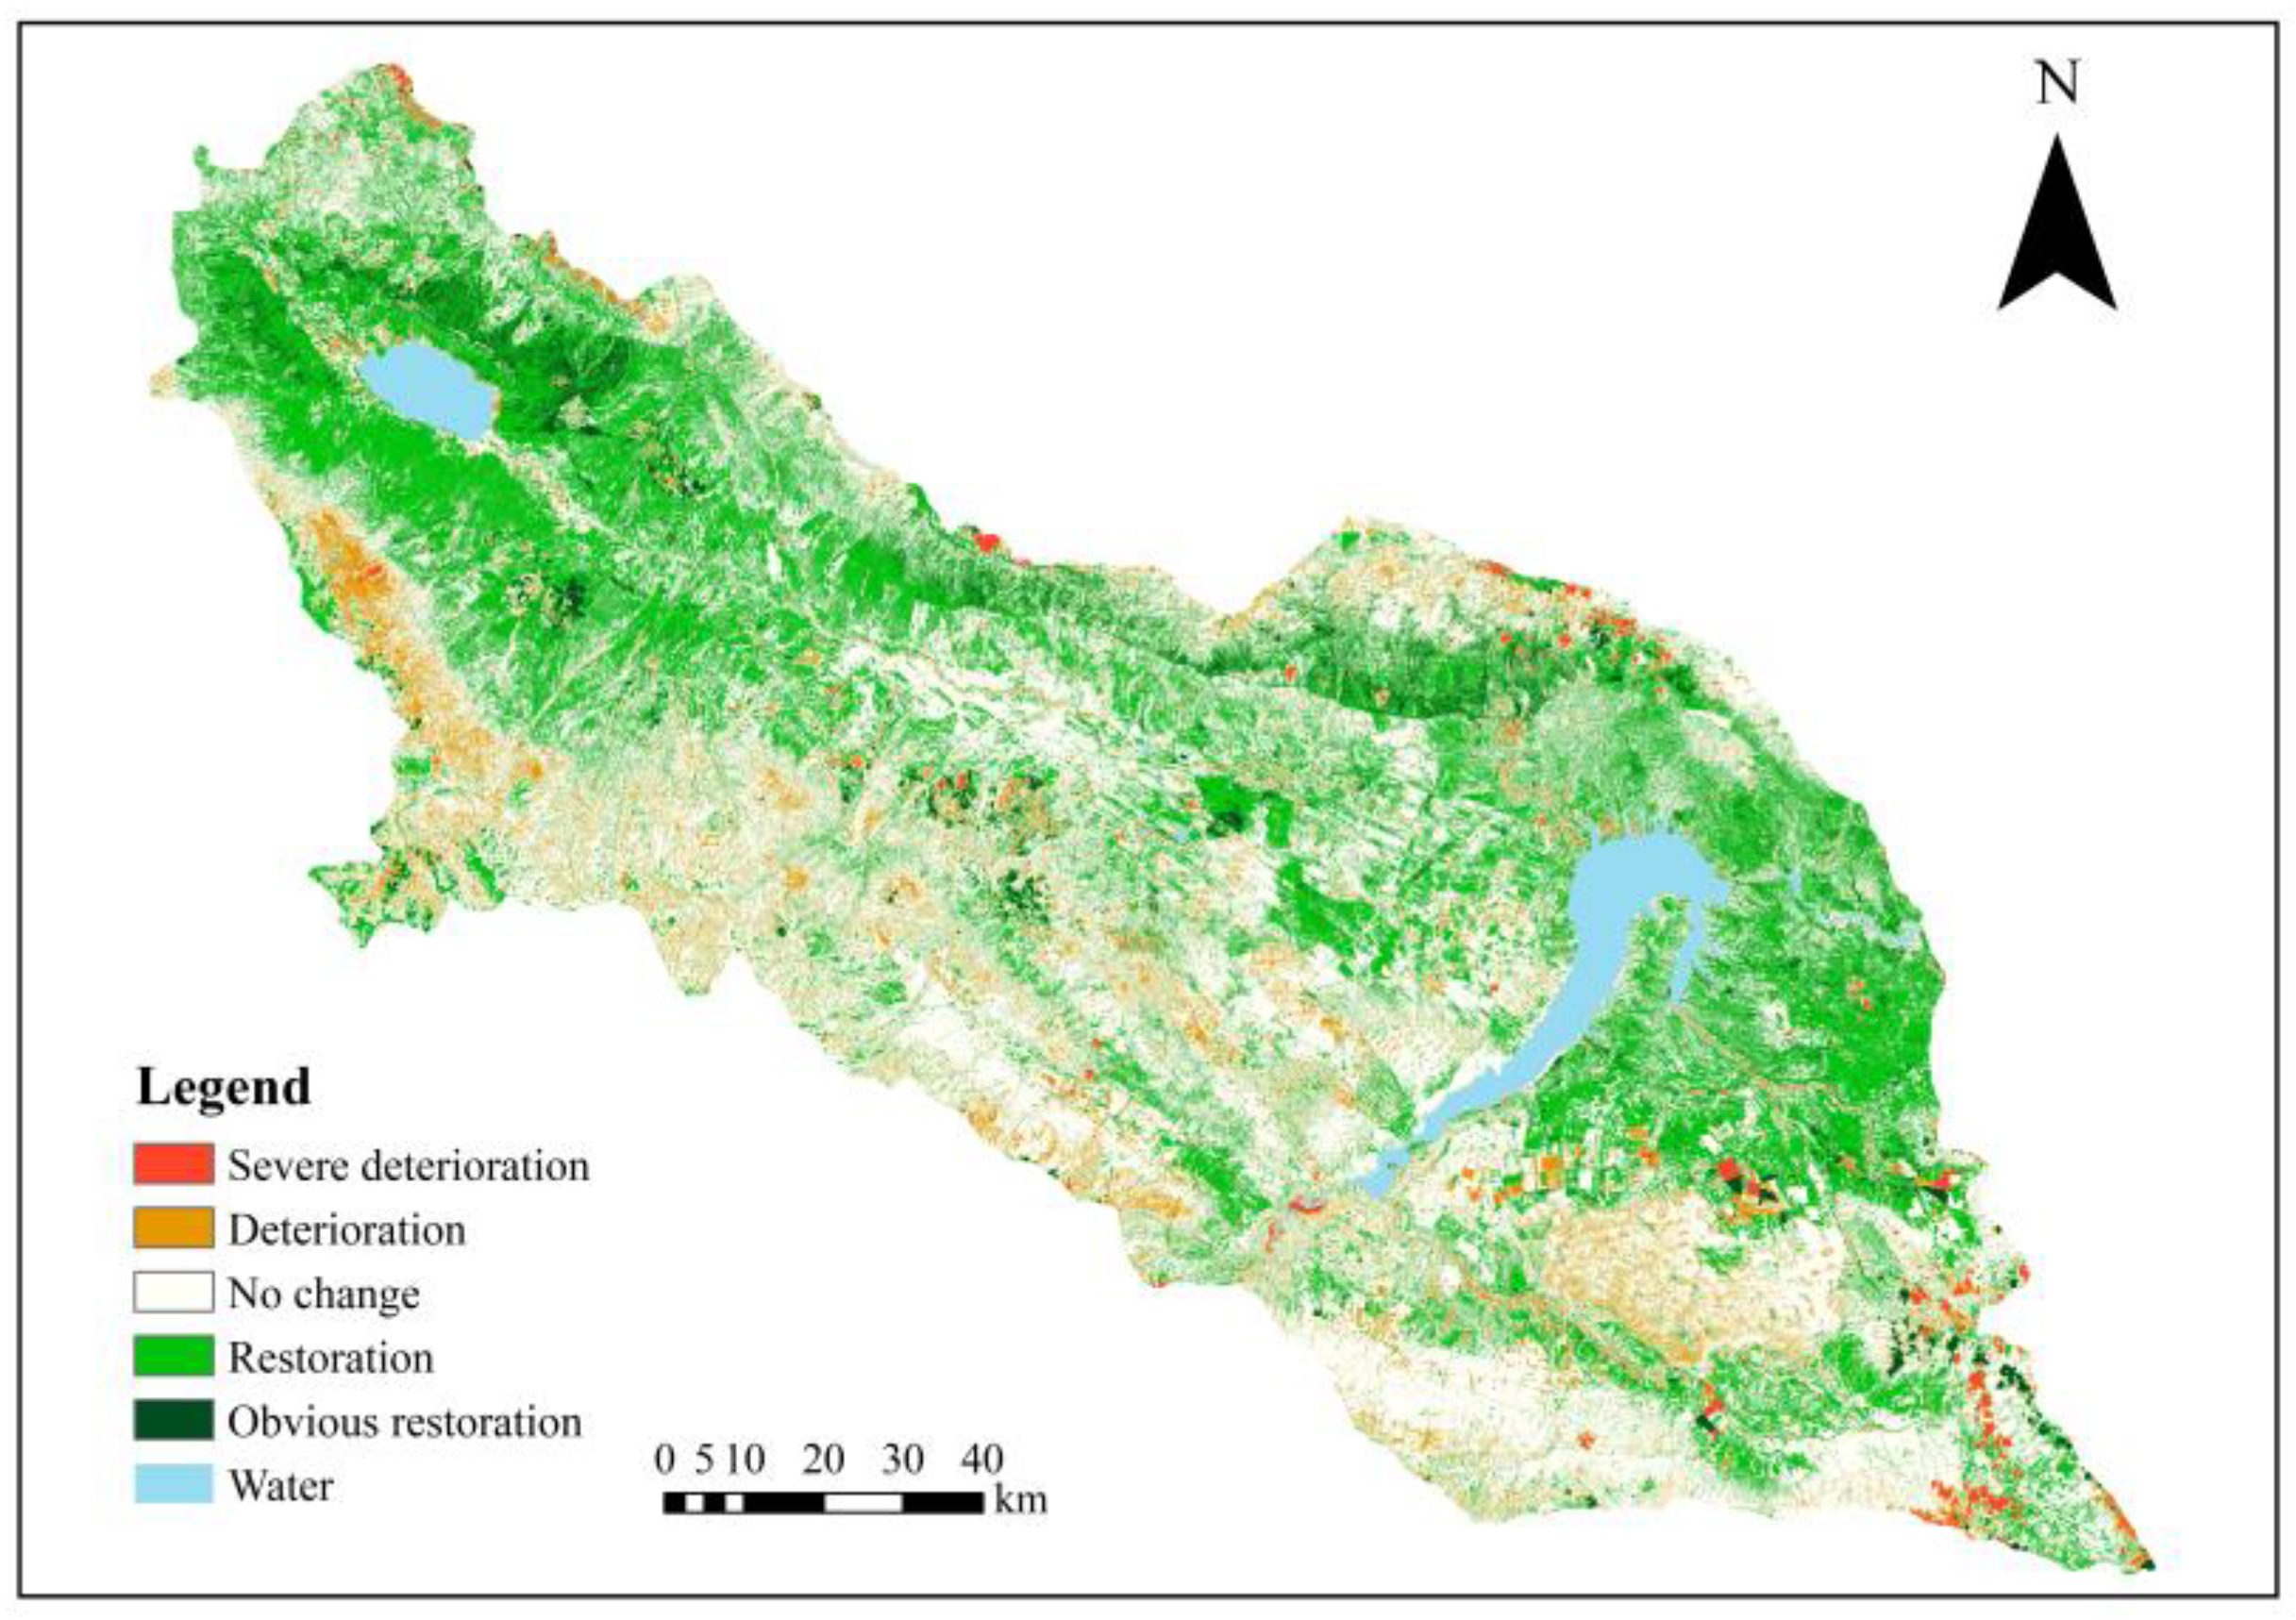
3.4. Changes in Desertification Intensity

We obtained the transition matrix of desertification in this study from 2010 to 2020, as shown in Table 4. During the research period, the transformation of desertification intensity occurred between different levels of desertification. The conversion area accounted for 83.69% of the total land area, which was 8959.19 km2. The main desertification transformations were mainly from extremely severe to severe, from severe to moderate, from moderate to slight, and from slight to non-desertification, covering land areas of 2213.94 km2, 1736.12 km2, 1418.13 km2, and 1256.56 km2, respectively, accounting for 24.71%, 19.38%, 15.83% and 14.03% of the land area. Extremely severe desertification significantly decreased by 2335.32 km2, and severe, moderate, slight and non-desertification increased by 592.13 km2, 687.33 km2, 228.4 km2, and 827.46 km2, respectively. This showed that the overall desertification condition in the Gonghe Basin had a great improvement from 2010 to 2020, and sand prevention and control achieved effective results.
As shown in the changes in desertification intensity from 2010 to 2020 (Figure 5), the degree of desertification development was divided into five categories. The desertification grade unchanged land was sporadically scattered, mainly in the mobile sand dunes of Mugetan and Talatan, accounting for 42.6% of the land in basin (Table 5). The deterioration areas were primarily spread in the southwest, southeast, and northeast of the Gonghe Basin. The restoration and obvious restoration areas were mainly distributed around Chaka Salt Lake and the east of Longyangxia Reservoir. Additionally, the proportion of desertification deterioration and restoration areas were 6.8% and 50.6%, respectively. Desertification restoration areas were 11,067 km2 larger than desertification deterioration areas.

3.5. The Influencing Factors of Desertification

In this research, we selected temperature, precipitation and wind velocity as natural factor indicators, population density, GDP, and land use as human factor indicators, used Geodetector for single factor and interactive factors analysis to explore the explanatory power of different factors on desertification in the Gonghe Basin.

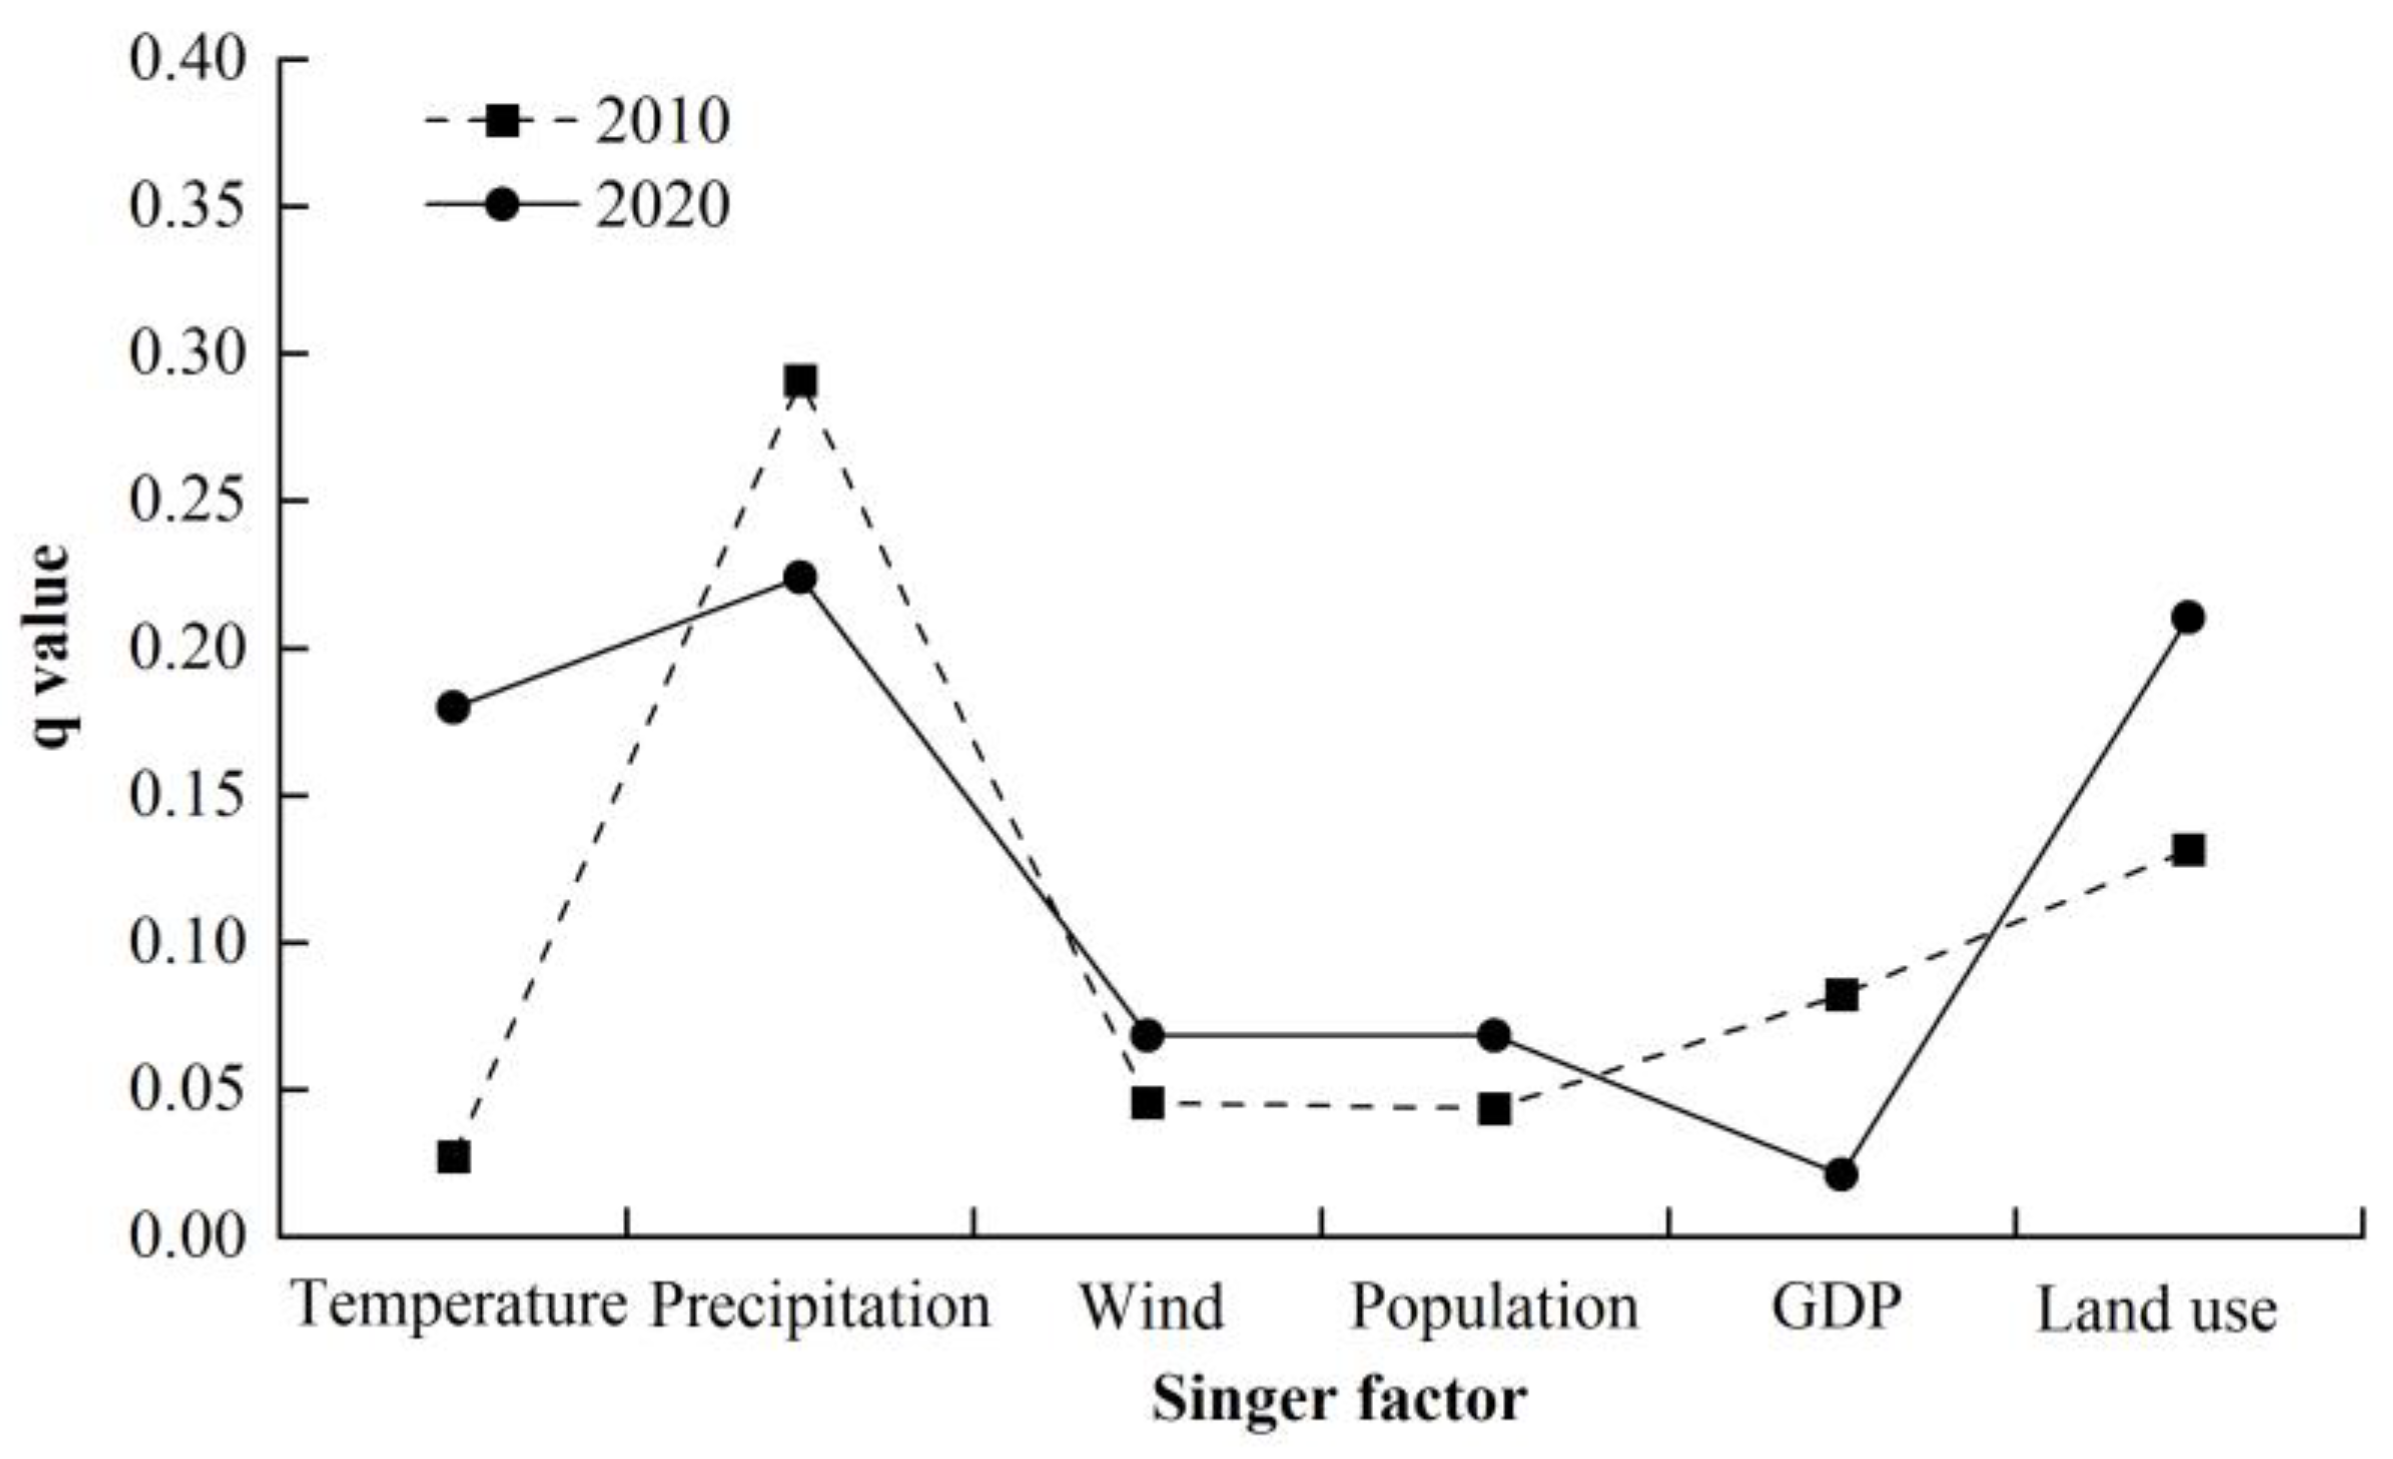
3.5.1. Singer Factor

As shown in Figure 6, for single factor analysis, the order of explanatory power of different factors on desertification in 2010 was precipitation > land use > GDP > population density > wind velocity > temperature. The precipitation was the main interfering factor of desertification, followed by human activities such as land use, GDP, and the impacts of the population density, wind velocity and temperature were relatively weak. The explanatory power of the q value on precipitation reached 0.29, but the explanatory power of temperature was only 0.03. In 2020, the explanatory power of q values on different factors was precipitation > land use > temperature > wind velocity > population density > GDP. The precipitation factor still had the greatest explanatory power on desertification, with a value of 0.22. The explanatory power of temperature and land use increased relatively, with values of 0.18 and 0.21, respectively. The q value of GDP had decreased to 0.02.

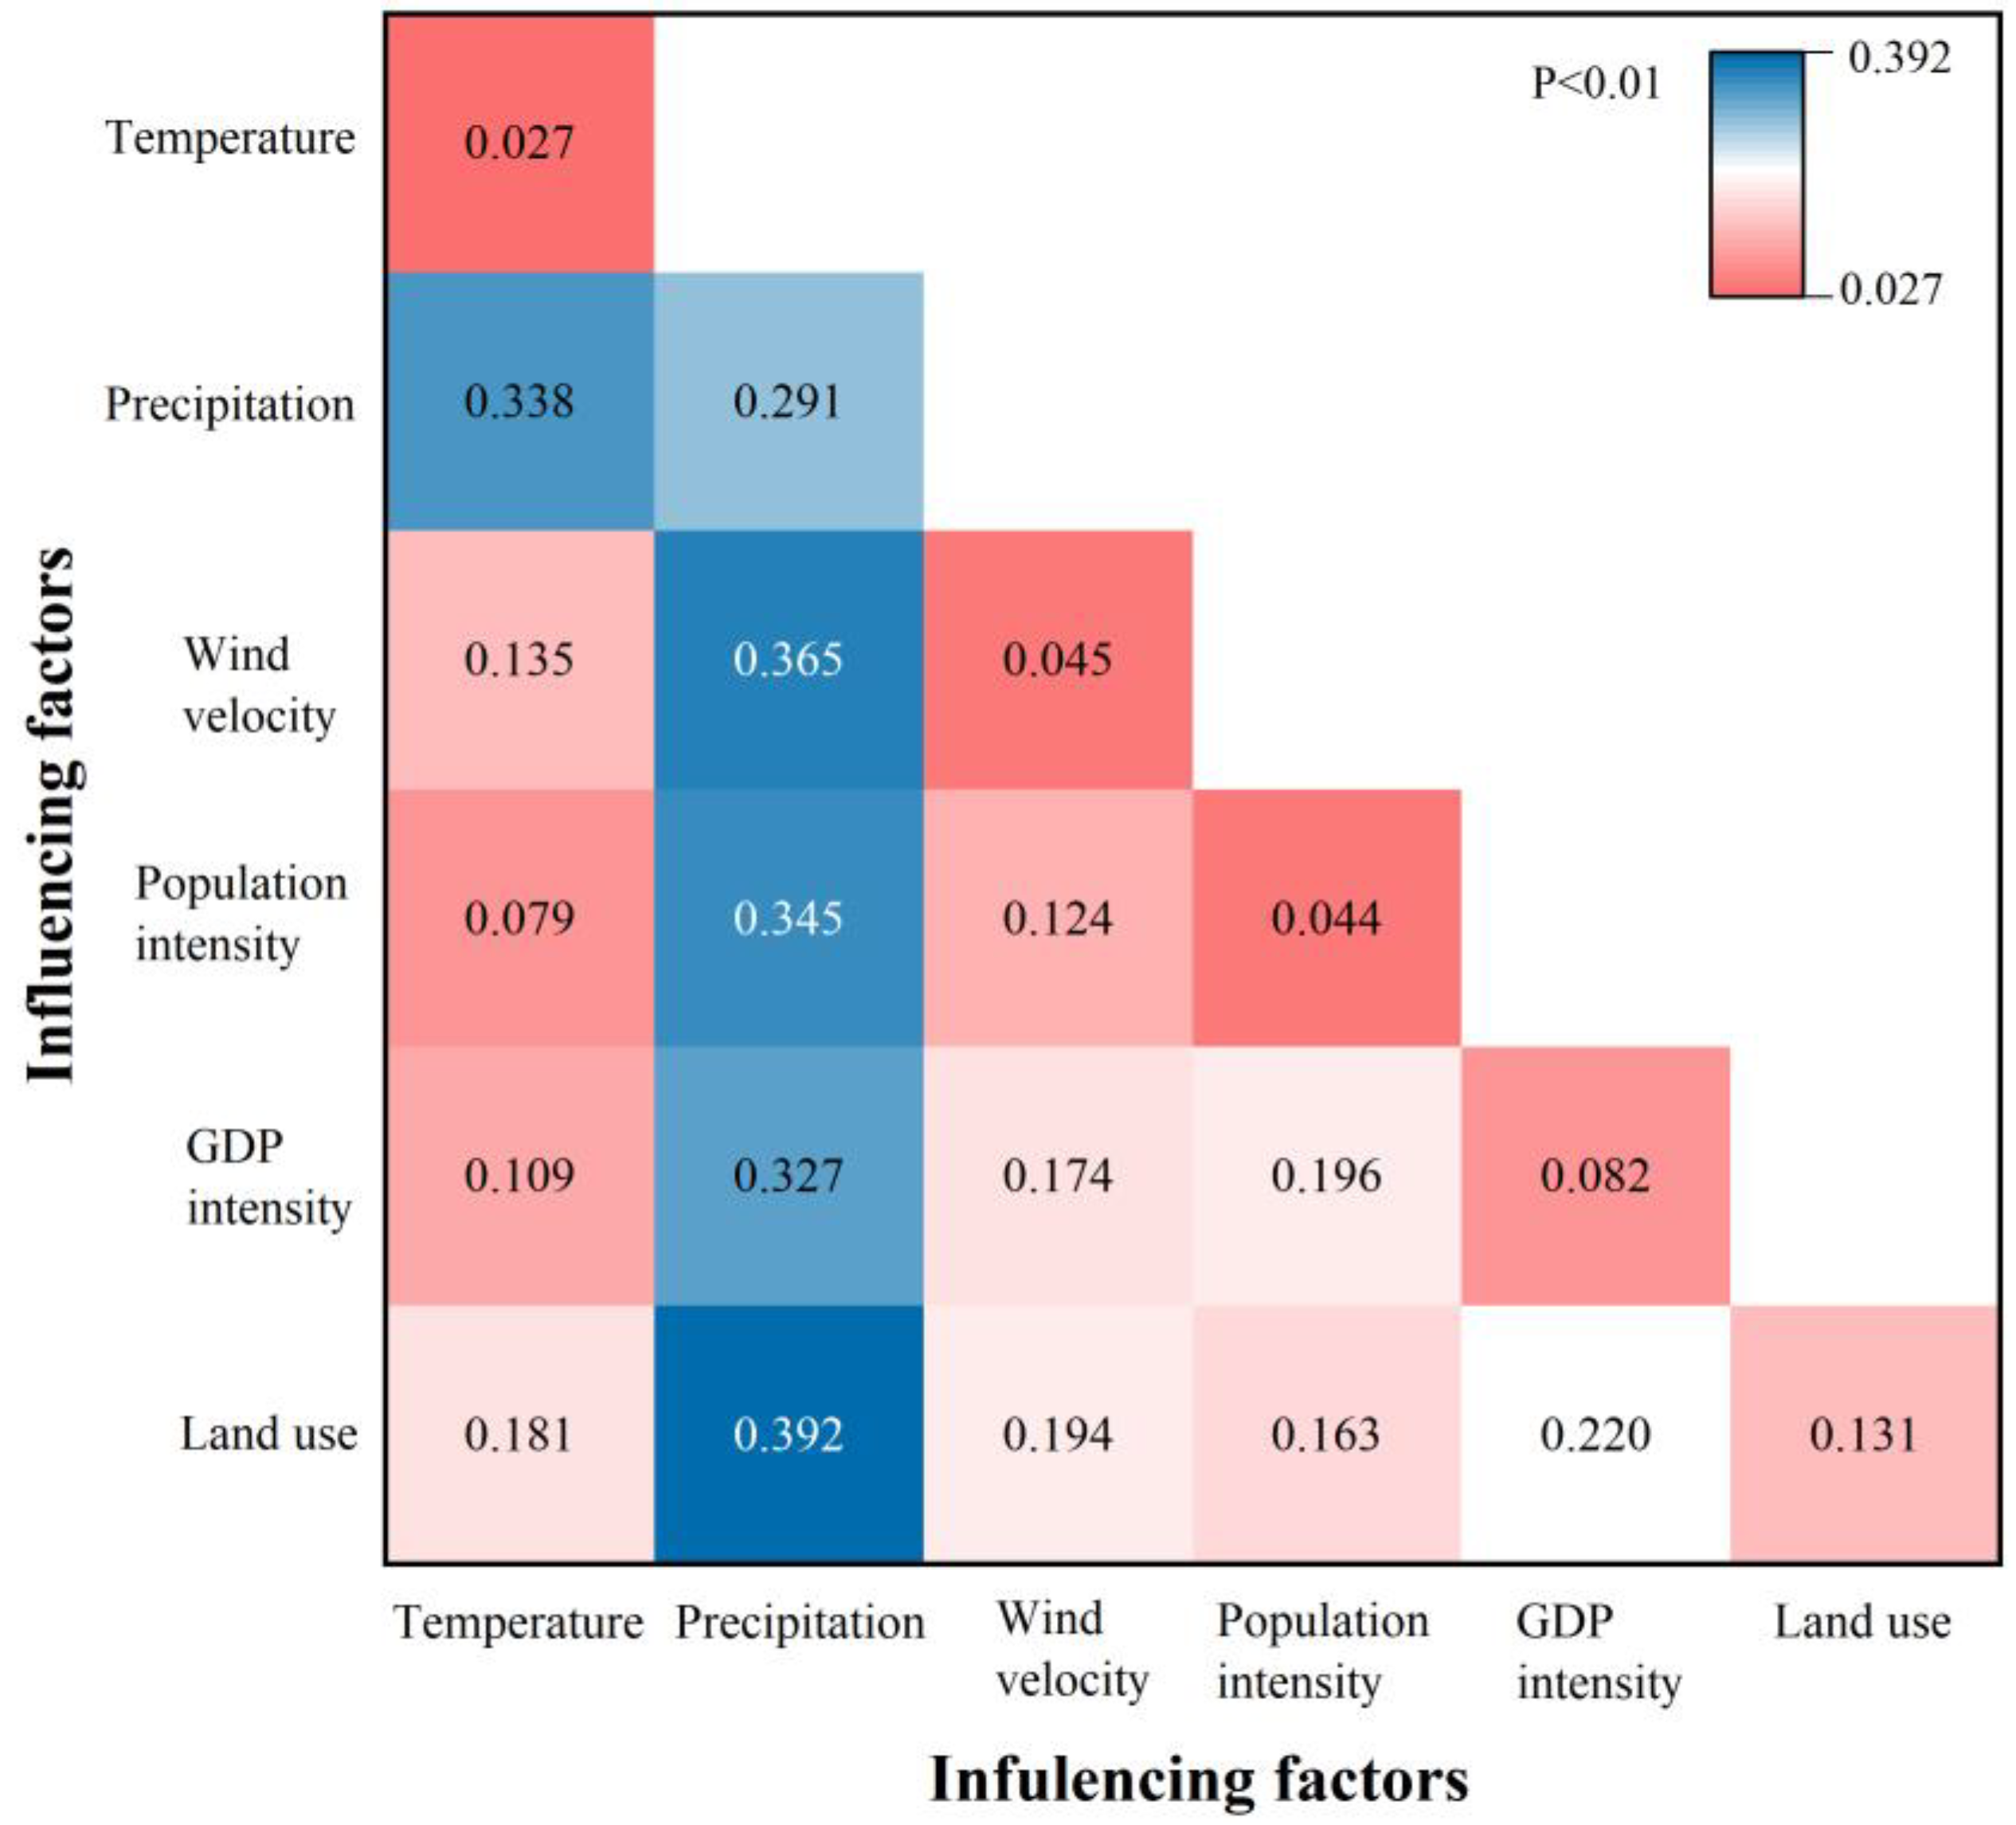
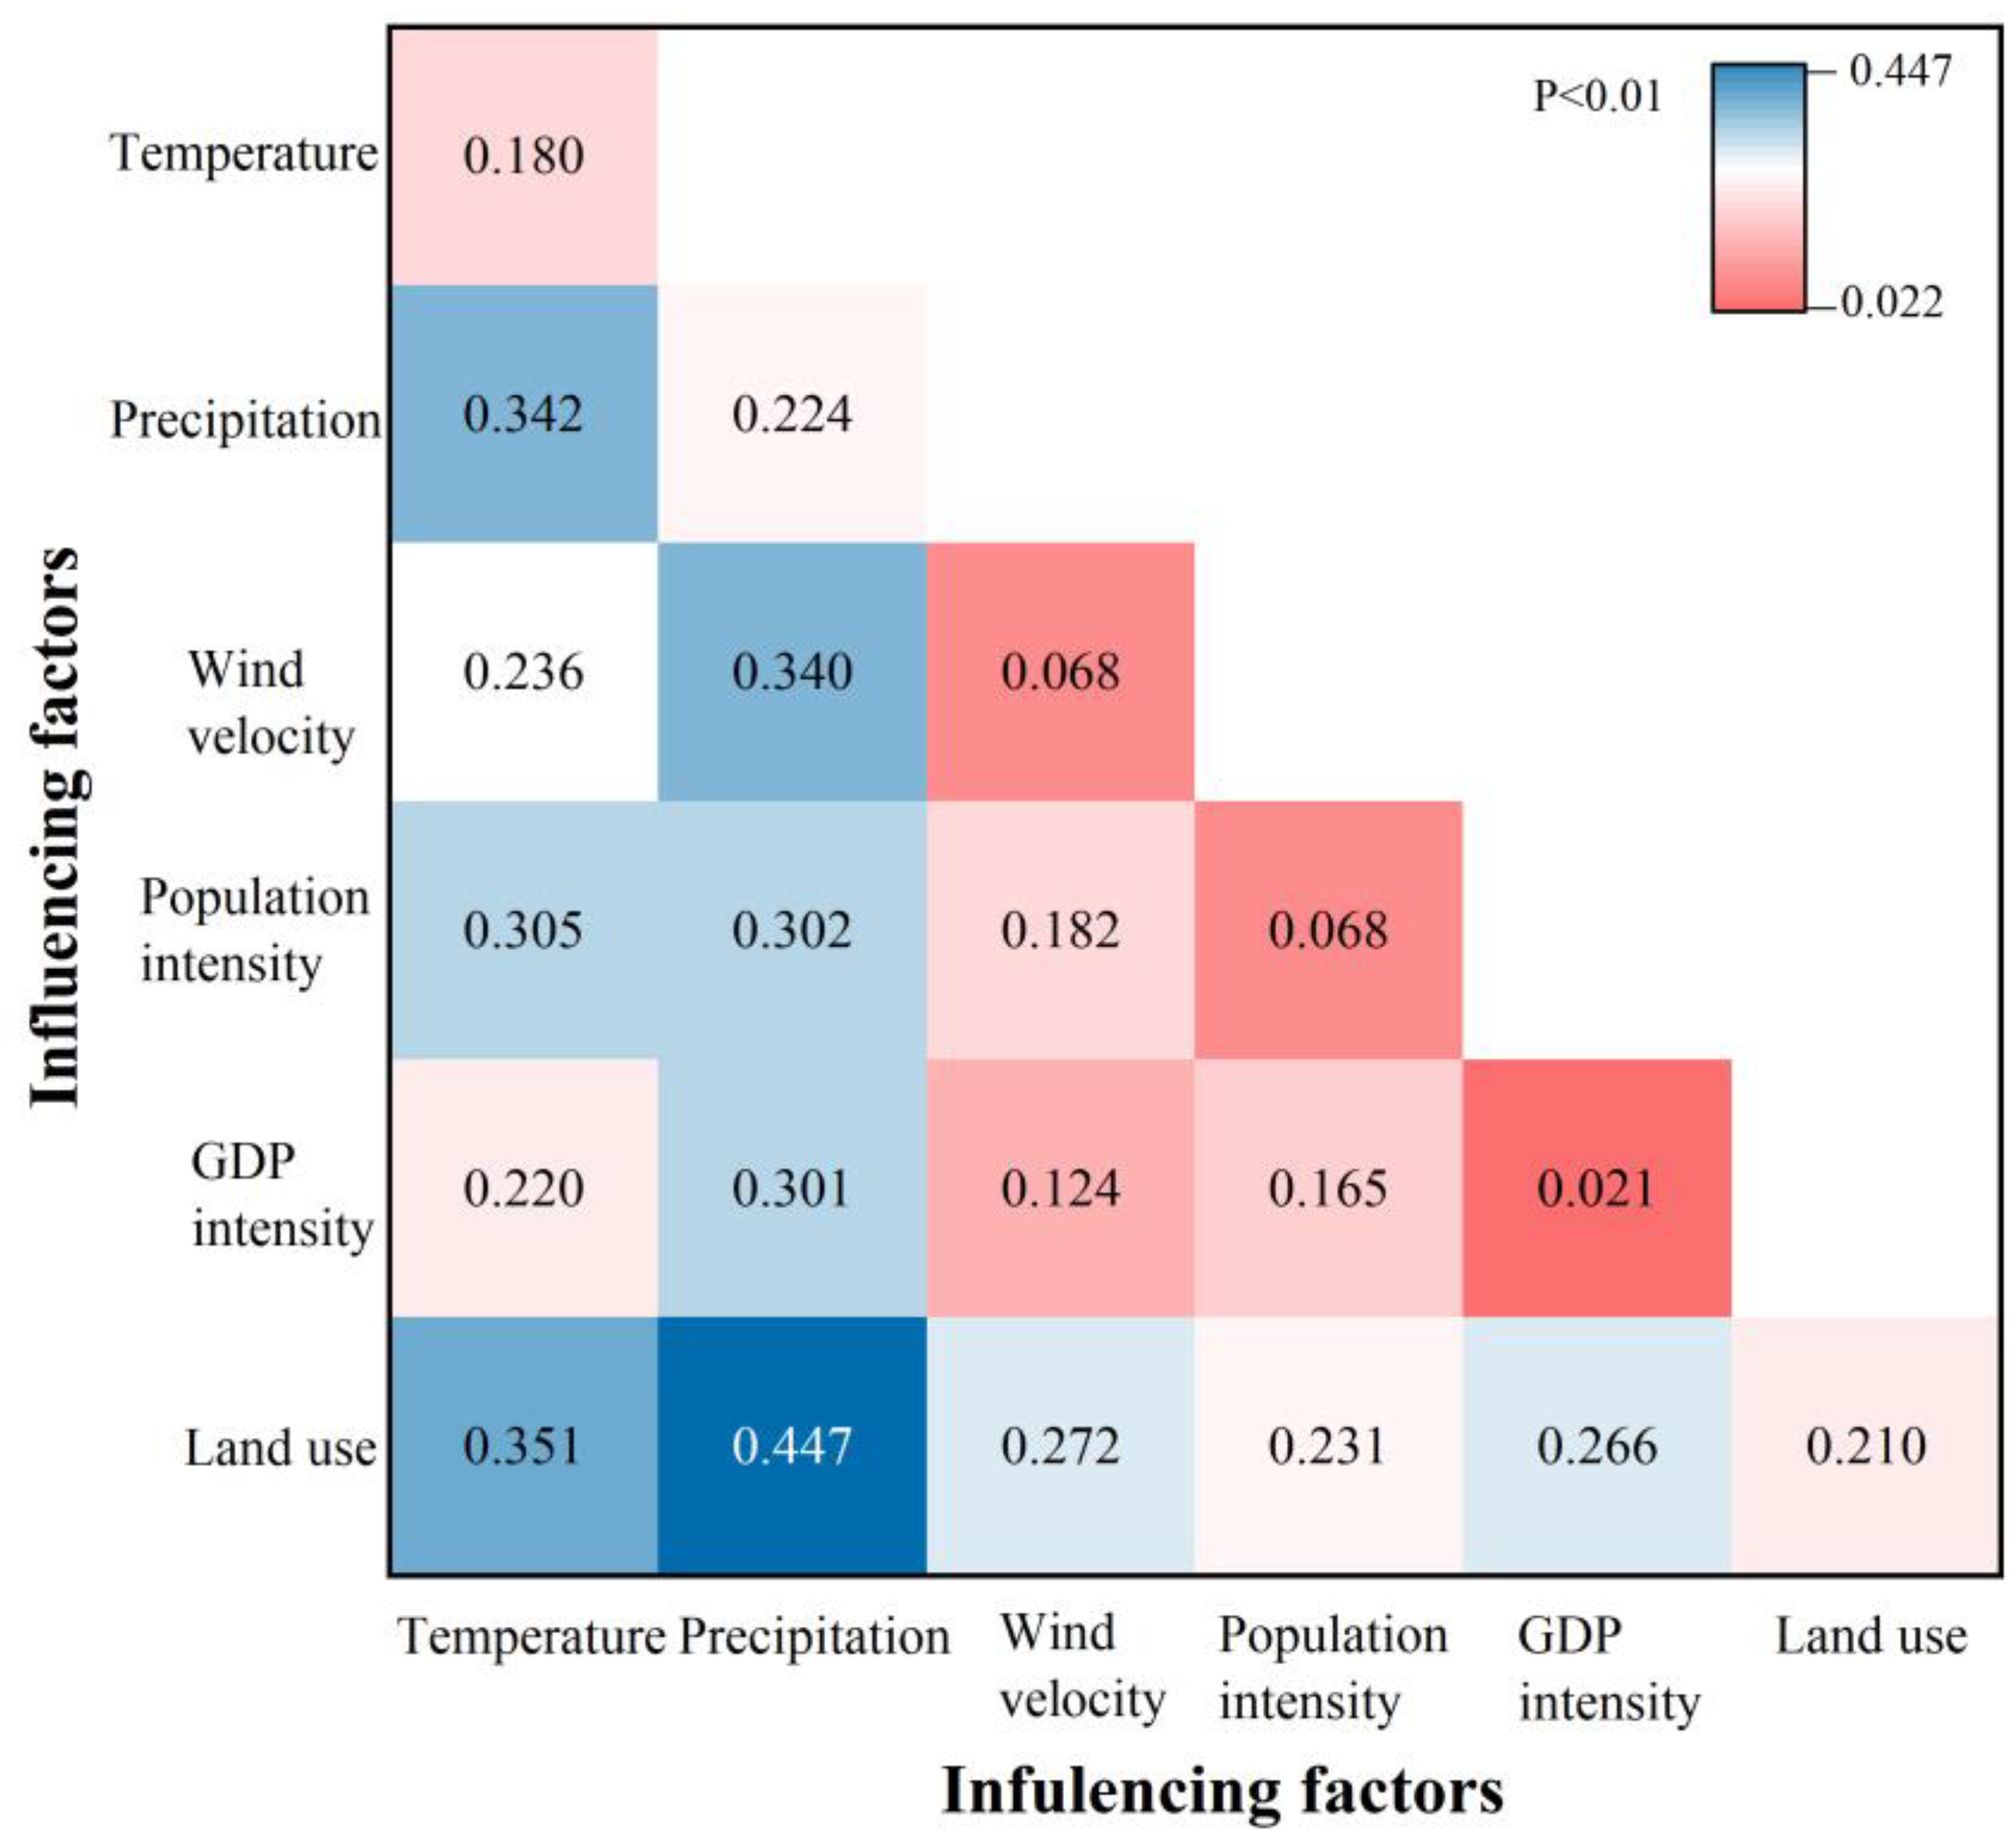
3.5.2. Interactive Factors

In this study, the influence between two factors was non-linear enhanced after interaction (Figure 7 and Figure 8). In 2010, the order of explanatory power of interaction factors on desertification was precipitation ∩ land use > precipitation ∩ wind velocity > precipitation ∩ population intensity > temperature ∩ precipitation > precipitation ∩ GDP intensity > GDP intensity ∩ land use > population density ∩ GDP intensity. The dominant interactive factor was precipitation ∩ land use (0.392), followed by precipitation ∩ wind velocity (0.365) and precipitation ∩ population intensity (0.345). The q value of temperature ∩ population density was the smallest, which is 0.079. In 2020, the order of explanatory power of interaction factors on desertification was precipitation ∩ land use > temperature ∩ land use > temperature ∩ precipitation > precipitation ∩ wind velocity > temperature ∩ population intensity > precipitation ∩ population intensity > precipitation ∩ GDP intensity. Among them, the precipitation ∩ land use also had the greatest explanatory power on desertification evolution, the q value increased to 0.447, followed by temperature ∩ land use and temperature ∩ precipitation, their q values were 0.351 and 0.340, respectively. All in all, the precipitation ∩ land use was the essential factor influencing the spatiotemporal distribution of desertification in the Gonghe Basin during the study period.

4. Discussion

Previous studies have shown that desertification evolution is influenced by natural factors and human activities [26,27,49]. For natural factors, the terrain of the Gonghe Basin is flat and open, providing a good deposition site for the aeolian activity. The basin contained a large amount of Quaternary loose sediments, such as fluvial-lacustrine sediments and ancient aeolian sand [9], which are easily eroded by wind [26], which provided material sources for aeolian activity, causing widespread distribution of desertification land [12]. Among all natural factors, climate change has an essential impact on the development of desertification, temperature, precipitation and wind velocity are the main influencing factors [50,51]. The explanatory power of precipitation factors on desertification was highest among all factors in 2010 and 2020, the explanatory power of temperature and wind velocity on desertification evolution increased between 2010 and 2020, with q values increasing by 0.15 and 0.02, respectively. In northwestern China, the climate is arid all year with scarce precipitation [15], so the precipitation factor played a vital role in the desertification evolution. As shown in Figure 9 and Figure 10, in the Gonghe Basin, we can see a fluctuating downward trend in the annual average temperature from 2010 to 2019, but there was an upward trend in the annual precipitation, which revealing that the climate had become colder and more humid over the past 10 years. The decrease in temperature could effectively reduce evaporation, while accompanied by the increase of precipitation, the improvement of hydrothermal conditions was conducive to the vegetation recovery, affecting the efficiency of sand material acquisition, which reduced aeolian activity [12,52,53,54,55]. The annual mean wind velocity also presented a relative downward trend (Figure 11), and reduced wind strength led to the weakening of aeolian activity [56]. In general, these favorable natural factors changes were beneficial to the desertification reversal. Among the changes in human factors, the q values of land use and population density increased by 0.08 and 0.03 respectively, while the value of GDP density decreased by 0.06. From this, it can be seen that the impact of human activities gradually increased during the desertification evolution of the Gonghe Basin from 2010 to 2020.
However, the interaction between two different impact factors will increase the explanatory power on desertification compared to single factors [57]. The dominant interactive factor in 2010 and 2020 was precipitation ∩ land use, with an increase of 0.055. In 2020, The explanatory power of temperature ∩ land use on desertification had significantly increased, with an increase of 0.17 compared to 2010. In 2010 and 2020, the q values of temperature ∩ precipitation were relatively high, both greater than 0.3. The results showed that the natural factors such as precipitation ∩ temperature played a fundamental role in the desertification change. Furthermore, the improvement of desertification conditions was the combination consequences of natural and human factors, the impact of human activity intensity had been increasing over the past 10 years. This is consistent with previous research on the Qinghai Tibet Plateau [26,27], the source of the Yellow River [35], and the surrounding areas of Qinghai Lake [30]. However, the highest explanatory power of precipitation and land use on desertification in this study is only 0.447, which may be related to the specific geological environment in the Gonghe Basin and the limited factors selection [35,58]. Since 1991, numerous measures have been applied to combat desertification. Tree planting and return the grain plots to forestry reforestation projects can help increase vegetation coverage and improve ecological diversity [59,60]. The photovoltaic power generation base and closed protection zone were established in Talatan [61,62], it is conducive to prevent wind and fix sand, thereby reducing local aeolian activities.

5. Conclusions

In this paper, we used the Albedo-NDVI feature space method based on Landsat images to explore the spatiotemporal evolution of desertification and its driving mechanism in the Gonghe Basin over the past 10 years, and then provide some scientific references for desertification prevention. The main conclusions are as follows:
(1) Desertification in the Gonghe Basin was divided into 5 categories by constructing the Albedo-NDVI feature space. There was high accuracy in the desertification classification by using the feature space method, reaching 94% in 2010 and 95% in 2020.
(2) From 2010 to 2020, the desertification situation in the Gonghe Basin generally improved, especially in the western part of the basin. The proportion of desertification area decreased from 84.3% in 2010 to 80.1% in 2020. The transformation from extremely severe desertification to severe desertification is the main form of desertification reversal.
(3) The improvement of desertification in the Gonghe Basin from 2010 to 2020 is a result of the combined effects of natural and human factors. In natural factors, precipitation played an important role in desertification evolution, and the impact of human factors was gradually increasing.
However, our study still has some limitations. Due to limited data in this study, there are some errors in the classification results of desertification. It is crucial to explore the dominant driving mechanism of desertification on different time scales, and provide targeted suggestions for desertification control in the Gonghe Basin.

Author Contributions

Conceptualization, H.J. and J.L.; data curation and investigation, H.J., R.W., H.L., B.D. and H.Z.; methodology, H.J., L.G., L.L. and J.L.; writing—original draft, H.J.; writing—review and editing, H.J. and J.L.; All authors have read and agreed to the published version of the manuscript.

Funding

This research was funded by the the National Natural Science Foundation of China (No. 41730639), and the Second Tibetan Plateau Scientific Expedition and Research Program (STEP, Grant No. 2019QZKK0906).

Institutional Review Board Statement

Not applicable.

Informed Consent Statement

Not applicable.

Data Availability Statement

The source of relevant data acquisition has been described in the text.

Conflicts of Interest

The authors declare no conflict of interest.

References

  1. Wang, T.; Zhu, Z.D. Study on Sandy Desertification in China–1. Definition of Sandy Desertification and its Connotation. J. Desert Res. 2003, 23, 209–214. [Google Scholar]
  2. UNCED. Managing Fragile Ecosystems: Combating Desertification and Drought. In Proceedings of the United Nations Conference on Environment and Development, Rio de Janeiro, Brazil, 3–14 June 1992. [Google Scholar]
  3. Zhu, Z.D.; Chen, G.T. Sandy Desertification in China; Science Press: Beijing, China, 1994; pp. 20–33. [Google Scholar]
  4. Adger, W.N.; Benjaminsen, T.A.; Brown, K.; Svarstad, H. Advancing a Political Ecology of Global Environmental Discourses. Dev. Change. 2001, 32, 681–715. [Google Scholar] [CrossRef]
  5. Dong, Y.X. Progresses and Problems in Research on Sandy Desertification in Qinghai-Xizang Plateau. J. Desert Res. 1999, 19, 54–58. [Google Scholar]
  6. Zhang, D.S. Quantitative Analysis of Influential Factors on Land Desertification in Qinghai Gonghe Basin. J. Desert Res. 2000, 20, 60–63. [Google Scholar]
  7. Li, S.; Dong, Y.X.; Dong, G.R.; Yang, P.; Zhang, C.L. Regionalization of Land Desertification on Qinghai-Tebet Plateau. J. Desert Res. 2001, 21, 418–427. [Google Scholar]
  8. Lu, H.Y.; Miao, X.D.; Zhou, Y.L.; Mason, J.; Swinehart, J.; Zhang, J.F.; Zhou, L.P.; Yi, S.W. Late Quaternary aeolian activity in the Mu Us and Otindag dune fields (north China) and lagged response to insolation forcing. Geophys. Res. Lett. 2005, 32, L21716. [Google Scholar] [CrossRef]
  9. Xu, S.Y.; Xu, D.F.; Shi, S.R. Aeolian Sand Deposits in The Gonghe Basin, Qinghai Province. J. Desert Res. 1982, 2, 5–12. [Google Scholar]
  10. Qiang, M.R.; Chen, F.H.; Song, L.; Liu, X.X.; Li, M.Z.; Wang, Q. Late Quaternary Aeolian Activity in Gonghe Basin, Northeastern Qinghai-Tibetan Plateau, China. Quat. Res. 2013, 79, 403–412. [Google Scholar] [CrossRef]
  11. Xu, S.Y. Depositional Period and Sedimentary Environment of Gonghe Series in the Qinghai Province, China. J. Lanzhou Univ. (Nat. Sci.) 1987, 23, 109–119. [Google Scholar]
  12. Qiang, M.R.; Jin, Y.X.; Liu, X.X.; Song, L.; Li, H.; Li, F.S.; Chen, F.H. Late Pleistocene and Holocene Aeolian Sedimentation in Gonghe Basin, Northeastern Qinghai-Tibetan Plateau: Variability, Processes, and Climatic Implications. Quat. Sci. Rev. 2016, 132, 57–73. [Google Scholar] [CrossRef]
  13. Liu, L. The Formation and Evolution of Aeolian Environment in the Gonghe Basin. Master’s Thesis, Lanzhou University, Lanzhou, China, 2018. [Google Scholar]
  14. Liu, B.; Jin, H.L.; Sun, Z.; Su, Z.Z.; Zhang, C.X. Spatiotemporal Evolution of Sandy Land in the Gonghe Basin during the Holocene Period and Its Possible Driving Mechanism. J. Desert Res. 2014, 34, 982–991. [Google Scholar]
  15. Dong, G.R.; Gao, S.Y.; Jin, J.; Li, B.S.; Zhou, G.C. Land Desertification and Its Control in Gonghe Basin, Qinghai Province. J. Desert Res. 1989, 9, 61–71. [Google Scholar]
  16. Chen, Z.Y.; Dong, Z.B.; E, C.Y.; Wang, Q.C. Characteristics of wind regime and its variation trend in the Gonghe Basin from 1971 to 2015. J. Lanzhou Univ. (Nat. Sci.) 2020, 56, 224–230. [Google Scholar]
  17. Yang, S.Q.; Gao, W.S.; Sui, P.; Chen, Y.Q. Quantitative research on factors of soil desertification in Gonghe basin. Acta Ecol. Sin. 2005, 25, 3182–3187. [Google Scholar]
  18. Guo, L.Y.; Ding, S.X.; Wang, Q.C. Climate change and human activities of Gonghe Basin and its impact on eco-environment. Agric. Res. Arid Areas. 2009, 27, 219–226. [Google Scholar]
  19. Li, X.Y.; Yao, Z.Y.; Dong, Z.B. Driving Mechanism of Aeolian Desertification in Gonghe Basin of Qinghai Province. Bull. Soil Water Conserv. 2018, 38, 337–344. [Google Scholar]
  20. Hostert, P.; Roder, A.; Jarmer, T.; Udelhoven, T.; Hill, J. The potential of remote sensing and GIS for desertification monitoring and assessment. Ann. Arid Zone 2001, 40, 103–140. [Google Scholar]
  21. Runnstrom, M.C. Rangeland development of the Mu Us sandy land in semiarid China: An analysis using Landsat and NOAA remote sensing data. Land Degrad. Develop. 2003, 14, 189–202. [Google Scholar] [CrossRef]
  22. Collado, A.D.; Chuvieco, E.; Camarasa, A. Satellite remote sensing analysis to monitor desertification processes in the crop-rangeland boundary of Argentina. J. Arid Environ. 2002, 52, 121–133. [Google Scholar] [CrossRef]
  23. Qi, Y.B.; Chang, Q.R.; Jia, K.L.; Liu, M.Y.; Liu, J.; Chen, T. Temporal-Spatial Variability of Desertification in an Agro-Pastoral Transitional Zone of Northern Shaanxi Province, China. Catena 2012, 88, 37–45. [Google Scholar] [CrossRef]
  24. Yan, C.Z.; Song, X.; Zhou, Y.M.; Duan, H.C.; Li, S. Assessment of Aeolian Desertification Trends from 1975′s to 2005′s in the Watershed of the Longyangxia Reservoir in the Upper Reaches of China’s Yellow River. Geomorphology 2009, 112, 205–211. [Google Scholar] [CrossRef]
  25. Ma, Y.J.; Sha, Z.J.; Chen, X.J.; Fu, G.Y.; Ye, M.; Ma, J.L.; Zhai, Y.L. Desertificated land changes in Gonghe Basin from 1990 to 2010. J. Arid Land 2016, 30, 176–181. [Google Scholar]
  26. Zhang, C.L.; Li, Q.; Shen, Y.P.; Zhou, N.; Wang, X.S.; Li, J.; Jia, W.-R. Monitoring of Aeolian Desertification on the Qinghai-Tibet Plateau from the 1970s to 2015 Using Landsat Images. Sci. Total. Environ. 2018, 619–620, 1648–1659. [Google Scholar] [CrossRef] [PubMed]
  27. Li, Q.; Zhang, C.L.; Shen, Y.P.; Jia, W.R.; Li, J. Quantitative Assessment of the Relative Roles of Climate Change and Human Activities in Desertification Processes on the Qinghai-Tibet Plateau Based on Net Primary Productivity. Catena 2016, 147, 789–796. [Google Scholar] [CrossRef]
  28. Javier, T.; Silva, P.; Barbosa, A.A.; Rodriguez, D.A.; De, O.; Sestini, M.F. Desertification trends in the northeast of Brazil over the period 2000–2016. Int. J. Appl. Earth Obs. 2018, 73, 197–206. [Google Scholar] [CrossRef]
  29. Ding, C.; Huang, W.; Li, Y.; Zhao, S.; Huang, F. Nonlinear changes in dryland vegetation greenness over east Inner Mongolia, China, in recent years from satellite time series. Sensors 2020, 20, 3839. [Google Scholar] [CrossRef]
  30. Zhou, Y.Q.; Hu, Z.W.; Geng, Q.Q.; Ma, J.R.; Liu, J.Y.; Wang, M.; Wang, Y.C. Monitoring and analysis of desertification surrounding Qinghai Lake (China) using remote sensing big data. Environ. Sci. Pollut. Res. 2023, 30, 17420–17436. [Google Scholar] [CrossRef]
  31. Zeng, Y.N.; Xiang, N.P.; Feng, Z.D.; Hu, H. Albedo-NDVI space and remote sensing synthesis index models for desertification monitoring. J. Sci. Geogr. Sin. 2006, 26, 75–81. [Google Scholar]
  32. Lamaamri, M.; Lghabi, N.; Ghazi, A.; El Harchaoui, N.; Adnan, M.S.G.; Shakiul Islam, M. Evaluation of Desertification in the Middle Moulouya Basin (North-East Morocco) Using Sentinel-2 Images and Spectral Index Techniques. Earth Syst. Environ. 2022, 1–20. [Google Scholar] [CrossRef]
  33. Becerril-Piña, R.; Díaz-Delgado, C.; Mastachi-Loza, C.A.; González-Sosa, E. Integration of remote sensing techniques for monitoring desertification in Mexico. Hum. Ecol. Risk Assess 2016, 22, 1323–1340. [Google Scholar] [CrossRef]
  34. Wei, H.S.; Wang, J.L.; Cheng, K.; Li, G.; Ochir, A.; Davaasuren, D.; Chonokhuu, S. Desertification Information Extraction Based on Feature Space Combinations on the Mongolian Plateau. Remote. Sens. 2018, 10, 1614. [Google Scholar] [CrossRef]
  35. Guo, B.; Wei, C.X.; Yu, Y.; Liu, Y.F.; Li, J.L.; Meng, C.; Cai, Y.M. The Dominant Influencing Factors of Desertification Changes in the Source Region of Yellow River: Climate Change or Human Activity? Sci. Total. Environ. 2022, 813, 152512. [Google Scholar] [CrossRef] [PubMed]
  36. Li, S.; Yan, C.Z.; Song, X.; Xie, J.L.; Duan, H.C. Remote Sensing Investigation of Aeolian Desertification in Longyangxia Reservoir in Rencent 30 Years. J. Desert Res. 2011, 31, 836–841. [Google Scholar]
  37. Qi, Y.H.; Pan, M.H.; Hao, Z.W.; Yang, A.N.; Xue, W.X. Variations in Aeolian Landform Patterns in the Gonghe Basin over the Last 30 Years. J. Mt. Sci. 2021, 18, 2034–2047. [Google Scholar] [CrossRef]
  38. Ma, H.R.; Xiao, F.J.; Dong, Z.B.; Nan, W.G.; Chen, H. Change of sandy desertification land and its driving factors in Gonghe county, Qinghai province from 2000 to 2020. J. Arid. Land Resour. Environ. 2022, 36, 139–148. [Google Scholar]
  39. Dong, G.R.; Gao, S.Y.; Jin, J. Desertification and Controls in the Gonghe Basin, Qinghai Province; Science Press: Beijing, China, 1993; pp. 1–166. [Google Scholar]
  40. Carlson, T.N.; Ripley, D.A. On the relation between NDVI, fractional vegetation cover, and leaf area index. Remote Sens. Environ. 1997, 62, 241–252. [Google Scholar] [CrossRef]
  41. Liang, S.L. Narrowband to broadband conversions of land surface albedo I: Algorithms. J. Remote Sens. Environ. 2001, 76, 213–238. [Google Scholar] [CrossRef]
  42. Pan, J.H.; Qin, X.J. Extracting desertification from landsat imagery using a feature space composed of vegetation index and albedo-a case study of Zhangye oasis and its adjacent areas. Sci. Surv. Mapp. 2010, 35, 193–195. [Google Scholar]
  43. Verstraete, M.M.; Pinty, B. Designing Optimal Spectral Indexes for Remote Sensing Applications. IEEE Trans. Geosci. Remote Sens. 1996, 34, 1254–1265. [Google Scholar] [CrossRef]
  44. Feng, Y.; Wang, S.; Zhao, M.; Zhou, L. Monitoring of Land Desertification Changes in Urat Front Banner from 2010 to 2020 Based on Remote Sensing Data. Water 2022, 14, 1777. [Google Scholar] [CrossRef]
  45. Huang, H.; Zhou, Y.; Qian, M.; Zeng, Z. Land Use Transition and Driving Forces in Chinese Loess Plateau: A Case Study from Pu County, Shanxi Province. Land 2021, 10, 67. [Google Scholar] [CrossRef]
  46. Wei, W.; Yu, X.; Zhang, M.Z.; Zhang, J.; Yuan, T.; Liu, C.F. Dynamics of desertification in the lower reaches of Shiyang River Basin, Northwest China during 1995-2018. Chin. J. Appl. Ecol. 2021, 32, 2098–2106. [Google Scholar]
  47. Wang, J.F.; Xu, C.D. Geodetector: Principle and prospective. Acta Geogr. Sin. 2017, 72, 117–134. [Google Scholar]
  48. Wang, X.J.; Liu, G.X.; Xiang, A.C.; Xiao, S.M.; Lin, D.R.; Lin, Y.B.; Lu, Y. Terrain gradient response of landscape ecological environment to land use and land cover change in the hilly watershed in South China. Ecol. Indic. 2023, 146, 109797. [Google Scholar] [CrossRef]
  49. Xu, D.Y.; Li, C.L.; Song, X.; Ren, H.Y. The Dynamics of Desertification in the Farming-Pastoral Region of North China over the Past 10years and Their Relationship to Climate Change and Human Activity. Catena 2014, 123, 11–22. [Google Scholar] [CrossRef]
  50. Lancaster, N.; Helm, A.P. Test of a Climatic Index of Dune Mobility Using Measurements from the Southwestern United States. Earth Surf. Process. Landforms 2000, 25, 197–207. [Google Scholar] [CrossRef]
  51. Wang, X.M.; Dong, Z.B.; Yan, P.; Zhang, J.W.; Qian, G.Q. Wind Energy Environments and Dunefield Activity in the Chinese Deserts. Geomorphology 2005, 65, 33–48. [Google Scholar] [CrossRef]
  52. Gao, Y.H.; Zhou, X.; Wang, Q.; Wang, C.Z.; Zhan, Z.M.; Chen, L.F.; Yan, J.X.; Qu, R. Vegetation Net Primary Productivity and Its Response to Climate Change during 2001–2008 in the Tibetan Plateau. Sci. Total. Environ. 2013, 444, 356–362. [Google Scholar] [CrossRef]
  53. Wang, X.M.; Hua, T.; Lang, L.L.; Ma, W.Y. Spatial Differences of Aeolian Desertification Responses to Climate in Arid Asia. Glob. Planet. Chang. 2017, 148, 22–28. [Google Scholar] [CrossRef]
  54. Duan, H.C.; Wang, T.; Xue, X.; Yan, C.Z. Dynamic Monitoring of Aeolian Desertification Based on Multiple Indicators in Horqin Sandy Land, China. Sci. Total. Environ. 2019, 650, 2374–2388. [Google Scholar] [CrossRef] [PubMed]
  55. Li, J.; Yao, Q.; Zhou, N.; Li, F. Modern Aeolian Desertification on the Tibetan Plateau under Climate Change. Land Degrad. Dev. 2020, 32, 1908–1916. [Google Scholar] [CrossRef]
  56. Wu, Z. Geomorphology of Wind-Drift Sands and Their Controlled Engineering; Science Press: Beijing, China, 2003. [Google Scholar]
  57. Chen, A.; Yang, X.C.; Guo, J.; Xing, X.Y.; Yang, D.; Xu, B. Synthesized remote sensing-based desertification index reveals ecological restoration and its driving forces in the northern sand-prevention belt of China. Ecol. Indic. 2021, 131, 108230. [Google Scholar] [CrossRef]
  58. Zhang, J.; Guan, Q.; Du, Q.; Ni, F.; Mi, J.; Luo, H.; Shao, W. Spatial and temporal dynamics of desertification and its driving mechanism in Hexi region. Land Degrad. Dev. 2022, 33, 3539–3556. [Google Scholar] [CrossRef]
  59. Xu, Z.W.; Hu, R.; Wang, K.X.; Mason, J.A.; Wu, S.Y.; Lu, H.Y. Recent Greening (1981-2013) in the Mu Us Dune Field, North-Central China, and Its Potential Causes. Land Degrad. Dev. 2018, 29, 1509–1520. [Google Scholar] [CrossRef]
  60. Wang, X.M.; Ge, Q.S.; Geng, X.; Wang, Z.S.; Gao, L.; Bryan, B.A.; Chen, S.Q.; Su, Y.N.; Cai, D.W.; Ye, J.S.; et al. Unintended Consequences of Combating Desertification in China. Nat. Commun. 2023, 14, 1139. [Google Scholar] [CrossRef] [PubMed]
  61. Yin, D.Y.; Ma, L.; Qu, J.J.; Zhao, S.P.; Yu, H.; Tan, L.H.; Xiao, J.H. Effect of Large Photovoltaic Power Station on Microclimate of Desert Region in Gonghe Basin. Bull. Soil Water Conserv. 2017, 37, 15–21. [Google Scholar]
  62. Xiao, J.H.; Si, J.H.; Liu, C.; Li, X.J.; Xi, H.Y.; Yu, T.F.; Zhang, C.Q.; Zhao, C.Y.; Zhu, M.; Jia, B. Concept, connotation and development model of Desert Energy Ecosphere. J. Desert Res. 2021, 41, 11–20. [Google Scholar]
Figure 1. Geographical location of the Gonghe Basin.
Land 12 00998 g001
Figure 2. Albedo-NDVI feature space [31].
Land 12 00998 g002
Figure 3. Albedo-NDVI linear regression analysis.
Land 12 00998 g003
Figure 4. Spatial distribution of desertification in the Gonghe Basin.
Land 12 00998 g004
Figure 5. Changes in desertification intensity from 2010 to 2020.
Land 12 00998 g005
Figure 6. Comparisons of q value for different factors (2010 and 2020).
Land 12 00998 g006
Figure 7. The q values of interactive factors in 2010 (P < 0.01).
Land 12 00998 g007
Figure 8. The q values of interactive factors in 2020 (P < 0.01).
Land 12 00998 g008
Figure 9. Average annual temperature in from 2010 to 2019.
Land 12 00998 g009
Figure 10. Annual precipitation from 2010 to 2019.
Land 12 00998 g010
Figure 11. Average annual wind velocity from 2010 to 2019.
Land 12 00998 g011
Table 1. Linear relationship of desertification difference index (DDI) in 2000 and 2020.
YearLinear Relationship
2010DDI = 2.4278 × NDVI − Albedo
2020DDI = 4.1017 × NDVI − Albedo
Table 2. Classification accuracy of desertification.
YearExtremely Severe
(%)
Severe
(%)
Moderate
(%)
Slight
(%)
Non-
Desertification
(%)
Kappa
Coefficient
OA
(%)
PAUAPAUAPAUAPAUAPAUA
2010959594.749094.749086.36951001000.9394
202095.24100959594.749090.4895100950.9495
Table 3. Dynamic changes of desertification land area in the Gonghe Basin from 2010 to 2020.
Category201020202010–2010
Area (km2)%Area (km2)%Annual Rate of Change (%)
Extremely severe3434.2717.41098.955.6−6.8
Severe4436.5922.55028.7225.51.3
Moderate4595.2823.35282.6126.81.5
Slight4153.3121.14381.7122.20.5
Non-desertification3086.0615.73913.5219.92.7
Table 4. The transition matrix of desertification in 2010–2020.
2020Extremely
Severe
SevereModerateSlightNon-
Desertification
Total
(Reduced)
2010
Extremely severe827.922213.94335.7527.5629.113434.27
Severe185.302402.031736.1285.1428.004436.59
Moderate35.58355.752675.321418.13110.514595.28
Slight25.5335.19484.332351.701256.564153.31
Non-desertification24.6221.8251.09499.182489.353086.06
Total (increased)1098.955028.725282.614381.713913.5219,705.51
Table 5. Area and proportion of changes in desertification intensity.
2010–2020Severe
Deterioration
DeteriorationNo ChangeRestorationObvious
Restoration
Area (km2)193.831524.5610,746.316624.756160.63
Percentage (%)0.86.042.626.224.4
Disclaimer/Publisher’s Note: The statements, opinions and data contained in all publications are solely those of the individual author(s) and contributor(s) and not of MDPI and/or the editor(s). MDPI and/or the editor(s) disclaim responsibility for any injury to people or property resulting from any ideas, methods, instructions or products referred to in the content.

