Article

Land Use Optimization Embedding in Ecological Suitability in the Embryonic Urban Agglomeration

1
College of Geography and Environmental Science, Northwest Normal University, Lanzhou 730070, China
2
Key Laboratory of Resource Environment and Sustainable Development of Oasis, Northwest Normal University, Lanzhou 730070, China
3
Gansu Province Land Use and Comprehensive Improvement Engineering Research Center, Lanzhou 730070, China
4
College of Physics and Electronic Engineering, Northwest Normal University, Lanzhou 730070, China
*
Author to whom correspondence should be addressed.
Land 2023, 12(6), 1164; https://doi.org/10.3390/land12061164
Submission received: 3 May 2023 / Revised: 16 May 2023 / Accepted: 29 May 2023 / Published: 1 June 2023

Abstract

:
Healthy and sustainable urban agglomerations development relies heavily on land use optimization. However, there is insufficient scientific basis and reliable quantitative analysis for land use pattern identification and optimal prediction in embryonic urban agglomeration. Therefore, taking the Lanzhou–Xining (LX) region, a typical primary developing urban agglomeration, as the study area, we first assessed the land ecological suitability (LES). Then, we embedded the LES evaluation results in the land optimization process and constructed the MCR-MOP- Dyna-CLUE model framework, simulating and optimizing land use patterns for the year 2035 under ecological optimization and business as usual scenarios, which aimed to explore a sustainable land use pattern for embryonic urban agglomerations. The results indicated that the ecological optimization scenario based on LES had a more rational land use pattern. It appropriately controlled the expansion rate of construction land and effectively alleviated the problems of construction land encroaching on farming land and ecological land. Meanwhile, the ecosystem services increased in value based on adequately addressing the need for food security and economic development. Compared to the business as usual scenario, the construction land under the ecological optimization scenario was 19,622.69 ha less, and the cultivated land was 32,103.29 ha more. Moreover, the ecological benefit and the economic benefit increased by 187,490.4595 million yuan and 151,808,605.1 million yuan from 2020 to 2035, respectively, under the ecological optimization scenario. Our research is of great value for making decisions on sustainable land use and land resource management in initial developing agglomerations.

1. Introduction

Urban agglomeration has evolved as a new type of geographical unit in cross-administrative cooperation and as a means for nations to compete internationally and participate in the global division of labor [1]. However, early developed agglomerations that were already in the mature stage tended to pay too much attention to high economic development and formed an excessively fast and unmanaged construction land expansion mode and unbalanced land use patterns but neglected ecological environmental protection, leading to many serious “urban diseases” [2], such as resource shortage, environmental pollution, and ecological destruction [3,4,5]. These problems, in turn, seriously restricted the process and reduced the benefits of urban agglomeration development. According to the development level of the service industry of senior producers and the level of inter-city linkage in each urban agglomeration, urban agglomeration can be divided into three categories: relatively mature, development, and nurturing [6]. At present, there are more than 20,000 city clusters in the world [7], and most urban agglomerations in developing countries, especially China, are just in the embryonic and rapid growth stages. They face severe demographic, resource, and environmental pressures, as well as a correspondingly large number of development problems [2]. Therefore, it is urgent to regulate and optimize the land use patterns of urban agglomerations in the embryonic and growth stages by learning from the experience and lessons of mature urban agglomerations, so as to guide them to develop in a sustainable and high-quality direction.
In essence, land use optimization seeks to explore optimal land use type area ratios and land spatial layouts to increase the sustainability of land resources and keep land ecosystems in a relative balance [8]. A large number of studies on land use optimization have been conducted at different scales, including globe [9], continent [10], nation [11], river basin [12] and city [13]. However, the land use optimization researches of urban agglomerations are relatively few and mainly focus on those that have been relatively mature and have a high economic level, such as Atlanta [14], Beijing-Tianjin-Hebei [15], Guangdong-Hong Kong-Macao Greater Bay Area [7], Pearl River Delta [16], Middle Reaches of Yangtze River [16], and Yangtze River Delta [17]. And their focus and specific optimization objectives are directed towards addressing the primary issues present in the current stage as well as its own regional characteristics. As the development of urban agglomerations is characterized by stages and regions [18], the above cases cannot serve as a scientific basis for land use management in the embryonic urban agglomerations. The LX urban agglomeration is a typical national key nurturing urban agglomeration in the embryonic stage in China. Located between the ecological barrier of the Qinghai-Tibet Plateau and the north-central China sand control belt, it is closely related to the national ecological security strategic pattern with “two screens and three belts” as the main body, and has a unique strategic supporting role in protecting the “China Water Tower” and preventing land desertification in the western region spreading to the east [19]. Even so, its ecological environment is fragile, with the uneven spatial and temporal distribution of water and soil resources, increasingly serious land desertification and soil erosion, and weaker carrying capacity of land resources. In recent years, the intensified land use activities have led to increasingly prominent problems such as environmental pollution, ecological land degradation and agricultural land conversion [20]. Clearly, the land use optimization research to guide the coordinated development between cities and ecological sustainability in the LX urban agglomeration has a typical and representative significance.
In terms of research methods for land use optimization, two categories are involved: quantitative prediction models and spatial pattern simulation models. Quantitative prediction approaches such as system dynamics models [21], Markov chains [22], hybrid leapfrog jump algorithms [23], artificial neural networks [24], back propagation artificial neural networks [25], and gray linear programming [26] are commonly used. In the case of continuous urban sprawl and mutual constraints between ecological space and agricultural space, it is urgent to predict land use evolution under “multi-objective” requirements for food security, ecological security, and economic growth through simulation. However, the above models essentially study the research object as a complex system with multiple elements interacting with each other. As far as the land optimization problem is concerned, their calculation process is more complicated, the calculation cost is higher, and they are easily disturbed by random factors, but the effect is not necessarily ideal [27]. The multi-objective linear programming (MOP) model can transform multiple objectives into a single objective when dealing with multiple conflicting objectives, has a strong multivariate optimization decision-making ability with low computing cost, and is an ideal tool for balancing benefits among regional economy, society, and ecology through optimizing land use structure [28,29]. With the advancement of technology, land space optimization has become a hot topic of research, and a series of simulation models have been used in optimizing land use patterns one after another, such as ABM [30], PSO [31], CA [32], and CLUE-S [33], FLUS [34], PLUS [35], etc. A POS algorithm has the advantages of fast convergence speed and strong global search ability, but it is difficult to set parameters and easy to fall into the deadlock of local optimal solution [31]. CA and its improved models FLUS and PLUS can better represent the neighborhood interdependence, but its overemphasis on the global will result in a highly regular evolutionary process, so it is difficult to intervene and correct local evolution [36]. ABM realizes bottom-up micro-interactions between land units by formulating a series of stress strategies to avoid local information loss. Nevertheless, its distributed simulation method means that the computational cost is high, and the scale effect caused by some synergistic changes often leads to simulation failure [37]. In contrast, the CLUE-S model drives global evolution with environmental adaptability and realizes automatic correction of unit evolution by integrating a series of local rules, which combines both global and local simulation advantages [38,39]. The Dyna-CLUE model is an upgraded version of CLUE-S, which is very suitable for simulating land use change in complex and multi-scale scenarios [10]. In addition, comprehensive and effective spatial optimization of land use is closely related to the land quantitative structure [25]. Thus, we couple the Dyna-CLUE with the MOP model for optimized land use layout simulation.
Land ecological suitability (LES) reflects the adaptability of land units to specific uses and is an important reflection of the spatial heterogeneity of land as a geographical environment element [40]. Incorporating LES into land use planning can allocate land use activities to the most appropriate location, determine the spatial scope of construction and ecological protection, reduce the destruction of ecological space, and achieve regional sustainable development [41]. At present, research that incorporates LES into land simulation models mainly focuses on a single city, such as urban growth boundary demarcation and the land use optimization of oasis cities [42]. The only studies involving urban agglomeration are aimed at ecological space forecasting, and their land simulation models are CA [43,44]. Therefore, the research scheme is not enough to alleviate the increasingly acute contradiction between socio-economic development and ecological deterioration in the process of forming new urban agglomerations. In addition, traditional methods for LES evaluation including logical rule combination [44] and map overlay [45] only focus on the vertical process of land units and ignore their interaction in the horizontal process. The minimum cumulative resistance (MCR) model has been shown to calculate the cumulative resistance that land units overcome during horizontal movement [46]. Therefore, on the basis of analyzing the vertical elements of land ecological function, we introduced the MCR model to analyze the horizontal process of the land unit and attempt to integrate the two processes into the Dyna-CLUE model to explore the optimal allocation of land resources under uncertainty and complexity. Finally, the MCR-MOP-Dyna-CLUE model framework is constructed to study land use simulation optimization by taking the LX urban agglomeration as an example. The aims are: (1) to determine the LES zones by comprehensively analyzing the longitudinal and horizontal ecological processes of the land unit; (2) to establish an optimal land use quantitative structure that is both eco-friendly and socio-economically sustainable; (3) and to simulate the optimal spatial pattern of land use.

2. Materials and Methods

2.1. Study Area

The LX urban agglomeration is a cross-provincial urban agglomeration situated in the upper reaches of the Yellow River Basin in the northwest inland of China and the total area is 9.75 × 10⁸ ha (Figure 1). It is centered on the two provincial capitals of Lanzhou city in Gansu Province and Xining city in Qinghai Province, with a total of 39 counties (districts). This region lies in the transition zone between the first and second steps of the terrain, the predominant landform consists of mountains, hills, and valley basins, the average annual temperature is 6–12 °C, and the average annual precipitation is 180–400 mm. The towns, cities, and populations are basically clustered in the Yellow River-Huangshui main stream valley basin as well as its tributaries because of the better water, heat, and land resource combinations. The LX urban agglomeration has the highest population density and the fastest rate of economic growth and urbanization in Gansu and Qinghai provinces. By 2020, the permanent resident population and GDP in the urban agglomeration accounted for 38.5% and 49.2% of the total population and GDP of the two provinces, respectively, and the urbanization rate reached 35.42%. At the same time, with the population increasing and the economic scale enlarging, this agglomeration is facing considerable pressure on land use and environmental protection. Coupled with the extensive mode of economic development, the land use efficiency is lower, resulting in frequent land use conflicts and economic and livelihood contradictions.

2.2. Data Sources

The data employed in our study are shown in Table 1. It should be noted that the land use data in 1995 and 2005 were interpreted from Landsat-TM/ETM, and data in 2015 and 2020 were interpreted from Landsat-OLI. Through human–computer interactive interpretation, they were categorized into six groups: cultivated land, woodland, grassland, water area, construction land, and unused land (Table S1), with overall accuracy no less than 90% for every year [47,48]. Vegetation coverage (NDVI) data were extracted from Landsat TM/ETM+/OLI Surface Reflectance with GEE (Google Earth Engine). All data were unified to the WGS1984_welbert projection coordinate system.

2.3. Methods

The abbreviations used in this study are summarized in Table 2. In this study, we evaluated LES by combining the overlay analysis method and the MCR model. Then, the comprehensive MCR-MOP-Dyna-CLUE model framework was constructed to optimize the land use structure and land use pattern of the LX urban agglomeration (Figure 2).

2.3.1. Evaluating the Land Ecological Suitability

(1)
Multi-factor weighted overlay analysis
Based on relevant theories and the actual situation in this region, areas with strong ecological functions, including nature reserves, woodland, water areas, grassland patches with coverage greater than 50%, and grassland patches with coverage of 20–50% and area greater than 5 km2 were designated as the ecological sources [49], and the existing urban construction land and rural settlements were designated as the construction sources (Figure S1). The evaluation index system with the same resistance factors and opposite resistance values was constructed to calculate the comprehensive resistance values for the expansions of construction sources and ecological sources. According to local characteristics and previous studies [46,50], we chose ten resistance factors from topography, geomorphology, location, climate, and soil, and classified every resistance factor into five levels by assigning values of 1, 2, 3, 4, and 5 to them. The greater the value, the stronger the resistance (Table S2). Then, we determined the weight of resistance factors using the entropy weight method [51]. Finally, the multi-factor weighted overlay method was analyzed as follows:
S = i = 1 n W i × A i
where S represents the value of the comprehensive resistance surface, Wi represents the resistance factor’s weight, Ai represents the resistance factor’s relative resistance value, and n represents the total number of resistance factors.
(2)
The MCR model
The minimum cumulative resistance surfaces for expansions of ecological sources and construction sources were built with the MCR model to show their spatial change trend [52]. The MCR model can be expressed as:
M C R = f m i n j = n i = m ( D i j × R i )
where fmin is the relation function between the minimum resistance at any point in space and its distance to all sources; Dij refers to the distance of species from source j to landscape i; Ri refers to the resistance value of species crossing the landscape.
(3)
Land ecological suitability zoning
The minimum cumulative resistance surfaces for ecological sources and construction sources expansion were denoted as MCRe and MCRu, respectively, and the LES was classified by the difference between the two resistance surfaces [44]. It can be expressed as follows:
M C R d = M C R e M C R u
where MCRd denotes the difference between the two resistance surfaces. The smaller MCRd is, the higher the ecological suitability of the evaluated grid unit, and the more suitable it is as ecological land. On the contrary, the larger the MCRd, the lower the ecological suitability of the evaluated grid unit, and it is therefore suitable to be divided into construction land. Finally, the research area was divided into five zones with the natural break tool of ArcGIS: High Ecological Suitability (HES) zones, Sub-high Ecological Suitability (SES) zones, Medium Ecological Suitability (MES) zones, Low Ecological Suitability (LES) zones, and Non-Ecological Suitability (NES) zones.

2.3.2. The MCR-MOP-Dyna-CLUE Model Framework

Establishing the MCR-MOP-Dyna-CLUE model framework to simulate and optimize the land use pattern involves these tasks: firstly, to analyze drivers of land use change and establish probability maps of land use type spatial distribution through the logistics regression model; secondly, to establish optimization scenarios; thirdly, to predict land use demand and simulate land use patterns in 2035.
(1)
Establishing probability maps of land use type distribution
Factors influencing changes in land usage were analyzed using the binary logistic regression model, which has the benefit of strong explanatory variables. Using the stepwise regression procedure of SPSS, factors that did not have strong explanatory power for the dependent variable would be removed. The model can be expressed as follows:
L o g ( P i 1 P i ) = β 0 + β 1 X 1 i + β 2 X 2 i + + β n X n i
where Pi refers to the probability that one land use type will be present in a certain raster cell, X refers to different drivers, and β refers to the regression coefficient between each driver and one land use type. The regression results are tested by ROC values, which are between 0.5 and 1. When the ROC value is greater than 0.7, it indicates that the regression result has a greater capacity to explain each land use type [53]. According to previous studies and the land use change features of the LX region [33,54], ten driving factors, including DEM, slope, soil type, multi-year mean precipitation, NDVI, distance to water areas, distance to city center, distance to main roads, per capita GDP, and population density, were selected for logistic regression calculation (Figure S2). Among them, DEM, slope, soil type, and multi-year mean precipitation remain unchanged each year, while other factors change dynamically with the corresponding period of land use data. All driving factors of each phase are unified into raster data through the ArcGIS spatial analysis function and converted into an ASCII file output. In this study, the driving factors of 1995, 2005, and 2015 were used for verification, and the driving factors of 2020 were used for prediction. To make sure that the regression results were accurate, the variance inflation factor (VIF) and the tolerance value (Tol) were employed to diagnose the multicollinearity among the driving factors. It is generally considered that VIF > 5 or Tol < 0.2 are signs of the presence of collinearity [55].
(2)
Setting simulation scenarios
To verify LES’s improvement of land use patterns, we set the following two scenarios for comparison:
The ecological optimization scenario: in 2019, a strategy for ecological protection and high-quality development of the Yellow River Basin was put forward in China. It focuses on strengthening ecological and environmental protection to ensure the long-term stability of the Yellow River. The LX urban agglomeration is the key responsibility area for ecological protection in the Yellow River Basin. At the same time, this region borders the Qilian Mountains to the north, has the Yellow River Valley and the Huangshui Valley in the middle, and benefits from grassland in the south, with a national ecological barrier around it. Its greatest value lies in ecology, its greatest responsibility lies in ecology, and its greatest potential lies in ecology, and not only bears the great responsibility to protect ecology but also has good conditions to transform the potential ecological advantages into real economic advantages. Moreover, regional sustainable development should not only protect the ecology, but also take into account more aspects such as social and economic issues, and the scenario of focusing only on one aspect is not in line with the actual situation. Therefore, we ensured priority for ecological protection and took into account local economic development and food security requirements to create a land use optimization scenario. The scenario took 2035 as the target year, which was the vision target year of the 14th Five-Year Plan (2021–2025) in China, the medium-term outlook year for the Outline of the Yellow River Basin’s Ecological Protection and High-quality Development Plan, and the aim deadline year of the Lanzhou–Xining Urban Agglomeration Development Planning. Setting this scenario aims to resolve the conflict between ecological protection and the growth of the economy and urban space, enhance the comprehensive benefits of land use through optimizing land use patterns, and promote urban agglomeration to develop sustainably. In this scenario, the LES was embedded into the Dyna-CLUE model as the restricted parameter to prevent damage to ecological spaces as much as possible (Figure S3), and the land use conversion rules and transfer elasticity coefficient of the model tended to control the encroachment of cultivated land woodland and water areas (Tables S3 and S4). Meanwhile, the MOP model is used to predict land use demand, with the goal of maximizing the ecosystem services value and the basic constraint of grain demand and economic aggregate.
The business as usual scenario: this scenario is used as a reference to compare with the ecological optimization scenario embedding in LES. Our current land use planning requires that land use must prioritize ecological safety and cultivated land security. This scenario assumes that land usage from 2020 to 2035 maintains the historical development trend without any interference from land use planning and development strategies. In the scenario, the conversion rules allow all land use types to be converted to each other (Table S3), the elasticity coefficient setting tended to reduce the difficulty of converting land use types (Table S4), and the restricted areas only considered nature reserves, forest parks, wetland parks, and other ecological protection areas clearly designated by the state. The land use demand was predicted through the Markov model depending on the land transfer probability matrix of the historical period.
(3)
The MOP model
Taking ecological benefits, that is, the value of ecosystem services, as the target value and economic benefits, and food yield and the value range of the area of each land use type as the basic constraints, the multi-objective linear programming (MOP) model function was constructed. The expression is as follows:
V = m a x i = 1 6 v i s i
i = 1 6 c i s i C 0
q i s i Q 0
s i s i
s j s j
i = 1 6 s i S 0
where V is the total value of ecosystem services (RMB yuan). vi is the value of ecosystem services per unit area of the ith land use type (Yuan/ha). si is the total area (ha) of the ith land use type, ci is the economic value per unit area of the ith land use type. C0 is the total economic value of the optimal allocation of land use in 2035 (100 million yuan), which is represented by the GDP in 2035. qi is the extrapolated 2035 grain yield (t/ha). Q0 is the total food demand in 2035 (ten thousand tons). s i is the minimum area value of the ith land use type, s j is the maximum area value of the ith land use type, and S0 is the total area of the study area (ha).
The ecosystem services value per unit of land area was calculated using the national ecosystem services value equivalent revised for the LX Urban Agglomeration (Table 3). A standard unit ecosystem service value equivalence factor is considered to be 1/7 of the economic value of grain yield per unit area of cultivated land in the current year [56,57,58]. Based on the planting structure of crops in the LX region, the grain price of this study mainly refers to the average price of wheat, corn, and potatoes. Based on the national average grain market price of 2.13 yuan/kg in 2020 and the grain yield per unit area in the LX Urban Agglomeration, the equivalence factor of the ecosystem service value was calculated to be 1354.9 yuan/ha. Finally, the ecological benefit objective function can be expressed as:
V = 5047 s 1 + 26688.15 s 2 + 16344.61 s 3 + 92051.93 s 4 + 0 s 5 + 880.69 s 6
The economic value per unit area of different land use types was calculated by the economic benefit coefficient method [17,29]. Specifically, the economic benefits of cultivated land, forest land, grassland, water area, and construction land per unit area were estimated by the output value of agriculture, forestry, animal husbandry, fisheries, and secondary and tertiary industries in the current year, respectively, and the economic benefit of unused land was assumed to be 0. In this study, the economic benefit coefficient for 2035 was predicted with the GM (1,1) model according to the values of historical years. Finally, the objective function of economic benefit can be expressed as:
C = 490726.6 s 1 + 2666.9 s 2 + 29548.3 s 3 + 2270.9 s 4 + 3793715.3 s 5 + 0 s 6
According to the 14th Five-Year Plan (2021–2025), territorial spatial planning, China’s national food security standards, and related research, the constraints of the objective functions were determined (Table 4). The land use type area under the ecological optimization scenario was calculated by LING18.0.

3. Results

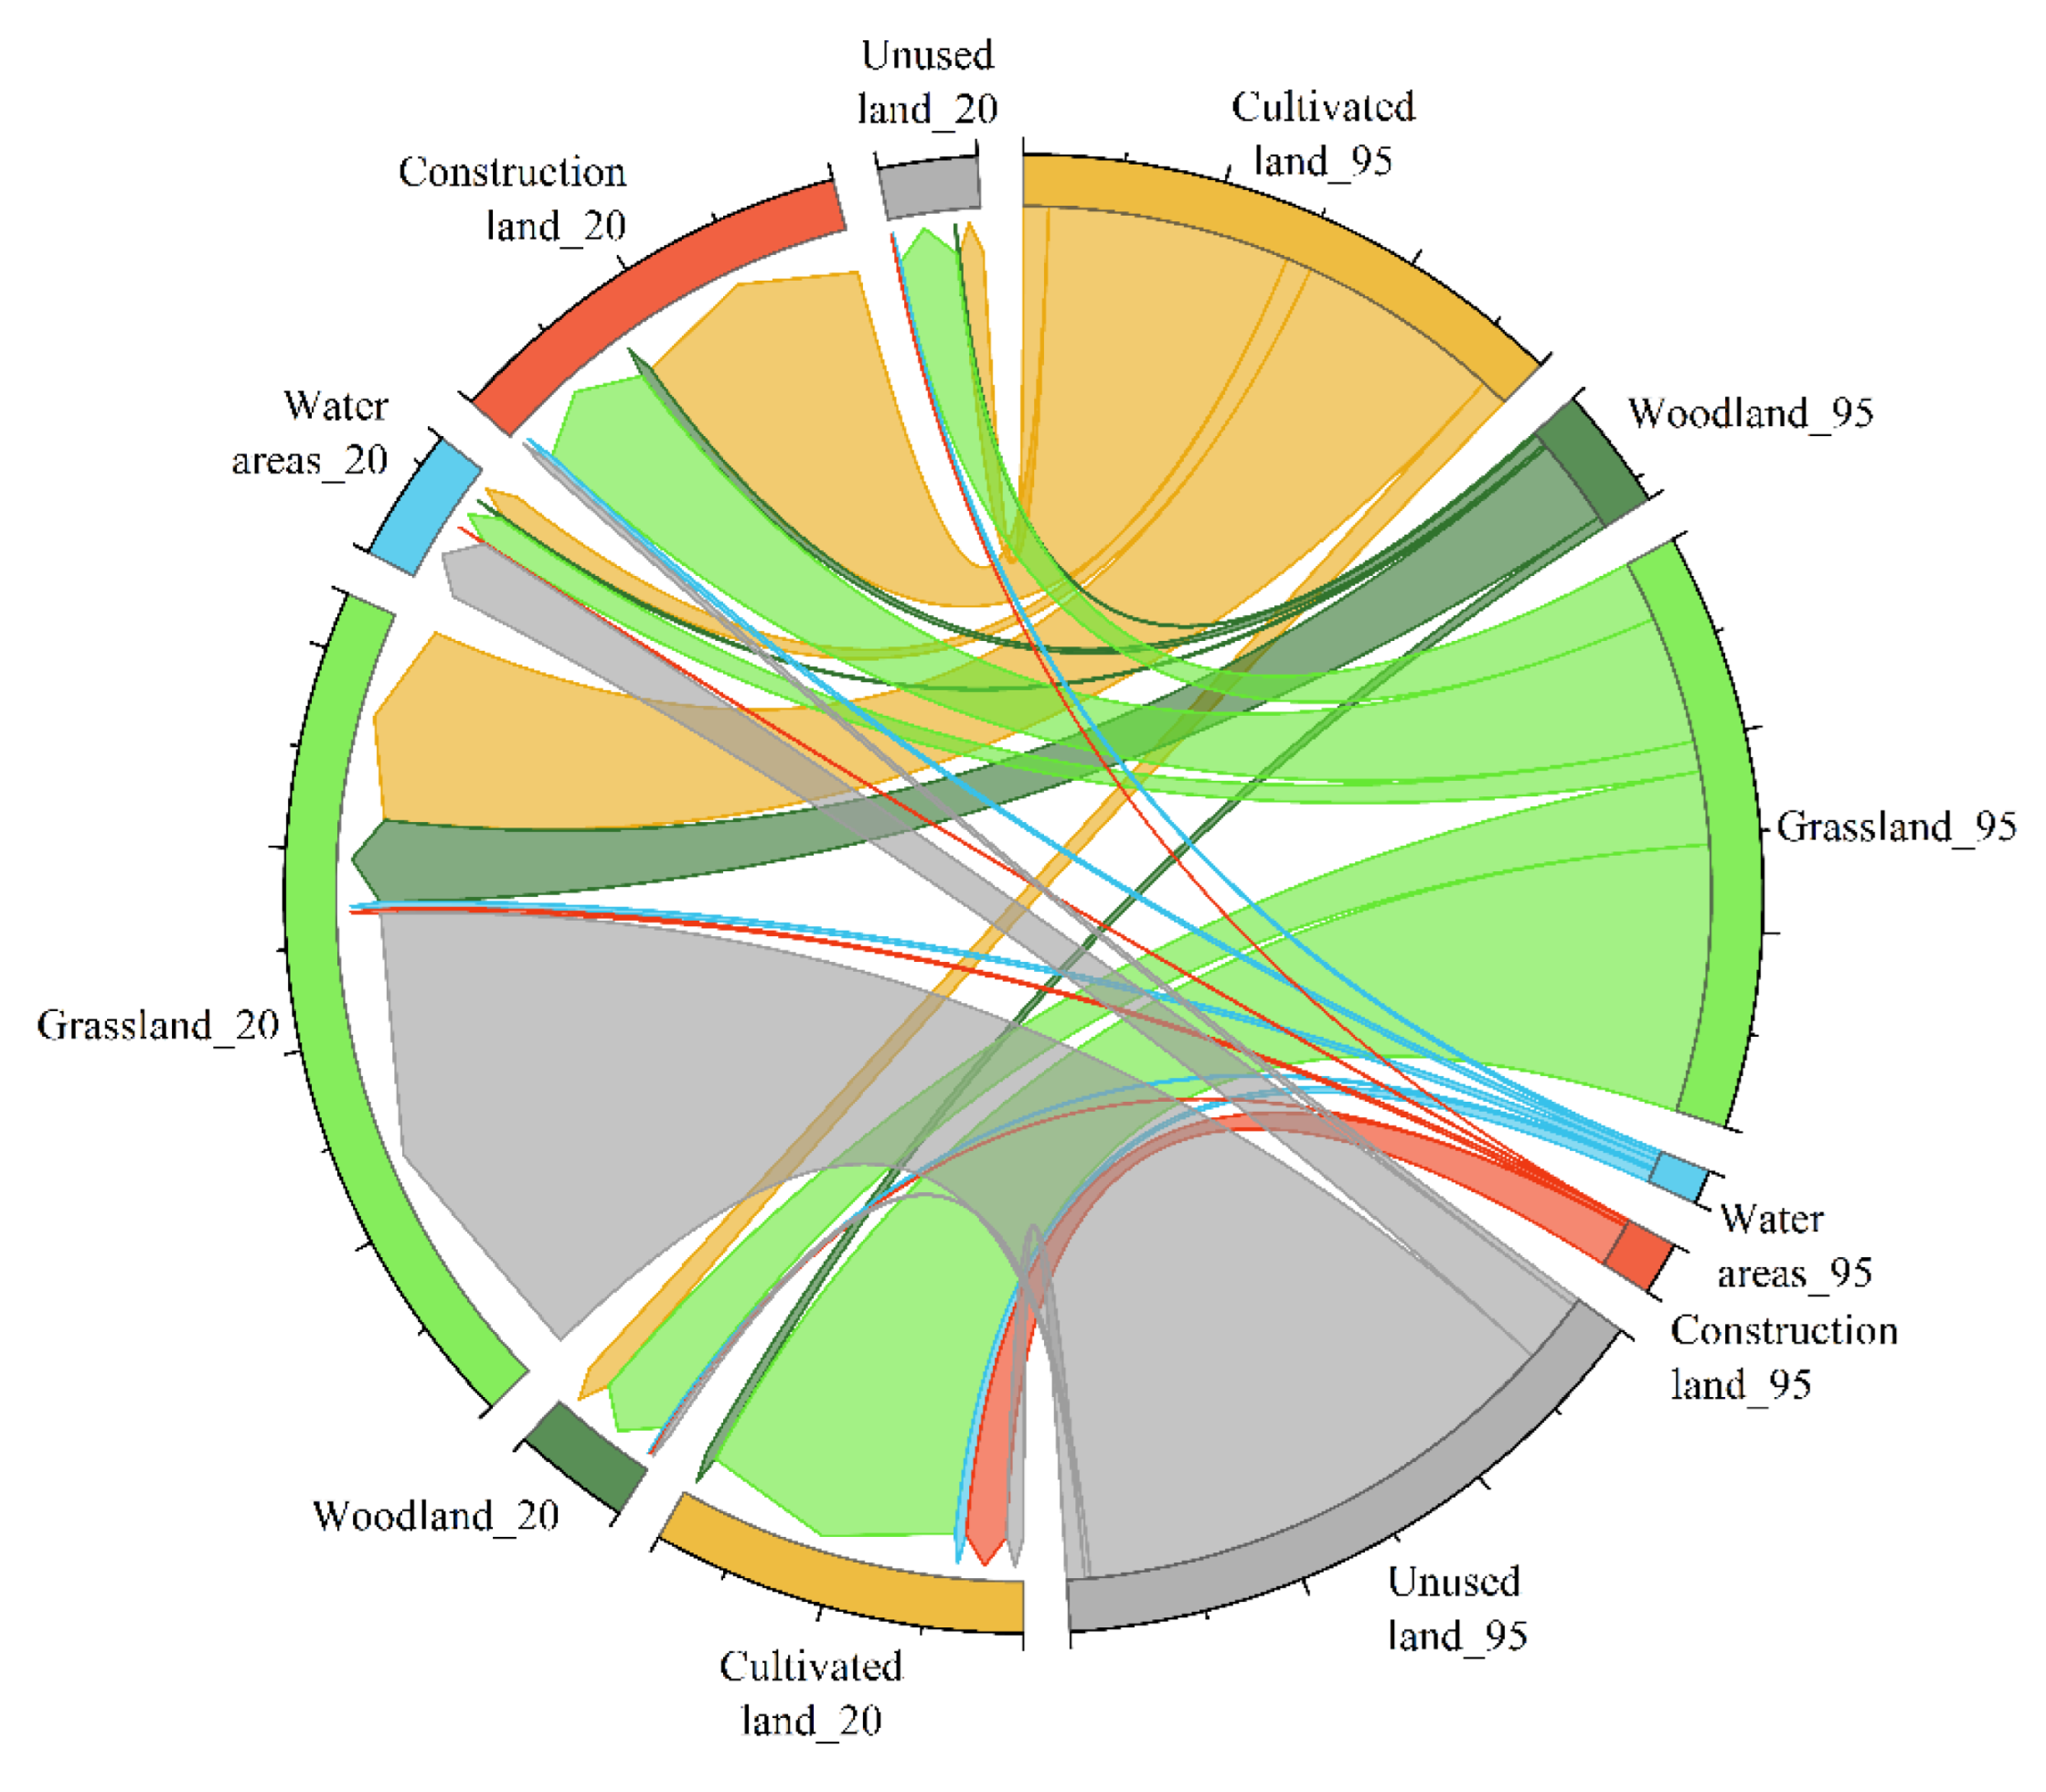
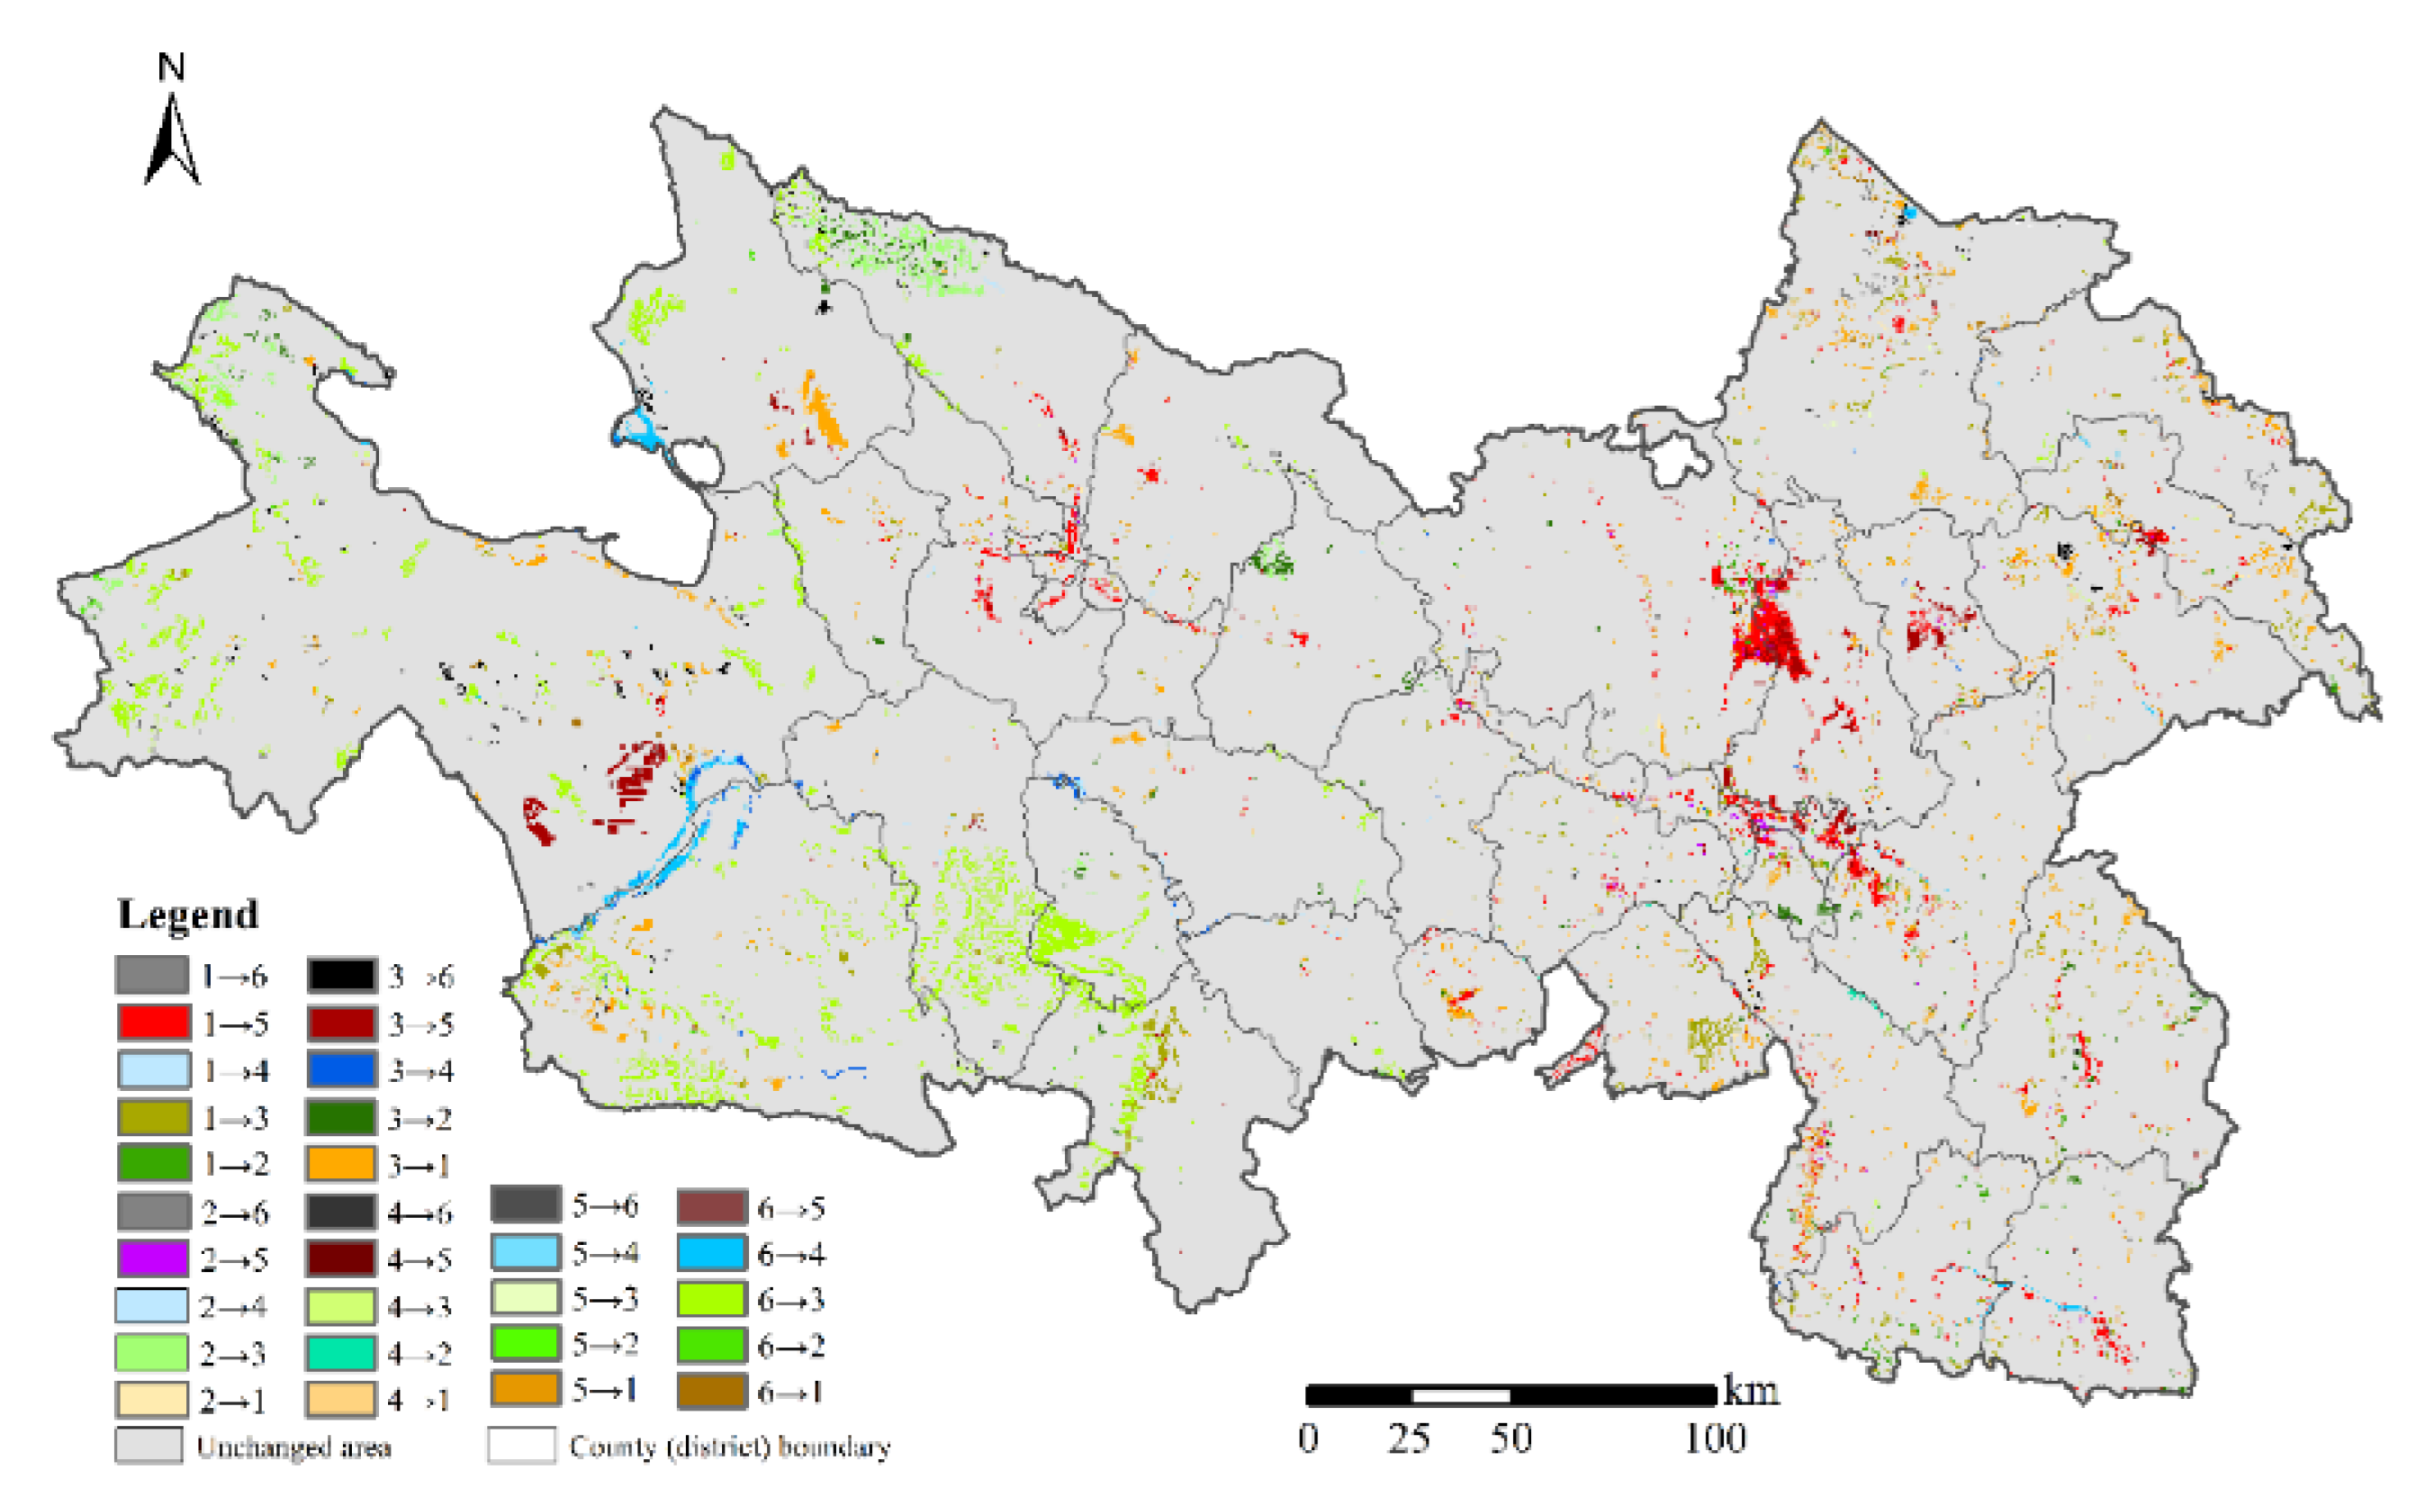
3.1. Temporal and Spatial Changes of Land Use during 1995–2020

The land use structure of the LX urban agglomeration changed significantly from 1995 to 2020 (Figure S4, Table 5), with a changed area of 567,267.25 ha, about 5.9% of the urban agglomeration, and the fastest change rate was during 2005–2015, as shown by dynamic index. Construction land had the largest increase, which was mainly obtained from cultivated land (61.26%), grassland (32.32%), and forest land (2.98%), and its transferred-in area was 7.9 times more than that transferred-out. Unused land and cultivated land decreased the most, and their transferred-out area was about 6.5 times and 1.5 times the area transferred in, respectively. Unused land was mainly converted into grassland (83.95%) and water area (10.79%), and the cultivated land was primarily transferred to construction land (46.11%) and grassland (39.13%) (Figure 3). Spatially, the urban edges of the provincial capitals of Lanzhou and Xining, Lanzhou New District, and prefecture-level cities such as Baiyin, Dingxi, and Linxia were the regions where most of the new construction land was concentrated, and the overall characteristic was that there was more in the east and less in the west. At the same time, these construction land expansion areas were also areas with obvious reductions in cultivated land and grassland, among which, Lanzhou New District and Anning District of Lanzhou were the most typical. Water areas increased near Qinghai Lake and the Yellow River’s headwaters. The unused land reduction was largely in the higher elevations of Guinan, Jianzha, Tongren, and Haiyan in Qinghai Province, where there was also an increase in construction land and grassland (Figure 4). In general, construction land occupying cultivated land and ecological land were the most noticeable events during the study period.

3.2. The Land Ecological Suitability Zoning

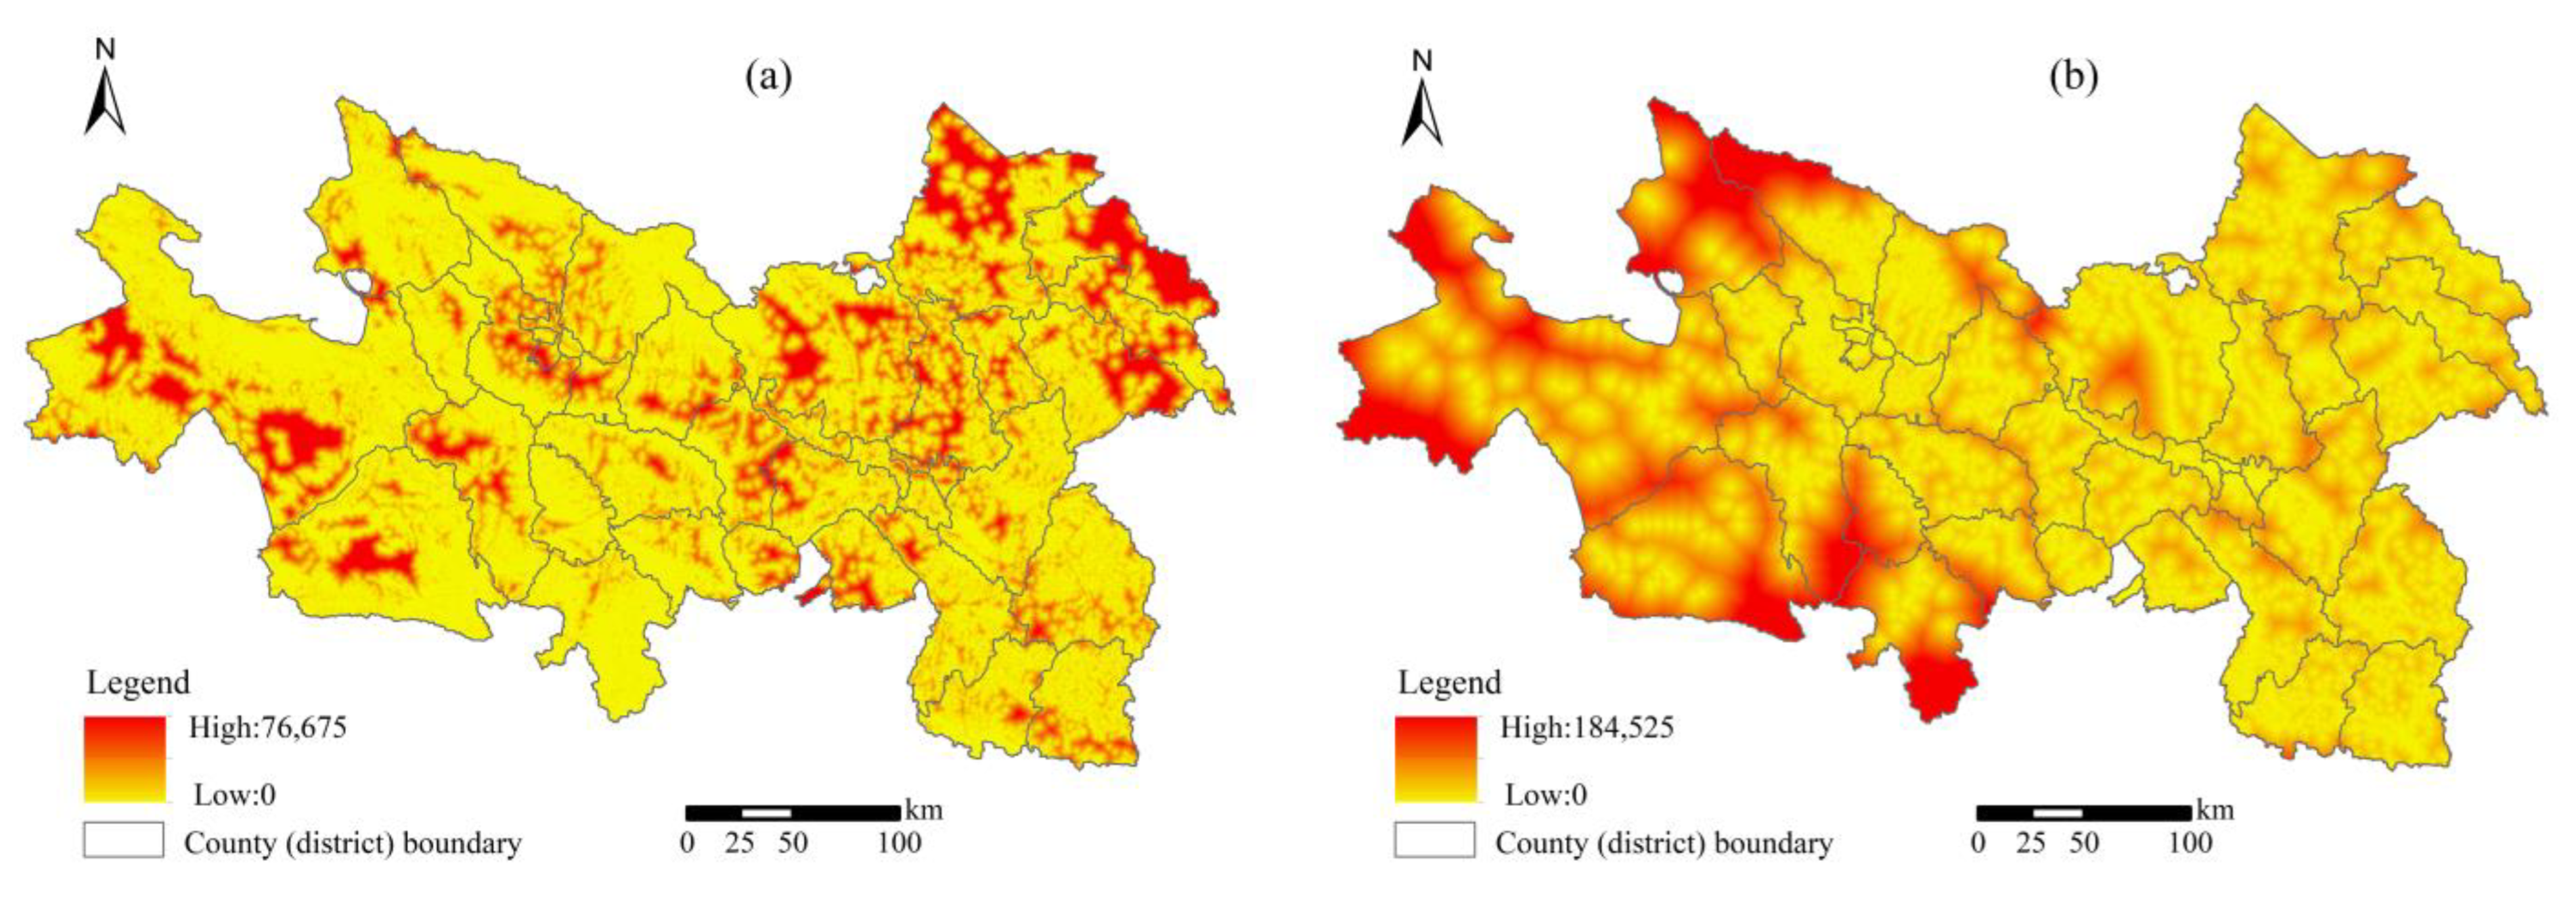
3.2.1. Minimum Cumulative Resistance Surfaces of Ecological Sources and Construction Sources

Taking comprehensive resistance values as the distance cost dataset (Figure 5), the minimum cumulative resistance surfaces for the expansion of two sources were generated by the Cost Distance module of ArcGIS10.2 (Figure 6). The spatial variation trends of the two resistance surfaces are overall inverse. In terms of the same patch, the further the distance from the ecological sources, the less the resistance to sources expansion, but the greater resistance to the expansion of construction sources. The built-up area of Lanzhou and Xining, Lanzhou New District, the built-up area of prefecture-level cities, as well as the county centers are higher resistance areas for ecological sources expansion, which are scattered in the urban agglomeration in a point-like form, and obviously more in Gansu Province than in Qinghai Province. The higher resistance areas for the expansion of construction sources are mainly watersheds and mountainous in south and northwest in LX urban agglomeration, including Daban Mountain, Riyue Mountain, Jishi Mountain and Mountainous area in the south of Qinghai Lake, showing an obvious high resistance zone along the Gonghe-Guinan-Guide East.

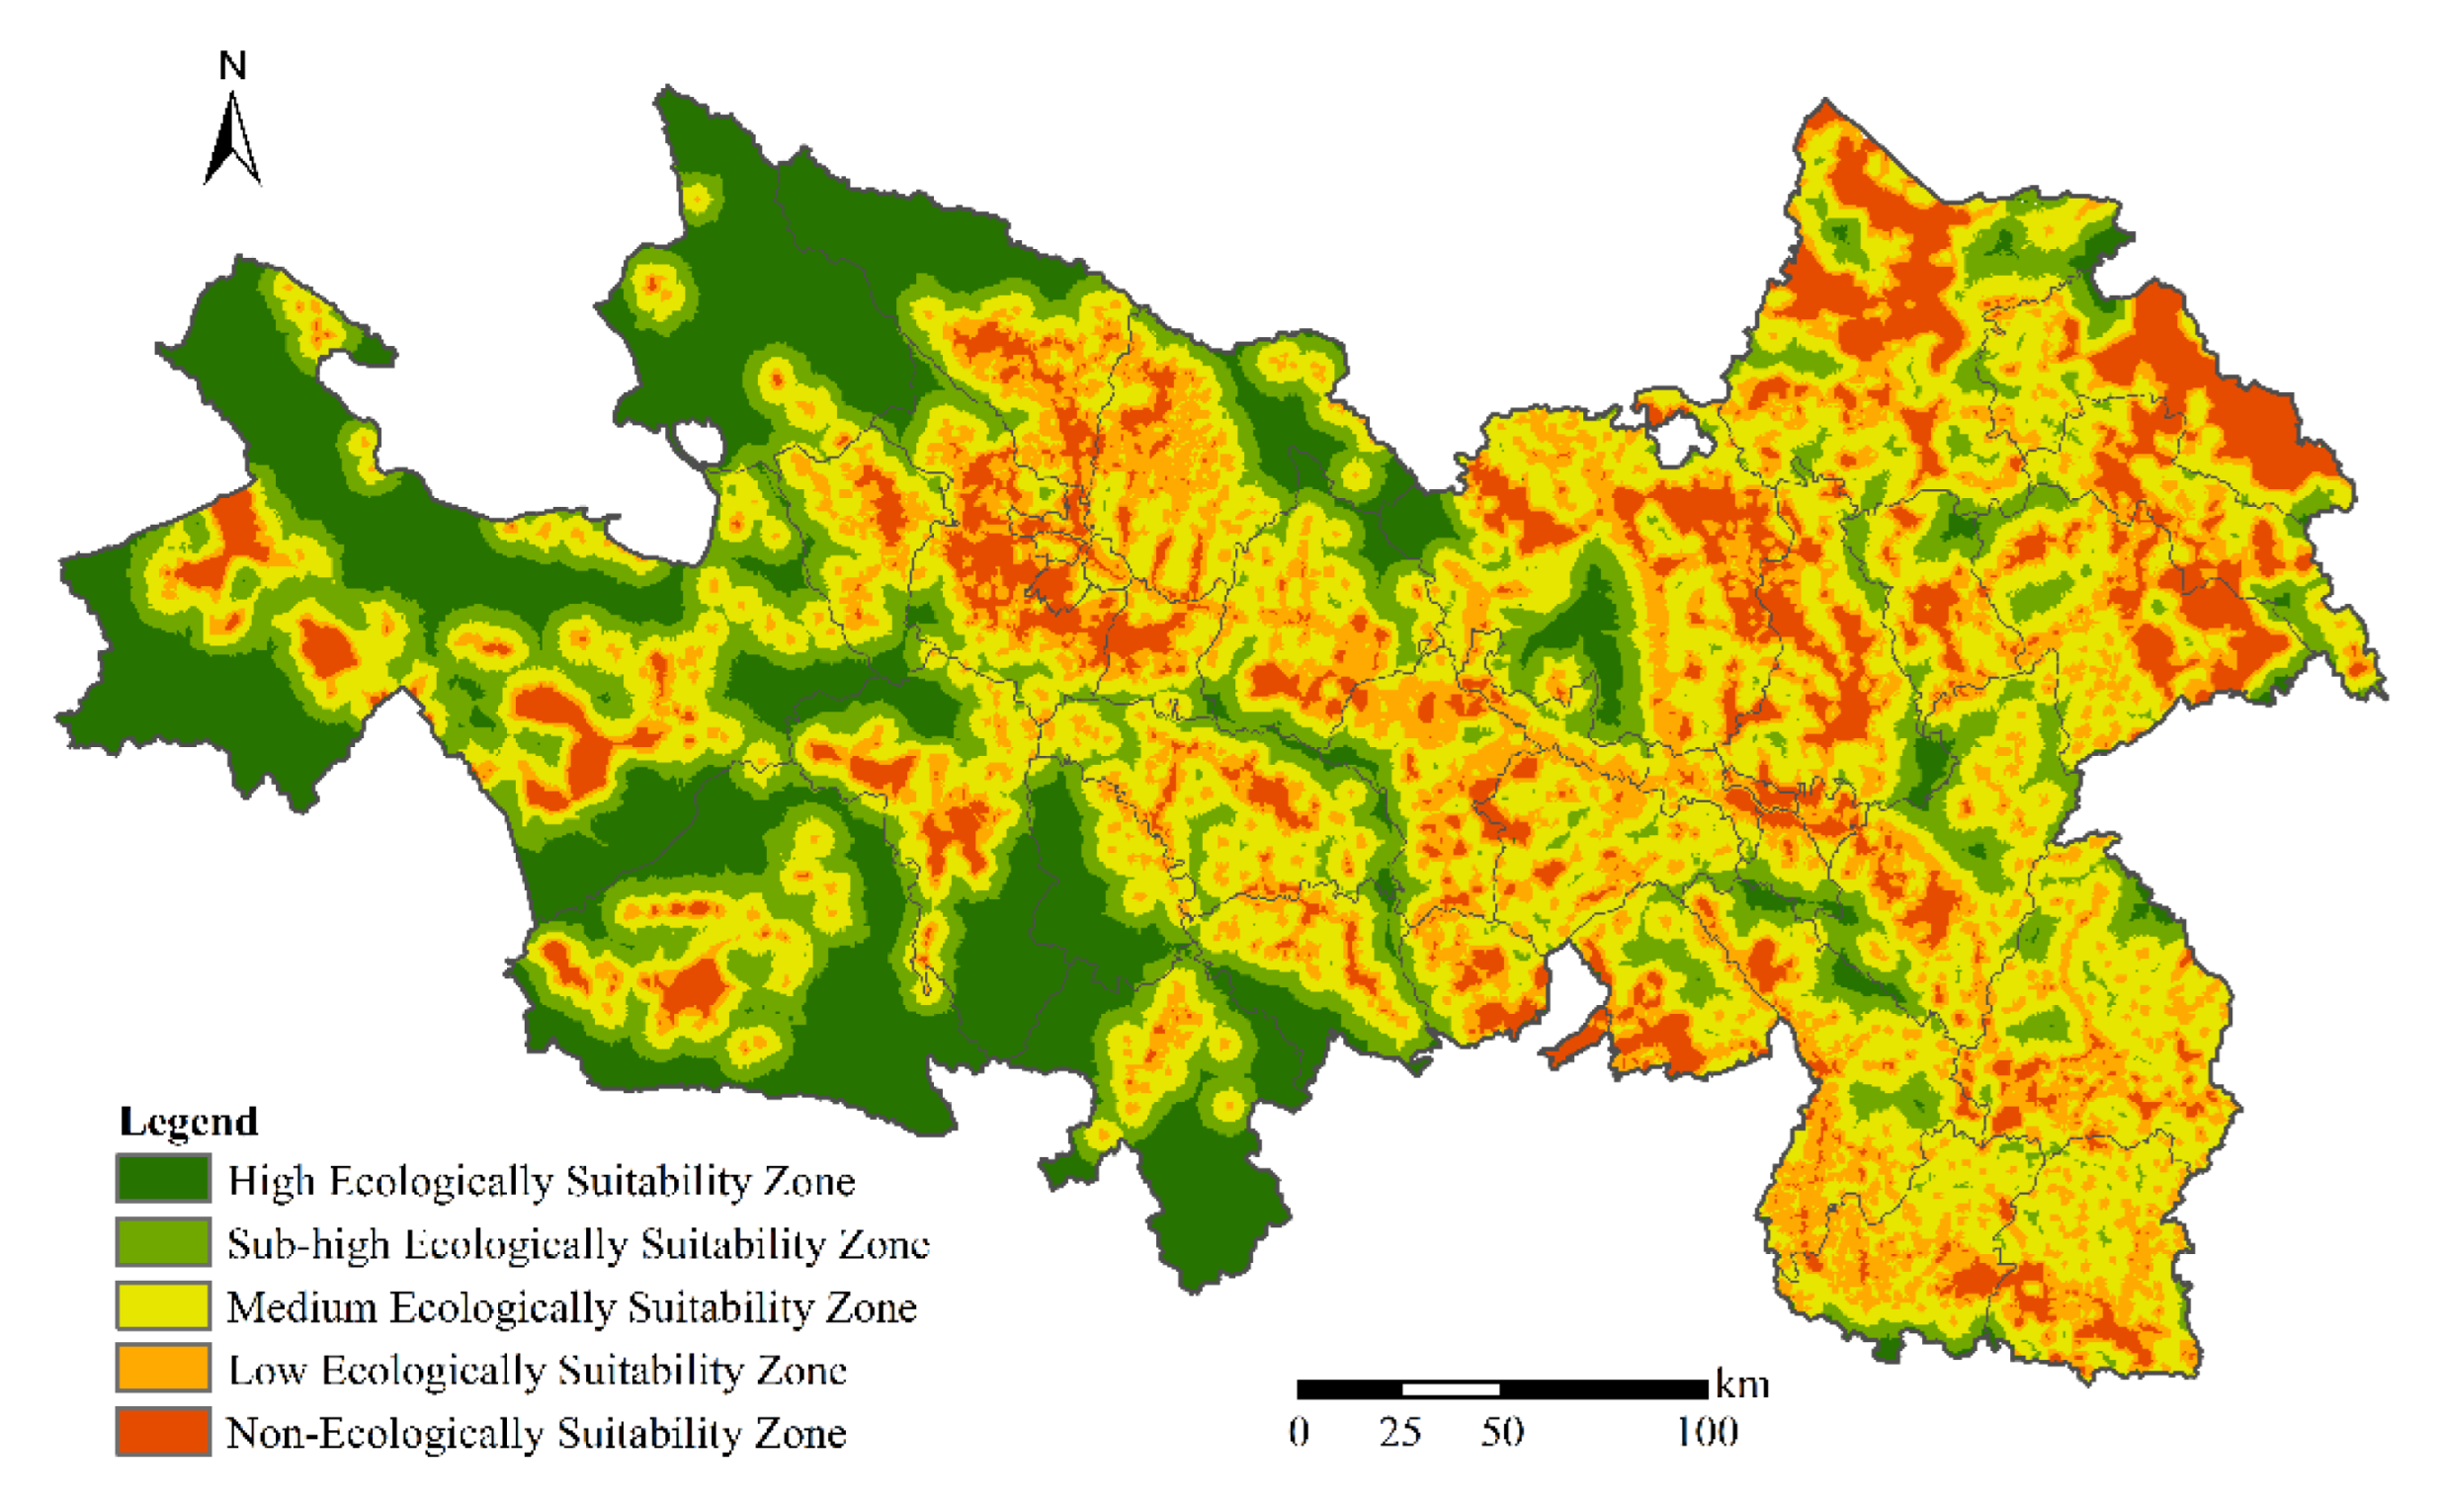
3.2.2. The Land Ecological Suitability Zones

As shown in Table 6 and Figure 7, the zone of the HES is primarily concentrated in mountainous areas with higher elevations and more precipitation, making up 16.52% of the research area, and the zone of the SES is distributed around the HES zone with the least area proportion. The basic land use types of the above two LES zones are woodland, grassland and water. The zone of the MES occupies the largest proportion in the research area, and the grassland is the main land use type. The most of urban areas are covered by the NES zone, where the construction land is the primary land use. The LES zone, which consists mainly of cultivated land and unused land, is outside the NES, locates at the periphery of the NES zone.

3.3. Land Use Simulation Results

3.3.1. Logistic Regression of Driving Factors

The results of the collinearity diagnosis denote that the driving factors are independent of each other (Table S5). Additionally, the Exp(B) values indicate that all drivers have different effects on each land type (Table 7). Specifically, altitude and slope have obvious limiting effects on cultivated land, water area, and construction land, and they tend to be in areas with low altitude and small slopes, while it has a positive traction effect on woodland, grassland, and unused land, which is mostly distributed in areas with higher altitude and slope. The influence of soil on cultivated land is the strongest, and cultivated land is generally distributed in the area with black soil, gray desert soil, gray calcic soil, cumulated irrigated soil, cultivated loessal soil, and dark loessal soil in the study area. High vegetation coverage is not conducive to the expansion of water and construction land. Precipitation is negatively correlated with arable land, grassland, and construction land, and positively correlated with forest land, water area, and unused land, that is, where there is more precipitation, less arable land, grassland, and construction land are distributed, while there is more forest land, water areas, and unused land. Moreover, water sources have a stronger positive attraction effect on grassland and unused land than arable land and construction land. This is all because precipitation and water are mostly distributed in the west of the urban agglomeration, but there are high altitudes and large slopes and development is difficult. Therefore, most of these areas are forest land, unused land, and water areas. Locational factors have the strongest impact on construction land. With an increase of traffic distance and distance from the city center, the probability of construction land decreased, indicating that urban construction land generally tends to be distributed close to traffic roads and urban centers. GDP is positively correlated with all land types except unused land, and population density is positively correlated with construction land. Furthermore, the ROC values of the six land types in each period are all greater than 0.7, indicating that the spatial distribution of all land use types could well be explained by the selected driving variables of the LX urban agglomeration, and the probability map of land use distribution can be predicted using the model.

3.3.2. Results of the Land Use Simulation

Based on the regression results of driving factors of land use types from 1995 to 2015, the land use of the LX urban agglomeration is simulated spatially using 1995, 2005, and 2015 as the starting years, and 2005, 2015, and 2020 as the target years, respectively. Finally, the accuracy of the simulation is tested using the Kappa coefficient and Overall Accuracy [33]. The results show that Kappa coefficients and Overall Accuracy are all greater than 0.9, indicating that the Dyna-CLUE model with logistic regression is adequate for simulating the land use spatial layout in this agglomeration (Table 8, Figure S5).
Although the land use pattern and structure under the two scenarios are generally similar, there are some significant local variations. It is clear from the rectangles that the ecologically optimized scenario has more compact patches and less loss of ecological and agricultural land (Figure 8). Compared to 2020, the cultivated land area of the business as usual scenario will decrease by 22,871.5 ha, and the forestland, grassland, waters, and construction land will increase by 2139.47, 28,963.58, 15,191.39 ha, and 78,345.69 ha, respectively. Most of the increased construction land in the business as usual scenario will be converted from cultivated land, and 19.88% of the increase will be distributed in the zones of HES and SES (Figure 9). Under the ecological optimization scenario, the cultivated land will no longer decrease rapidly, but slightly increases by 9231.79 ha compared with 2020. It is also noted that the construction land’s expansion rate will be slowed, and the increased area will be only 75% of the business as usual scenario. Most of the newly added construction land will be converted from unused land, except for a small amount of cultivated land around Lanzhou New District and the main urban areas of the two provincial capitals. The increased construction land areas will be mainly distributed in the zones of NES and MES, and the construction land expansion in the two zones of HES and SES will decrease by 92.91% compared with the business as usual scenario.

4. Discussion

4.1. The Compositive MCR-MOP-Dyna-CLUE Model Framework

Environmental problems related to land use reflect unreasonable land use patterns [60]. In turn, land use optimization research can point out the direction of regional land space restoration, protection, and utilization, and significantly contribute to regional ecological protection and sustainable social and economic development. There have been studies on establishing land use optimization model frameworks based on different optimization objectives, different ecological protection areas, and different simulation models [13]. However, the development of urban agglomerations is a dynamic and continuous process, and studies on a global scale have shown that land use changes have significant regional differences [61]. Therefore, it is necessary to select more appropriate evaluation indicators to establish a newer model framework and explore the future optimal land use pattern of urban agglomerations.
This study coupled MCR, MOP, and the Dyna-CLUE model to construct a land use optimization configuration model framework and realized the effective cohesion of land quantitative optimization and spatial optimization, considering ecological suitability, and provided a valuable reference for the effective management of land use in initial developing urban agglomerations. On the one hand, land has multi-functional properties, and it needs to exert various land functions to meet the different development needs of urban agglomerations [62]. Based on the MOP model, this study established a multi-objective function of ecological security as the goal, grain production as the premise, and economic benefit as the basis to calculate an optimal proportion of land use structure that not only stimulated the multifunctional potential of land ecology, production, and life, but also achieved the development demands of urban agglomeration for ecological protection, food production, and economic growth, and properly coordinated the regional development contradictions. On the other hand, based on the spatial heterogeneity of the geographical environment and the MCR model, we established the ecological suitability atlas for land use spatial simulation, which makes the matching between land demand and spatial location more accurate. Chinese scholars uphold the idea that a good ecological environment involves “productivity” and “golden mountains and silver mountains”, and most of the relevant research emphasizes the priority of ecological environment protection. In order to reduce ecological loss in the process of land use optimization, some studies regarded clearly defined nature reserves, forest parks, and wetland parks in countries or regions as ecological protection areas that prohibited land use conversion [3,58,63], but other areas with better ecological suitability such as glaciers and wetlands were ignored, and the scope of the LES was greatly reduced. Recent studies have established optimization models through the evaluation of ecosystem service functions [64], habitat quality [65], and ecosystem service values [66], but they still fail to consider the adaptability of land units to specific uses. In general, both of the above studies ignored the spatial heterogeneity of land as a geographical environment element. However, our study made up for the above shortcomings. More concretely, the ecological function of land depends not only on the vertical ecological elements such as soil, landform, and water, but also on the interaction of land units in the horizontal ecological process [44]. We comprehensively analyzed the above two processes of land units from the grid scale and integrated the results into the land use optimization process based on the Dyna-CLUE model. Comparing the two simulation results showed that the land patches generated by the MCR-MOP-Dyna-CLUE model framework are more compact, and the loss of ecological and agricultural land is less. It demonstrates that the new model framework improves the influence of ecological elements on land units with high ecological value, causes land use change to tend toward areas with low ecological value in the simulation process, and encourages the simulation results to move toward the predetermined optimization target. In addition, compared with the FLUS and PLUS models applied so far in the LX region, Kappa coefficients increased by 1.9 and 0.2, respectively [62,67]. It is evident that the proposed model framework exhibits greater applicability in land simulation research for the LX urban agglomeration.

4.2. Land Use Optimization Project

It was found that the multi-objective spatial optimization of land use pattern embedding in LES is more conducive to the sustainable development of urban agglomerations upon a comparison of the two simulation results. As is known to all, the growth of new construction land in the LX region is slower than the national average among urban agglomerations [68]. In fact, due to the influence of topographic and geomorphic conditions and the limitation of resource and environmental capacity, the land suitable for human production and life is extremely limited [20]. Cities and towns of the LX urban agglomeration are mostly concentrated in river valley basins, where geographical spaces are relatively narrow and the competition among agriculture, towns, and ecology is extremely fierce. Since the implementation of the Strategy for Large-scale Development of Western China, the LX urban agglomeration has experienced large-scale urbanization. The construction land has nearly filled the major river valley basins, resulting in the land resources available to develop already not being enough, especially in Lanzhou and Xining, two core cities [69]. Therefore, if land use continues to evolve in line with the business as usual scenario or economic growth is put first, the demand for construction land will keep increasing and will be increasingly met by fitting the cracks in the interior of valley basins or by cutting mountains or encroaching on surrounding high-quality agricultural land. As a result, agricultural space and ecological space will inevitably be occupied, and the proportion of the land structure will be imbalanced, which is completely contrary to the strategic orientation of ecological protection in the upper reaches of the Yellow River basin. Under the ecological optimization scenario, the expansion rate of construction land will be effectively slowed down, and the problem of construction land encroaching on cultivated land and ecological land will also be alleviated. Moreover, the construction land expansion will tend to be areas with lower ecological suitability, which effectively protects the integrity of ecological land. At the same time, the ecological benefits will increase by 1.3% in 2035 through land use structure optimization, with a 0.105% rise above the scenario of business as usual. Even though the economic benefits will not increase as much as in the business as usual scenario, they will more than triple from 2020, fully achieving the GDP growth targets of the 14th Five-Year Plan of Gansu and Qinghai provinces (Table 9). It is clear that the land use model under the ecological optimization scenario not only ensures the stability of the ecological security in the LX region, but also coordinates the land use conflict among economic development, ecological protection, and grain production, making the socioeconomic and ecological benefits more balanced. It suggests that ecological protection and socioeconomic development can coexist in a win–win way.

4.3. Policy Implications

The appropriateness of selecting ecological sources is crucial to the evaluation results of LES [70]. In our study, the ecological sources are mainly composed of forests, water systems, and large patches of grassland with higher coverage, covering the Yellow River, Huangshui, Qinghai Lake, Beishan National Geopark, forest parks including Beishan, Ebla, Maixiu, Qunjia, Nanmen Gorge, Xiaqunsi, as well as Nature reserves such as Beichuan River source area, Mengda of Qinghai, Xinglong Mountain in Yuzhong County, Liancheng in Yongdeng County, Yellow River Stone Forest in Jingtai County, and Three Gorges Wetland in Yongjing County. These ecological sources are areas with good ecological environment quality in the LX region and are vital in protecting regional biodiversity and ecological security, which is consistent with the results obtained through the ecosystem service analysis by Tong et al. (2020) [71]. The LES zones based on the results of the LES evaluation are generally consistent with the main functional areas of the LX urban agglomeration and are more detailed and more conducive to practice. The zones of the HES and SES include the main nature reserves and national forest parks of the urban agglomeration, which can be regarded as the core area of ecological protection in the LX region, and any development and construction activities should be prohibited. Hence, they are also areas that restrict land type conversion in the land optimization process of our study. The NES zone is mostly distributed in urban areas where urban construction density is the highest. Since the urban problems gradually become prominent, the carrying capacity of resources and the environment begins to decline, so this area should be used as production and living spaces that need to be optimized. The LES zone is mostly in the urban–rural combination belt and the area with high-density rural settlements where there are good agglomeration conditions for economy and population, as well as a stronger carrying capacity of resources and environment. Therefore, it can be used as the key development zone for the production activities of industry and minerals in the future, and can also be used as backup land for the expansion of living space. The MES zone is located in a transition area, having a buffering effect protecting the core ecological area, and development and construction can be guided in an appropriate and reasonable way based on the prioritization of ecological protection (Table 6).
It can be seen, the MCR-MOP-Dyna-CLUE model framework established in our study not only has high simulation accuracy, but can also maintain ecological priority, ensure food security, and achieve economic growth through land use optimization in the LX urban agglomeration. Therefore, although the proposed model framework may not be suitable for mature metropolitan areas (such as urban clusters in western economically developed areas), it can be of great help to land optimization and sustainable development in areas where new urban agglomerations are being formed. Particularly, in the context of China’s multi-planning integration, this approach can be used as one of the mathematical modeling methods for territorial spatial planning to assist other city clusters as well as provinces, cities, and counties to determine more detailed and accurate urban land growth boundaries, ecological protection red lines, and arable land protection red lines in China.

4.4. Limitations and Future Research

This study has made some significant advances, yet there are still several shortcomings that require more research. Firstly, due to the lack of historical data at the county level of the LX urban agglomeration, the ecological benefit coefficient is based on 2020, which was initially considered to reduce the prediction accuracy of land use demand. Fortunately, after repeated verification and comparison with existing research [15], it was found that the experimental results do not affect the overall trend of the land use quantity structure. Secondly, due to the lack of specific reference standards in the study area, a few constraints of the MOP model are derived from historical evolution trends, which may be somewhat subjective. Detailed field investigations should be carried out in follow-up studies to ensure that the research results are more objective for this reason. Finally, the Dyna-CLUE model requires quantifiable driving factors, so non-quantifiable factors such as policies were not selected as driving factors. In the follow-up, we will try to quantify this by weighting and incorporating it into the driving factor analysis process of the Dyna-CLUE model.

5. Conclusions

This study identified the optimal land use structure with the MOP based on ecosystem service value, economic benefits, and grain production, comprehensively evaluated LES from both the vertical and horizontal process with the MCR model, and then embedded the evolution results into the land optimization process and constructed the new integrated model framework of MCR-MOP-Dyna-CLUE to optimally simulate land use patterns in the Lan–Xi region, a typical primary developing urban agglomeration. At the same time, the business as usual scenario was used for comparison. The conclusions are: (1) during 1995–2020, the land use changes in the LX urban agglomeration were mainly characterized by the large expansion of construction land, which occupied a great number of cultivated lands, woodlands, and grasslands. The pattern of construction land expansion was consistent with cultivated land degradation; (2) the integrated MCR-MOP-Dyna-CLUE model based on LES could effectively identify the optimal and sustainable land use pattern of the study area; (3) accordingly, the simulation results under the ecological optimization scenario are more reasonable. The land expansion rate for construction was appropriately controlled, and problems of construction land encroaching on cultivated land and ecological land could be effectively alleviated. In 2035, the construction land of the ecological optimization scenario was 19,622.69 ha less than that of the business as usual scenario, whereas the arable land was 32,103.29 ha more than the business as usual scenario. Furthermore, the economic benefit could be increased on the basis of fully satisfying the demands for economic development, and a relative balance between ecological and economic benefits could be achieved. The ecological benefit will increase by 187,490.4595 million yuan and the economic benefit increase by 151,808,605.1 million yuan from 2020 to 2035 under the ecological optimization scenario. In summary, the optimization results can not only better stabilize the ecological security pattern, but also leave enough territorial space for food security and economic development, which provides a scientific reference for formulating sustainable land use patterns in areas where there are new agglomerations forming.

Supplementary Materials

The following supporting information can be downloaded at: https://www.mdpi.com/article/10.3390/land12061164/s1.

Author Contributions

Conceptualization, X.C., P.S. and R.Z.; methodology, X.C.; software, X.C. and X.Y.; validation, X.C. and R.Z.; formal analysis, X.C.; investigation, X.C.; resources, X.C., P.S. and R.Z.; writing—original draft preparation, X.C.; writing—review and editing, X.C., Z.H., J.W. and H.D.; visualization, X.C. and X.Y.; supervision, R.Z. and L.Z. All authors have read and agreed to the published version of the manuscript.

Funding

This research is supported by the National Natural Science Foundation of China (41261047, 41761043, 41771130, 41661035, 42161043); Science and Technology Plan of Gansu Province (20YF3FA042, 20JR5RA529); Youth Teacher Scientific Capability Promoting Project of Northwest Normal University (NWNU-LKQN-17-7).

Data Availability Statement

All data are available on the relevant platforms described in the text.

Conflicts of Interest

The authors declare no conflict of interest.

References

  1. Fang, C.L.; Yu, D.L. Urban agglomeration: An evolving concept of an emerging phenomenon. Landsc. Urban Plan. 2017, 162, 126–136. [Google Scholar] [CrossRef]
  2. Fang, C.L. The basic law of the formation and expansion in urban agglomerations. J. Geogr. Sci. 2019, 29, 1699–1712. [Google Scholar] [CrossRef]
  3. Li, J.Z.; Ouyang, X.; Zhu, X. Land space simulation of urban agglomerations from the perspective of the symbiosis of urban development and ecological protection: A case study of Changsha-Zhuzhou-Xiangtan urban agglomeration. Ecol. Indic. 2021, 126, 107669. [Google Scholar] [CrossRef]
  4. Ouyang, X.; Xu, J.; Li, J.Y.; Wei, X.; Li, Y.H. Land space optimization of urban-agriculture-ecological functions in the Changsha-Zhuzhou-Xiangtan Urban Agglomeration, China. Land Use Policy 2022, 117, 106112. [Google Scholar] [CrossRef]
  5. Simkin, R.D.; Seto, K.C.; McDonald, R.I.; Jetz, W. Biodiversity impacts and conservation implications of urban land expansion projected to 2050. Proc. Natl. Acad. Sci. USA 2022, 119, e2117297119. [Google Scholar] [CrossRef] [PubMed]
  6. Fang, C.L.; Zhang, G.Y.; Xue, D.S. High-quality development of urban agglomerations in China and construction of science and technology collaborative innovation community. Acta Geogr. Sin. 2021, 76, 2898–2908. [Google Scholar] [CrossRef]
  7. Pan, T.T.; Yan, F.Q.; Su, F.Z.; Lyne, V.; Zhou, C.D. Land Use Optimization for Coastal Urban Agglomerations Based on Economic and Ecological Gravitational Linkages and Accessibility. Land 2022, 11, 1003. [Google Scholar] [CrossRef]
  8. Marull, J.; Pino, J.; Tello, E.; Cordobilla, M.J. Social metabolism, landscape change and land-use planning in the Barcelona Metropolitan Region. Land Use Policy 2010, 27, 497–510. [Google Scholar] [CrossRef]
  9. Hasegawa, T.; Fujimori, S.; Ito, A.; Takahashi, K.; Masui, T. Global land-use allocation model linked to an integrated assessment model. Sci. Total Environ. 2017, 580, 787–796. [Google Scholar] [CrossRef] [PubMed]
  10. Verburg, P.H.; Tabeau, A.; Hatna, E. Assessing spatial uncertainties of land allocation using a scenario approach and sensitivity analysis: A study for land use in Europe. J. Environ. Manag. 2013, 127, S132–S144. [Google Scholar] [CrossRef]
  11. Chakir, R.; Le Gallo, J. Predicting land use allocation in France: A spatial panel data analysis. Ecol. Econ. 2013, 92, 114–125. [Google Scholar] [CrossRef]
  12. Wu, X.T.; Wang, S.; Fu, B.J.; Liu, Y.; Zhu, Y. Land use optimization based on ecosystem service assessment: A case study in the Yanhe watershed. Land Use Policy 2018, 72, 303–312. [Google Scholar] [CrossRef]
  13. Zheng, W.W.; Ke, X.L.; Xiao, B.Y.; Zhou, T. Optimising land use allocation to balance ecosystem services and economic bene-fits—A case study in Wuhan, China. J. Environ. Manag. 2019, 248, 109306. [Google Scholar] [CrossRef]
  14. Sun, X.; Crittenden, J.C.; Li, F.; Lu, Z.M.; Dou, X.L. Urban expansion simulation and the spatio-temporal changes of ecosystem services, a case study in Atlanta Metropolitan area, USA. Sci. Total Environ. 2018, 622, 974–987. [Google Scholar] [CrossRef]
  15. Ma, B.Y.; Huang, J.; Li, S.C. Optimal allocation of land use types in the Beijing-Tianjin-Hebei urban agglomeration based on ecological and economic benefits trade-offs. Prog. Geogr. 2019, 38, 26–37. [Google Scholar] [CrossRef]
  16. Hu, M.M.; Wang, Y.F.; Xia, B.C.; Jiao, M.Y.; Huang, G.H. How to balance ecosystem services and economic benefits?–A case study in the Pearl River Delta, China. J. Environ. Manag. 2020, 271, 110917. [Google Scholar] [CrossRef] [PubMed]
  17. Zhang, X.; Gu, R. Spatio-temporal pattern and multi-scenario simulation of land use conflict: A case study of the Yangtze River Delta urban agglomeration. Geogr. Res. 2022, 41, 1311–1326. [Google Scholar] [CrossRef]
  18. Yan, Y.L.; Yu, T.; Chen, H. Development Stage, Spatial Expansion and Dynamic Mechanism of National Urban Agglomeration. Areal Res. Dev. 2021, 40, 51–57. [Google Scholar] [CrossRef]
  19. Jia, Z.; Zhao, J.; Yang, Y.; Chen, X. Spatial pattern and spatial convergence of environmental regulation efficiency of Lanzhou-Xining urban agglomeration in the Yellow River Basin. J. Sci. Geogr. Sin. 2022, 42, 568–578. [Google Scholar] [CrossRef]
  20. Yang, Y.; Zhang, X.; Mu, Y.; Zhang, W. The basic logic and core strategies of ecological protection and high-quality development in the upper reaches of the Yellow River. Econ. Geogr. 2020, 40, 9–20. [Google Scholar] [CrossRef]
  21. Zheng, X.Q.; Zhao, L.; Xiang, W.N.; Li, N.; Lv, L.N.; Yang, X. A coupled model for simulating spatio-temporal dynamics of land-use change: A case study in Changqing, Jinan, China. Landsc. Urban Plan. 2012, 106, 51–61. [Google Scholar] [CrossRef]
  22. Li, X.X.; Ma, W.Y.; Xu, L. Land use structure optimization research based on the markov chain in the west of Jilin province. Res. Soil Water Conserv. 2013, 20, 229–232+237+311. [Google Scholar]
  23. Guo, X.Y.; Liu, X.L.; Wang, L.G. Land use optimization in order to improve ecosystem service: A case of Lanzhou city. Acta Ecol. Sin. 2016, 36, 7992–8001. [Google Scholar] [CrossRef]
  24. Tayyebi, A.; Pijanowski, B.C. Modeling multiple land use changes using ANN, CART and MARS: Comparing tradeoffs in goodness of fit and explanatory power of data mining tools. Int. J. Appl. Earth Obs. Geoinf. 2014, 28, 102–116. [Google Scholar] [CrossRef]
  25. Liao, G.T.; He, P.; Gao, X.S.; Lin, Z.Y.; Huang, C.Y.; Zhou, W.; Deng, O.P.; Xu, C.H.; Deng, L.J. Land use optimization of rural production-living-ecological space at different scales based on the BP-ANN and CLUE-S models. Ecol. Indic. 2022, 137, 108710. [Google Scholar] [CrossRef]
  26. Ning, S.; Zhang, Z.Y.; Zhou, H.W.; Li, L.; Zhao, G.N. Optimization of land use structure based on ecological service value in Manas River Basin. Acta Ecol. Sin. 2019, 39, 5208–5217. [Google Scholar] [CrossRef]
  27. Li, W.; Chen, Z.J.; Li, M.C.; Zhang, H.; Li, M.Y.; Qiu, X.Q.; Zhou, C. Carbon emission and economic development trade-offs for optimizing land-use allocation in the Yangtze River Delta, China. Ecol. Indic. 2023, 147, 109950. [Google Scholar] [CrossRef]
  28. Rahman, M.M.; Szabo, G. Multi-objective urban land use optimization using spatial data: A systematic review. Sustain. Cities Soc. 2021, 74, 103214. [Google Scholar] [CrossRef]
  29. Wang, Y.; Li, X.M.; Zhang, Q.; Li, J.F.; Zhou, X.W. Projections of future land use changes: Multiple scenarios -based impacts analysis on ecosystem services for Wuhan city, China. Ecol. Indic. 2018, 94, 430–445. [Google Scholar] [CrossRef]
  30. Crooks, A.T. Constructing and implementing an agent-based model of residential segregation through vector GIS. Int. J. Geogr. Inf. Sci. 2010, 24, 661–675. [Google Scholar] [CrossRef]
  31. Ma, S.F.; He, J.H.; Liu, F.; Yu, Y. Land-use spatial optimization based on PSO algorithm. Geo-Spat. Inf. Sci. 2011, 14, 54–61. [Google Scholar] [CrossRef]
  32. Mohamed, A.; Worku, H. Simulating urban land use and cover dynamics using cellular automata and Markov chain approach in Addis Ababa and the surrounding. Urban Clim. 2020, 31, 100545. [Google Scholar] [CrossRef]
  33. Wang, Y.Y.; Chao, B.X.; Dong, P.; Zhang, D.A.; Yu, W.W.; Hu, W.J.; Ma, Z.Y.; Chen, G.C.; Liu, Z.H.; Chen, B. Simulating spatial change of mangrove habitat under the impact of coastal land use: Coupling MaxEnt and Dyna-CLUE models. Sci. Total Environ. 2021, 788, 147914. [Google Scholar] [CrossRef] [PubMed]
  34. Lin, W.B.; Sun, Y.M.; Nijhuis, S.; Wang, Z.L. Scenario-based flood risk assessment for urbanizing deltas using future land-use simulation (FLUS): Guangzhou Metropolitan Area as a case study. Sci. Total Environ. 2020, 739, 139899. [Google Scholar] [CrossRef] [PubMed]
  35. Liang, X.; Guan, Q.F.; Clarke, K.C.; Liu, S.S.; Wang, B.Y.; Yao, Y. Understanding the drivers of sustainable land expansion using a patch-generating land use simulation (PLUS) model: A case study in Wuhan, China. Comput. Environ. Urban Syst. 2021, 85, 101569. [Google Scholar] [CrossRef]
  36. Lin, J.Y.; Li, X.; Wen, Y.Y.; He, P.T. Modeling urban land-use changes using a landscape-driven patch-based cellular automaton (LP-CA). Cities 2023, 132, 103906. [Google Scholar] [CrossRef]
  37. Geng, X.; Hu, S.; Xiao, Y.; Wang, X.M. Land use pattern optimization and evaluation based on ESVof agro-pastoral ecotone in Northeast China. J. Nat. Resour. 2022, 37, 1799–1814. [Google Scholar] [CrossRef]
  38. Verburg, P.H.; Overmars, K.P. Combining top-down and bottom-up dynamics in land use modeling: Exploring the future of abandoned farmlands in Europe with the Dyna-CLUE model. Landsc. Ecol. 2009, 24, 1167–1181. [Google Scholar] [CrossRef]
  39. Verburg, P.H.; Soepboer, W.; Veldkamp, A.; Limpiada, R.; Espaldon, V.; Mastura, S.S. Modeling the spatial dynamics of regional land use: The CLUE-S model. Environ. Manag. 2002, 30, 391–405. [Google Scholar] [CrossRef]
  40. McHarg, I.; Mumford, L. Design with Nature; American Museum of Natural History: New York, NY, USA, 1969. [Google Scholar]
  41. Franco, L.; Magalhães, M.R. Assessing the ecological suitability of land-use change. Lessons learned from a rural marginal area in southeast Portugal. Land Use Policy 2022, 122, 106381. [Google Scholar] [CrossRef]
  42. Zheng, Q.; Yang, X.; Wang, K.; Huang, L.Y.; Shahtahmassebi, A.R.; Gan, M.Y.; Weston, M.V. Delimiting Urban Growth Boundary through Combining Land Suitability Evaluation and Cellular Automata. Sustainability 2017, 9, 2213. [Google Scholar] [CrossRef]
  43. Chen, Y.P.; Zheng, B.H.; Liu, R.J. The Evolution of Ecological Space in an Urban Agglomeration Based on a Suitability Evaluation and Cellular Automata Simulation. Sustainability 2022, 14, 7455. [Google Scholar] [CrossRef]
  44. Li, Q.G.; Wang, L.C.; Gul, H.N.; Li, D. Simulation and optimization of land use pattern to embed ecological suitability in an oasis region: A case study of Ganzhou district, Gansu province, China. J. Environ. Manag. 2021, 287, 112321. [Google Scholar] [CrossRef]
  45. Liu, Y.S.; Wang, J.Y.; Guo, L.Y. GIS-based assessment of land suitability for optimal allocation in the Qinling Mountains, China. Pedosphere 2006, 16, 579–586. [Google Scholar] [CrossRef]
  46. Dai, L.; Liu, Y.B.; Luo, X.Y. Integrating the MCR and DOI models to construct an ecological security network for the urban agglomeration around Poyang Lake, China. Sci. Total Environ. 2021, 754, 141868. [Google Scholar] [CrossRef] [PubMed]
  47. Ning, J.; Liu, J.Y.; Kuang, W.H.; Xu, X.L.; Zhang, S.W.; Yan, C.Z.; Li, R.D.; Wu, S.X.; Hu, Y.F.; Du, G.M.; et al. Spatiotemporal patterns and characteristics of land-use change in China during 2010–2015. J. Geogr. Sci. 2018, 28, 547–562. [Google Scholar] [CrossRef]
  48. Xu, X.; Liu, J.; Zhang, S.; Li, R.; Yan, C.; Wu, S. China’s Multiperiod Land Use Land Cover Remote Sensing Monitoring Dataset; (CNLUCC), Chinese Academy of Sciences Resource and Environmental Science Data Center Data Registration and Publishing System: Beijing, China, 2018. [Google Scholar] [CrossRef]
  49. Li, L.; Huang, X.J.; Wu, D.F.; Wang, Z.L.; Yang, H. Optimization of ecological security patterns considering both natural and social disturbances in China’s largest urban agglomeration. Ecol. Eng. 2022, 180, 106647. [Google Scholar] [CrossRef]
  50. Wei, L.; Zhou, L.; Sun, D.Q.; Yuan, B.; Hu, F.N. Evaluating the impact of urban expansion on the habitat quality and constructing ecological security patterns: A case study of Jiziwan in the Yellow River Basin, China. Ecol. Indic. 2022, 145, 109544. [Google Scholar] [CrossRef]
  51. Zhou, D.; Xu, J.C.; Lin, Z.L. Conflict or coordination? Assessing land use multi-functionalization using production-living-ecology analysis. Sci. Total Environ. 2017, 577, 136–147. [Google Scholar] [CrossRef]
  52. Yan, Y.T.; Zhou, R.; Ye, X.Y.; Zhang, H.; Wang, X.J. Suitability evaluation of urban construction land based on an approach of vertical-horizontal processes. ISPRS Int. J. Geo-Inf. 2018, 7, 198. [Google Scholar] [CrossRef]
  53. Akin, A.; Erdogan, N.; Berberoglu, S.; Cilek, A.; Erdogan, A.; Donmez, C.; Satir, O. Evaluating the efficiency of future crop pattern modelling using the CLUE-S approach in an agricultural plain. Ecol. Inform. 2022, 71, 101806. [Google Scholar] [CrossRef]
  54. Peng, K.F.; Jiang, W.G.; Deng, Y.; Liu, Y.H.; Wu, Z.F.; Chen, Z. Simulating wetland changes under different scenarios based on integrating the random forest and CLUE-S models: A case study of Wuhan Urban Agglomeration. Ecol. Indic. 2020, 117, 106671. [Google Scholar] [CrossRef]
  55. Johnston, R.; Jones, K.; Manley, D. Confounding and collinearity in regression analysis: A cautionary tale and an alternative procedure, illustrated by studies of British voting behaviour. Qual. Quant. 2018, 52, 1957–1976. [Google Scholar] [CrossRef]
  56. Chen, W.; Li, J.F.; Zhu, L. Spatial heterogeneity and sensitivity analysis of ecosystem services value in the Middle Yangtze River region. J. Nat. Resour 2019, 34, 325–337. [Google Scholar] [CrossRef]
  57. Xie, G.D.; Zhang, C.X.; Zhen, L.; Zhang, L.M. Dynamic changes in the value of China’s ecosystem services. Ecosyst. Serv. 2017, 26, 146–154. [Google Scholar] [CrossRef]
  58. Zhou, Y.; Chang, J.; Feng, S.S. Effects of urban growth boundaries on urban spatial structural and ecological functional optimi-zation in the Jining Metropolitan Area, China. Land Use Policy 2022, 117, 106113. [Google Scholar] [CrossRef]
  59. Liu, Y.F.; Ming, D.P.; Yang, J.Y. Optimization of land use structure based on ecological GREEN equivalent. Geo-Spat. Inf. Sci. 2002, 5, 60–67. [Google Scholar] [CrossRef]
  60. Fu, J.Y.; Bu, Z.Q.; Jiang, D.; Lin, G.; Li, X. Sustainable land use diagnosis based on the perspective of production–living–ecolog-ical spaces in China. Land Use Policy 2022, 122, 106386. [Google Scholar] [CrossRef]
  61. Song, X.P.; Hansen, M.C.; Stehman, S.V.; Potapov, P.V.; Tyukavina, A.; Vermote, E.F.; Townshend, J.R. Global land change from 1982 to 2016. Nature 2018, 560, 639–643. [Google Scholar] [CrossRef]
  62. Yang, X.D. Landscape Ecological Risk Evaluation of Lanxi City Cluster and its Early Warning Research; Northwest Normal University: Lanzhou, China, 2021. [Google Scholar]
  63. Wang, Q.R.; Liu, R.M.; Men, C.; Guo, L.J. Application of genetic algorithm to land use optimization for non-point source pollution control based on CLUE-S and SWAT. J. Hydrol. 2018, 560, 86–96. [Google Scholar] [CrossRef]
  64. Liu, P.J.; Hu, Y.C.; Jia, W.T. Land use optimization research based on FLUS model and ecosystem services-setting Jinan City as an example. Urban Clim. 2021, 40, 100984. [Google Scholar] [CrossRef]
  65. Li, Q.G.; Wang, L.C.; Yan, C.X.; Liu, H.Y. Simulation of urban spatial expansion in oasis towns based on habitat quality: A case study of the middle reaches of Heihe River. Acta Ecol. Sin 2020, 40, 2920–2931. [Google Scholar] [CrossRef]
  66. Gu, M.L.; Ye, C.S.; Li, X.; Hu, H.P. Land-Use optimization based on ecosystem service value: A case study of urban agglomeration around Poyang lake, China. Sustainability 2022, 14, 7131. [Google Scholar] [CrossRef]
  67. Yang, X.D.; Chen, X.P.; Qiao, F.W.; Che, L.; Pu, L.L. Layout optimization and multi-scenarios for land use: An empirical study of production-living-ecological space in the Lanzhou-Xining City Cluster, China. Ecol. Indic. 2022, 145, 109577. [Google Scholar] [CrossRef]
  68. Fang, C.L. Spatial organization pattern and high-quality development of urban agglomeration in the Yellow River Basin. Econ. Geogr 2020, 40, 1–8. [Google Scholar] [CrossRef]
  69. Chen, X.D.; Shi, P.J.; Wang, C.; Yue, X.X.; Liu, X.X.; Zhang, W.M. Responses of landscape ecological pattern to the expansion of urban construction land in river valley city under different scenarios: A case study of Lanzhou. Chin. J. Ecol. 2018, 37, 3381–3389. [Google Scholar] [CrossRef]
  70. Yu, Q.; Yue, D.P.; Wang, J.P.; Zhang, Q.B.; Li, Y.T.; Yu, Y.; Chen, J.X.; Li, N. The optimization of urban ecological infrastructure network based on the changes of county landscape patterns: A typical case study of ecological fragile zone located at Deng Kou (Inner Mongolia). J. Clean. Prod. 2017, 163, S54–S67. [Google Scholar] [CrossRef]
  71. Tong, H.L.; Shi, P.J. Using ecosystem service supply and ecosystem sensitivity to identify landscape ecology security patterns in the Lanzhou-Xining urban agglomeration, China. J. Mt. Sci. 2020, 17, 2758–2773. [Google Scholar] [CrossRef]
Figure 1. Location of the LX urban agglomeration.
Land 12 01164 g001
Figure 2. The framework for optimizing land use.
Land 12 01164 g002
Figure 3. Chord diagram of land use transition during 1995–2020.
Land 12 01164 g003
Figure 4. Locations of land use spatial change (1, 2, 3, 4, 5, and 6 refer to cultivated land, woodland grassland, water area, construction land, and unused land, respectively, “→” denotes transfer between two land use types, for example, 1→6 means conversion from cultivated land to unused land, 2→1 means conversion from woodland land to cultivated land, and so on).
Land 12 01164 g004
Figure 5. Comprehensive resistance surfaces of ecological sources (a) and construction sources (b) expansion.
Land 12 01164 g005
Figure 6. Minimum cumulative resistance surfaces of ecological sources (a) and construction sources (b) expansion.
Land 12 01164 g006
Figure 7. Distribution of LES zones.
Land 12 01164 g007
Figure 8. Simulated land use maps under the business as usual scenario (a) and ecological optimization scenario (b) in 2035.
Land 12 01164 g008
Figure 9. Distribution of land use types in 2020 (a), business as usual scenario (b), and ecological optimization scenario (c).
Land 12 01164 g009
Table 1. Data sources in this study.
Required DataData DescriptionData Source
Land use dataLand use data during 1995 and 2020Data Center for Resources and Environmental Sciences, Chinese Academy of Sciences (RESDC) (http://www.resdc.cn/, accessed on 20 May 2023)
Geographic dataDigital elevation model (DEM)
Slope data
Vegetation cover (NDVI) data
Geospatial Data Cloud (http://www.gscloud.cn, accessed on 20 May 2023)
Extracted from the DEM
GEE (Google Earth Engine)
Meteorological dataAnnual average precipitation for 26 years from 1995 to 2020 Data Center for Resources and Environmental Sciences (https://www.resdc.cn, accessed on 20 May 2023)
Soil dataThe soil type mapNational Tibetan Plateau Data Center (http://data.tpdc.ac.cn, accessed on 20 May 2023)
Traffic dataMaps of national highways, provincial highways, county highways, and railways in 1995, 2005, 2015, and 2020National Tibetan Plateau Data Center
Statistical dataPopulation size, GDP, and output value of agriculture, forestry, animal husbandry, fisheries, and secondary and tertiary industries of 39 districts (counties) from 1995 to 2020Qinghai Statistical Yearbook and Gansu Province Development Yearbook
Grain output and crop sown areaThe National Economic and Social Development Bulletin of each region
Grain pricesNational Agricultural Product Cost and Income Data Compilation
Table 2. Summary of the abbreviations with their descriptions.
AbbreviationsDescriptions
LXLanzhou–Xining
LESLand ecological suitability
MOPMulti-objective linear programming
MCRMinimum cumulative resistance
Dyna-CLUEDynamic Conversion of Land Use and its Effects
HESHigh Ecological Suitability
SESSub-high Ecological Suitability
MESMedium Ecological Suitability
LESLow Ecological Suitability
NESNon-Ecological Suitability
Table 3. Economic benefit value (Eco) and ecological benefits (ESV) per unit area.
Land Use TypesCultivated LandWoodlandGrasslandWater AreaConstruction LandUnused
Eco per area (Yuan/ha)490,726.62666.929,548.32270.93,793,715.30
ESV per area (Yuan/ha)504726,688.1516,344.6192,051.930880.69
Table 4. The constraint conditions of MOP.
Constrained ObjectivesThe FormulasThe Illustration
Total land area constraint i = 1 6 s i = 9 , 651 , 634.3982 The total area of various types of land use should be equal to that of the study area and remains unchanged.
Economic benefit constraint i = 1 6 c i s i = 137 , 724 , 628.4 According to the average annual GDP growth rate of 6.5% and 5.5% in Gansu Province and Qinghai Province of the 14th Five-Year Plan, the total GDP in 2035 was predicted based on the total GDP in 2020. Considering the impact of uncertain factors such as epidemics and natural disasters, the forecast for 2035 was reduced by 5%, which was finally utilized as the minimum value of the total land economic benefits in 2035.
Grain yield constraint4487.779 s1 ≥ 450 * 13,698,000According to the food production safety standard in China, the total grain output of cultivated land in 2035 must meet the well-off standard line of the entire population in the urban agglomeration in the current year, that is, 450 kg/a per capita. The population in 2035 was predicted to be about 13.698 million by the GM (1,1) model on the basis of 1995–2020.
Green equivalent
constraint
0.46s1 + s2 + 0.49s3 ≥ 46,239,966.870866“Green equivalent” refers to the “Green amount” with the ecological function of the quantitative forest, which can provide quantitative photosynthesis. Generally, land use types that can provide green equivalent include woodland, grassland, and cropland, with coefficients of 1, 0.49, and 0.46, respectively [35,59]. The green equivalent of the LX urban agglomeration in 2035 was expected not to be lower than that of 2020.
Cultivated land constraint1,401,164.9 < s1 ≤ 1,846,355.7 * 0.02According to the land use planning of Gansu Province and Qinghai Province and the proportion of cultivated land in the LX area of the total cultivated land in the two provinces, the minimum quantity of cultivated land is 14,011,64.9 ha in 2020. This was determined to be the minimum of cultivated land area in 2035. According to the probability of land transfer, the maximum of cultivated land area would increase by 0.5% on the basis of 2020.
Woodland constraints893,032.7 ≤ s2 ≤ 895,172.1Since 2005, the area of forest land in this area has been increasing. Thus, we set the area of woodland in 2020 as the minimum and the area in 2035 predicted by the Markov chain as the maximum.
Grassland area
constraint
5,880,846.984 ≤ s3 ≤ 5,909,801.248Because the grassland of the LX region increased during 1995 and 2020, the minimum grassland area was the current situation in 2020, and the maximum was that in 2035 predicted by the Markov chain under the business as usual scenario.
Water area
constraint
155,829.28 ≤ s4 ≤ 171,020.5359The water areas are also on the rise. Thus, the water areas in 2020 were set as the lower bound, and the water areas in 2035 predicted by the Markov chain were the upper bound.
Construction land constraint233,547.0344 ≤ s5 ≤ 233,547.0344 * 1.25The built-up area is relatively stable and the probability of conversion to other land use type is small. Therefore, the current construction land area was set as the lower bound. Due to the limited construction land stock, the upper bound would only increase by 25% on the basis of 2020.
Unutilized land constraints6 ≥ 642,032.4015 * 0.025In order to maintain the diversity of land landscape, the proportion of unused land was set at no less than 2.5% of the total area of the study area according to previous studies [29].
Table 5. Land use change during 1995–2020.
Land Use Types1995–20052005–20152015–20201995–2020
The Changed Area (ha)Average Annual
Change Rate (%)
The Changed Area (ha)Average Annual
Change Rate (%)
The Changed Area (ha)Average Annual
Change Rate (%)
The Changed Area (ha)Average Annual
Change Rate (%)
Cultivated land−23,695.71−0.13−17,714.63−0.09−11,481.70−0.12−52,892.04−0.11
Woodland−3928.82−0.042643.330.03−543.34−0.01−1828.82−0.01
Grassland26,514.930.0571,258.190.12−23,246.03−0.0874,527.090.05
Water areas10,237.450.7712,658.440.885016.030.6627,911.920.79
Construction land19,488.981.4245,846.692.7339,095.543.73104,431.212.40
Unused land−28,616.83−0.37−114,692.02−1.61−8840.50−0.27−152,149.35−0.85
Dynamic
index
2.833.201.412.29
Table 6. Details of LES zoning in LX urban agglomeration.
Threshold IntervalLES ZonesArea (ha)Proportion (%)Development Direction
−184,525–31,378.70HES1,594,521.0416.52Ecological core zone
−31,378.70–20,233.24SES987,653.3310.23
−20,233.24–4248.30MES3,705,424.7138.39Ecological buffer zone
−4248.30–2790.93LES2,361,127.9524.46Suitable construction zone
2790.93–69,369NES1,002,907.3710.39Suitable construction zone
Table 7. Regression results of driving factors for the spatial distribution of land use in the LX urban agglomeration.
Driving FactorsExp(B) and ROC Values for Regression Results in 1995
Cultivated LandWoodlandGrasslandWater AreasConstruction LandUnused Land
Elevation (m)0.99771 1.00037−0.000360.998281.00185
Slope (°)0.867001.167721.019510.908630.846141.00810
Multi-year mean precipitation (mm)0.999911.000030.999991.000010.999680.99999
Soil type1.000011.000000.999990.999990.999971.00000
Vegetation coverage (%)1.000031.000021.000010.996360.999971.00001
Distance to main roads (m)1.000200.999950.99987 0.9000741.00013
Distance to city center (m)0.990971.009271.003350.987430.980000.98445
Distance to water areas (m)52.322222931.7830.249490.2863425.228590.00050
GDP per capita (yuan/person)1.000171.000151.00001 1.000070.99992
Population Density (person/ha)1.000110.999800.99952 1.000540.99532
ROC0.8052020.8563210.7805340.9821410.8706140.885693
Driving factorsExp(B) and ROC values for regression results in 2005
Cultivated landWoodlandGrasslandWater areasConstruction landUnused land
Elevation (m)0.997590.999861.00044 0.998291.00226
Slope (°)0.865471.155141.018410.917040.833360.99355
Multi-year mean precipitation (mm)0.999901.000040.999991.000020.999640.99997
Soil type1.000011.000000.999990.999990.999971.00000
Vegetation coverage (%)1.000041.000021.000010.994790.999980.99999
Distance to main roads (m)1.00027 0.99985 0.99992
Distance to city center (m)0.989251.004651.003480.980660.981050.97755
Distance to water areas (m)21.819661077.3470.351120.2619814.770160.00122
GDP per capita (yuan/person) 1.000031.000001.000021.000030.99999
Population Density (person/ha)0.99986 0.99967 1.000470.99767
ROC0.800360.852060.776520.989820.873290.8695
Driving factorsExp(B) and ROC values for regression results in 2015
Cultivated landWoodlandGrasslandWater areasConstruction landUnused land
Elevation (m)0.99804 1.000420.999750.998901.00200
Slope (°)0.861071.157861.029140.917330.800970.96678
Multi-year mean precipitation (mm)0.999901.000030.999991.000040.999560.99998
Soil type1.000000.999991.000001.000000.999931.00001
Vegetation coverage (%)1.000031.000021.000020.992950.99996
Distance to main roads (m)1.000050.999940.999930.999790.900331.00011
Distance to city center (m)0.98589 1.004050.968970.984910.98891
Distance to water areas (m)17.93796565.73180.292551.438750.705250.00090
GDP per capita (yuan/person)1.000011.000011.00000 1.000010.99999
Population Density (person/ha)0.999921.000110.99975 1.000230.99984
ROC0.79550.856070.791880.993680.878920.88425
Driving factorsExp(B) and ROC values for regression results in 2020
Cultivated landWoodlandGrasslandWater areasConstruction landUnused land
Elevation (m)0.998011.000231.000300.999640.999161.00165
Slope (°)0.855261.154301.028400.898670.769040.97528
Multi-year mean precipitation (mm)0.999891.00003 1.000060.999660.99997
Soil type1.000001.000001.000000.999990.999931.00001
Vegetation coverage (%)1.000031.000021.000020.929300.999991.00001
Distance to main roads (m)1.00016 0.99975 0.900541.00010
Distance to city center (m)0.984901.002911.002640.966610.991710.99621
Distance to water areas (m)28.814713281.99 0.424380.024810.00071
GDP per capita (yuan/person)1.000031.00001 1.000011.000010.99999
Population Density (person/ha)0.999931.000100.999790.999891.000180.99908
ROC0.792860.861020.767210.996570.873430.89383
All variables significant at p < 0.01. Exp(B) values indicate the change in odds upon one unit change in the independent variable. When Exp(B) > 1, the probability increases upon an increase in the value of the independent variable, when exp(B) < 1, the probability decreases.
Table 8. The Kappa coefficients of the CLUE-S verified in Lan-Xi urban agglomeration.
Simulation
Years
2020 Simulated
in 1995
2015 Simulated
in 1995
2005 Simulated
in 1995
2020 Simulated
in 2005
2015 Simulated
in 2005
2020 Simulated
in 2015
Overall Accuracy0.96940.97600.99590.97270.98070.9834
Kappa Coefficient0.93550.94420.98440.94720.95640.9891
Table 9. Growth of ecosystem service value and economic benefits from 2020 to 2035.
Simulation ScenariosEcological BenefitsEconomic Benefits
Business as usual scenario172,386.2339157,677,615.9
Ecological optimization scenario187,490.4595151,808,605.1
Disclaimer/Publisher’s Note: The statements, opinions and data contained in all publications are solely those of the individual author(s) and contributor(s) and not of MDPI and/or the editor(s). MDPI and/or the editor(s) disclaim responsibility for any injury to people or property resulting from any ideas, methods, instructions or products referred to in the content.

