Abstract
The study area was the Hulunbuir Plateau in northeastern China, based on a natural resource element observation study. The assessment of the spatial and temporal variation of soil erosion is crucial for implementing environmental management in the fragile ecosystem of the Hulunbuir Plateau. The study provides an interesting basis for soil erosion control on the Hulunbuir Plateau and other areas with similar climatic conditions, with the aim of providing sound data to support environmental protection policies in the study area. In this study, the spatial and temporal variations in soil erosion in the region from 2000 to 2020 were quantitatively assessed using the Revised Universal Soil Loss Equation. Furthermore, the patch-generating land use simulation model predicted future soil erosion. Land use prediction data were examined using Kappa coefficients. The prediction of future land use types using CMIP6 data and natural social data in the PLUS model were used to predict soil erosion for different future scenarios. The results showed that the soil erosion rate on the Hulunbuir Plateau showed a significant increasing trend in time from 2000 to 2020. Spatially, soil erosion increases gradually from the west to the east. Soil erosion occurs mainly on grasslands, while cultivated lands show a significant increasing trend by 2020. Slope erosion occurs mainly in areas between 15° and 35°. From 2020 to 2050, soil erosion will increase significantly due to increased precipitation. The soil erosion in SSP2–4.5 is better than the other scenarios.
1. Introduction
Soil erosion is a process by which soil is stripped and destroyed by other external forces [1]. Soil erosion can cause severe environmental damage, leading to the destruction of soil resources, reduction in soil fertility and quality, ecological degradation, and damage to infrastructure [2]. Problems such as the degradation and reduction in arable land due to reduced soil fertility and thinning of soil thickness seriously affect agricultural production. Problems such as mudslides and landslides caused by erosion can be equally damaging; therefore, research into erosion and conserving arable land, grasslands, and slopes have been the focus of academic research [3].
China has some of the most severe soil erosion in the world [4]. The soil erosion control function of grassland ecosystems in China is manifested in preventing wind and hydraulic erosion [4]. More than 2.6 × 10⁶ km2 of land in China is subject to erosion, which is particularly likely to occur in ecologically fragile areas [5]. China has achieved remarkable achievements in soil and water conservation, but the current effectiveness of soil erosion control is still not sound, and the control task is burdensome [6]. Therefore, assessing spatial–temporal variations of soil erosion is of great importance for implementing reasonable soil and water conservation policies. Investigations and soil erosion studies can also ensure the region’s sustainable development and protect its ecological security [7].
Several empirical and physical models have been developed to assess soil erosion. Statistical models have been widely used compared to physical models because of their simplicity and applicability. The main empirical models are the universal soil loss equation (USLE) [8] and the Revised Universal Soil Loss Equation (RUSLE) [9]. Different methods are applicable in different environments and iterative modifications. For example, Liu et al. [10] improved the formula of slope length factor using the RUSLE model. The formula introduced a new soil tillage factor, and biological and engineering measure factors, establishing the China soil loss equation (CSLE). The RUSLE model not only has much more data than the USLE model but also corrects errors in the USLE, fills in gaps in the original data, improves flexibility in its use, and allows simulations of different systems and alternative methods of erosion [10]. The CSLE model is more suitable for the southern region of China than the RUSLE model. The USLE, RUSLE, and CSLE models are still the popular research methods in soil erosion studies, but the patch-generating land use simulation model (PLUS), integrated valuation of ecosystem services and trade-offs (InVEST) [10], and cellular automata (CA) [11] based on a multi-type stochastic seed mechanism are also repeatedly used as research methods. The InVEST model is mainly applied for ecosystem service function assessments [12], the CA model has a high accuracy for patch predictions [13], and the PLUS model is the most convenient for image patch predictions. The PLUS model is an upgrade from the CA model.
Soil erosion in Inner Mongolia, China, accounts for 48.29% of the area, mainly occurring in grasslands and hydraulic erosion over 8 × 10⁴ km2. The area of light erosion and above in China exceeds 3 × 10⁴ km2. The study area is located on both sides of the dividing zones: agro-pastoral, semi-arid and semi-humid, and forest grassland. Therefore, the soil erosion status of the study area has high economic and environmental significance [14]. The study area includes the Hulunbuir area and the western foothills of the Daxing’a Mountains. Erosion in the grassland area of the Hulunbuir Plateau mainly occurs in grassland areas with steep slopes; therefore, grassland protection is key to improving the ecological quality of the region [15]. The study of soil erosion in semi-arid areas is more important due to the increasing precipitation in the study area, which may bring a significant increase in soil erosion. Therefore, it is important to pay attention to the soil erosion status of the study area for both environmental protection and economic development. In this study, the spatial–temporal variations characteristics of soil erosion in the Hulunbuir Plateau grassland region from 2000 to 2020 and predictions for the next 30 years were evaluated using the RUSLE and PLUS models. We focused on the spatial–temporal variations characteristics of different regions to provide a reasonable basis for deploying soil and water conservation measures in accordance with local conditions. One of the analyses for the next 30 years can provide a reasonable basis for future governmental decisions. This study also fills a gap in regional soil erosion research. The flow chart of this study is shown in Figure 1.
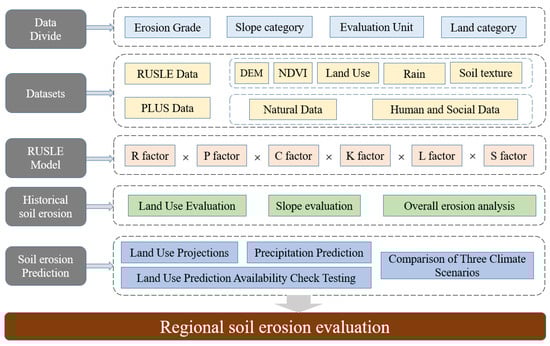
Figure 1.
Research framework of the study.
2. Materials and Methods
2.1. Study Area
The study area is located in the northeastern part of the Inner Mongolia Plateau, containing the northern and western foothills of the Daxing’a Mountains, with latitude and longitude (46°43′48″ N–51°03′00″ N, 115°32′17″ E–121°05′31″ E). The Hulunbuir Plateau is named after the Hulun and Bell Lakes that lie within its territory (Figure 2). The elevation is high in the east and low in the west, flat and open, with the Daxing’a Mountains in the east, the low hills in the west, and the high plains of the Hailar Plateau in the center. The average elevation of the region is in the range 600–800 m. The highest point is located in the Daxing’a Mountain, with an elevation of 1662 m, and the lowest point is near Hulun Lake, with an elevation of 432 m. The average annual temperature is −3 °C to 3 °C, and the precipitation is ~350–500 mm. The study area is rich in surface water resources, mainly Hulun Lake, Bell Lake, Imin River, Hui River, Wursun River, Kulun River, Hailar River, and Erguna River. Most of the rivers on the plateau flow to the northwest, forming the Hailar River, Erguna River system, and Hulun Lake system in the upper reaches of the Heilongjiang River.
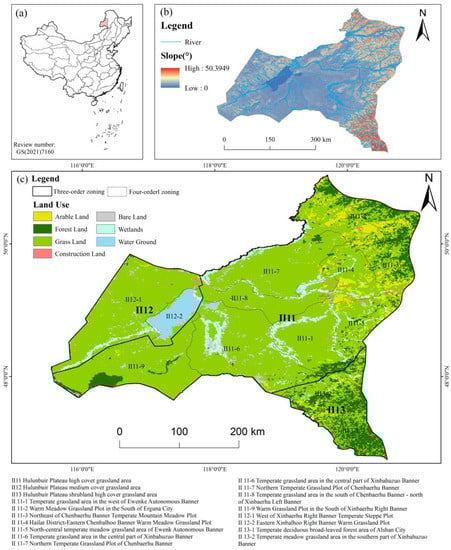
Figure 2.
The study area by (a) location, (b) 2020 land use type, and (c) slope (°).
The vegetation type is meadow grassland, typically dominated by sheep grass and needlegrass, a famous natural grass pasture in China [16]. The plateau is rich in fish, and salt meadow vegetation grows on the beach around the lakeshore. There are three large sand belts and scattered dune accumulations on the plateau.
The boundary delineation of the temperate grassland subzone of the Hulunbuir Plateau is based on the natural resource element observation study of the Geological Survey of China, Ministry of Natural Resources, by Liu et al. [17,18,19,20,21]. The study is based on the project planning and implementation of an integrated observation system for natural resource elements in China [22,23,24,25]. Our study area is a subregion under the Inner Mongolia Plateau Grassland Resource Region, with an area of 91,398 km2, including three zones: Hulunbuir Plateau high-cover grassland region, Hulunbuir Plateau medium-cover grassland region, and Hulunbuir Plateau shrubland high-cover grassland region. These zones are referred to as high-cover grassland region (II11), medium-cover grassland region (II12), and shrubland high-cover grassland region (II13). The 3 regions contained 13 four-level zones, including the central warm grassland plot of Xinbaerhuzuo Banner, the northern part grassland plot of Chenbaerhu Banner, the southern New Baerhuzuo Banner warm grassland plot of Chenbaerhu Banner, and the north-central warm meadow grassland plot of Ewenki Autonomous Banner.
2.2. Data Sources
The main data and sources used in this study are shown in Table 1. Precipitation data were used to calculate the future R factor, soil property data were used to calculate the soil erodibility K factor, and land use data were used to calculate the soil and water conservation measure P factor. Additionally, future land use data were obtained from the future prediction data by the PLUS model, the vegetation cover factor was used to calculate the vegetation cover C factor, and digital elevation model (DEM) data were used to calculate the L and S factors.

Table 1.
Data sources used in this study.
2.3. Soil Erosion Model and Factor Calculation
2.3.1. Soil Erosion Model (RUSLE)
In this study, RUSLE was used to estimate soil erosion in the temperate grassland zone of the Hulunbuir Plateau using the equation:
where A is the soil erosion modulus in (t·km−2·yr−1); R is the precipitation erosion force factor in ((MJ·mm)/(hm2·h·yr)); K is the soil erodibility factor in ((t·hm2·h)/(hm2·MJ·mm)); S is the slope factor; L is the slope length factor; C is the vegetation cover and crop management factor; and P is the soil and water conservation measure factor. Factors L, S, C, and P are dimensionless.
2.3.2. Rainfall Erosion Factor (R Factor)
The rainfall erosion factor, mainly used to analyze the potential capacity of soil erosion induced by rainfall, was the main factor in calculating the modified generic soil loss equation. This study used the “1 km monthly temperature and precipitation dataset for China from 1901 to 2017” published by the National Geoscience Data Center for data sampling and calculations. Zhang et al. [31] proposed a model for calculating the precipitation erosion factor for different periods, and in this study, a month-by-month model with a monthly period was used:
where P is the average annual precipitation (mm); Pi is the average rainfall of the ith month (mm); R is the multi-year average rainfall erosion force ((MJ·mm)/(hm2·h·a)); and α and β are model parameters. The magnitude of the F index (mm) relates to the seasonal distribution of the average annual rainfall P and has values in the range P·12−1~P. The α and β model parameters selected for this study were 0.1833 and 1.9957, respectively, as recommended by Zhang et al. [31], and the final calculation equation was:
2.3.3. Slope Length Factor (S and L Factor)
The slope length factor is mainly used to analyze the influence of topography and landscape on soil erosion. The overall slope undulation in the study area is small, but there is a large slope undulation in the eastern area of the Daxing’a Mountains; thus, the slope length factor was still an important erosion factor. In this study, we used the improved slope length factor of the CSLE model by Liu et al. [32]. The L factor algorithm proposed by Moore and Burch (1986) [33] was used for the slope length factor in an area below 10°, and the slope factor in an area above 10° was calculated using the formula improved for a steep slope by Liu [7]. The specific calculation formulas were:
where L is the slope length factor; λ is the slope length extracted from the DEM of the watershed; m is the slope length index; S is the slope factor; and θ is the slope (°).
2.3.4. Soil Erodibility Factor (K Factor)
Different soil properties have different erosion sensitivity and rates, and K reflects soil type of soil erosion capacity. Many methods are available to estimate K values from soil types. This study used the method of the classic EPIC model in Sharply et al. [7] to calculate the K values:
where Sa, Si, and Cl are the contents of sand, powder, and clay particles in the soil (%), respectively; C is the content of organic carbon in the soil (%); and Sn = 1-(Sa·100−1).
2.3.5. Vegetation Cover and Crop Management Factors (C Factor)
The degree of erosion control is influenced by vegetation cover or field management practices. The magnitude of C is influenced by vegetation growth, type, and cover. Normalized difference vegetation index (NDVI) is closely related to surface vegetation cover and can comprehensively reflect the cover pattern as well as the type and growth of vegetation within an image element [34]. The C factor reflects the influence of vegetation on soil erosion depending on the status of ground cover. The C value was calculated by the following formula:
where C is the vegetation cover and crop management factor, and f is the vegetation cover. The C factor can be easily calculated by extracting the vegetation cover from multispectral images. The vegetation cover was calculated by the formula:
where NDVI is the NDVI value of the study area; NDVIsoil is the NDVI value of the bare soil or uncovered area; and NDVIveg is the NDVI value of the image completely covered by vegetation in the study area.
2.3.6. Soil and Water Conservation Measures Factor (P Factor)
Soil and water conservation measures are an effective way to prevent soil erosion and usually require fieldwork to determine the P factor values for different land use types, which are generally between 0 and 1 [35]. In this study, values were assigned to different land use types based on previous research [36,37,38,39,40,41] and were 0.85 for forest land, 0 for a watershed, 0.08 for wetland, 0.5 for cropland, 0.9 for grassland, and 1 for bare.
2.4. Future Projection
The L, S, and K factors required in the future prediction model were negligible because of the small interannual variability. The future projection model used the same data set as the 2000–2020 soil erosion modulus calculations. The analysis was performed by calculating the future predicted soil erosion modulus according to Equation (1).
2.4.1. Land Patch Prediction Model (PLUS)
In this study, the PLUS model developed by Liang et al. [28] was used as a predictive model for future land use. The PLUS model is a future land use change simulation that integrates a land expansion strategy analysis and meta-cellular automation models based on multi-class stochastic patch seeds. The land expansion analysis strategy module combines the advantages of the existing Transformation analysis strategy and Pattern analysis strategy avoiding the analysis of transformation types that grow exponentially with the number of categories. The module retains the ability to analyze land use change mechanisms over a certain time period with better interpretation. The CA model, combined with stochastic seed generation and a threshold-decreasing mechanism, and the PLUS model can simulate the automatic generation of patches in a spatiotemporal dynamic with the constraint of development probability. Markov chains are widely used in research to simulate land use and cover change [42]. In this study, the CA and PLUS models were used to predict future land use, relying on two different temporal land use type maps for the same time interval to predict the future land use map, which is a simulation matrix of land use change over time. The Markov chain model used in this study was performed in the built-in function of the PLUS model software.
PLUS model results are tested by Kappa coefficients. Kappa is calculated from −1 to 1, but usually, Kappa falls between 0 and 1. Kappa coefficients can be divided into five groups to indicate different levels of consistency: 0.0~0.20, very low consistency (slight); 0.21~0.40, average consistency (fair); 0.41~0.60 moderate consistency (moderate); 0.61~0.80, high consistency (substantial); and 0.81~1, almost perfect agreement (almost perfect). In this study, the accuracy of the PLUS model will be validated with Kappa coefficients.
2.4.2. P Factor
Land use change is an important factor influencing soil erosion [43]. The P factor is mainly used to predict land use data for the next 30 years through the PLUS model, using a land patch prediction model and a Markov chain model. The main data used included restricted conversion area, socioeconomic, and climatic and environmental data. Restricted conversion area data excluded water part data as restricted conversion data; socioeconomic data included population, Gross Domestic Product (GDP), and distance to main roads, primary, secondary, and tertiary roads, railroads, highways, high-speed railway stations, and governments; climate and environment data included soil type, average annual temperature, average annual precipitation, elevation, and slope and distance to waters. Future land use data was calculated using the same assignments from 2000–2020 for the P factor.
2.4.3. R Factor
The R factors for future prediction scenarios were obtained using the coupled model intercomparison program in phase 6 (CMIP6) [44] based on different future scenario data. Data extraction interpolation was performed to obtain a reduced data scale for predicted precipitation data. The R factor was then calculated using the preprocessed data with Equation (4). SSP2–4.5 was the main prediction scenario, and SSP1–2.6 and SSP5–8.5 were used as control groups.
2.4.4. C Factor
Various prediction and substitution schemes exist for the C factor of future projection scenarios [45,46,47]. The C factor calculated in this paper referred to the study by Hateffard [48], and the value was small due to interannual variation. The average C factor from 2000 to 2020 was used in the future projection model.
2.5. Data Classification and Factor Analysis
2.5.1. Significance of Data Per Issue
The data for all studies were averaged over a five-year period, i.e., taking the average of the two years before and after the current year’s data. For example, for the 2005 data, the average from 2003 to 2007 (i.e., five years) was calculated. The five historical data periods were 2000, 2005, 2010, 2015, and 2020, and the six future data periods were 2025, 2030, 2035, 2040, 2045, and 2050.
2.5.2. Classification of Soil Erosion Grades
The classification of erosion grade in this study refers to the Soil Erosion Classification and Grading Standard (SL190-2007), which classifies soil erosion intensity into six grades: slight, mild, moderate, strong, extremely strong, and intense. In this study, the soil erosion modulus was graded according to this standard grade.
2.5.3. Classification of Land Use Type
In this study, the land use types in the temperate grassland subregion of the Hulunbuir Plateau were classified into seven primary classifications based on the multi-period land use remote sensing monitoring data of China by Xu et al. [29], including arable land, forest land, grassland, water ground, wetlands, construction land, and bare land. Each primary classification contains several secondary classifications. Arable land included paddy and dry lands. Forest land included wooded land, shrubland, open forests, and other forest land. Grassland included high-cover grassland, medium-cover grassland, and land-cover grassland. Water ground included rivers and canals, lakes, reservoir ponds, and permanent glacial snow. Wetlands included mudflats and swamps. Construction land included urban land, rural residential land, and other construction lands. Bare land included sandy land, the Gobi Desert, saline land, bare land, bare rocky land, and other lands such as tundra and high cold desert.
Because soil erosion does not occur in water ground, it was not considered in this study. The largest area shared was grassland, comprising more than 75% after removing water ground, followed by woodland, with a shared area of more than 11%, and arable land and wetland, both with a shared area of ~5%. This study focused on woodlands, grasslands, and croplands that were large and with major erosion.
2.5.4. Classification of Slope Grades
The slope grading method used in this study was based on the Standards table for Soil Erosion Intensity Grading (SL190-96), and interval breakpoints were set at 5°, 8°, 15°, 25°, 35°, and 50° for slope grading. An area proportion of 0–8° comprised more than 85% of the study area, and the overall topography was relatively smooth. An area proportion of 8–35° was mainly located at the western foot of the Daxing’a Mountains and the western side of Hulun Lake, consisting of ~14%. An area proportion of 35° and above were ignored in this study because it was too small and the study area not large enough.
2.5.5. Comparison of Soil Erosion Projections under Three Scenarios
SSP1–2.6 is the updated RCP2.6 scenario from CMIP5 in CMIP6, representing the combined effects of low social vulnerability, low mitigation stress, and low radiative forcing; SSP2–4.5 is the updated RCP4.5 scenario from CMIP5 in CMIP6, representing the combination of moderate social vulnerability and moderate radiative forcing; and SSP5- 8.5 is the updated CMIP5 RCP8.5 scenario in CMIP6 and the only shared socioeconomic pathway that can achieve an anthropogenic radiative forcing of 8.5 W/m2 by 2100. Scenarios ssp1–2.6, ssp2–4.5, and ssp5–8.5 are hereafter referred to as SSP126, SSP245, and SSP585 [49]. In this study, two time points, 2035 and 2050, were selected to compare the three scenarios with the aim of finding the soil erosion conditions in the study area under extreme conditions.
3. Results
3.1. Historical Changes in Soil Erosion
3.1.1. Dynamic Changes in Regional Soil Erosion Distribution Pattern
The average annual erosion modalities of the five historical periods in the study area were 160, 143, 168, 157, and 228 t·km−2·yr−1, respectively, indicating slight erosion. Table 2 shows that the study area experienced mainly slight erosion, but the area for moderate and above erosion was more than 500 km2. The most severe erosion was in 2020, with moderate and above erosion over 3100 km2.
Table 2.
Percentage of annual average soil erosion grade in the historical period.
Soil erosion occurred mainly in the high plains of the central Hailar Plateau, the north side of Hulun Lake, and the Daxing’a Mountains area. Figure 3 demonstrates that the strongest erosion area was the western foothills of the Daxing’a Mountains, where there are high slope undulations and precipitation, about 100 mm higher than the average value, with grassland vegetation that easily erode. Soil erosion in the central region was reduced in 2005 compared to 2000, mainly due to the low precipitation of ~250 mm that year. The significant increase in soil erosion in 2020 compared to 2015 could be due to the large increase in the annual precipitation, which was about 12% higher than the previous cycle. The highest soil erosion values were concentrated in the eastern mountainous areas due to the large topographic relief and relatively high precipitation in the region. In contrast, the area with the lowest erosion was located on the south side of Hulun Lake, where the topography is smooth and has low precipitation and human activities. Figure 4 shows the 2020 and future with precipitation data.
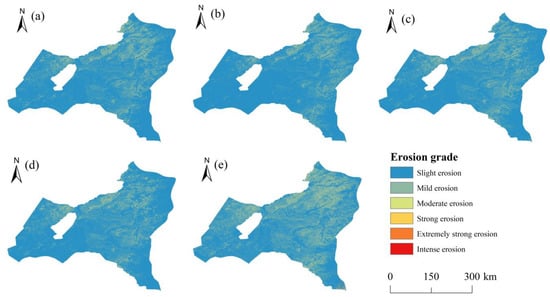
Figure 3.
Spatial variation of soil erosion grade in the historical period (a) 2000, (b) 2005, (c) 2010, (d) 2015, and (e) 2020.
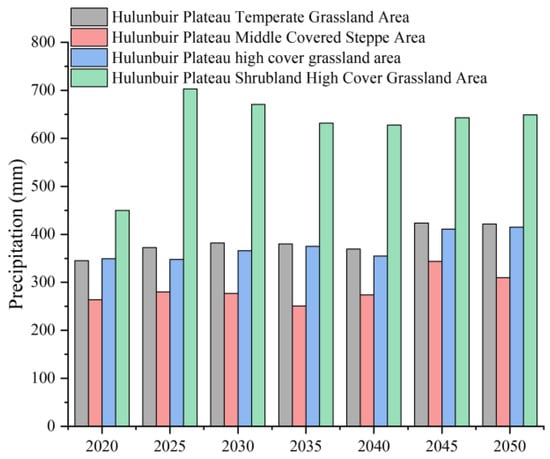
Figure 4.
Temporal variation of annual precipitation (mm) in 2020 and from 2025 to 2050 based on SSP245.
There was a large difference in soil erosion between the three different zones (Figure 5). The average annual soil erosion modulus in the three zones, in descending order, was shrubland high-cover grassland zone (II13), high-cover grassland zone (II11), and medium-cover grassland zone (II12), with values of 346, 204, and 126 t·km−2·yr−1, respectively. In terms of historical erosion modulus, the high-cover grassland zone (II11) was 171, 149, 172, 162, and 280 t·km−2·yr−1; the medium-cover grassland zone (II12) was 126, 87, 124, 131, and 169 t·km−2·yr−1; and the shrubland high-cover grassland zone (II13) was 90, 153, 161, 119, and 425 t·km−2·yr−1, respectively.
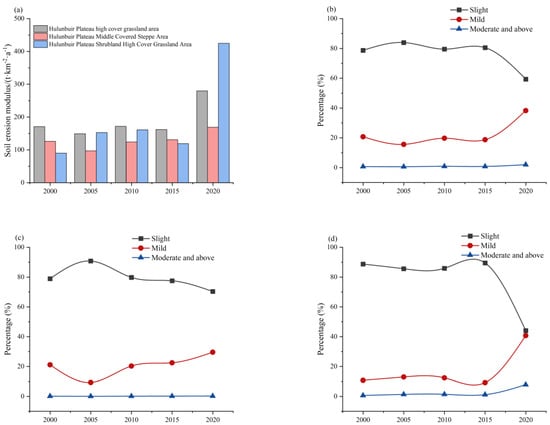
Figure 5.
Temporal variation of (a) soil erosion modulus (t·km−2·yr−1) and percentage (%) of soil erosion grades in the three zones (b) II11, (c) II12, and (d) II13 from 2000 to 2020.
Erosion differences within the tertiary zone were determined by a combination of precipitation, land use type, vegetation cover, and slope. For example, the most erosive area was the shrubland high-cover grassland area (II13), mostly located in the Daxing’a Mountains with an undulating slope and in the monsoon zone, where there is substantial soil erosion due to years of high precipitation. The erosion mainly occurred in the intermountain valley region and the western region of the Daxing’a Mountain. The intermountain valley area has a large undulating slope and a small vegetation cover, and erosion basically did not occur in the high forest cover area. In the western region, the slope is undulating, and the vegetation is mainly shrubs and grasses; thus, the erosion was stronger. The area with the weakest erosion was the middle-covered grassland area (II12), which is located on the west side of Hulun Lake, with flat and open terrain, mainly grassland, and sparse precipitation; thus, the degree of erosion was low. The erosion mainly occurred on the north side of Hulun Lake; the topography of the area is undulating, the vegetation is sparse, and the erosion was high. The southern area has some forest cover, and the terrain is smooth with low erosion. Erosion in the high-covered grassland area (II11) mainly occurred in the eastern part, where there are many rivers, and the terrain has a large undulation. The western part is adjacent to Hulun Lake, and the regional terrain is smoother with less erosion.
Table 3 shows that the average erosion modulus was highest in the southern temperate meadow steppe plot (II11-2) of Erguna City in the small area of class IV. This plot is located in the northeastern part of the study area, mostly in the shadows of the Daxing’a Mountains, with undulating slopes. Still, there is more arable land and sparse woodland, so precipitation increased erosion, although it was lower than in the densely forested southeast area. Erosion was lowest in the southern temperate steppe plot (II11-9) of Xinbaerhu Right Banner, located in the western part of the study area, where the terrain is smooth, and the vegetation is dominated by grassland. Regional vegetation is sparse, and precipitation is low; thus, erosion was minor. The area with the strongest erosion was 3.7 times greater than the area with the weakest erosion, and the spatial differentiation gap was greater than the tertiary zoning results (1.5 times). This indicates that a noticeable scaling effect occurred in the spatial differentiation assessment of soil erosion and that differentiation was significantly affected by the zone.
Table 3.
Annual average soil erosion modulus for the four-level zones during the historical period.
3.1.2. Soil Erosion of Different Land Use Types
Table 4 shows that the grassland soil erosion type is dominated by slight erosion, followed by mild erosion. The year with a more moderate degree of soil erosion was 2005, and the more severe degree of erosion was 2020. There was also a clear trend of an overall increase in grassland erosion with increasing precipitation, although soil erosion occurred slightly. The slight erosion in 2020 decreased by 22.05%, mild erosion increased by 20.86%, and moderate and above erosion increased by 1.19% compared to moderate erosion in 2005, indicating an overall trend of deterioration.
Table 4.
Percentage of three types of land use erosion grades.
The woodlands are mainly located in the eastern mountainous and southwestern shrubland areas (II11-9), where the overall erosion was small, and the slopes of the mountainous and shrubland areas are undulating. Although most areas were classified as erosion-free in the C factor calculations, the overall erosion was still severe in this study area. The most severe soil erosion in 2020 for woodland land use types decreased by 12.05%, mild erosion increased by 9.76%, and moderate and above erosion increased by 2.29% compared to the most moderate 2015 erosion modulus. The overall erosion condition was good between 2000 and 2015, although slight fluctuations occurred. The deteriorating trend in 2020 might be due to changes in vegetation cover and precipitation.
The arable land is mainly located in the eastern part of the study area, scattered more sporadically, and in the agro-pastoral zone. From 2000 to 2015, the soil erosion of the arable land has been gradually improving, but in 2020 the precipitation in the area increased, aggravating the erosion of the arable land significantly. The most severe soil erosion in 2020 compared to 2015 showed a 31.67% decrease in slight erosion, a 31.21% increase in mild erosion, and a 0.46% increase in moderate and above erosion. The results indicated an overall yearly improvement in soil erosion with the recent trend of deterioration. The study area is located in an ecologically fragile area. Cultivated land erosion greatly impacts economic development. Since cultivated land erosion in the study area has increased dramatically in recent years, soil and water conservation of cultivated land require urgent attention.
Among the different land use types, the strongest erosion occurred in construction land (Table 5); wetlands basically do not erode as well as bare land, although they are devoid of surface vegetation. Because the bare land in the study area is primarily located in the flat topography of the river valley and the western medium-density grassland areas, the precipitation was lower, and the slope less undulating, resulting in the soil erosion of bare land being smaller than that of grassland.
Table 5.
Average annual erosion modulus for different land uses.
The historical period land use was analyzed at ten-year intervals, and the data for the two periods were 00–10 years and 10–20 years land use changes. The land use changes in the study area are shown in Figure 6. The land use type changes mainly occurred during the period 00–10. The land use type changes during the period 10–20 were smaller.
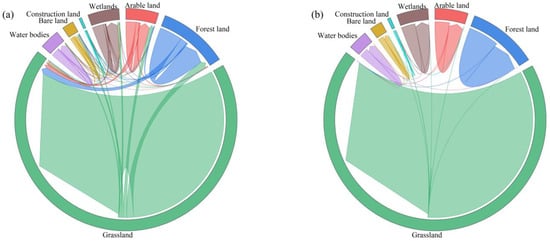
Figure 6.
Land use changes in historical periods: (a) Land use change from 2000 to 2010; (b) Land use change from 2010 to 2020.
3.1.3. Soil Erosion at Different Slopes
Slope relief also had an effect on soil erosion in the study area. The largest proportion of slope in the study area was 0–5°, which was mainly distributed in the high plains of the Hailar Plateau, the shoreline of Hulun Lake, and the mountainous ravine areas in the central and western regions (Figure 2). The main vegetation in the region is grassland, with slight and light erosion, and a small number of areas with moderate or higher erosion, indicating that soil erosion was not a serious problem in study areas with a gentle slope (Figure 7). The 5–8° area was similar to the 0–5° area, but the proportion of light erosion increased significantly. The percentage of light erosion exceeded that of slight erosion in 2020, the strongest erosion, which could be attributed to the significant increase in precipitation in 2020. Moderate and above erosion in the study area occurred primarily in two zones, 8–15° and 15–35°. The 8–15° zone was dominated by slight erosion. The proportion of light and moderate erosion was close to each other because the regional vegetation type is erosion-prone, and the slope is high with a large S factor. The 25–35° zone erosion condition was similar to the 15–25° zone, both located in the eastern mountainous area, and the vegetation type is mainly forest. The percentage of strong erosion and above in the 15–35° area exceeded 10% for the first time in 2005; since the S factor increased and the area of grassland decreased, the amount of bare land, mainly barren slopes, increased, and the percentage of moderate erosion and above in this area increased considerably.
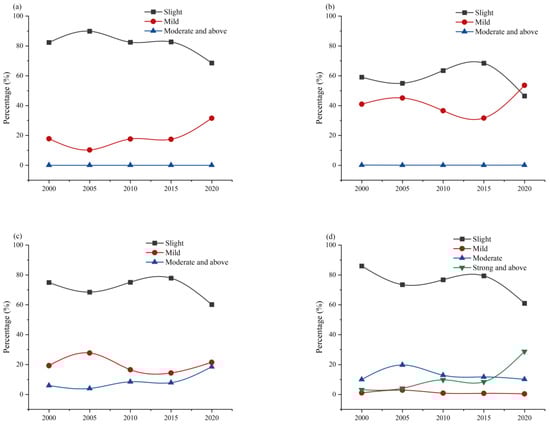
Figure 7.
Temporal variations of percentage (%) of soil erosion grades at different slopes at (a) 0–5°, (b) 5–8°, (c) 8–15°, and (d) 15–35° from 2000 to 2020.
3.2. Soil Erosion Forecast
3.2.1. Soil Erosion from 2025–2050 under the SSP245 Scenario
Figure 8 shows that future soil erosion will be concentrated mainly in the eastern mountains and the central high-density plateau grassland area. The moderate and above erosion will primarily occur in the western foothills of the Daxing’a Mountains. Furthermore, the western medium-density grassland area erosion will be relatively low, and the most vulnerable area for erosion will be the eastern area of Hulun Lake. A significant increase in erosion area will be in the central part in 2045 and 2050.
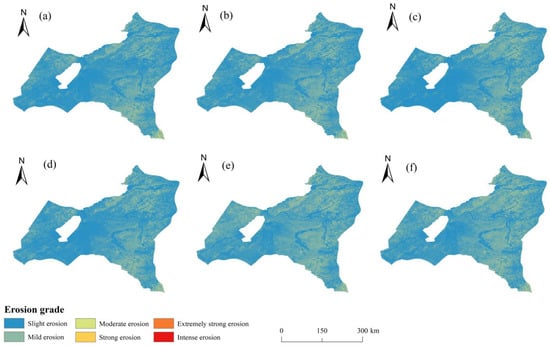
Figure 8.
Predicted spatial variation of the soil erosion grade in (a) 2025, (b) 2030, (c) 2035, (d) 2040, (e) 2045, and (f) 2050.
Figure 9 indicates that the average annual erosion modules from 2025 to 2050 are 261, 268, 273, 253, 312, and 313 t·km−2·yr−1, respectively, suggesting mild erosion. Compared with the 2000–2020 period, the future prediction of soil erosion will be significantly more severe; only the average soil erosion modules from 2020 showed light erosion, with the rest showing slight erosion. Soil erosion, slight erosion, and mild erosion fluctuate less in 2025–2040, slight erosion is about 10% higher, and mild erosion is about 10% lower compared to soil erosion in 2045–2050. The area of slight erosion in 2025–2040 is about twice as large as the area of mild erosion, and the area of mild erosion in 2045–2050 is substantially larger, with the area of slight erosion being only about 30% higher than the area of mild erosion. The future soil erosion enhancement will be mainly caused by increased precipitation, with the regional historical 20-year average precipitation of ~330 mm and the regional future 30-year average precipitation of ~450 mm. The study area is ecologically fragile; thus, ecological protection policies and projects need to be considered for future changes to improve the quality of environmental protection projects and strengthen the supervision of environmental protection in this area.
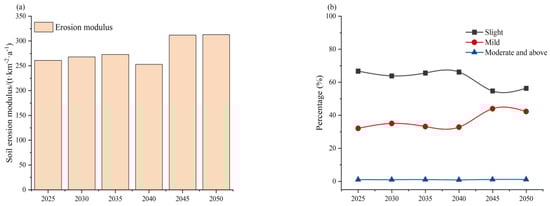
Figure 9.
(a) Erosion modulus (t·km−2·yr−1) and (b) percentage (%) of soil erosion classes from 2025–2050.
For the three zones, the annual average soil erosion modulus was, in descending order, shrubland high-cover grassland zone (II13), high-cover grassland zone (II11), and medium-cover grassland zone (II12), with values of 646, 245, and 194 t·km−2·yr−1, respectively. Figure 10 illustrates that the soil erosion modules in the high-cover grassland zone (II11) for the next six periods (2025–2050) will be 210, 228, 249, 219, 279, and 287 t·km−2·yr−1, respectively. The six erosion modules in the medium-cover grassland zone (II12) will be 184, 178, 153, 176, 257, and 215 t·km−2·yr−1, respectively. The six erosion modules in the shrubland high-covered grassland area (II13) will be 737, 680, 602, 605, 621, and 631 t·km−2·yr−1, respectively. The erosion conditions between 2025 and 2050 are predicted to be similar to that between 2000–2020, where the shrubland high-cover grassland zone (II13) had a large increase in erosion, and the future average annual erosion will be 1.87 times the historical average annual erosion. The high-cover grassland zone (II11) and medium-cover grassland zone (II12) are predicted to be 1.2 and 1.56 times the historical average annual erosion, respectively. The two zones with the largest difference in erosion modulus among the three zones are 3.3 times, and the regional erosion differentiation increased significantly. The main reason for this phenomenon is likely the increase in precipitation differences. The average precipitation in the regional historical 20-year high-cover grassland area (II11) was ~300 mm, ~220 mm in the medium-cover grassland area (II12), and ~400 mm in the shrubland high-cover grassland area (II13). The precipitation for the next 30 years is predicted to be ~380 mm in the high-cover grassland area (II11), ~310 mm in the medium-cover grassland area (II12), and ~650 mm for shrubland in the high-cover grassland area (II13).
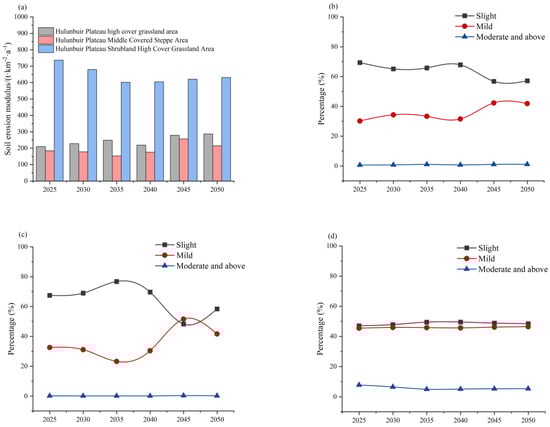
Figure 10.
(a) Erosion modulus (t·km−2·yr−1) for 2025–2050 in the four-level zones. Percentage (%) of soil erosion grade for (b) II11, (c) II12, and (d) II13 from 2025 to 2050.
Table 6 predicts the strongest erosion of the four levels for small areas of a temperate deciduous broadleaf forest plot (II13-1) in Alshan City. This area is located in the southeastern part of the study area, at the western foot of the Daxing’a Mountains, with a large undulating slope. Although densely forested, there is a large increase in precipitation compared to historical records; thus, erosion will increase. The lowest erosion is predicted to be in the southern temperate grassland plot of Xinbaerhu Right Banner (II11-9), which is located in the western part of the study area, where the terrain is smooth, and the vegetation is mainly grassland. Since the vegetation here is relatively sparse, and the precipitation is low, the erosion will be small. The area with the strongest erosion will be 5.6 times greater than the area with the lowest erosion.
Table 6.
Future annual average soil erosion modulus for four-order zones.
Future land use changes were simulated with the PLUS model. Data testing was performed to predict 2020 land use data using 2000 land use data and 2010 land use data, and the predicted 2020 land use data were tested against the actual 2020 land use data. The final test Kappa coefficient is 0.79, which is substantially consistent. The next step of prediction can be carried out. Future land use changes were analyzed at 15-year intervals, and the two periods of data were 20–35 years and 35–50 years of land use changes, respectively. The future land use changes in the study area are shown in Figure 11. The land use type changes mainly occurred in the 35–50-year period. The land use type changes in the 20–35-year period were smaller.
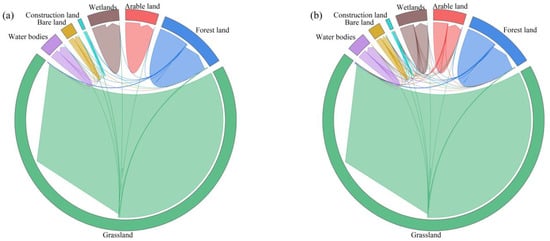
Figure 11.
Predicted land use change: (a) Land use change from 2020 to 2035; (b) Land use change from 2035 to 2050.
3.2.2. Comparison of Soil Erosion Projections for 2035 and 2050 under Three Scenarios
As shown in Figure 12, the overall soil erosion based on the SSP245 scenario will be much larger compared to scenarios SSP126 and SSP585 in terms of the area of slight erosion. The percentage of slight erosion will be higher than mild erosion in the central high-cover grassland area.
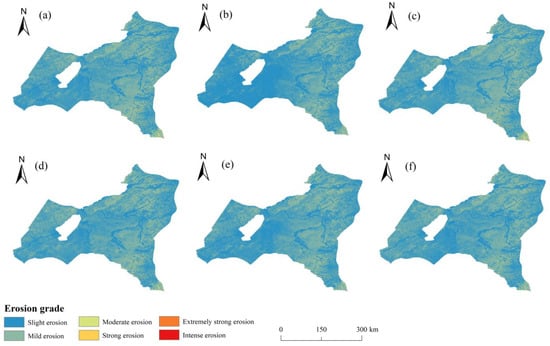
Figure 12.
Soil erosion under scenarios (a) SSP126, (b) SSP245, and (c) SSP585 in 2035. Soil erosion under scenarios (d) SSP126, (e) SSP245, and (f) SSP585 in 2050.
Figure 13 shows the erosion module of SSP126a35, SSP126a50, SSP245a35, SSP245a50, SSP585a35, and SSP585a50 in the study area was 355, 329, 273, 373, 382, and 328 t·km−2·yr−1, respectively, indicating mild erosion. SSP126a35, SSP126a50, SSP245a35, SSP245a50, SSP585a35, and SSP585a50 represent soil erosion in the 35- and 50-year SSP126 scenarios. The six erosion modulus of high-cover grassland area (II11) were 304, 289, 249, 287, 337, and 298 t·km−2·yr−1, respectively, all mild erosion. The erosion modulus of the medium-cover grassland zone (II12) were 235, 248, 153, 215, 220, and 247 t·km−2·yr−1, respectively, all mild erosion. The erosion modules of shrubland high-cover grassland area (II13) were 879, 724, 602, 631, 922, and 641 t·km−2·yr−1, respectively, all mild erosion. The percentage of mild erosion in both 2035 and 2050 in scenario SSP245 will be smaller than that under scenarios SSP126 and SSP585 because the precipitation in scenario SSP245 will be smaller than in scenarios SSP126 and SSP585.
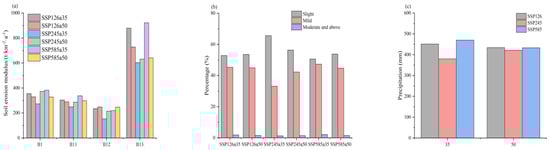
Figure 13.
(a) Erosion modulus (t·km−2·yr−1) for the three scenarios in different regions. (b) Percentage (%) of erosion by scenario. (c) Precipitation (mm) for the three scenarios.
4. Discussion
4.1. Major Findings and Results Comparison
The Hulunbuir Plateau contains several natural interlacing zones and is an important environmental protection area in China. In this study, soil erosion in Hulunbuir was evaluated from 2000 to 2020, and the erosion (2000–2020) modalities were 160, 143, 168, 157, and 228 t·km−2·yr−1, respectively, indicating slight erosion. The overall erosion showed a fluctuating trend and increased significantly in 2020. This is likely due to a large increase in precipitation in northern China (Figure 3) as a consequence of global warming [50,51]. At the same time, precipitation increased considerably in the eastern and southern parts of the study area due to the influence of the monsoon and the topographic barrier of the Daxing’a Mountains [52,53], in which the R-factor was the primary driver in the RUSLE model. In addition, the P and K factors directly influenced the regional soil erosion degree [54].
The primary land types in Hulunbuir Plateau were grassland, cropland, and forest land. All land types showed an increase in erosion in 2020, but only cropland had a higher percentage of mild erosion than slight erosion. Reclamation in the study area resulted in a decrease in the grassland area [55]. Wang et al. showed that soil erosion in the black soil region of northeastern China deteriorated, but then it improved, and then it deteriorated from 2000 to 2015 [56]. Jiang et al. and Wang et al. showed that the wind erosion area decreased significantly from 1978 to 2018, the water erosion area remained stable, and the total soil erosion showed a decreasing trend. From 2000 to 2020, the soil erosion in the southeastern mountains of the Hulunbuir region showed an increasing trend from 2000 to 2020, which is consistent with the findings of this study [57,58]. The study by Zhu et al. shows that soil erosion is mainly concentrated in areas with high slope, and the soil erosion in the Northeast China Plain is about twice as much as that in the Hulunbuir region, which is consistent with the existing knowledge [59]. Wang et al. showed that soil erosion is serious in the black soil area of northeast China, and slope erosion and gully erosion are the main types of erosion [60].
4.2. Regional Future Soil Erosion and Recommendations
In this study, the most likely SSP245 scenario was selected as the predicted data for soil erosion projections from the period 2025–2050 [61]. The results indicate that a significant increase in future precipitation will significantly increase soil erosion modulus. The predicted erosion modalities (2025–2050) were 261, 268, 273, 253, 312, and 313 t·km−2·yr−1, respectively, suggesting mild erosion. To address the problem of increased erosion due to increased precipitation in this study, we considered the land use type. First, we considered planting grassland suitable for high humidity [62]. Due to the increased precipitation, there is also a possibility that forests will become the main vegetation in Hulunbuir. To expand the river valley wetland area and the Daxing’a Mountains within two weeks, we should start quantitative and orderly afforestation to reduce soil erosion. Urban land should be well-planned, and a sound groundwater system should be constructed. Problems relating to arable land erosion that is more responsive to precipitation, crop production with better soil-fixing ability, and changing cultivation patterns should be considered [63].
4.3. Limitations of This Study
This study only explored the region from the perspective of precipitation erosion, and a certain amount of wind erosion still existed in the region. The prediction model of the C-factor is more straightforward and less accurate. The use of the RUSLE and PLUS models does not allow us to conduct a detailed evaluation of the historical and future ecological quality of the region, and we can only evaluate the region in terms of soil degradation. There are no multiple scenarios for future precipitation prediction, and considering future climate conditions is not comprehensive enough. These problems should be avoided as much as possible when conducting future environmental evaluations such as soil erosion analysis. Although the study has some limitations, few such studies have been conducted near or in the study area. The study provides a scientific basis for regional environmental protection by performing a reasonable analysis of historical soil erosion and scientific prediction of future soil erosion.
The soil erosion modules in the study area generally agree with historical study data of the region [64,65], and the formulae selected were subjective. There are differences in the quantitative results, but they do not affect the interpretation of the final results.
5. Conclusions
This study quantitatively describes the soil erosion condition in the temperate grassland area of the Hulunbuir Plateau based on the RUSLE model and available data. It predicts future soil erosion in the study area using CMIP6 data and the PLUS model, leading to the following conclusions:
- (1)
- The average annual soil erosion modules from 2000 to 2020 was 171 t·km−2·yr−1, with the maximum and minimum erosion in the years 2020 and 2005, respectively, with an increase of 42.5%. The maximum erosion modulus was in the eastern part of the study area, followed by the central part. The smallest erosion modulus was in the western region, which coincides with the changes in the tertiary zones. The erosion intensity of the most-eroded area in the tertiary zone was 1.5 times that of the least-eroded area, and the erosion intensity of the most-eroded area in the quaternary zone was about 3.72 times that of the least-eroded area.
- (2)
- Soil erosion in the region occurred mainly in grasslands, with mild and above erosion accounting for a large proportion of cropland erosion and weaker erosion in forest lands. All three main land use types showed aggravating erosion, with the largest change in and proportion of erosion in cropland (moderate and above erosion), indicating that soil erosion here needs special attention. No moderate and above erosion occurred in the regional 0–8° area. Moderate and above soil erosion mainly occurred in the 8–25° area, and strong and above erosion in the 15–35° area accounted for more than moderate erosion in 2020.
- (3)
- The average annual soil erosion modules from 2025 to 2050 was 280 t·km−2·yr−1, which is 64% higher than the historical annual average. The average annual erosion intensities in shrubland high-cover grassland (II13), high-cover grassland (II11), and medium-cover grassland (II12) were 1.87, 1.56, and 1.2 times the historical annual average, respectively. The future spatial erosion change was similar to the historical change, and the erosion intensity of the most-eroded area in the three zones was 3.3 times that of the least-eroded area. Furthermore, the erosion intensity of the most-eroded area in the four zones was ~5.6 times that of the least-eroded area, and the regional erosion gap was expanded compared with the historical period. Soil erosion increased substantially in all three future scenarios, with relatively moderate soil erosion in the SSP245 scenario.
Author Contributions
Conceptualization: J.Y.; methodology: J.Y. and H.L.; formal analysis: R.W. and X.L. (Xinping Luo); writing—original draft preparation: J.Y.; writing—review and editing: L.X.; funding acquisition: X.L. (Xiaohuang Liu); resources: C.W. and H.Z. All authors have read and agreed to the published version of the manuscript.
Funding
This research was funded by the Natural Resources Integrated Survey Command Center of China Geological Survey, Project No. DD20230514.
Institutional Review Board Statement
Not applicable.
Informed Consent Statement
Not applicable.
Data Availability Statement
Not applicable.
Acknowledgments
The authors thank everyone who helped.
Conflicts of Interest
The authors declare that they have no conflict of interest.
References
- Lal, R. Soil erosion and the global carbon budget. Environ. Int. 2003, 29, 437–450. [Google Scholar] [CrossRef]
- Rickson, R.J. Can control of soil erosion mitigate water pollution by sediments? Sci. Total Environ. 2014, 468, 1187–1197. [Google Scholar] [CrossRef]
- Efthimiou, N.; Lykoudi, E.; Psomiadis, E. Inherent relationship of the USLE, RUSLE topographic factor algorithms and its impact on soil erosion modelling. Hydrol. Sci. J. 2020, 65, 1879–1893. [Google Scholar] [CrossRef]
- Ouyang, Z.; Wang, X.; Miao, H. A preliminary study of terrestrial ecosystem service functions and their ecological and economic values in China. J. Ecol. 1999, 199, 607–613. [Google Scholar]
- Zhao, T.; Ouyang, Z.; Jia, L.; Zheng, H. Ecosystem services and their valuation of China grassland. Acta Ecol. Sin. 2004, 24, 1101–1110. [Google Scholar]
- Zhao, J.; Yang, Z.; Govers, G.J.G. Soil and water conservation measures reduce soil and water losses in China but not down to background levels: Evidence from erosion plot data. Geoderma 2019, 337, 729–741. [Google Scholar] [CrossRef]
- Chen, C.; Zhao, G.; Mu, X.; Tian, P.; Liu, L. Spatial-Temporal Change of Soil Erosion in Huangshui Watershed Based on RUSLE Model. J. Soil Water Conserv. 2021, 35, 73–79. [Google Scholar]
- Kinnell, P. Event soil loss, runoff and the Universal Soil Loss Equation family of models: A review. J. Hydrol. 2010, 385, 384–397. [Google Scholar] [CrossRef]
- Sun, W.; Shao, Q.; Liu, J.; Zhai, J. Assessing the effects of land use and topography on soil erosion on the Loess Plateau in China. Catena 2014, 121, 151–163. [Google Scholar] [CrossRef]
- Zhang, H.; Zhang, R.; Qi, F.; Liu, X.; Niu, Y.; Fan, Z.; Zhang, Q.; Li, J.; Yuan, L.; Song, Y.J.C. The CSLE model based soil erosion prediction: Comparisons of sampling density and extrapolation method at the county level. Catena 2018, 165, 465–472. [Google Scholar] [CrossRef]
- Grimm, V.; Revilla, E.; Berger, U.; Jeltsch, F.; Mooij, W.M.; Railsback, S.F.; Thulke, H.-H.; Weiner, J.; Wiegand, T.; DeAngelis, D.L. Pattern-oriented modeling of agent-based complex systems: Lessons from ecology. Science 2005, 310, 987–991. [Google Scholar] [CrossRef] [PubMed]
- Wang, C.; Li, T.; Guo, X.; Xia, L.; Lu, C.; Wang, C.J.L. Plus-InVEST Study of the Chengdu-Chongqing urban agglomeration’s land-use change and carbon storage. Land 2022, 11, 1617. [Google Scholar] [CrossRef]
- Liang, X.; Guan, Q.; Clarke, K.C.; Liu, S.; Wang, B.; Yao, Y. Understanding the drivers of sustainable land expansion using a patch-generating land use simulation (PLUS) model: A case study in Wuhan, China. Comput. Environ. Urban Syst. 2021, 85, 101569. [Google Scholar] [CrossRef]
- Wan, H.; Gao, S.; Liu, Y.J.R.S. Grassland degradation monitoring and spatio-temporal variation analysis of the Hulun Buir Ecological Function Region. Resour. Sci. 2016, 38, 1443–1451. [Google Scholar]
- Guo, L.; Lai, Q.; Yi, B. Spatiotemporal changes of net primary productivity of river wetland and its driving factors in hulun buir sandy land in 2000–2014. Res. Soil Water Conserv. 2017, 24, 267–272. [Google Scholar]
- Chen, Z.; Liu, J.; Li, L.; Wu, Y.; Feng, G.; Qian, Z.; Sun, G.-Q. Effects of climate change on vegetation patterns in Hulun Buir Grassland. Phys. A Stat. Mech. Appl. 2022, 597, 127275. [Google Scholar] [CrossRef]
- Sun, X.; Liu, X.; Gao, J.; Zhu, Z.; Zheng, W. Classification system of natural resources for integrated management. Resour. Sci. 2020, 42, 1860–1869. [Google Scholar] [CrossRef]
- Liu, X.H.; Liu, X.J.; Cheng, S.B. Construction of a national natural resources comprehensive observation system and key technologies. Resour. Sci. 2020, 42, 1849–1859. [Google Scholar] [CrossRef]
- Liu, X.; Liu, J. Introduction of Natural Resource Elements Integrated Observation Network Project. Geol. China 2022, 49, 678. [Google Scholar]
- Liu, X.; Liu, J. Introduction to the integrated platform for integrated observation of natural resource elements. Geol. China 2022, 49, 1004. [Google Scholar]
- Zhang, H.; Fan, J.; Huang, L.; Tang, Y.; Yue, Y.; Yang, Y.; Liu, X. Theories and technical methods for the comprehensive regionalization of natural resources in China. Resour. Sci. 2020, 42, 1870–1882. [Google Scholar] [CrossRef]
- Zheng, Y.; Zhang, H.; Liu, X.; Liu, X.; Bao, K.; Wang, X. Analysis of natural resources dynamic change characteristics under comprehensive regionalization in Northeast China from 1990 to 2018. Geol. Surv. China 2021, 8, 100–108. [Google Scholar] [CrossRef]
- Fu, Y.; Tan, C.; Liu, X.; Sun, X.; Yuan, Z.; Zheng, Y. Definition, classification, observation and monitoring of natural resources and their application in territorial planning and governance. Geol. China 2022, 49, 1048–1063. [Google Scholar]
- Li, J.; Sun, R.; Xiong, M.; Yang, G. Estimation of soil erosion based on the RUSLE model in China. Acta Ecol. Sin. 2020, 40, 3473–3485. [Google Scholar]
- Zheng, Y.; Li, F.; Liu, X.; Chang, M.; Zhao, H.; Lai, M.; Zhang, Z. Temporal and spatial variation of natural resources and their ecological environment effects in Northeast China in the past 30 years under the background of industrialization. Geol. China 2022, 49, 1361–1373. [Google Scholar]
- Peng, S.; Ding, Y.; Liu, W.; Li, Z. 1 km monthly temperature and precipitation dataset for China from 1901 to 2017. Earth Syst. Sci. Data 2019, 11, 1931–1946. [Google Scholar] [CrossRef]
- Fischer, G.; Nachtergaele, F.; Prieler, S.; Van Velthuizen, H.; Verelst, L.; Wiberg, D.J.I. Global Agro-Ecological Zones Assessment for Agriculture (GAEZ 2008); IIASA; Laxenburg; Austria and FAO: Rome, Italy, 2008; Volume 10. [Google Scholar]
- Liang, X.; Guan, Q.; Clarke, K.C.; Chen, G.; Guo, S.; Yao, Y.J.L. Mixed-cell cellular automata: A new approach for simulating the spatio-temporal dynamics of mixed land use structures. Landsc. Urban Plan. 2021, 205, 103960. [Google Scholar] [CrossRef]
- Xu, X.; Liu, J.; Zhang, S.; Li, R.; Yan, C.; Wu, S. China Many Periods of Land Use Land Cover Remote Sensing Monitoring Data Set (CNLUCC). In Chinese Academy of Sciences, Resources and Environment Science Data Center Data Registration and Publication System; Resource and Environment Data Cloud Platform: Beijing, China, 2018. [Google Scholar] [CrossRef]
- Yang, J.; Dong, J.; Xiao, X.; Dai, J.; Wu, C.; Xia, J.; Zhao, G.; Zhao, M.; Li, Z.; Zhang, Y. Divergent shifts in peak photosynthesis timing of temperate and alpine grasslands in China. Remote Sens. Environ. 2019, 233, 111395. [Google Scholar] [CrossRef]
- Zhang, W.-B.; Xie, Y.; Liu, B.-Y. Rainfall erosivity estimation using daily rainfall amounts. Sci. Geogr. Sin./Dili Kexue 2002, 22, 711–716. [Google Scholar]
- Shi, W.; Huang, M.; Barbour, S.L. Storm-based CSLE that incorporates the estimated runoff for soil loss prediction on the Chinese Loess Plateau. Soil Tillage Res. 2018, 180, 137–147. [Google Scholar] [CrossRef]
- Moore, I.D.; Burch, G. Physical basis of the length-slope factor in the universal soil loss equation. Soil Sci. Soc. Am. J. 1986, 50, 1294–1298. [Google Scholar] [CrossRef]
- Ganasri, B.; Ramesh, H.J.G.F. Assessment of soil erosion by RUSLE model using remote sensing and GIS-A case study of Nethravathi Basin. Geosci. Front. 2016, 7, 953–961. [Google Scholar] [CrossRef]
- Fu, B.; Zhao, W.; Chen, L.; Zhang, Q.; Lü, Y.; Gulinck, H.; Poesen, J. Assessment of soil erosion at large watershed scale using RUSLE and GIS: A case study in the Loess Plateau of China. Land Degrad. Dev. 2005, 16, 73–85. [Google Scholar] [CrossRef]
- Hammad, A.A.; Lundekvam, H.; Børresen, T.J.E.M. Adaptation of RUSLE in the eastern part of the Mediterranean region. Environ. Manag. 2004, 34, 829–841. [Google Scholar] [CrossRef] [PubMed]
- Fu, B.; Liu, Y.; Lü, Y.; He, C.; Zeng, Y.; Wu, B. Assessing the soil erosion control service of ecosystems change in the Loess Plateau of China. Ecol. Complex. 2011, 8, 284–293. [Google Scholar] [CrossRef]
- Hao, C.; Oguchi, T.; Pan, W. Assessment for soil loss by using a scheme of alterative sub-models based on the RUSLE in a Karst Basin of Southwest China. J. Integr. Agric. 2017, 16, 377–388. [Google Scholar]
- Phinzi, K.; Ngetar, N. The assessment of water-borne erosion at catchment level using GIS-based RUSLE and remote sensing: A review. Int. Soil Water Conserv. Res. 2019, 7, 27–46. [Google Scholar] [CrossRef]
- Tian, P.; Zhu, Z.; Yue, Q.; He, Y.; Zhang, Z.; Hao, F.; Guo, W.; Chen, L.; Liu, M. Soil erosion assessment by RUSLE with improved P factor and its validation: Case study on mountainous and hilly areas of Hubei Province, China. Int. Soil Water Conserv. Res. 2021, 9, 433–444. [Google Scholar] [CrossRef]
- Feng, T.; Chen, H.; Polyakov, V.O.; Wang, K.; Zhang, X.; Zhang, W.J.G. Soil erosion rates in two karst peak-cluster depression basins of northwest Guangxi, China: Comparison of the RUSLE model with 137Cs measurements. Geomorphology 2016, 253, 217–224. [Google Scholar] [CrossRef]
- Sang, L.; Zhang, C.; Yang, J.; Zhu, D.; Yun, W. Simulation of land use spatial pattern of towns and villages based on CA–Markov model. Math. Comput. Model. 2011, 54, 938–943. [Google Scholar] [CrossRef]
- Borrelli, P.; Robinson, D.A.; Fleischer, L.R.; Lugato, E.; Ballabio, C.; Alewell, C.; Meusburger, K.; Modugno, S.; Schütt, B.; Ferro, V. An assessment of the global impact of 21st century land use change on soil erosion. Nat. Commun. 2017, 8, 2013. [Google Scholar] [CrossRef] [PubMed]
- Eyring, V.; Bony, S.; Meehl, G.A.; Senior, C.A.; Stevens, B.; Stouffer, R.J.; Taylor, K. Overview of the Coupled Model Intercomparison Project Phase 6 (CMIP6) experimental design and organization. Geosci. Model Dev. 2016, 9, 1937–1958. [Google Scholar] [CrossRef]
- Johnson, M.D.; Hsieh, W.W.; Cannon, A.J.; Davidson, A.; Bédard, F.J.A. Crop yield forecasting on the Canadian Prairies by remotely sensed vegetation indices and machine learning methods. Agric. For. Meteorol. 2016, 218, 74–84. [Google Scholar] [CrossRef]
- Borrelli, P.; Robinson, D.A.; Panagos, P.; Lugato, E.; Yang, J.E.; Alewell, C.; Wuepper, D.; Montanarella, L.; Ballabio, C. Land use and climate change impacts on global soil erosion by water (2015–2070). Proc. Natl. Acad. Sci. USA 2020, 117, 21994–22001. [Google Scholar] [CrossRef] [PubMed]
- Gong, X.; Du, S.; Li, F.; Ding, Y. Study of mesoscale NDVI prediction models in arid and semiarid regions of China under changing environments. Ecol. Indic. 2021, 131, 108198. [Google Scholar] [CrossRef]
- Hateffard, F.; Mohammed, S.; Alsafadi, K.; Enaruvbe, G.O.; Heidari, A.; Abdo, H.G.; Rodrigo-Comino, J. CMIP5 climate projections and RUSLE-based soil erosion assessment in the central part of Iran. Sci. Rep. 2021, 11, 7273. [Google Scholar] [CrossRef] [PubMed]
- Zhu, P.; Liu, X.; Zheng, Y.; Wang, S.; Huang, L. Tradeoffs and synergies of ecosystem services in key ecological function zones in north China. Acta Ecol. Sin. 2020, 40, 8694–8706. [Google Scholar]
- Zhang, G.; Zeng, G.; Yang, X.; Jiang, Z. Future changes in extreme high temperature over China at 1.5 C–5 C global warming based on CMIP6 simulations. Adv. Atmos. Sci. 2021, 38, 253–267. [Google Scholar] [CrossRef]
- Ma, X.; Zhao, C.; Tao, H.; Zhu, J.; Kundzewicz, Z.W. Projections of actual evapotranspiration under the 1.5 C and 2.0 C global warming scenarios in sandy areas in northern China. Sci. Total Environ. 2018, 645, 1496–1508. [Google Scholar] [CrossRef]
- Xin, X.; Wu, T.; Zhang, J.; Yao, J.; Fang, Y. Comparison of CMIP6 and CMIP5 simulations of precipitation in China and the East Asian summer monsoon. Int. J. Clim. 2020, 40, 6423–6440. [Google Scholar] [CrossRef]
- Tian, J.; Zhang, Z.; Ahmed, Z.; Zhang, L.; Su, B.; Tao, H.; Jiang, T. Projections of precipitation over China based on CMIP6 models. Stoch. Environ. Res. Risk Assess. 2021, 35, 831–848. [Google Scholar] [CrossRef]
- Alewell, C.; Borrelli, P.; Meusburger, K.; Panagos, P. Using the USLE: Chances, challenges and limitations of soil erosion modelling. Int. Soil Water Conserv. Res. 2019, 7, 203–225. [Google Scholar] [CrossRef]
- Wang, X.; Wu, J.; Liu, Y.; Hai, X.; Shanguan, Z.; Deng, L. Driving factors of ecosystem services and their spatiotemporal change assessment based on land use types in the Loess Plateau. J. Environ. Manag. 2022, 311, 114835. [Google Scholar] [CrossRef]
- Wang, B.; Zhao, X.; Wang, X.; Zhang, Z.; Yi, L.; Hu, S. Spatial and temporal variability of soil erosion in the black soil region of Northeast China from 2000 to 2015. Environ. Monit. Assess. 2020, 192, 370. [Google Scholar] [CrossRef]
- Wang, S.; Xu, X.; Huang, L. Spatial and Temporal Variability of Soil Erosion in Northeast China from 2000 to 2020. Remote Sens. 2023, 15, 225. [Google Scholar] [CrossRef]
- Jiang, W.; Pang, Z.; Lv, J.; Ju, H.; Li, L.; Fu, J. Satellite observations reveal decreasing soil erosion in Northeast Inner Mongolia, China, over the past four decades. Front. Earth Sci. 2022, 10. [Google Scholar] [CrossRef]
- Zhu, Y.; Li, W.; Wang, D.; Wu, Z.; Shang, P. Spatial Pattern of Soil Erosion in Relation to Land Use Change in a Rolling Hilly Region of Northeast China. Land 2022, 11, 1253. [Google Scholar] [CrossRef]
- Wang, R.; Zhang, S.; Yang, J.; Pu, L.; Yang, C.; Yu, L.; Chang, L.; Bu, K.J.S. Integrated use of GCM, RS, and GIS for the assessment of hillslope and gully erosion in the Mushi River Sub-Catchment, Northeast China. Sustainability 2016, 8, 317. [Google Scholar] [CrossRef]
- Wang, Z.; Li, X.; Mao, Y.; Li, L.; Wang, X.; Lin, Q. Dynamic simulation of land use change and assessment of carbon storage based on climate change scenarios at the city level: A case study of Bortala, China. Ecol. Indic. 2022, 134, 108499. [Google Scholar] [CrossRef]
- Li, L.; Zhang, D.; Xin, X.; Yan, Y.; Yang, G.; Li, J.; Wang, X. Photosynthetic characteristics of Leymus chinensis under different soil moisture grades in Hulunber prairie. Acta Ecol. Sin. 2009, 29, 5271–5279. [Google Scholar]
- Wendu, R.; Li, G.; Zhang, J.; Lai, X.; Yi, J.; Fan, G.; Yang, D. The study of soil microbial biomass and soil enzyme activity on different grassland in Hulunbeier, Inner Mongolia. Acta Prataculturae Sin. 2010, 19, 94–102. [Google Scholar]
- Yi, K.; Wang, S.; Wang, X. The characteristics of spatial-temporal differentiation of soil erosion based on RUSLE model: A case study of Chaoyang City, Liaoning Province. Sci. Geogr. Sin. 2015, 35, 365–372. [Google Scholar]
- Li, M.; Liang, D.; Xia, J.; Song, J.; Cheng, D.; Wu, J.; Cao, Y.; Sun, H.; Li, Q. Evaluation of water conservation function of Danjiang River Basin in Qinling Mountains, China based on InVEST model. J. Environ. Manag. 2021, 286, 112212. [Google Scholar] [CrossRef] [PubMed]


Disclaimer/Publisher’s Note: The statements, opinions and data contained in all publications are solely those of the individual author(s) and contributor(s) and not of MDPI and/or the editor(s). MDPI and/or the editor(s) disclaim responsibility for any injury to people or property resulting from any ideas, methods, instructions or products referred to in the content. |
© 2023 by the authors. Licensee MDPI, Basel, Switzerland. This article is an open access article distributed under the terms and conditions of the Creative Commons Attribution (CC BY) license (https://creativecommons.org/licenses/by/4.0/).