Article

Effects of Forest Management Approach on Carbon Stock and Plant Diversity: A Case Study from Karnali Province, Nepal

1
Institute of Forestry, Hetauda Campus, Tribhuvan University, Hetauda 44107, Bagmati Province, Nepal
2
Forest Research and Training Center, Surkhet 21700, Karnali Province, Nepal
3
Department of Geosciences and Geography, University of Helsinki, P.O. Box 64, FI-00014 Helsinki, Finland
4
Division Forest Office, Jumla 21200, Karnali Province, Nepal
*
Authors to whom correspondence should be addressed.
These authors contributed equally to this work.
Land 2023, 12(6), 1233; https://doi.org/10.3390/land12061233
Submission received: 2 May 2023 / Revised: 12 June 2023 / Accepted: 13 June 2023 / Published: 15 June 2023

Abstract

:
The mitigation of global warming and conservation of biodiversity are two significant environmental challenges today. Estimating and comparing forest carbon stock and plant diversity under different management approaches provide insight into the choice of management approaches for carbon and plant diversity management. We investigated the variation in carbon stock and diversity of plant species in two forest managements under different approaches: the Kakrebihar protection forest (PF) and Sano Surkhet community forest (CF) in Karnali Province, Surkhet, Nepal. In total, 63 sample plots (30 plots in PF and 33 plots in CF) were laid out systematically across the forests. Dendrometric measurements were carried out for trees, poles, and saplings, and representative leaf litter and herb samples were collected. Soil samples were taken at 10 cm, 20 cm, and 30 cm depths using a soil auger. The existing tree volume equations of tree species of interest were used to estimate tree volume, and species-specific wood density and conversion factors were used to obtain total biomass and carbon content. Soil samples were analyzed using the Walkley-Black method to determine soil organic carbon. PF had higher carbon stock, plant species richness, and abundance at the landscape level than CF; however, the scenario differed at the plot level. At the plot level, PF had significantly higher total carbon stock and biomass carbon stock than CF. However, PF and CF were statistically indistinguishable in term of soil carbon stock. At the plot level, PF and CF were statistically indistinguishable regarding richness, Simpson diversity, and Shannon diversity, but PF had significantly higher plant abundance than CF. In conclusion, the value of PF for carbon stock and plant diversity surpassed those of CF. This study suggests that PF might be a better strategy to enhance carbon stock in forests and maintain habitat for various plant species.

1. Introduction

Global warming has emerged as one of the significant global issues in recent decades. Global warming refers to a gradual increase in the average global temperature. Natural and human-caused events cause rise in the global average temperature. Increase in greenhouse gases, such as carbon dioxide, mainly causes global warming. Carbon emission from deforestation alone accounts for 20% of the global carbon emissions [1]. Rising sea levels, melting ice, heat waves, droughts, changing ecosystems, reduced food security, spreading pests and diseases, and so on are the significant impacts of global warming [1].
To combat global warming, the Kyoto Protocol under the United Nations Framework Convention on Climate Change (UNFCCC) links the environment with the economy by establishing the global carbon market. Implementing the Kyoto Protocol Clean Development Mechanism is the only flexible way for developing countries to participate in the emerging global climate market [2]. The Kyoto Protocol recognizes the importance of forests in mitigating greenhouse gas emissions and includes forest and soil C sequestration in the list of acceptable offsets [3]. Thus, Reduced Emissions from Deforestation and Degradation of Forests (REDD+), a market-based approach under UNFCCC, has emerged as an incentive mechanism for developing countries to invest in forest management activities that are expected to halt the emission [4].
Global warming can be addressed through the massive reforestation, afforestation, and minimizing deforestation, and among other approaches [5]. Sustainable forest management could improve the capacity of forests to store atmospheric carbon and improve other ecosystem services, such as soil and water quality. Living biomass and soil are the critical carbon sinks that help prevent global climate change and help increase adaptation [6]. The plants and soil readily absorb atmospheric carbon by sequestering 20–100-times higher carbon per unit area than the croplands [7] and by sharing almost 60% of the world’s terrestrial carbon [8]. Long-term forest carbon sources can be achieved through the massive afforestation, reforestation, and enhancing forest health through proper silviculture operations [9].
As carbon sequestration importantly addresses the issue of climate change [10], it has a global concern under the reward policy of REDD+ [11]. In Nepal, Community Forestry (CF) has been accorded the highest-priority forestry sector and has widely been acclaimed as a successful forest management approach. A pilot survey shows community-managed forests sequester substantial amounts of carbon [2]. REDD+ offers multiple benefits, including carbon payments for carbon stocks. Many successful studies have claimed that community-managed forests offer Nepal’s substantial carbon sequestration potential [12]. At the same time, the protected forest is a relatively new approach to forest management in Nepal. The government of Nepal has managed a forest area of 133,755 ha as a protected forest under different forest protection rules and regulations [13]. An additional 194,908 ha forest is soon being declared a protected forest [14]. The main objective of establishing protected forests is to conserve natural resources and their values and encourage the wise use of forest resources to the benefit local users [15].
Few studies [16,17,18,19,20,21] have been conducted in Nepal regarding plant diversity and soil carbon stock under different forest management approaches. However, most of these studies were confined to central Nepal and Karnali province still lacks such comparative studies though the Kakrebihar protection forest (PF) is the first protection forest in Nepal. Therefore, this study was designed to estimate and compare the carbon stock of forest biomass and soil along with the plant diversity in two forest types managed under different approaches in the Surkhet district of Karnali province, Nepal. As these forest types are more or less similar in tree species composition, elevation, and other stand conditions, this study provides an insight for policymakers and forest technicians in choosing an appropriate forest management model for addressing growing environmental concerns.

2. Methodology

2.1. Study Area

This study was carried out in the Kakrebihar protection forest and Sano Surkhet community forest in Birendranagar municipality of the Surkhet district of Nepal (Figure 1 and Figure 2). Surkhet, the provincial capital of Karnali province, is an inner Terai valley of Nepal. The district covers an area of 2488.64 km2 with elevation varying from 300 m.s.l. of the lower tropical region to 3000 m.s.l. of the temperate region. Its bordering districts are Jajarkot, Dailekh, and Achham to the north; Bardiya, Banke, and Kailali to the south; Salyan district to the east; and Doti to the west. It is between 81°37′59.99″ E longitude and 28°35′59.99″ N latitude. Kakrebihar PF (total area 181.04 ha, of which 167 ha is forested) was established in 2002 to conserve the cultural heritage, ecosystem, and environment and promote ecotourism. The collection of forest products in PF is not allowed. However, some illegal collection of forest products, such as dry branches, underlying dead wood, and litter, has been found in some plots. Sano Surkhet CF (area 330.45 ha), formally established in 1991, is managed by a local community that allows the collection of timber and other minor forest products such as fuelwood, fodder, etc. Both PF and CF lie in the tropical climatic zone, with Shorea robusta Gaertn. (Dipterocarpaceae) as a dominant species. Before being formally declared, both forests were managed by a local user committee for a long time. These two forests are managed with different objectives but have almost comparable tree species, elevations, and other stand conditions. Therefore, these areas were chosen for our study to determine whether the management approach would substantially impact storing carbon stocks and plant diversity.

2.2. Data Collection

Sampling Design and Data Collection
Systematic sampling with a concentric circular plot design was used for sampling and measurement following Nepal’s community forest inventory guideline [16]. Altogether, 63 concentric circular plots (30 in the PF and 33 in the CF) were laid out systematically to collect data. Circular sample plots of size 100 m2 for trees and poles (≥10 cm dbh), 25 m2 for saplings (>1 m height and ≤10 cm dbh), and 10 m2 for regenerations, grass, and litter were laid out. Diameter at breast height (dbh) and total height were measured using the diameter tape and Sunto clinometer, respectively. All the herbaceous, woody vegetation, and leaf litters were collected from a 10 m2 area through trimming, and the fresh weights of these samples was recorded. Depending on the litter’s density on the plot, the quantity of representative sub-samples ranged from 50 to 150 g per sample plot. A 30 cm-deep profile was dug in the plot’s center, and soil samples were taken at different depths (0–10 cm, 10–20 cm, and 20–30 cm) with the help of a soil auger and collected samples were weighted in-situ and packed in a plastic bag for lab analysis (to be described later).

2.3. Data Analysis

2.3.1. Carbon Stock Estimation

Above-ground biomass and carbon
The total stem volume of each tree species was calculated using the volume equation (Equation (1)) developed by [17].
I n V = a + b   l n d b h + c   l n h t
where V = total stem volume with bark (m3); dbh = diameter at breast height (dm); ht = total tree height (m); and a, b, c = species-specific parameter estimates.
The stem volume obtained from Equation (1) was divided by 1000 to obtain the cubic meter volume, and then the stem volume was multiplied with a species-specific dry wood density to obtain the oven-dry weight of stem biomass [18]. Wood density was obtained from the carbon measurement guideline [19], which was used to estimate the biomass of the stem of different species involved in the study.
The separate branch-to-stem and foliage-to-stem biomass ratios prescribed by the Master Plan for Forestry Sector (MPFS) in 1989 [20] were used to estimate branch and foliage biomass from stem biomass. However, our study did not consider dead trees for estimating biomass and carbon.
Above-ground biomass (AGB) and carbon (AGC)
Above-ground biomass was calculated by adding stem, branch, and foliage biomass. Then biomass carbon content was calculated using an equation developed by IPCC (2006) [1]:
A G C = 0.47 × A G B
Below-ground biomass (BGB) and carbon (BGC)
The below-ground biomass of a tree varies accordingly to tree species, stand age, stand development stages, microclimate, and nutrients in the soil. According to the relation established by [21], root biomass was calculated as per IPCC (2006) [1] by the following formula.
B G B = 0.30 × A G B ( f o r   b r o a d l e a v e d   v e g e t a t i o n )
B G C = 0.47 × B G B
Leaf litter, herb, and grasses biomass (LHGB), and carbon (LHC)
All the herbaceous and woody vegetation (≤5 cm dbh), leaf litter, and grass were collected inside the 10 m2 area through trimming. The fresh weight of samples was recorded, and representative sub-samples were taken for oven-drying at 70 °C until their weights became constant [22]. Oven-drying was carried out in the Biometry Lab of Forest Research and Training Center, Kathmandu, where fresh leaf litter was dried for 48 h. The weight was considered dry weight when no change in the weight was noticed. The dry sub-sample biomass was then used to convert a total fresh mass of LHGB to oven-dry biomass. The amount of biomass per unit area was obtained by Equation (5) [19].
L H G B = W   f i e l d A × W S S D W S S F × 1 10,000
where LHGB = biomass of leaf litter, herb, and grass (ton ha−1); W   f i e l d = weight of the fresh field sample of leaf litter, herbs, and grass, destructively sampled within an area of size A (g); A = size of the area in which leaf litter, herb, and grass were collected (ha); W S S D = weight of the oven-dry sub-sample of leaf litter, herb, and grass taken to the laboratory to determine moisture content (g); and W S S F = weight of the fresh sub-sample of leaf litter, herb, and grass taken to the laboratory to determine moisture content (g). The carbon content in LHGB was calculated using Equation (6) [1].
L H C = 0.47 × L H G B
Soil Organic Carbon
The Walkley-Black method was used to determine soil organic carbon amount [23]. A total of such amount was estimated using Equation (7) [24].
S O C = % C × B D × T
where %C = carbon concentration (%); BD = soil bulk density (kg m−3); T = represents the thickness in the sampling soil layer (m).
Total carbon
T o t a l   c a r b o n = A G C + B G C + L H C + S O C
To convert carbon stock to a ton of carbon dioxide equivalent, we multiplied it by 3.67 [25].

2.3.2. Quantifying Tree Species Diversity

We considered plants having at least 10 cm diameter at breast height as established plants and used them for diversity estimation. We produced species accumulation curves using Kindt’s precise accumulator method [26] and Chao2 richness estimator values [27] to compare and estimate the overall species number per management approach. Species richness, individual numbers, Simpson diversity index (1-D) [28], and Shannon diversity [29] were used to compare plant species diversity both at the plot level and landscape level.

2.4. Statistical Analyses

To compare the carbon stock between different management approaches, we applied t-test. In addition, to identify variations in soil depth within and between the management approaches, we employed a two-way analysis of variance (ANOVA) and performed Tukey’s all-pairwise comparisons of means. The same method was used to detect differences in carbon pools within and between the management approaches as well as to compare the aforementioned diversity index at the plot level. We performed all the statistical analyses using the packages vegan version 2.2-1 [30], multcomp version 1.3-7 [31], and RColorBrewer [32] in the statistical software R version 3.0.2 [33].

3. Results

3.1. Carbon Stock under Different Management Approaches

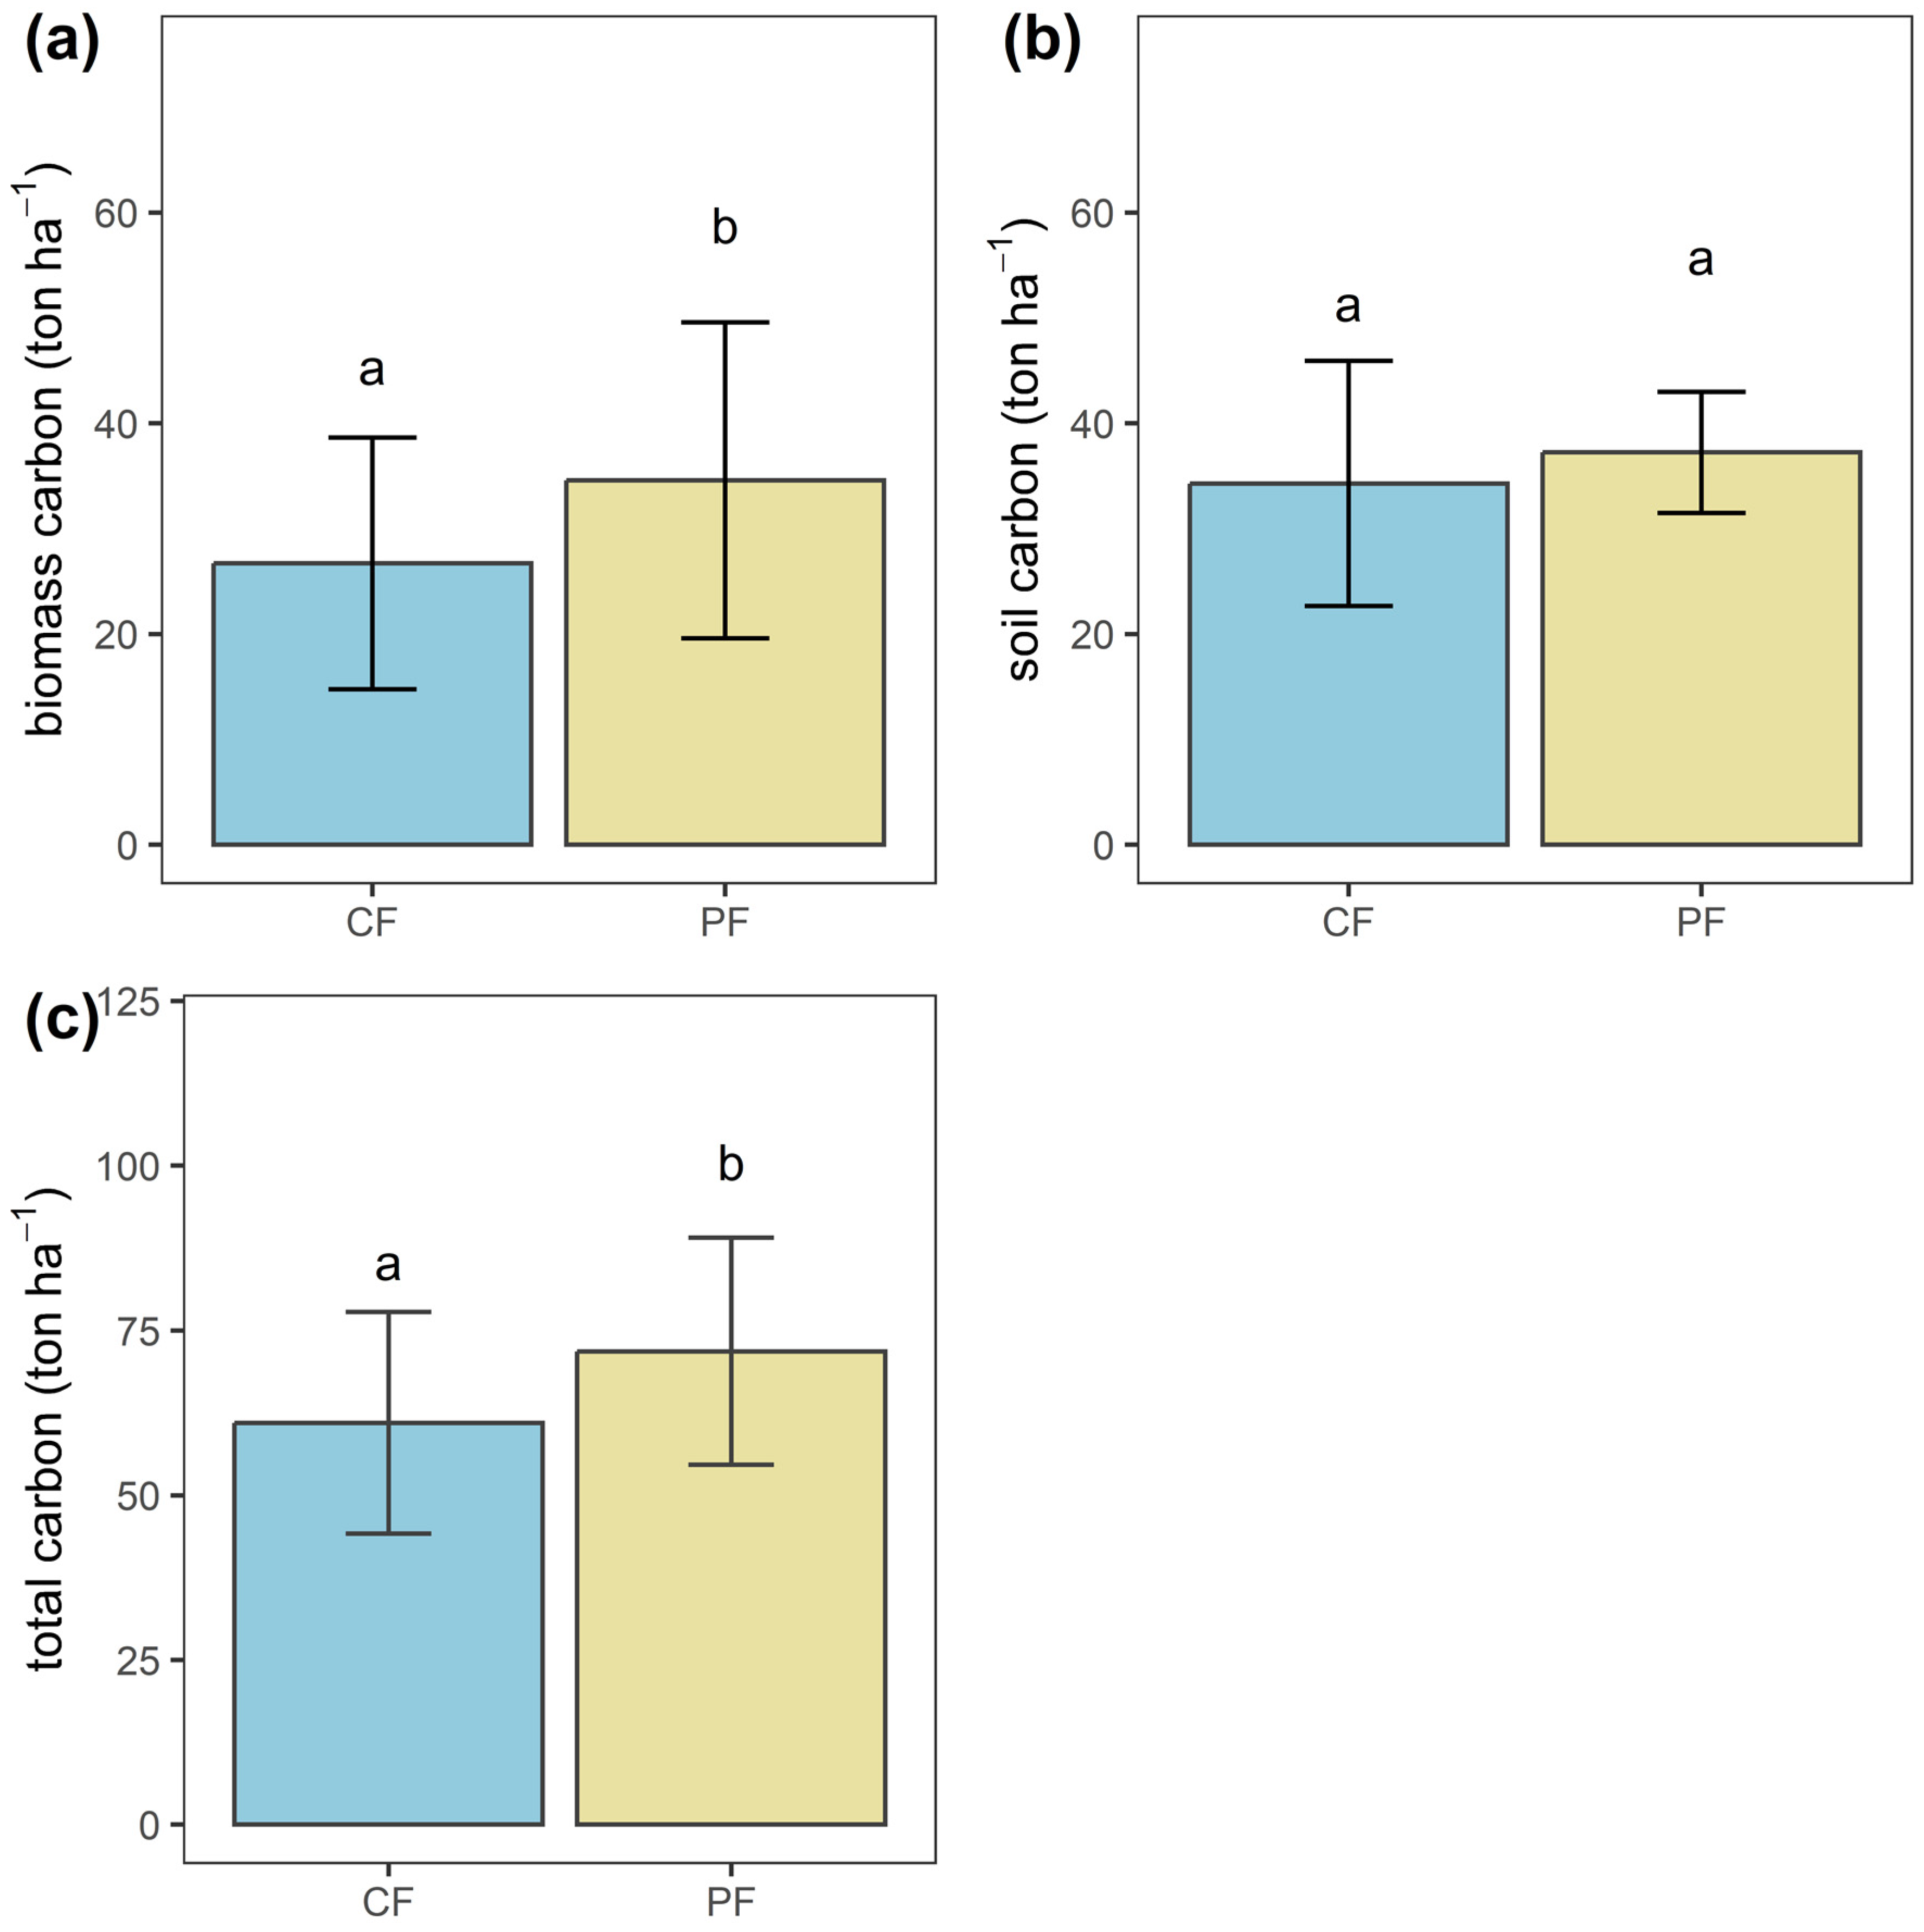
The carbon stock in the PF was higher than in the CF; however, at the plot level, carbon stock fluctuated to a greater extent in the PF than in the CF (Table 1). The biomass carbon and soil carbon in PF was 34.6 ton ha−1 and 37.23 ton ha−1, respectively, while in CF, it was 26.49 ton ha−1 and 34.26 ton ha−1, respectively. At the plot level, biomass carbon varied from 0.23 ton ha−1 to 79.08 ton ha−1, and soil carbon varied from 25.42 ton ha−1 to 47.69 ton ha−1 in the PF, while in the CF, biomass carbon varied from 12.94 ton ha−1 to 57.11 ton ha−1, and soil carbon varied from 21.3 ton ha−1 to 68.6 ton ha−1. We found significant differences in forest biomass carbon and total carbon between management approaches (biomass carbon: t = −2.2943, df = 55.393, p-value = 0.02559, total carbon: t = −2.5241, df = 60.132, p-value = 0.01426). However, no significant differences was found regarding soil carbon between the management approaches (t = −1.2966, df = 47.698, p-value = 0.201) (Figure 3).
In both the management approaches, soil carbon (SC) was the major carbon pool that contributed more than 50% carbon to the total carbon stock and was followed by above-ground carbon (AGC). Leaflitter and herb biomass carbon (LHC) contributed a negligible amount to the total carbon stock- remarkably less than 1% in both forest types (Figure 4).

3.1.1. Soil Carbon Stock Variation among Soil Depth

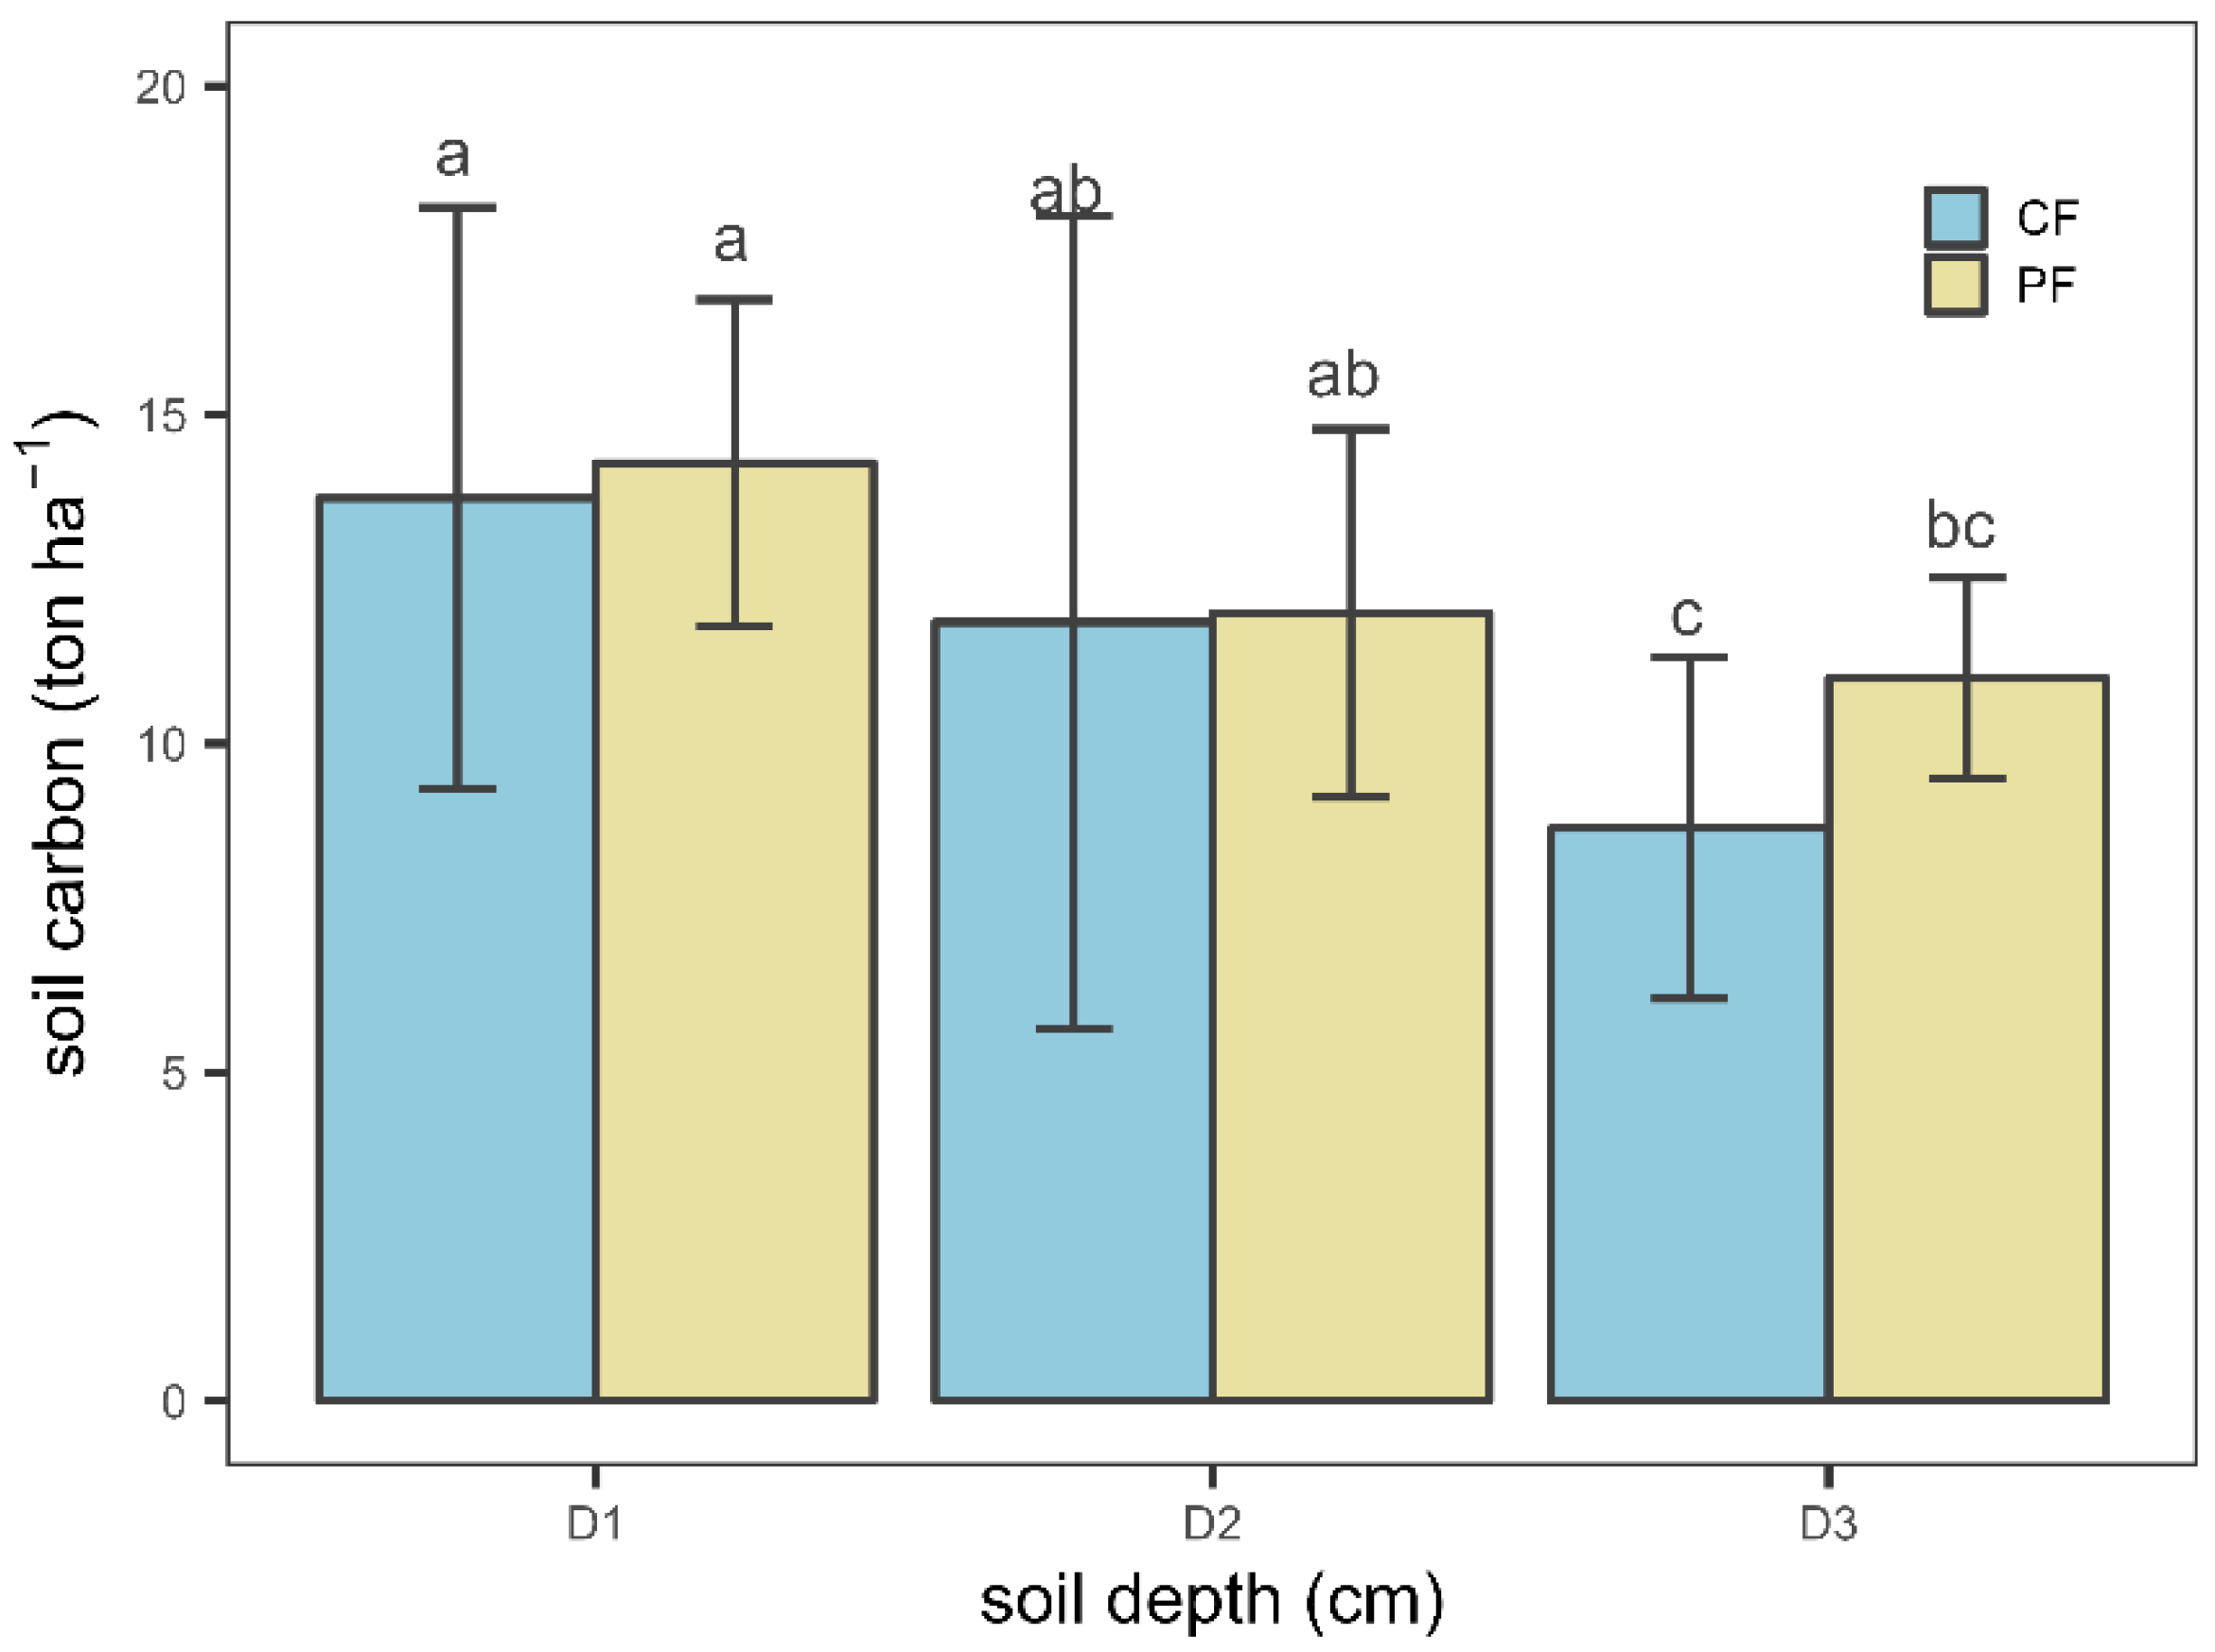
The soil carbon declined with increased soil depth, irrespective of management approaches. At the plot level, we found significant differences in mean soil carbon stock within both the management approaches. D1 had significantly higher soil carbon than D3 (soil depth 20–30 cm) in both the management approaches; however, D2 had significantly higher soil carbon than D3 in CF only. Comparing soil carbon at different depth levels between the management approaches, we found no significant differences in mean soil carbon stock between the same soil depth (Figure 5).

3.1.2. Biomass Carbon Variation within and between Management Approaches

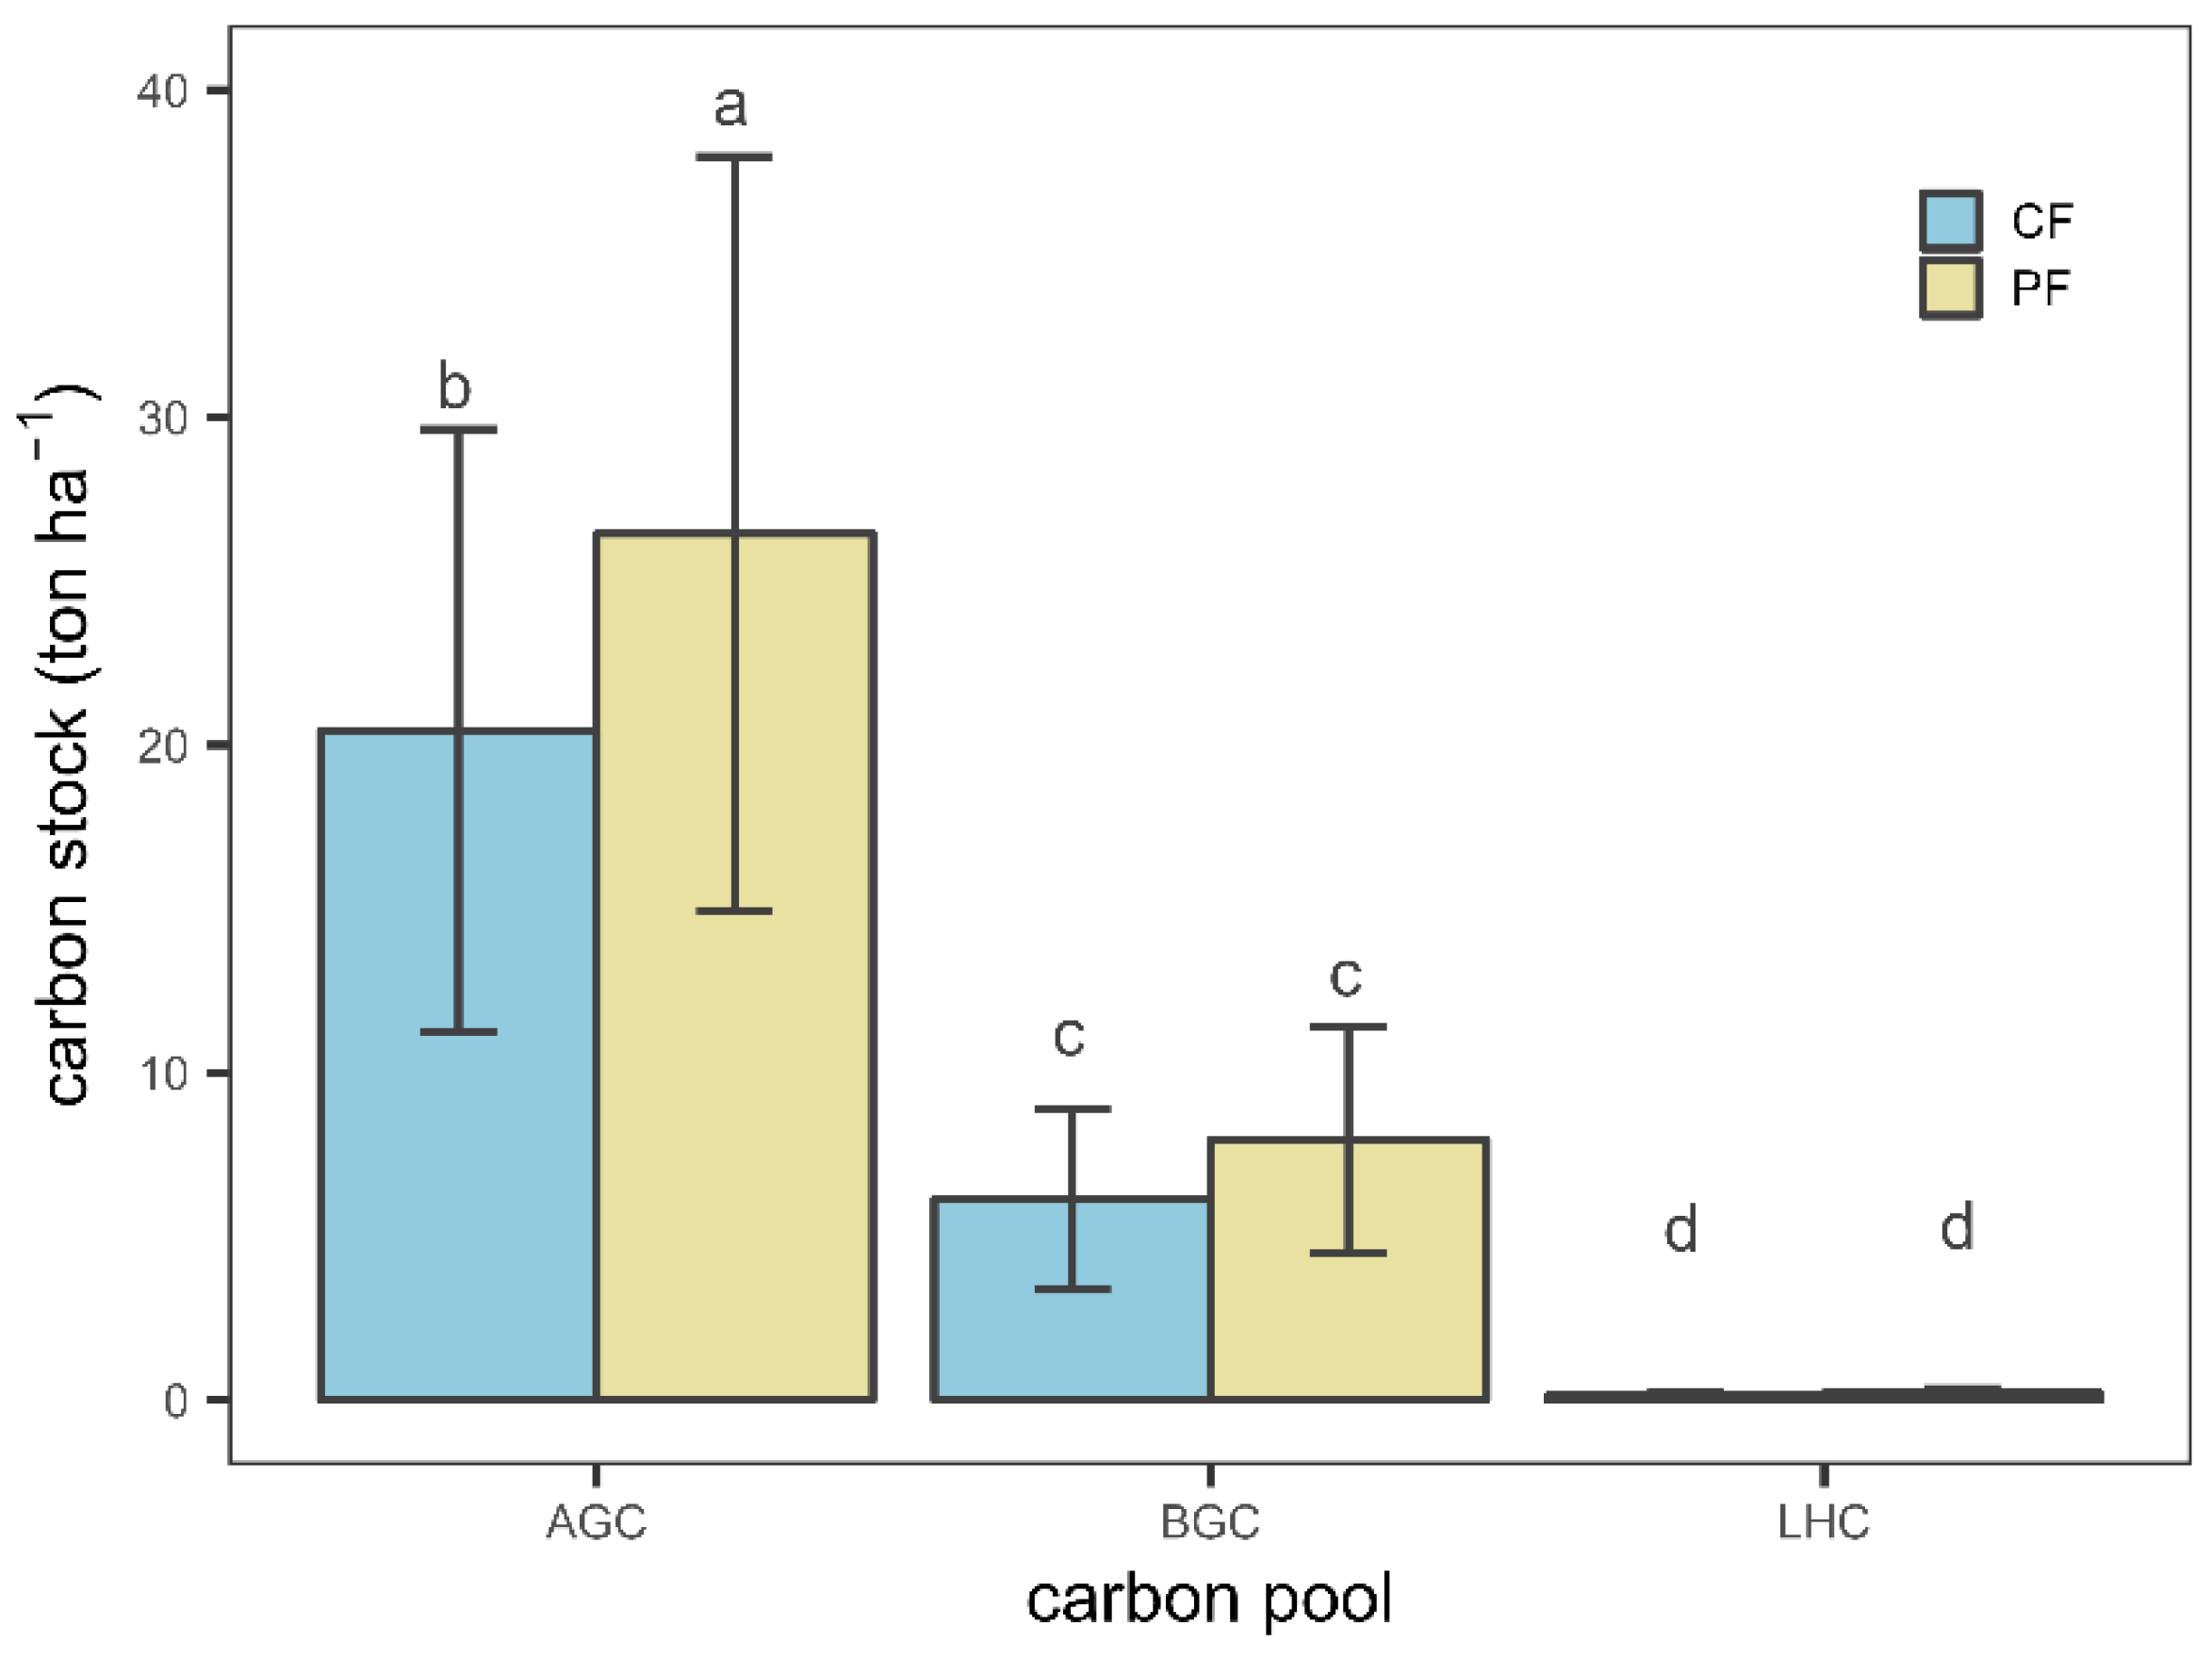
We detected major differences in above-ground biomass carbon (AGC), below-ground biomass carbon (BGC), and leaflitter, herb, and grass biomass carbon (LHG) within and between management approaches. At the plot level, PF had significantly higher AGC than CF; however, BGC between management approaches and LHG between management approaches did not differ significantly. Within each management approaches, AGC was significantly higher than BGC and LHG, and BGC was significantly higher than LHG (Figure 6).

3.2. Species Richness and Abundance

We recorded 509 individuals from 14 plant species in the 63 sample plots. The total number of individuals in the PF surpassed the CF (54.8% of all the individuals were recorded in PF and 45.2% in CF). The percentage of individuals in PF would be increased if we considered an equal sample size for both the management approaches. PF had 10 species, the highest overall richness among the investigated management approaches (Table 2).
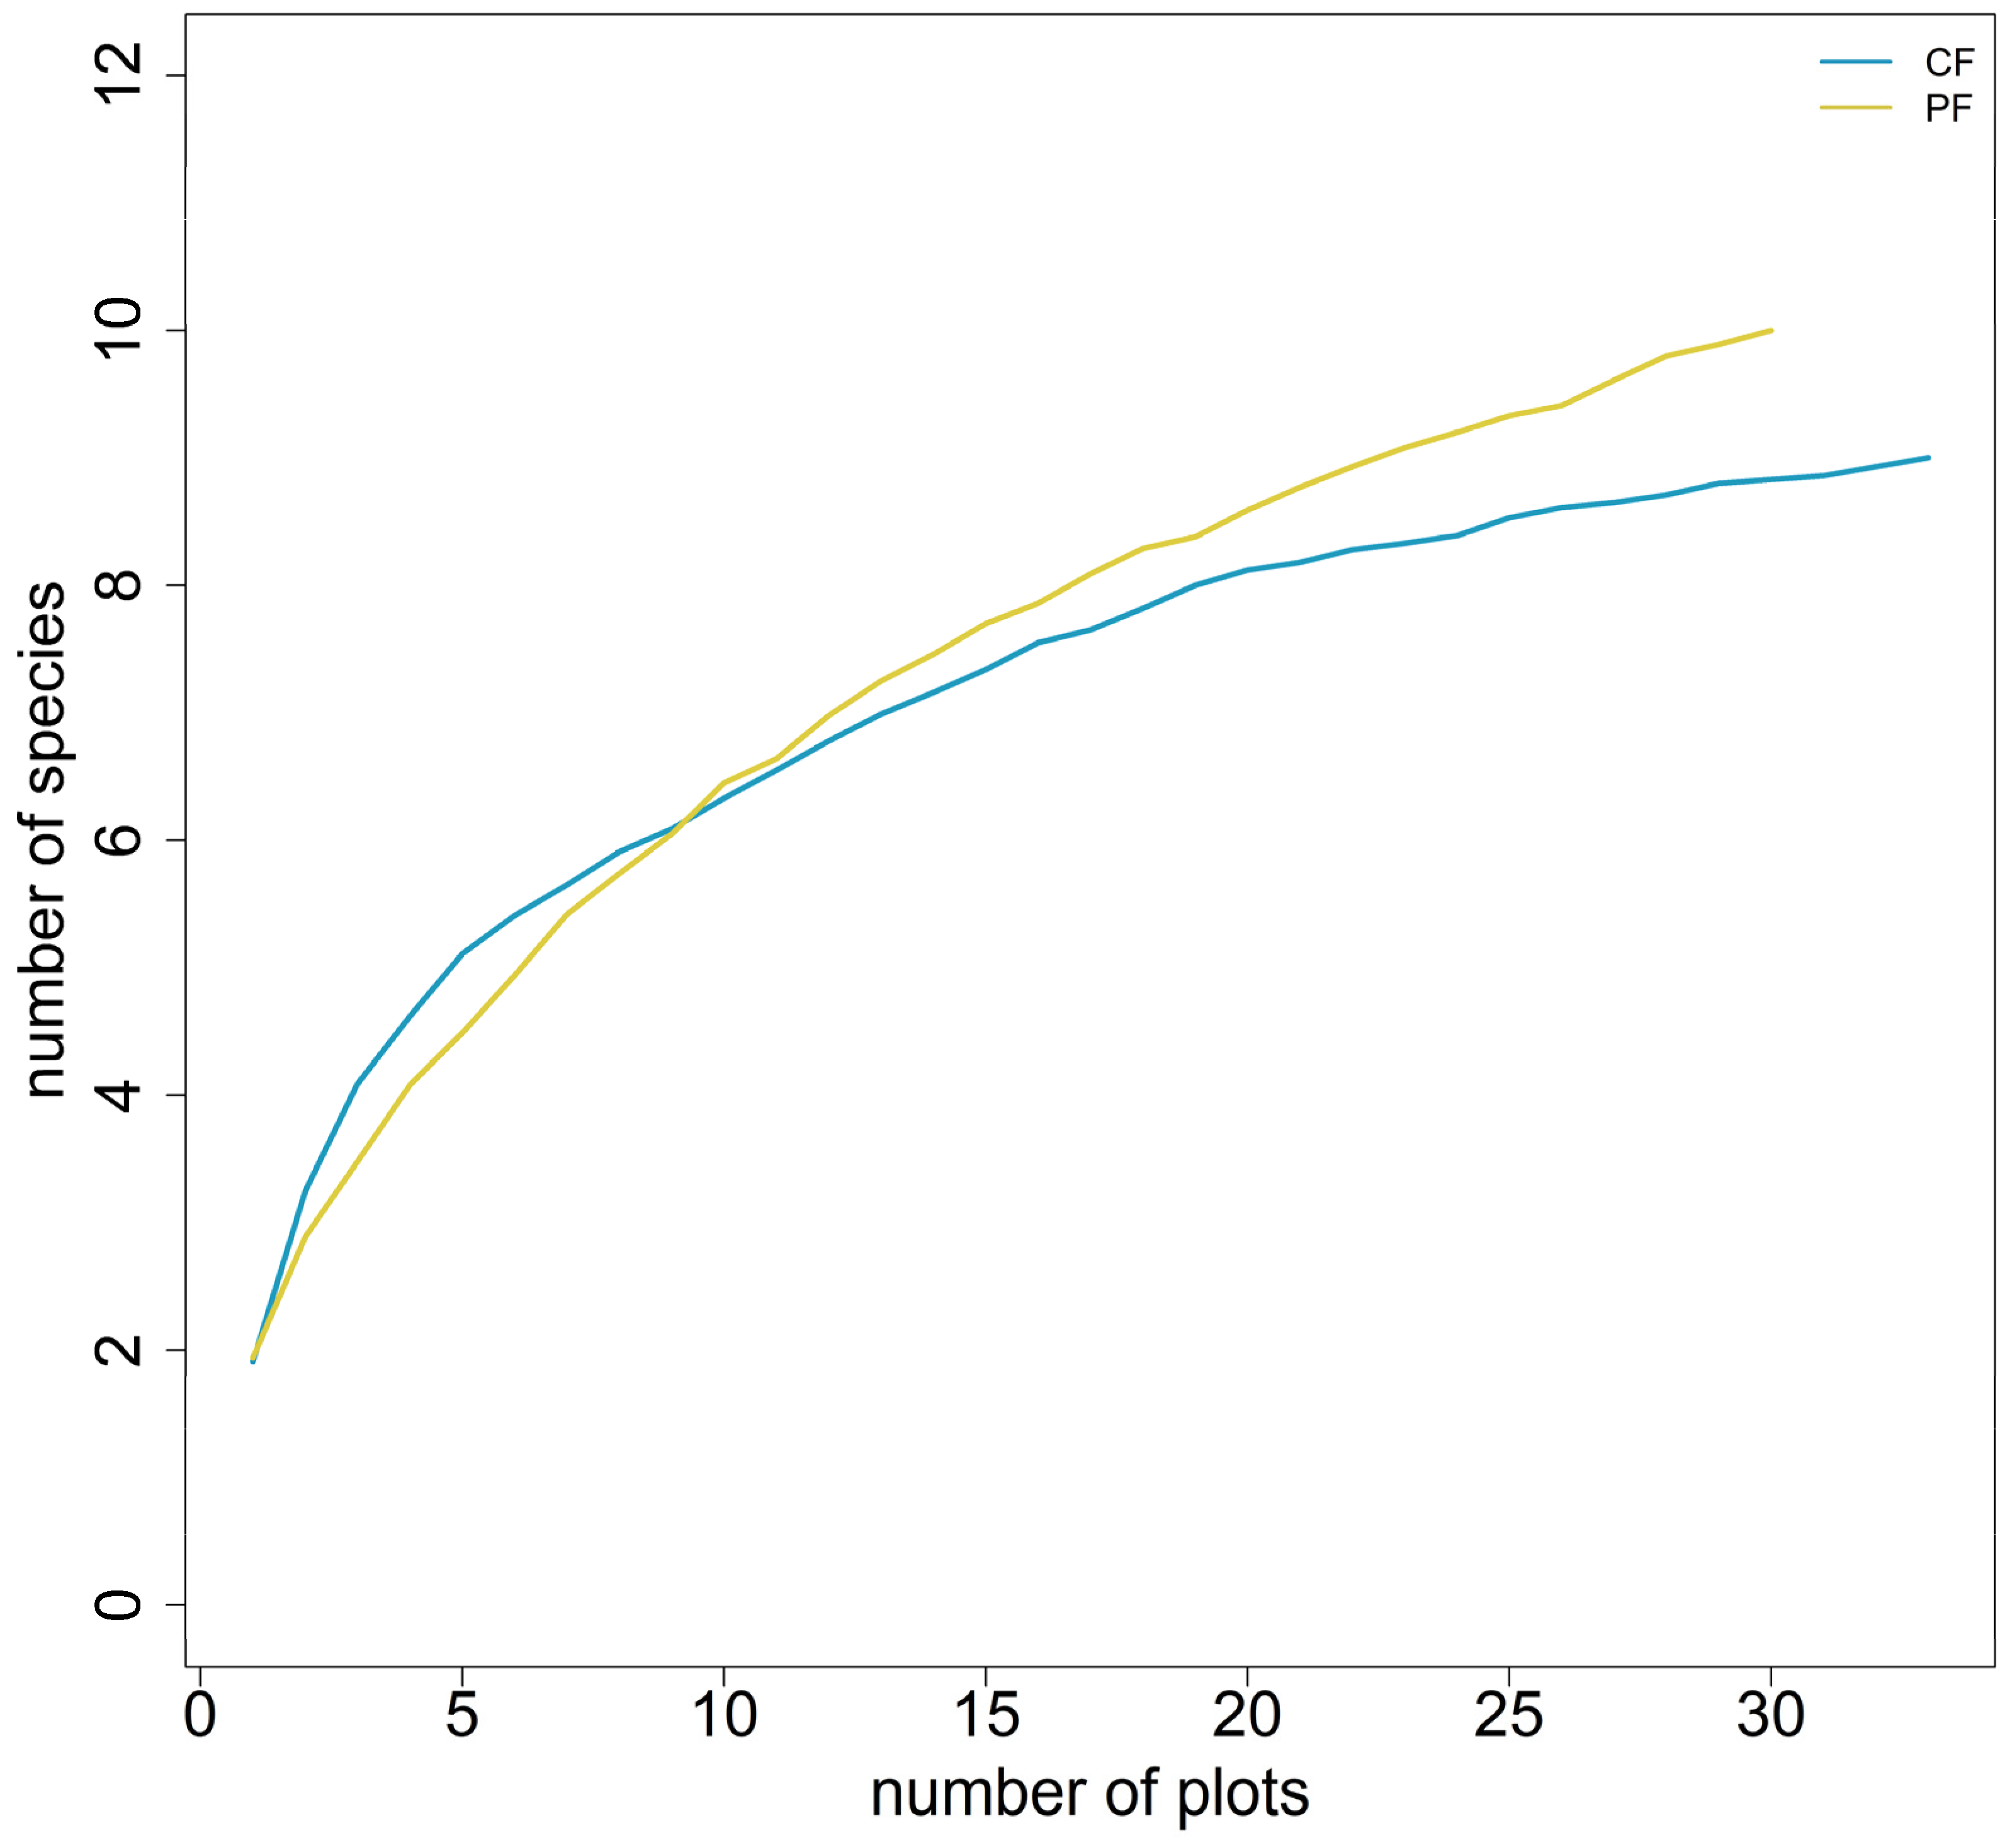
Species-accumulation curves showed that the species sampling of 30 sample plots for PF and 33 plots for CF have not yet reached an asymptote (Figure 7). According to Chao species richness estimators, estimated species numbers exceeded our observations in both the management approaches: in PF, 69.7% of 14.35 estimated species were recorded, and in CF, 82.3% of 10.94 estimated species were recorded. Continued sampling would therefore likely lead to higher species numbers in both the management approaches.
At the plot level, management approaches differed significantly regarding species abundance. However, they did not differ significantly in terms of other diversity measures (species richness, Simpson index, and Shannon diversity (Figure 8). The PF had significantly higher species abundance than CF (Figure 8b). The PF and CF were statistically indistinguishable from each other in terms of richness, diversity, and heterogeneity (Figure 8a,c,d). The low total richness of plant species in CF, combined with relatively high plot-level richness (though statistically indistinguishable at plot level), indicates relatively high alpha but very low levels of beta diversity, which explains the same species that mainly occurred in each plot.

4. Discussion

This study reveals that the carbon density of two forests managed under different management approaches (CF and PF) is significantly different (Figure 3). The overall carbon stock of the PF was higher than that of CF. The natural conditions in each forest were nearly the same; the effect of management strategies and land-use patterns could explain this discrepancy. The thinning, pruning, clearance of leaf litter, cutting, and logging of the trees for the livelihood sustainability of the local people, as well as the disturbance from cattle grazing inside the CF, may have led to the lower carbon stock. Our finding is consistent with some studies in Nepal [9,34,35], where the total carbon stock in the undisturbed forest (where human interference is limited) was higher than that of the disturbed forest (human interference is allowed). However, our estimated total carbon stock in both the management approaches was much lower than in other studies [6,7,36,37]. This could be attributed to differences in the geographical location, tree species composition, stand age, above-ground input from leaf litter, fine root decomposition, management approaches, and other operating ecological parameters [38,39].
At the soil depth level, the soil organic carbon showed that the carbon stock decreased with increasing soil depth in both the management approaches (Figure 5). The total soil carbon stock at the soil depth of 0–10 cm had the highest amount compared to that in the subsequent depths. These findings are consistent with the study conducted by [35], which reported the maximum amount of soil carbon stock at the top layer irrespective of human disturbance. The study by [40] in a community forest in Nepal also showed the maximum amount of soil organic carbon obtained in the upper layer at 0–10 cm compared to the lower layer at 20–30 cm. Higher humus aggregate in the top layer of the soil profile in forest blocks and the decreased content of organic matter with an increased level of soil depth regardless of vegetation, soil texture, and clay size fraction are the factors responsible for the decreasing the soil organic carbon with increasing soil depth [41,42]. At the plot level, we found insignificant differences in soil carbon between some consecutive depths (Figure 5). The individual plot features, such as soil types, texture, and structure, may have favored the increase in soil carbon stock in some plots’ subsoil [43]. Therefore, a study on individual plot features should also be considered for a valid comparison at the plot level.
PF exceeded CF in terms of total species richness and abundance; however, CF exceeded PF in terms of the Simpson index and Shannon diversity. At the plot level, the differences in species richness, Simpson index, and Shannon diversity were less pronounced or absent; however, the differences in terms of abundance were detectable. The possible explanation could be the periodic silvicultural operations (thinning, pruning, weeding) based on the local knowledge of CF user groups, which concentrates on promoting only the preferred tree densities [44] suitable for economic gains. Our study aligns with [45], who found that the number of tree species in PF forest exceeded the CF in central Nepal. Typically, greater species richness in managed forests (forests with human interference) is linked to improved lighting conditions resulting from less canopy coverage [46,47]. On the other hand, our results do not align with that notion, as we had higher species richness in PF compared to CF. This discrepancy may be attributed to the fact that we only enumerated well-established trees (dbh ≥ 10 cm) to study species diversity. The outcome may have been different if we had addressed regeneration because the research locations comprise light-demanding species (Shorea robusta and its associated species) that cannot grow effectively in the shade [48].
In our study, CF and PF consisted of only 9 and 10 tree species, respectively. Other studies in CF in Nepal reported 49 tree species and 47 tree species in two different CF [49], because these studies considered all the forms of tree species (seedling sapling, pole, and trees). Similarly, [45] reported 14 species in protected municipal-owned forests and 11 in CF in central Nepal, comparable with our findings. Even though species richness estimators indicate that further sampling of CF and PF could yield more species richness, we cautiously assert that the regional pool of tree species in our research area is moderate.
Even though our study was carefully designed to obtain as much reliable data as possible; some limitations may exist, because the root biomass was estimated using the root–shoot ratio, a generic ratio recommended by FAO. In addition, our study did not include the carbon amount sequestrated in the dead wood due to almost the absence of dead wood biomass in CF and only a little in PF at our study sites. However, including those would have aided in obtaining a more precise estimation of carbon stock, as claimed by [50], who estimated that about 8% of carbon stock in the world’s forests may be made up of deadwood, which includes branches, stump, and fallen or standing trees. In addition, we only inventoried the established plants for the analysis of species diversity due to the problem of species identification; and this has lowered the species diversity index. Replications of similar types of studies on both the ecological regions will be crucial to obtain valid inferences for the generalization of results throughout the Karnali province and nation.
We did not apply the wet oxidation (WO) technique that can be used to estimate the carbon content of the solid organic materials, including plant materials, even though this is a more correct technique [50,51]. WO is a pretreatment technique, which uses water and air or oxygen to fractionate biomass at temperature above 120 °C. To the authors’ knowledge, no studies have used the WO technique to estimate carbon stocks of forest at a large scale, as this is a sophisticated laboratory-based technique requiring tremendous amount of resources, and thus applicable only to a small sample. A conversion factor of 0.47, which is an average of several plant species found around the world and has been recommended by IPCC [1], is likely based on the WO technique. We also applied this factor in our study to convert the plant biomass to carbon content. The WO technique can be also suitable for the validation of carbon content obtained from allometric equations of the plant species of interest. A plant biomass study using the WO technique would be of interest to researchers.

5. Conclusions

The transformation of the PF from the CF increased the total carbon stock, biomass carbon stock, and soil carbon stock. The increase in soil carbon storage, on the other hand, was highly scale dependent, difficult to discern at the plot level, and most evident at the landscape level. Similarly, soil carbon decreased with increased soil depth in both the forest types. In each studied soil depth section, PF had a higher soil carbon than CF; however, the higher soil carbon was not easily detectable at sample plot level in the same depth.
The CF exhibited higher levels of both the Shannon diversity index and Simpson diversity index compared to the PF at the landscape scale, although there was no significant difference between the two types of the forest at the plot level. On the other hand, PF had greater species richness and abundance at the landscape scale but no variation in species richness at the plot level. These results imply that PF may be more valuable for conservation purposes, as they can potentially increase forest carbon stocks and provide a diverse habitat for plant species. This could not only lead to greater incentives from the REDD+ program through carbon trading and biodiversity conservation, but also lead to a compromise regarding timber production. Therefore, further research is required in similar areas to choose appropriate forest management approaches to balance both the carbon and non-carbon benefits from the forest.

Author Contributions

Conceptualization, P.L., K.R.A., H.A. and R.P.S.; Methodology, P.L., K.R.A., H.A. and R.P.S.; Formal analysis, P.L., K.R.A., H.A. and R.P.S.; Data curation, P.L., K.R.A. and H.A.; Writing—original draft, P.L.; Writing—review & editing, K.R.A., H.A., G.P., S.K.M., D.J.K. and R.P.S.; Supervision, R.P.S. All authors have read and agreed to the published version of the manuscript.

Funding

Open access funding provided by University of Helsinki.

Data Availability Statement

Data available on request.

Acknowledgments

We acknowledge Forest Research and Training Centre, Karnali Province, Surkhet, for providing the required fund to accomplish this study. We would like to thank the Institute of Forestry, Hetauda Campus, Bhuwan Bhandari, Kushal Subedi, and Sajjan Regmi for their assistance during data collection.

Conflicts of Interest

The authors declare no conflict of interest.

References

  1. IPCC Guidelines for National Greenhouse Gas Inventories; Institute for Global Environmental Strategies: Kanagawa, Japan, 2006.
  2. Banskota, K.; Karky, B.S.; Skutsch, M. Reducing Carbon Emissions through Community-Managed Forests in the Himalaya; International Centre for Integrated Mountain Development (ICIMOD): Kathmandu, Nepal, 2007; ISBN 9789291150588. [Google Scholar]
  3. United Nations Framework Convention on Climate Change (UNFCCC) Kyoto Protocol to the Convention on Climate Change; United Nations: Bonn, Germany, 1997.
  4. Acharya, K.P.; Dangi, R.B.; Tripathi, D.M.; Bushley, B.R.; Bhandary, R.R.; Bhattarai, B. Ready for REDD? Taking Stock of Experience, Opportunities and Challenges in Nepal; Nepal Foresters Association: Kathmandu, Nepal, 2009; ISBN 9789937219679. [Google Scholar]
  5. Sah, S.; Sharma, S.; Mandal, R.A. Comparison of Carbon Stock in Chure, Bhawar and Terai, Nepal. Int. J. Sci. Eng. Res. 2019, 10, 80–93. [Google Scholar]
  6. Pandey, H.P.; Bhusal, M. A Comparative Study on Carbon Stock in Sal (Shorea Robusta) Forest in Two Different Ecological Regions of Nepal. Banko Janakari 2016, 26, 24–31. [Google Scholar] [CrossRef]
  7. Bhusal, S.; Bhattarai, A. An Assessment of Carbon Stick Variation in Chure Area of Arghakhanchi District, Nepal. Int. J. Adv. Res. Biol. Sci. 2020, 8, 1–5. [Google Scholar]
  8. Winjum, J.K.; Dixon, R.K.; Schroeder, P.E. Estimating the Global Potential of Forest and Agroforest Management Practices to Sequester Carbon. Water Air Soil Pollut. 1992, 64, 213–227. [Google Scholar] [CrossRef]
  9. Bhatta, S.; Poudel, A.; KC, Y.B. A Comparative Study of Carbon Stocks in the Sal Forest (Shorea Robusta) in Core and Buffer Zones of Shuklaphanta National Park, Nepal. For. J. Inst. For. Nepal 2021, 18, 52–60. [Google Scholar] [CrossRef]
  10. Haris, A.A.; Chhabra, V.; Biswas, S. Carbon Sequestration for Mitigation of Climate Change-a Review. Agric. Rev. 2013, 34, 129–136. [Google Scholar]
  11. Muradian, R.; Arsel, M.; Pellegrini, L.; Adaman, F.; Aguilar, B.; Agarwal, B.; Corbera, E.; Ezzine de Blas, D.; Farley, J.; Froger, G.; et al. Payments for Ecosystem Services and the Fatal Attraction of Win-Win Solutions. Conserv. Lett. 2013, 6, 274–279. [Google Scholar] [CrossRef] [Green Version]
  12. Carlson, K.M.; Curran, L.M. REDD Pilot Project Scenarios: Are Costs and Benefits Altered by Spatial Scale? Environ. Res. Lett. 2009, 4, 31–34. [Google Scholar] [CrossRef]
  13. MFSC. Nepal Biodiversity Strategy and Action Plan (2004–2014); Ministry of Forest and Soil Conservation, Government of Nepal: Kathmandu, Nepal, 2014.
  14. DoFSC Forestry Database of Nepal. Available online: https://www.dofsc.gov.np/ (accessed on 21 August 2021).
  15. Gautam, A.P.; Bhujel, K.B.; Chhetri, R. Political Economy of Forest Tenure Reform Implementation in Nepal: The Case of Protected Forests. J. For. Livelihood 2017, 15, 71–86. [Google Scholar] [CrossRef]
  16. MFSC. Guideline for Inventory of Community Forests; Ministry of Forests and Soil Conservation (MFSC), Department of Forests, Community and Private Forest Division: Kathmandu, Nepal, 2004.
  17. Sharma, E.R.; Pukkala, T. Volume Equations and Biomass Prediction of Forest Trees in Nepal; Ministry of Forests and Soil Conservation; Forest Survey and Statistics Division: Kathmandu, Nepal, 1990.
  18. Khanal, Y.; Sharma, R.; Upadhyaya, C. Soil and Vegetation Carbon Pools in Two Community Forests of Palpa District, Nepal. Banko Janakari 2010, 20, 34–40. [Google Scholar] [CrossRef]
  19. Subedi, B.P.; Pandey, S.S.; Pandey, A.; Rana, E.B.; Bhattarai, S.; Banskota, T.R.; Charmakar, S.; Tamrakar, R. Forest Carbon Stock Measurement: Guidelines for Measuring Carbon Stocks in Community-Managed Forests; ANSAB, FECOFUN, ICIMOD: Kathmandu, Nepal, 2010; ISBN 9789937226127. [Google Scholar]
  20. MPFS. Master Plan for Forestry Sector; Government of Nepal, Ministry of Forests and Soil Conservation: Kathmandu, Nepal, 1989.
  21. FAO. Carbon Sequestration Options Under the Clean Development Mechanism to Address Land Degradation; FAO: Roma, Italy, 2000. [Google Scholar]
  22. MacDicken, K. A Guide to Monitoring Carbon Storage in Forestry and Agro-Forestry Projects; Winrock International: Arlington, TX, USA, 1997. [Google Scholar]
  23. Mclean, E.O. Soil PH and Lime Requirement. Methods of Soil Analysis. In Methods of Soil Analysis. Part 2. Chemical and Microbiological Properties; Page, A.L., Ed.; Soil Science Society of America, American Society of Agronomy: Madison, WI, USA, 1982; Volume 9, pp. 119–224. ISBN 978-0-89118-204-7. [Google Scholar]
  24. Awasthi, K.D.; Singh, B.R.; Sitaula, B.K. Profile Carbon and Nutrient Levels and Management Effect on Soil Quality Indicators in the Mardi Watershed of Nepal. Acta Agric. Scand. Sect. B Soil Plant Sci. 2005, 55, 192–204. [Google Scholar] [CrossRef]
  25. Pearson, T.R.H.; Brown, S.L.; Birdsey, R.A. Measurement Guidelines for the Sequestration of Forest Carbon; US Department of Agriculture, Forest Service, Northern Research Station: Washington, DC, USA, 2007; Volume 18.
  26. Ugland, K.I.; Gray, J.S.; Ellingsen, K.E. The Species-Accumulation Curve and Estimation of Species Richness. J. Anim. Ecol. 2003, 72, 888–897. [Google Scholar] [CrossRef] [Green Version]
  27. Magurran, A. Measuring Biological Diversity; Blackwell Publishing: Oxford, UK, 2004. [Google Scholar]
  28. Simpson, E.H. Measurement of Diversity. Nature 1949, 163, 688. [Google Scholar] [CrossRef]
  29. Shannon, C.E. A Mathematical Theory of Communication. Bell Syst. Tech. J. 1948, 27, 379–423. [Google Scholar] [CrossRef] [Green Version]
  30. Oksanen, J.; Blanchet, F.; Kindt, R.; Legendre, P.; Minchin, P.; O’Hara, R.; Simpson, G.; Solymos, P.; Stevens, M.; Wagner, H. Vegan: Community Ecology Package. R Package Version 2.0-10. 2013. Available online: https://CRAN.R-project.org/package=vegan (accessed on 10 June 2023).
  31. Hothorn, T.; Bretz, F.; Westfall, P. Simultaneous Inference in General Parametric Models. Technical Report Number 019. Biom. J. 2008, 50, 346–363. [Google Scholar] [CrossRef] [PubMed] [Green Version]
  32. Neuwirth, E. RColorBrewer: ColorBrewer Palettes. R Package Version 1.1-2. 2014. Available online: https://CRAN.R-project.org/package=RColorBrewer (accessed on 10 June 2023).
  33. R Core Team R: A Language and Environment for Statistical Computing. R Foundation for Statistical Computing. 2013. Available online: http://www.R-project.org/ (accessed on 22 March 2022).
  34. Gurung, M.B.; Bigsby, H.; Cullen, R.; Manandhar, U. Estimation of Carbon Stock under Different Management Regimes of Tropical Forest in the Terai Arc Landscape, Nepal. For. Ecol. Manag. 2015, 356, 144–152. [Google Scholar] [CrossRef]
  35. Khadka, G.B.; Mandal, R.A.; Mathema, A.B. Comparison Growing Stock, Carbon Stock and Biodiversity in and Around Banke National Park, Nepal. Int. J. Adv. Res. Bot. 2019, 5, 1–9. [Google Scholar] [CrossRef]
  36. Mandal, R.A.; Dutta, I.C.; Jha, P.K.; Karmacharya, S. Relationship between Carbon Stock and Plant Biodiversity in Collaborative Forests in Terai, Nepal. ISRN Botany 2013, 1–7. [Google Scholar] [CrossRef] [Green Version]
  37. Department of Forest Research and Survey (DFRS) State of Nepal’s Forests. Forest Resource Assessment (FRA) Nepal; Department of Forest Research and Survey (DFRS): Kathmandu, Nepal, 2015.
  38. Kurz, W.A.; Dymond, C.C.; White, T.M.; Stinson, G.; Shaw, C.H.; Rampley, G.J.; Smyth, C.; Simpson, B.N.; Neilson, E.T.; Trofymow, J.A.; et al. CBM-CFS3: A Model of Carbon-Dynamics in Forestry and Land-Use Change Implementing IPCC Standards. Ecol. Model. 2009, 220, 480–504. [Google Scholar] [CrossRef]
  39. Nautiyal, N.; Singh, V. Carbon Stock Potential of Oak and Pine Forests in Garhwal. J. Pharmacogn. Phytochem. 2013, 2, 43–48. [Google Scholar]
  40. Joshi, R.; Singh, H.; Chhetri, R.; Poudel, S.R.; Rijal, S. Carbon sequestration potential of community forests: A comparative analysis of soil organic carbon stock in community managed forests of Far-Western Nepal. Eurasian J. Soil Sci. 2021, 10, 96–104. [Google Scholar] [CrossRef]
  41. Cambi, M.; Certini, G.; Neri, F.; Marchi, E. The Impact of Heavy Traffic on Forest Soils: A Review. For. Ecol. Manag. 2015, 338, 124–138. [Google Scholar] [CrossRef]
  42. Trujillo, W.; Amezquita, E.; Fisher, M.J.; Lal, R. Soil Organic Carbon Dynamics and Land Use in the Colombian Savannas I. Aggregate Size Distribution; Soil Proce; CRC Press: Boca Raton, FL, USA, 2018; ISBN 9781351415767. [Google Scholar]
  43. Börjesson, G.; Bolinder, M.A.; Kirchmann, H.; Kätterer, T. Organic Carbon Stocks in Topsoil and Subsoil in Long-Term Ley and Cereal Monoculture Rotations. Biol. Fertil. Soils 2018, 54, 549–558. [Google Scholar] [CrossRef] [Green Version]
  44. Acharya, K.P. Conserving Biodiversity and Improving Livelihoods: The Case of Community Forestry in Nepal. In Proceedings of the The International Conference on Rural Livelihoods, Forests and Biodiversit, Bonn, Germany, 9–23 May 2003; pp. 19–23. [Google Scholar]
  45. Baral, S.K.; Katzensteiner, K. Disturbance Gradient in a Central Mid-Hill Community Forest of Nepal. Group 2009, 19, 3–10. [Google Scholar]
  46. Roberts, M.R. Response of the Herbaceous Layer to Natural Disturbance in North American Forests. Can. J. Bot. 2004, 82, 1273–1283. [Google Scholar] [CrossRef]
  47. Smith, G.F.; Gittings, T.; Wilson, M.; French, L.; Oxbrough, A.; O’Donoghue, S.; O’Halloran, J.; Kelly, D.L.; Mitchell, F.J.G.; Kelly, T.; et al. Identifying Practical Indicators of Biodiversity for Stand-Level Management of Plantation Forests. Biodivers. Conserv. 2008, 17, 991–1015. [Google Scholar] [CrossRef]
  48. Jackson, J.K.; Stapleton, C.; Jeanrenaud, J.-P. Manual of Afforestation in Nepal; Nepal-United Kingdom Forestry Research Project, Department of Forest: Kathmandu, Nepal, 1994.
  49. Charmakar, S.; Oli, B.N.; Joshi, N.R.; Maraseni, T.N.; Atreya, K. Forest Carbon Storage and Species Richness in FSC Certified and Non-Certified Community Forests in Nepal. Small-Scale For. 2021, 20, 199–219. [Google Scholar] [CrossRef]
  50. Lindenmayer, D.; Nisbet, K.; Stone, M.; Seibold, S. Decaying Forest Wood Releases a Whopping 10.9 Billion Tonnes of Carbon Each Year. This Will Increase under Climate Change. Conversat. Biol. Divers. 2022, 8, 8–11. [Google Scholar]
  51. Antal, T.; Erika, S.; Arezoo, M.H. Wet Air Oxidation of Aqueous Wastes. In Wastewater Treatment Engineering; Mohamed, S., Ed.; IntechOpen: Rijeka, Croatia, 2015; Chapter 6. [Google Scholar]
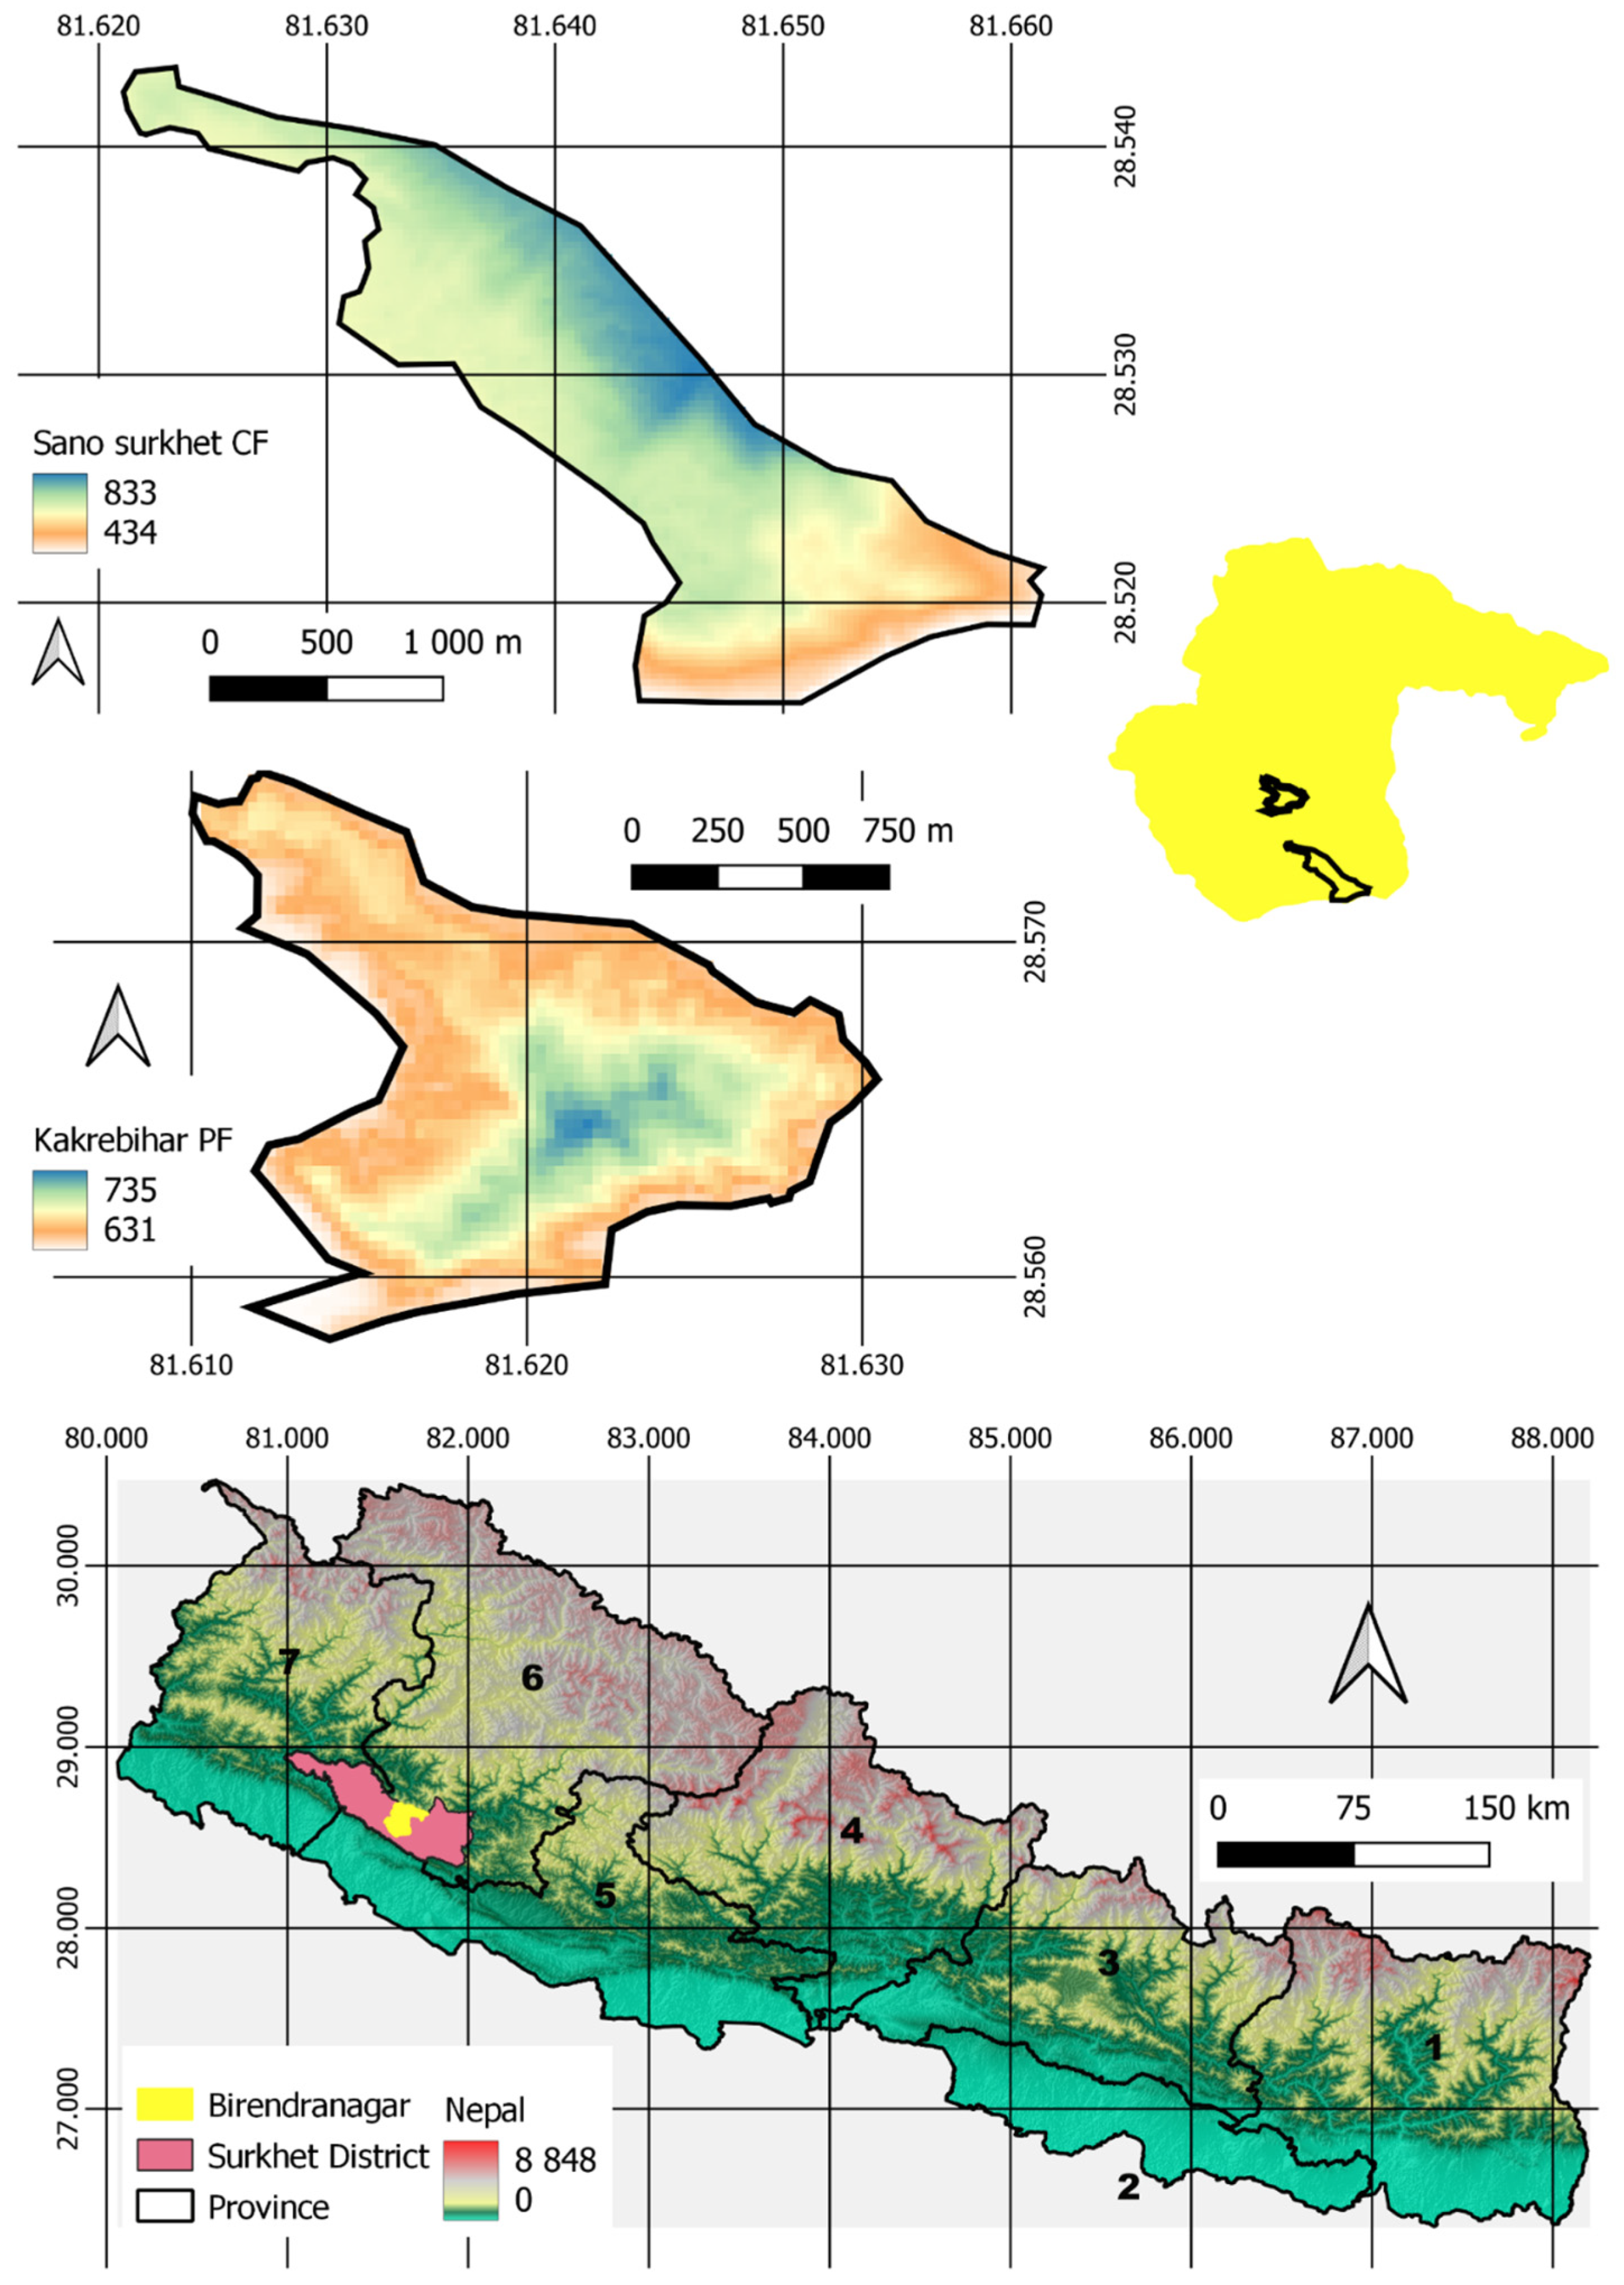
Figure 1. Location map of the study area. The bottom panel is the location of the study area within Nepal. The central panel is the elevation gradient of Kakrabihar protection forest, and the top panel is the elevation gradient of Sano Surkhet community forest within Birendranagar municipality.
Land 12 01233 g001
Figure 2. Allocation of sample plots across (a) the Kakrebihar PF and (b) Sano Surkhet CF, each number representing the sample plot number.
Land 12 01233 g002
Figure 3. Plot-level biomass carbon (a), soil carbon (b), and total carbon (c) in two management approaches (CF—community forest, PF—protection forest, n = 33 plots and 30 plots in PF). Error bar indicates mean ± SD. Letters indicate significant differences between management approaches (independent t-test results, p < 0.05).
Land 12 01233 g003
Figure 4. Contribution of various carbon pools in total carbon stock in community forest (CF) and protection forest (PF). AGC, BGC, LHC, and SC indicate above-ground carbon, below-ground biomass carbon, leaflitter and herb biomass carbon, and soil carbon, respectively.
Land 12 01233 g004
Figure 5. Soil carbon stock variation within soil depth (D1—soil depth 0–10cm, D2—soil depth 10–20cm, and D3—soil depth 20–30cm) and management approaches (CF—community forest, PF—protection forest, n = 33 and 30 for CF and PF, respectively). Error bars indicate mean ± SD. Letters indicate significant differences between soil depth and between management approaches (two-way—ANOVA results/Tukey’s all pairwise comparisons of means, p < 0.05).
Land 12 01233 g005
Figure 6. Plot-level biomass carbon pools (AGC—above-ground biomass carbon, BGC—below-ground biomass carbon, LHC—leaflitter herb and grass biomass carbon) in two management approaches (CF—community forest, PF—protection forest, n = 33 and 30 for CF and PF, respectively). Error bar indicates mean ± SD. Letters indicate significant differences between the carbon pool and between management approaches (two-way—ANOVA results/Tukey’s all pairwise comparisons of means, p < 0.05).
Land 12 01233 g006
Figure 7. Species-accumulation curves for plant species in the two observed management approaches. Mean values (lines) from 100 permutations of 30 plots and 33 plots for protection forest (PF) and community forest (CF), respectively, are shown.
Land 12 01233 g007
Figure 8. Plot-level species richness (a), abundance (b), Simpson index (c), and Shannon diversity (d) in two management approaches (CF—community forest, PF—protection forest, n = 33 plots and 30 plots in CF and PF, respectively). The error bar indicates mean ± SD. Letters indicate significant differences between management approaches (independent t-test results, p < 0.05).
Land 12 01233 g008
Table 1. Average carbon stock under management approaches (CF—community forest and PF—protection forest).
Management ApproachMean Carbon Stock (ton ha−1)Standard DeviationMinMax
CF61.0016.8238.0498.32
PF71.8517.2225.65121.60
Table 2. Species diversity indices in community forest (CF) and protection forest (PF) (n = 33 for CF and n = 30 for PF).
Management ApproachesDiversity Indices
Richness (S)Number of IndividualsSimpson Index (1-D)Shannon Diversity (H′)
CF92300.611.3
PF102790.591.24
Disclaimer/Publisher’s Note: The statements, opinions and data contained in all publications are solely those of the individual author(s) and contributor(s) and not of MDPI and/or the editor(s). MDPI and/or the editor(s) disclaim responsibility for any injury to people or property resulting from any ideas, methods, instructions or products referred to in the content.