Article

A Geospatial Modelling Approach to Assess the Capability of High-Country Stations in Delivering Ecosystem Services

by
Fabiellen C. Pereira
1,2,*,
Stuart Charters
2,3,
Carol M. S. Smith
2,4,
Thomas M. R. Maxwell
1,2 and
Pablo Gregorini
1,2
1
Department of Agricultural Science, Faculty of Agriculture and Life Sciences, Lincoln University, Lincoln 7674, New Zealand
2
Centre of Excellence Designing Future Productive Landscapes, Lincoln University, Lincoln 7674, New Zealand
3
School of Landscape Architecture, Faculty of Environment, Society and Design, Lincoln University, Lincoln 7674, New Zealand
4
Department of Soil & Physical Sciences, Faculty of Agriculture and Life Sciences, Lincoln University, Lincoln 7674, New Zealand
*
Author to whom correspondence should be addressed.
Land 2023, 12(6), 1243; https://doi.org/10.3390/land12061243
Submission received: 6 May 2023 / Revised: 14 June 2023 / Accepted: 14 June 2023 / Published: 17 June 2023

Abstract

:
The creation of more sustainable land use strategies is paramount to designing multifunctional agricultural landscapes that allow grasslands to continually deliver multiple ecosystem services. A mapping modelling approach would provide us with a tool for system diagnosis to better assess the value of a landscape and define place-based practices for designing more context-adjusted systems that are in synergy with the complexity of grasslands. To assess the potential capability of a high-country pastoral livestock production system in New Zealand in delivering ecosystem services, this work uses a geospatial model as a decision support tool to identify management practices that enhance grassland health. The model uses national, climatic, soil, and landcover data to assess the agricultural productivity, flood mitigation, C sequestration, erosion, and sediment delivery capacity of a case study high-country station in New Zealand. Model outcomes suggest that the station has the potential for increased agricultural productivity although varying spatially, a high flood mitigation capacity, a high capacity for C sequestration, a moderate risk of erosion, a capacity to reduce sediment delivery to streams, and overall, a low to moderate nitrogen and phosphorus accumulation. Output maps display a spatial visualisation of ecosystem services associated with the landscape topography, soil, and vegetation patterns that allow the identification of neglected areas and planning of best place-based management practices strategies to enhance the health of grasslands.

1. Introduction

Human life and well-being benefit from ecosystem services provided by natural grasslands, including water and air supply, climate regulation, primary production, nutrient cycling, biodiversity, pharmaceuticals, and aesthetic/cultural values [1,2,3]. While the establishment of farming systems in managed grasslands also contributes to the delivery of those ecosystem services, the ecological degradation of grasslands across the globe that can occur due to farming (e.g., biodiversity loss, climate change, eutrophication, soil erosion, and water pollution) is still an issue and an emerging growing concern of the whole society [4,5,6]. The delivery of ecosystem services from managed grasslands depends on the interaction of its key biotic (soil, plants, animals) and local abiotic factors [7], and the structure, function, and management practices designed for the agricultural systems established in those environments [8,9]. As an example, the establishment of a multispecies pasture rotation system as an alternative to a conventional grain-based finishing beef system in the United States, increased C sequestration from the farm, in addition to bringing other ecological benefits for soil health, resilience, and biodiversity [10]. On the other hand, the production of corn silage required more fertiliser and resulted in higher emissions than the production of alfalfa hay [11].
Agricultural systems can induce trade-offs, when the increased provision of one ecosystem service entails the reduction of others, or synergies among ecosystem services, when mutual advantage is observed between two or more services, thus affecting positively or negatively the ability of grasslands to provide ecosystem services [8,12]. For instance, in the work performed by Rallings et al. (2019) [13], the use of remote sensing and geographical information systems to model conservation options for agricultural expansion showed that the increase of non-production perennial vegetation areas resulted in a loss of agricultural land. In the same study, conserving or planting hedgerows along the farm was positive for indicators metrics that reflect habitat quality. To enable managed grasslands to continually deliver multiple ecosystem services, agricultural landscapes need to be multifunctional [14], with more sustainable land use strategies and more appropriate grazing management [15,16].
The creation of sustainable and multifunctional agricultural landscapes requires an understanding of grassland complexity and spatiotemporal variability [17], that results from the interaction between its components—soil, plant, and animals—placed in diverse environments/contexts around the world [18]. Such complexity is reflected in highly spatially heterogeneous landscapes even at small scales, implying variability in ecosystems services provision, as observed by Xue et al. (2018) [19] that microclimate differences in soil explained higher primary productivity in a shady slope compared to sunny slope in an alpine meadow environment on the Qinghai-Tibetan Plateau. Therefore, determining the landscape configuration through detailed spatial information is essential to assess the landscape capability to support farming systems to identify synergies and trade-offs between ecosystem services and define place-based practices for designing more context-adjusted systems that will work within grasslands [20,21].

Related Work

Many ecosystem services modelling and spatial analysis approaches are available for the spatiotemporal mapping of ecosystem services as tools for decision support processes [22]. Such approaches enable the evaluation of spatial configurations of the landscape at different scales and the quantification of the effects of a heterogeneous landscape structure on the provision of ecosystem services for the development and planning of better and more sustainable management practices as reviewed by Malinga et al. (2015) [23]. For instance, Tran et al. (2022) [21] observed that the supply of ecosystem services was significantly affected by the variable landscape pattern in terms of topography and land cover, by using a Multiscale Geographically Weighted Regression (MGWR) to relate landscape structure indicators and ecosystem services provisioning. As a model is a simplification of reality [24], a modelling exercise would allow us to estimate the potential capability of land in delivering ecosystem services under different topographic and climatic conditions and at different scales quickly and inexpensively. Taking a mapping modelling approach would therefore provide us with a system diagnosis, within the model boundaries, to assess the spatial landscape configuration of a farm to facilitate the identification and planning of best management practices to support the best use of land for creating multifunctional agricultural landscapes that deliver multi ecosystem services.
The Land Utilisation and Capability Indicator (LUCI) [25], and the next-generation update known as Nature Braid [26] is a geospatial framework that holistically explores the ability of a landscape in providing multiple ecosystem services and highlights areas of opportunity for management interventions to mitigate issues or improve services [27]. By using climatic, soil, and landcover national data, LUCI assesses ecosystem service stocks and associated indicators and processes of flood risk, erosion, sediment delivery, N and P load, carbon sequestration/emission, and agricultural productivity, while still analysing interrelationships and identifying trade-offs and synergies among them [27,28]. As a modelling framework intended to support decision-making and discussion, LUCI allows for the identification of areas where land uses interventions or changes would benefit the delivery of single ecosystem services, or potential “win-win” situations/synergies [22].
This work focuses on a high-country station sheep and beef farm in New Zealand as a case study. High-country stations are topographically heterogeneous landscapes covered mainly by indigenous and naturalized vegetation of poor pastoral quality and feeding value reflecting low soil fertility [29,30]. Due to terrain steepness, high-country stations are naturally prone to erosion [31]. Farming activity in those landscapes is usually extensive sheep and beef at continuous systems and low stocking densities [30,32]. Many studies on landscape planning based on ecosystem services have been conducted around the world [23,33,34], but comprehensive spatial mapping of ecosystem services in high-county stations in New Zealand is still scarce. Furthermore, although the complexity of heterogeneous landscapes such as high-country stations is acknowledged, grazing systems established on those landscapes are still based on simplistic and generalist approaches that focus on single goals and do not account for such complexity [35]. A geospatial approach to the capacity of high-country stations in delivering ecosystem services could help illustrate the need for a paradigm change of using reductionist approaches on complex systems such as high-country grasslands and designing context-adjusted grazing systems for creating multifunctional landscapes.
Therefore, in this work, we used the LUCI model to assess the current capability of a high-country pastoral livestock production system in New Zealand, selected as a case study, in delivering ecosystem services.

2. Materials and Methods

2.1. Case Study Application
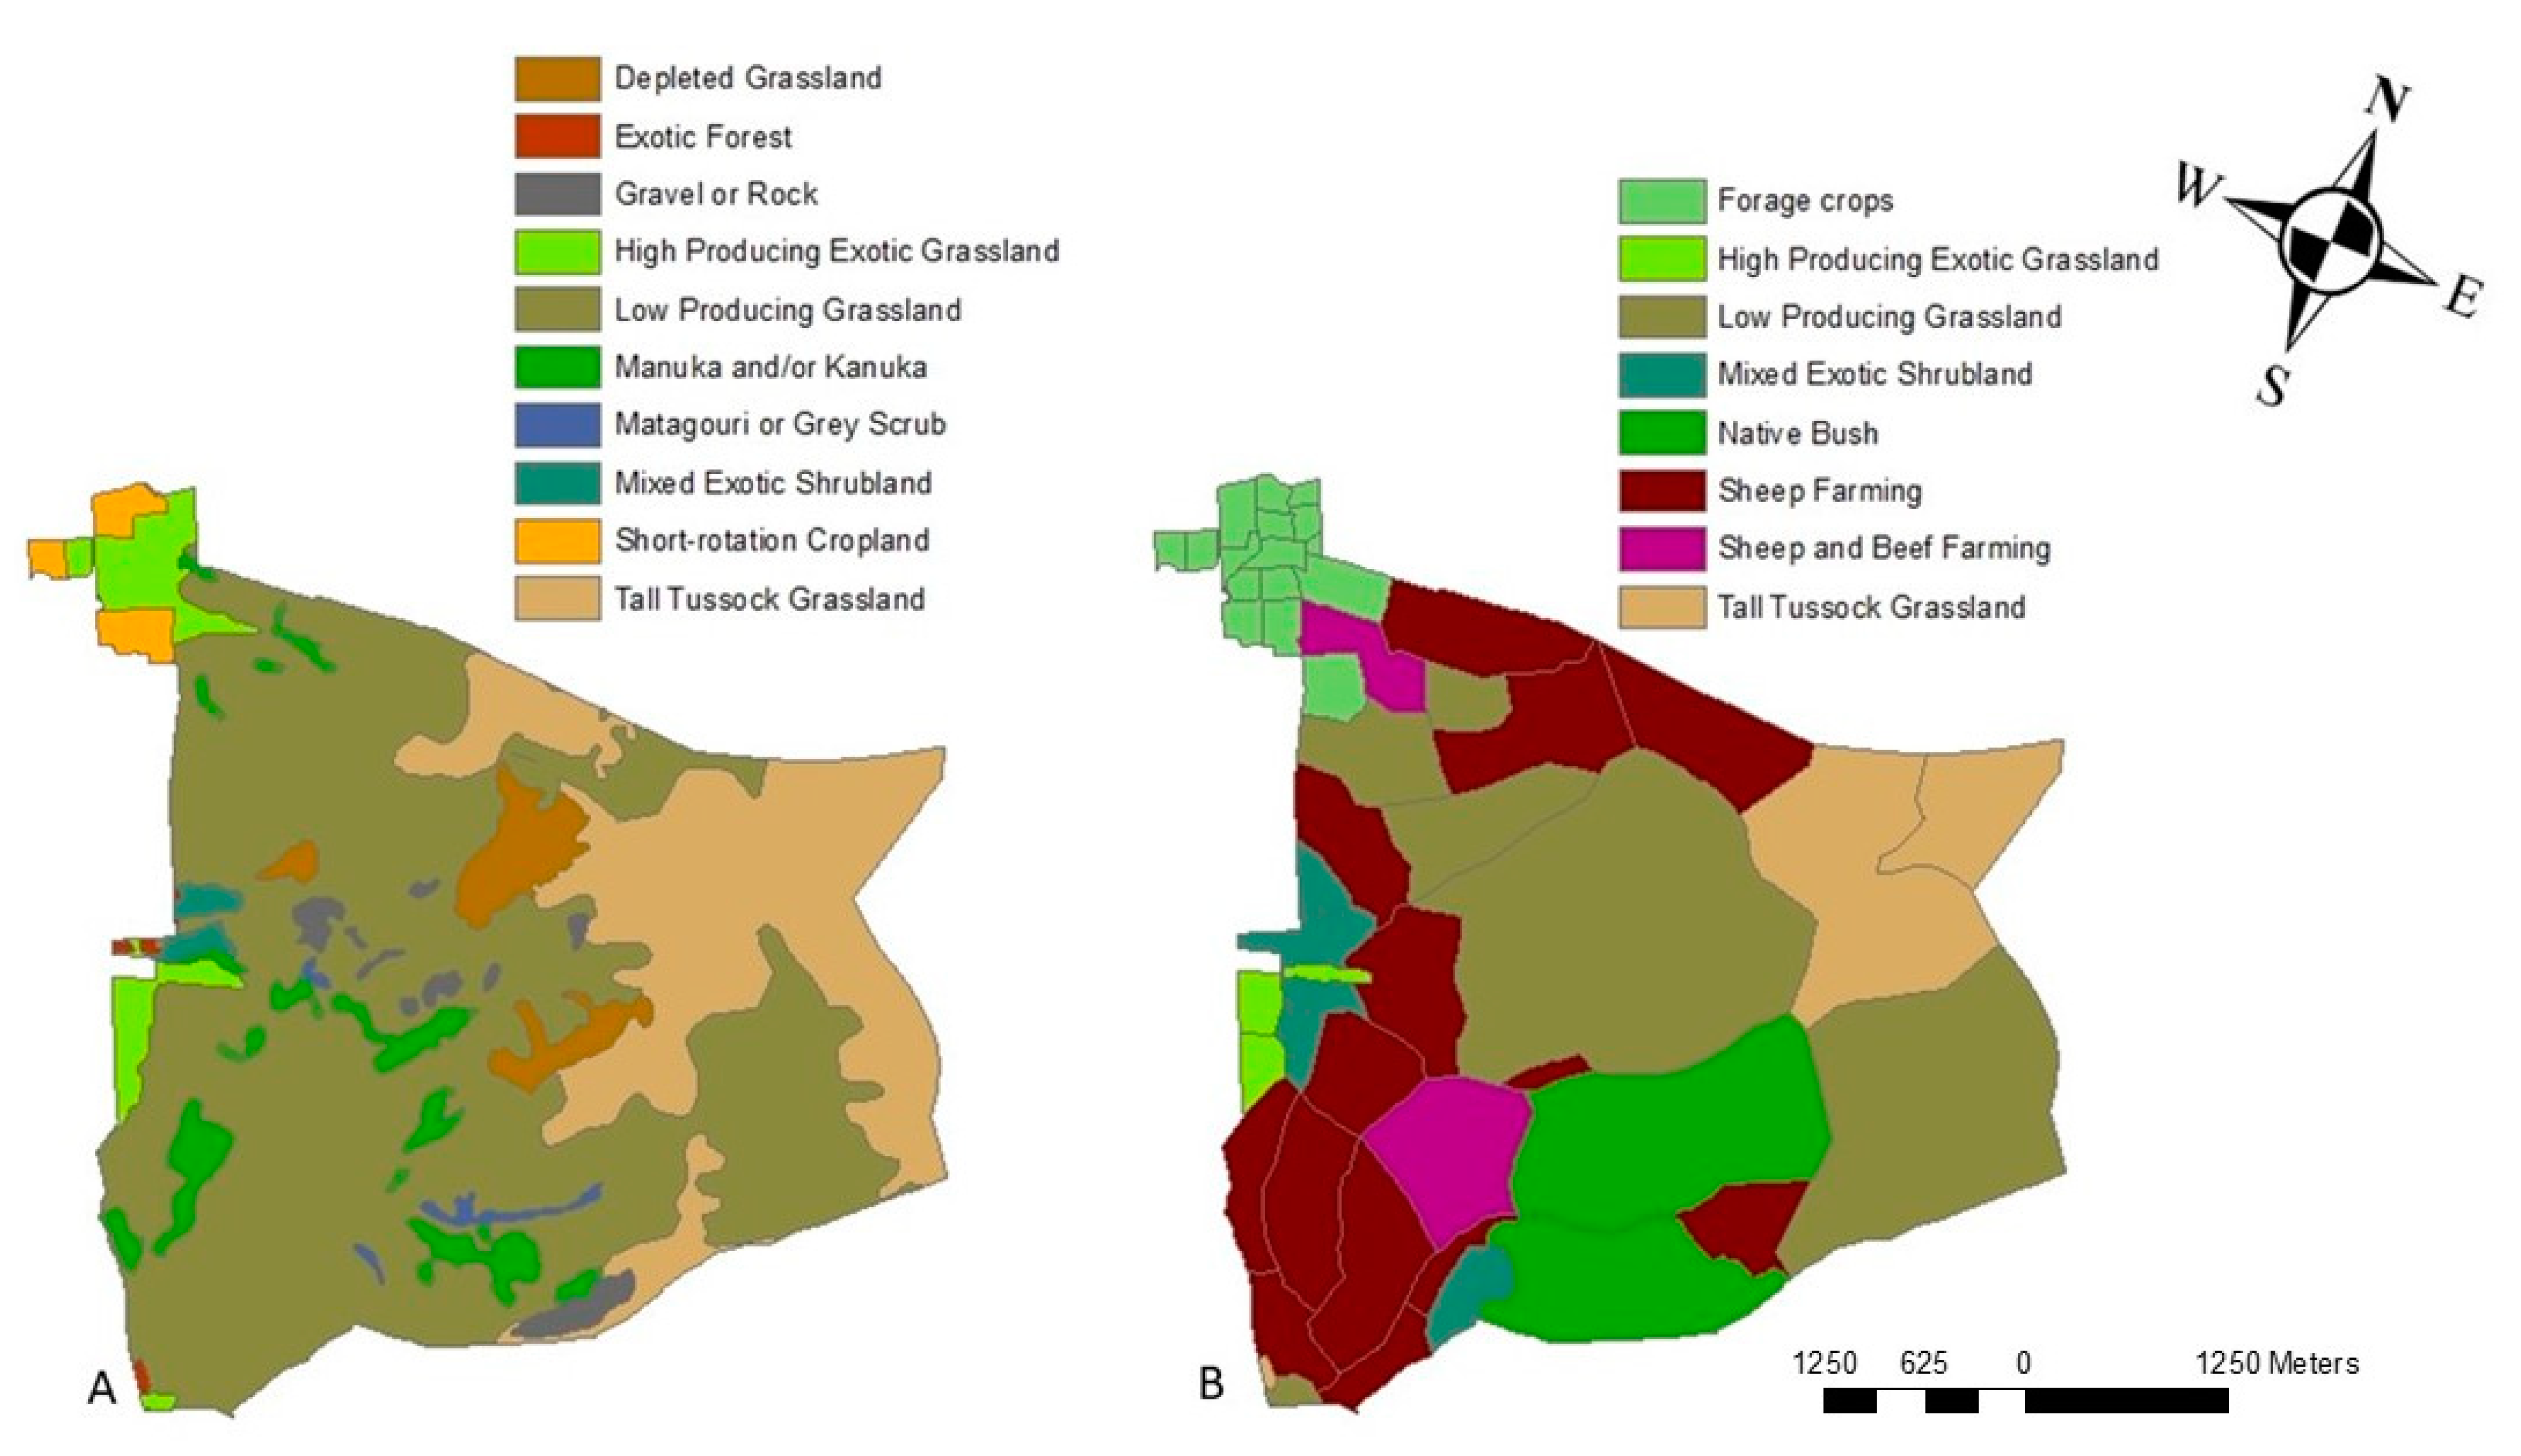
Lincoln University Mount Grand Station (LUMGS) is the case study for this work. The station is a high-country farm located close to Lake Hawea in Central Otago on the South Island (lat. 44°38′01.93″ S; long. 169°19′42.89″ E) of New Zealand (NZ) (see Figure 1). The annual rainfall average is 703 mm, and the annual mean temperature is 10.6 °C (17.25 °C in summer and 2.25 °C in winter [29,36]). The farm encompasses 2131 ha of which 1602 ha are used as a pastoral system, while the remainder is a conservation area. Most of the area is hill country with steep slopes reaching up to 65° over an elevation range of 350 m to 1400 m above sea level.

2.2. LUCI Inputs

The minimum datasets required by the LUCI model are a digital elevation model (DEM) and soil and land cover data [28]. The 8 m resolution DEM was taken from Land Information New Zealand data [37]. New Zealand Land Cover Database (LCDB) classes at version 5 were used as land cover data [38] (Figure 2A) and the New Zealand Fundamental Soil layer derived by New Zealand Land Resource Inventory (NZLRI) and National Soil Database (NSD) was used as the source of information for attributes related to soil [39].
A second approach was used for parameterising land cover information for LUCI and included sheep and beef farming as land use. This was based on a user-defined parameterisation specific to each paddock of LUMGS, in which land cover was assigned according to information collected from the farm (Figure 2B) and to a new vegetation classification map of LUMGS created by the researchers from the Centre of Excellence in Designing Future Productive Landscapes at Lincoln University. The new vegetation classification map was carried out based on advanced image classification methods (machine learning and object-based classification) at ArcGIS/ArcMap 10.7.1® software to refine the national vegetation database. As this parameterisation was conducted at a paddock level and only one activity could be assigned, we had to prioritise the most predominant activity in each paddock (e.g., paddocks used for farming most of the year, but the vegetation cover is classified as “low-producing grassland” were assigned as “sheep farming”, “beef farming”, or “sheep or beef farming”).

2.3. LUCI Ecosystem Services Tools and Sub-Models

This section will briefly describe each LUCI tool/sub-model used in this study. More details are provided by Jackson et al. (2013) [27], Jackson et al. (2016) [40], Dang et al. (2021) [41], and Tomscha et al. (2021) [42].

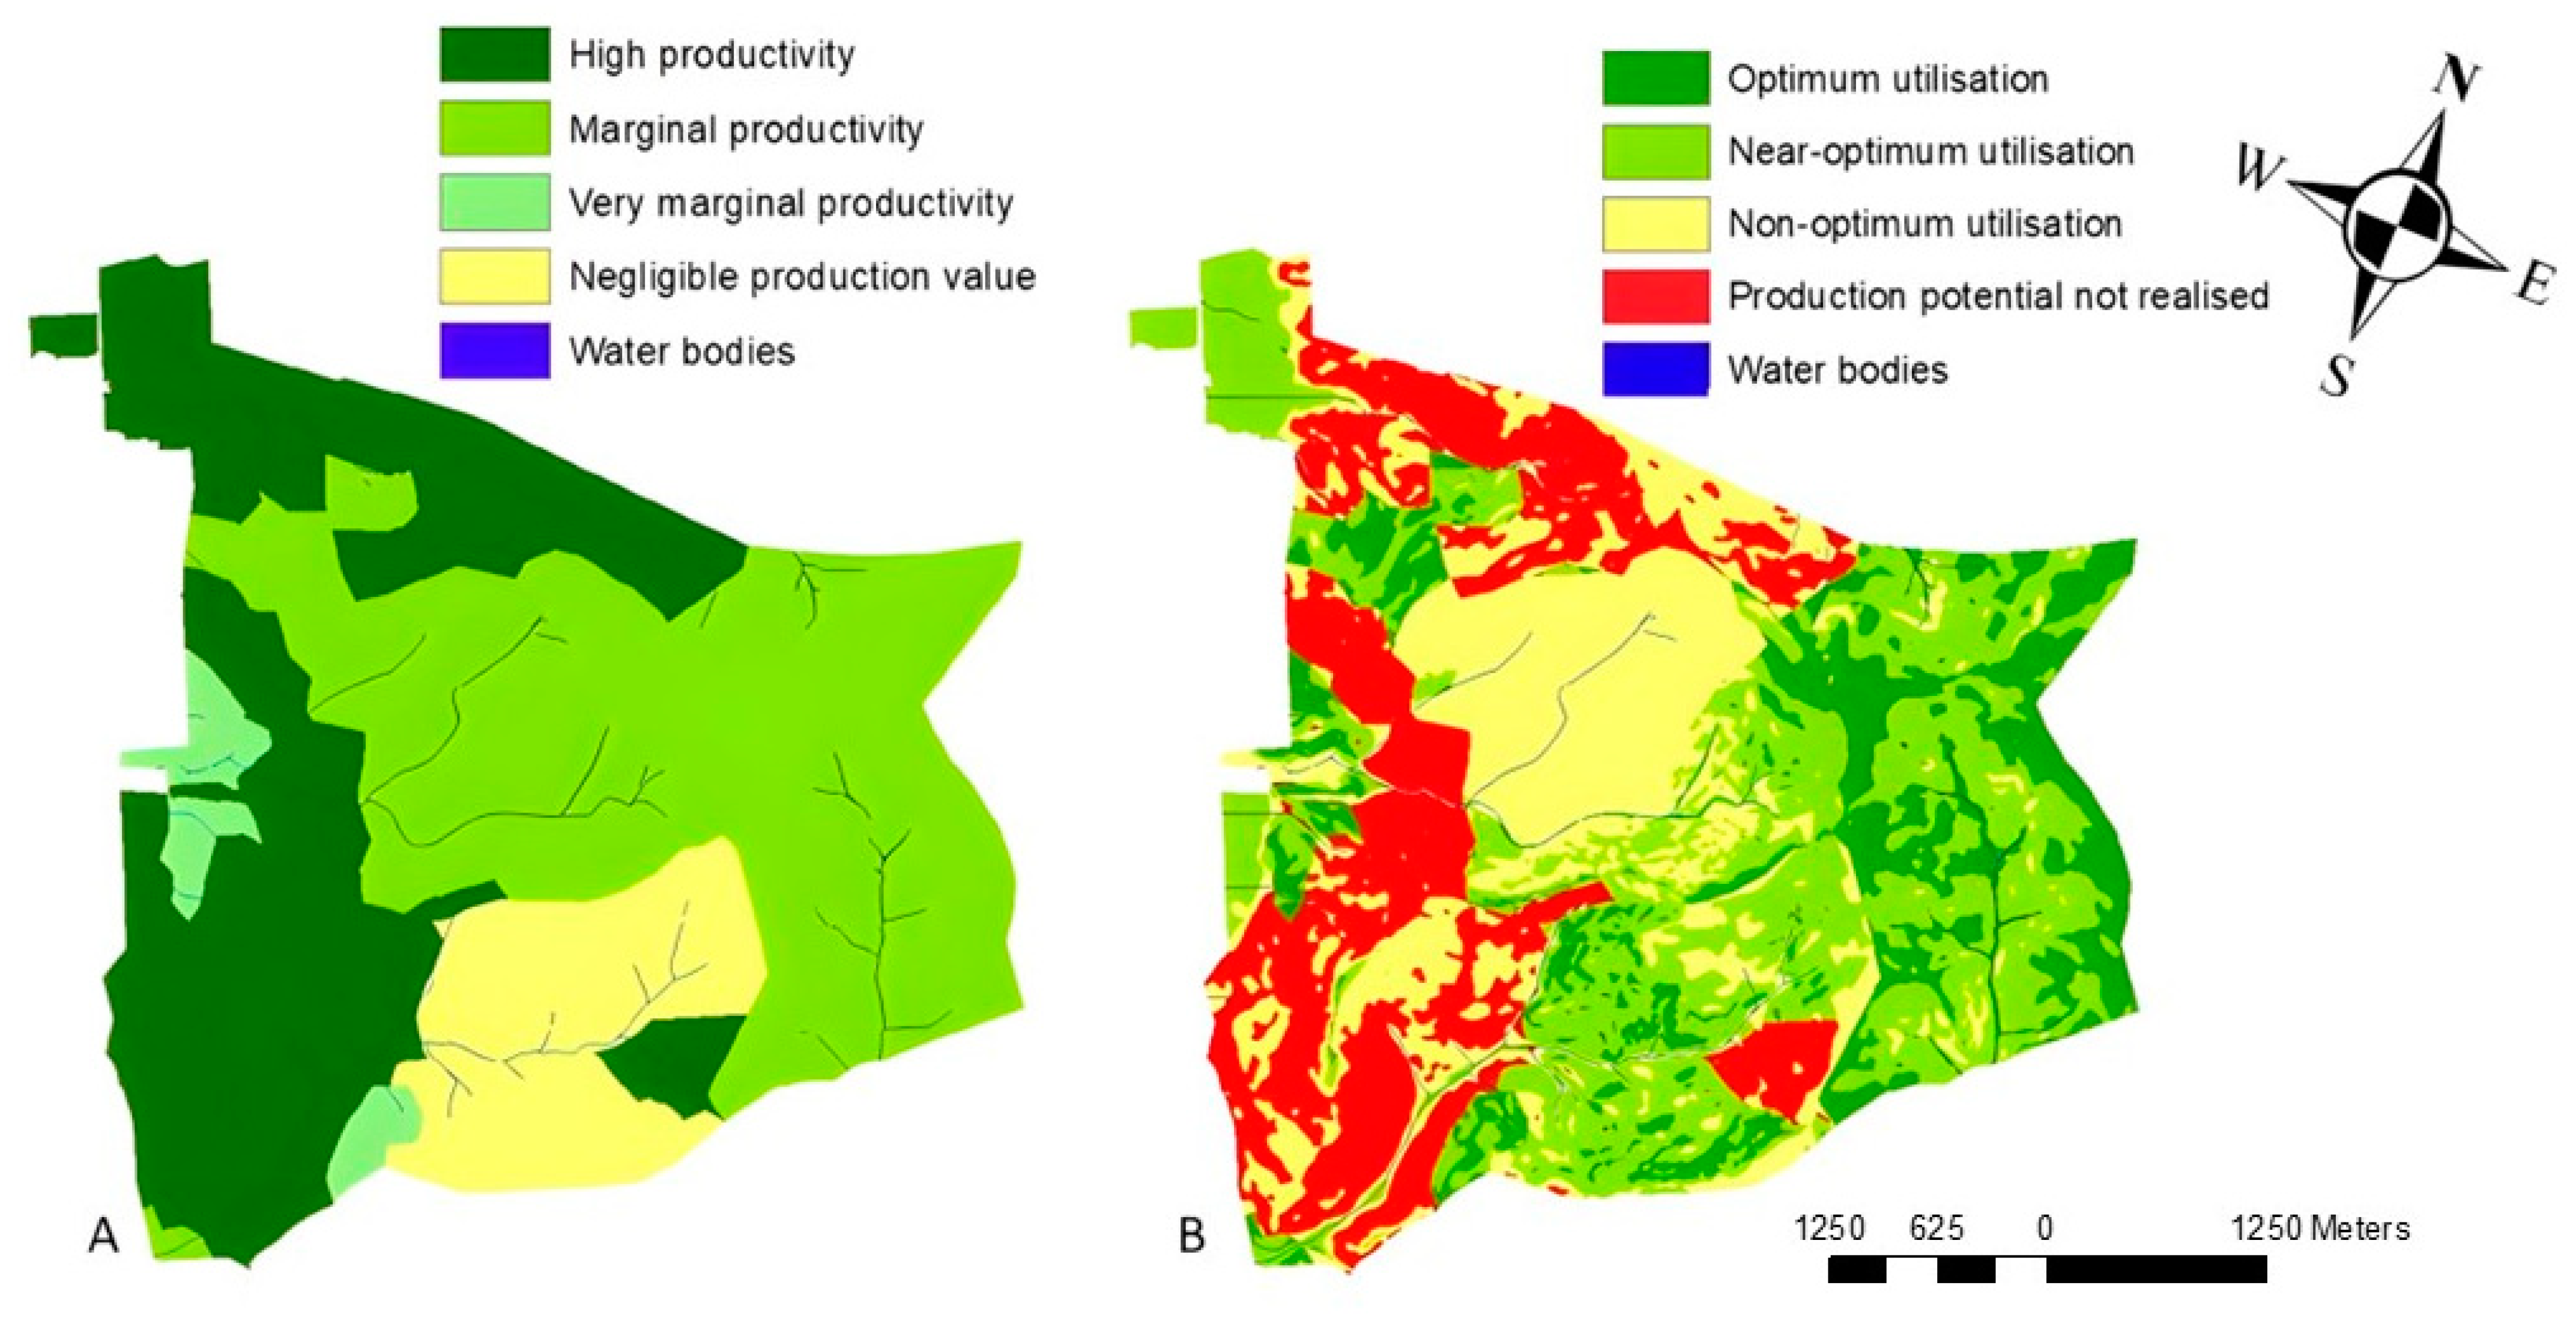
2.3.1. Agricultural Productivity

The land is categorised by its productivity value (from very high to no value) in the model to identify over and/or under-utilised areas and suggest land use changes, based on slope, elevation, aspect, soil hydraulic properties, soil fertility, and climatic variables [27,43]. Steep areas, low-fertility soils, and areas prone to waterlogging are considered less productive, while well-drained, flat, and high-fertility soil areas are considered productive [42]. For slope threshold values, we have defined 15° for very productive land and 30° for somewhat productive land, areas steeper than 30° land are considered marginal. We also defined 900 m as the elevation threshold for improved agricultural land. Those values were based on a previous classification defined along with three workshops covering 15 researchers/experts on soil, vegetation/biodiversity, production systems, and existing systems working on a design project to assess grassland health using LUMGS as a case study [44].

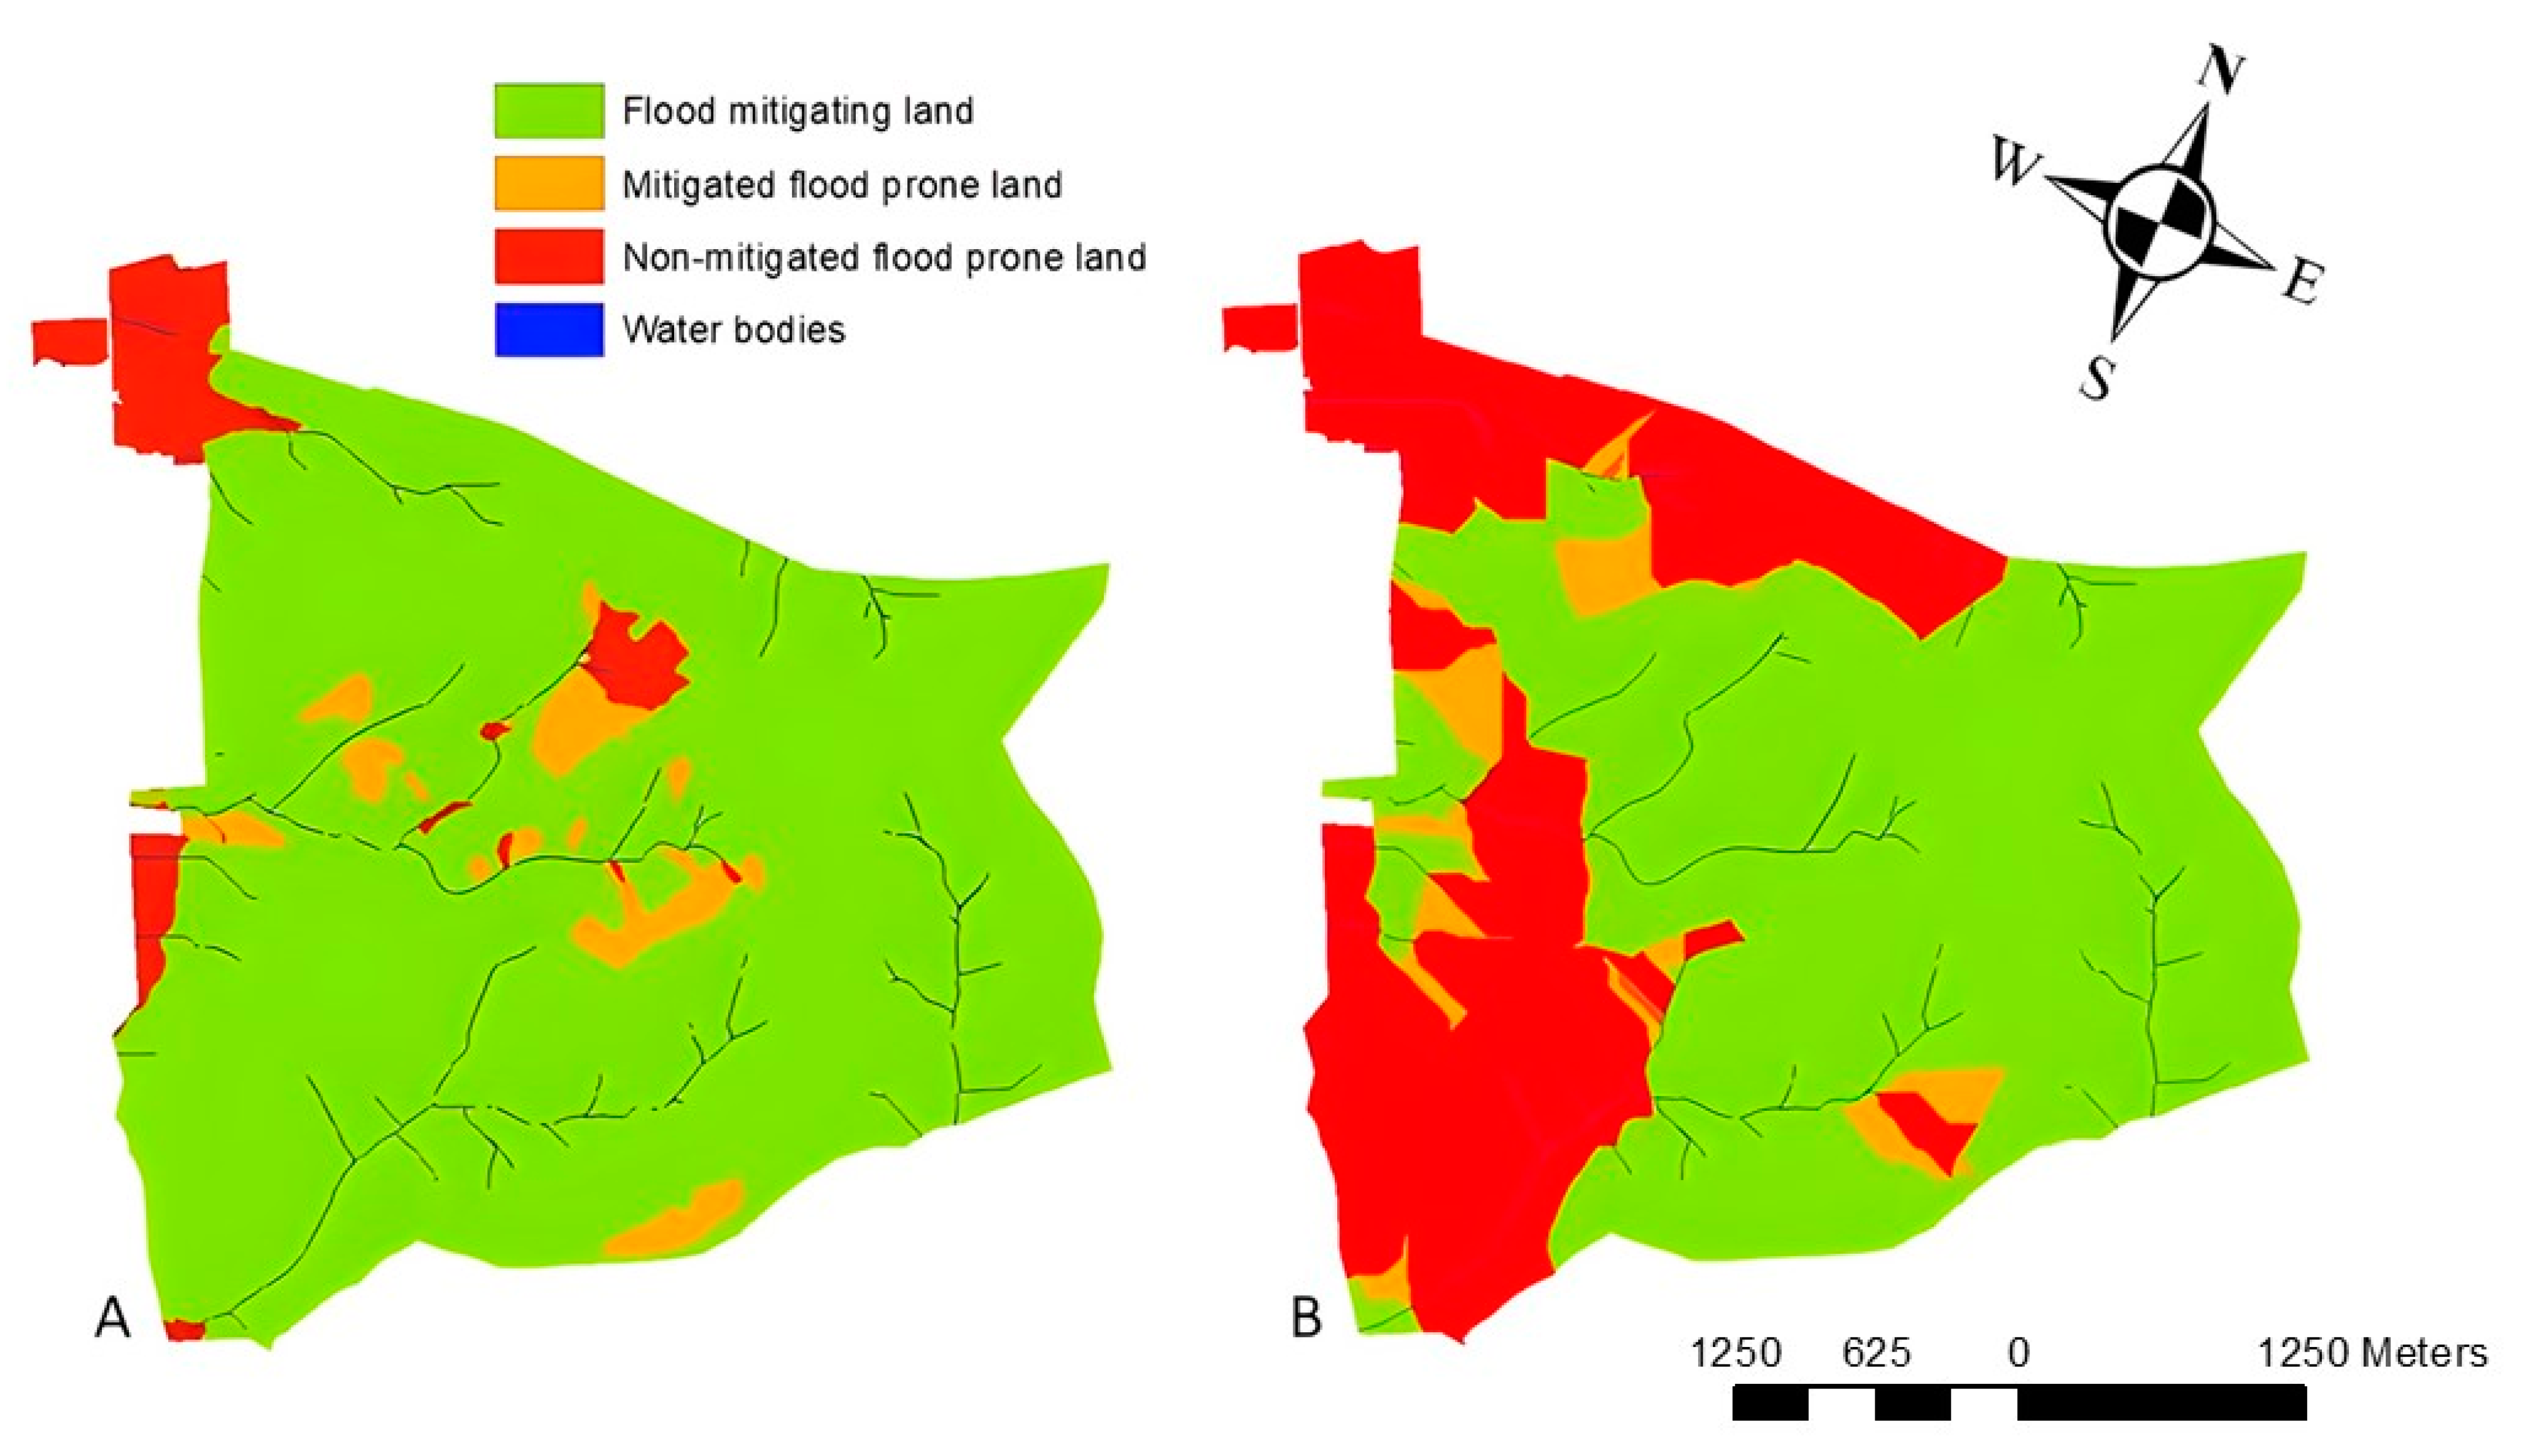
2.3.2. Flood Mitigation

By using information about water storage and infiltration capacities of land cover and soil, and how topography affects the movement of water flows through the landscape, the tool identifies areas within the landscape where the risk for flood is low or areas that should be prioritized for change due to a large number of unmitigated flow routes to waterways. A hydrologically consistent DEM is required for this sub-model and is generated during the pre-processing/initial stages of the model run.

2.3.3. Carbon Sequestration

The carbon sequestration tool identifies areas that have the potential to store C, suggesting areas that should be protected or positively modified for additional C storage, and estimates the rate of emissions or sequestration of C in megagrams per hectare per year. The calculations separate C into above-ground living biomass, below-ground living biomass, deadwood, litter, and soil carbon, based on the IPCC tier 1 protocols [45].

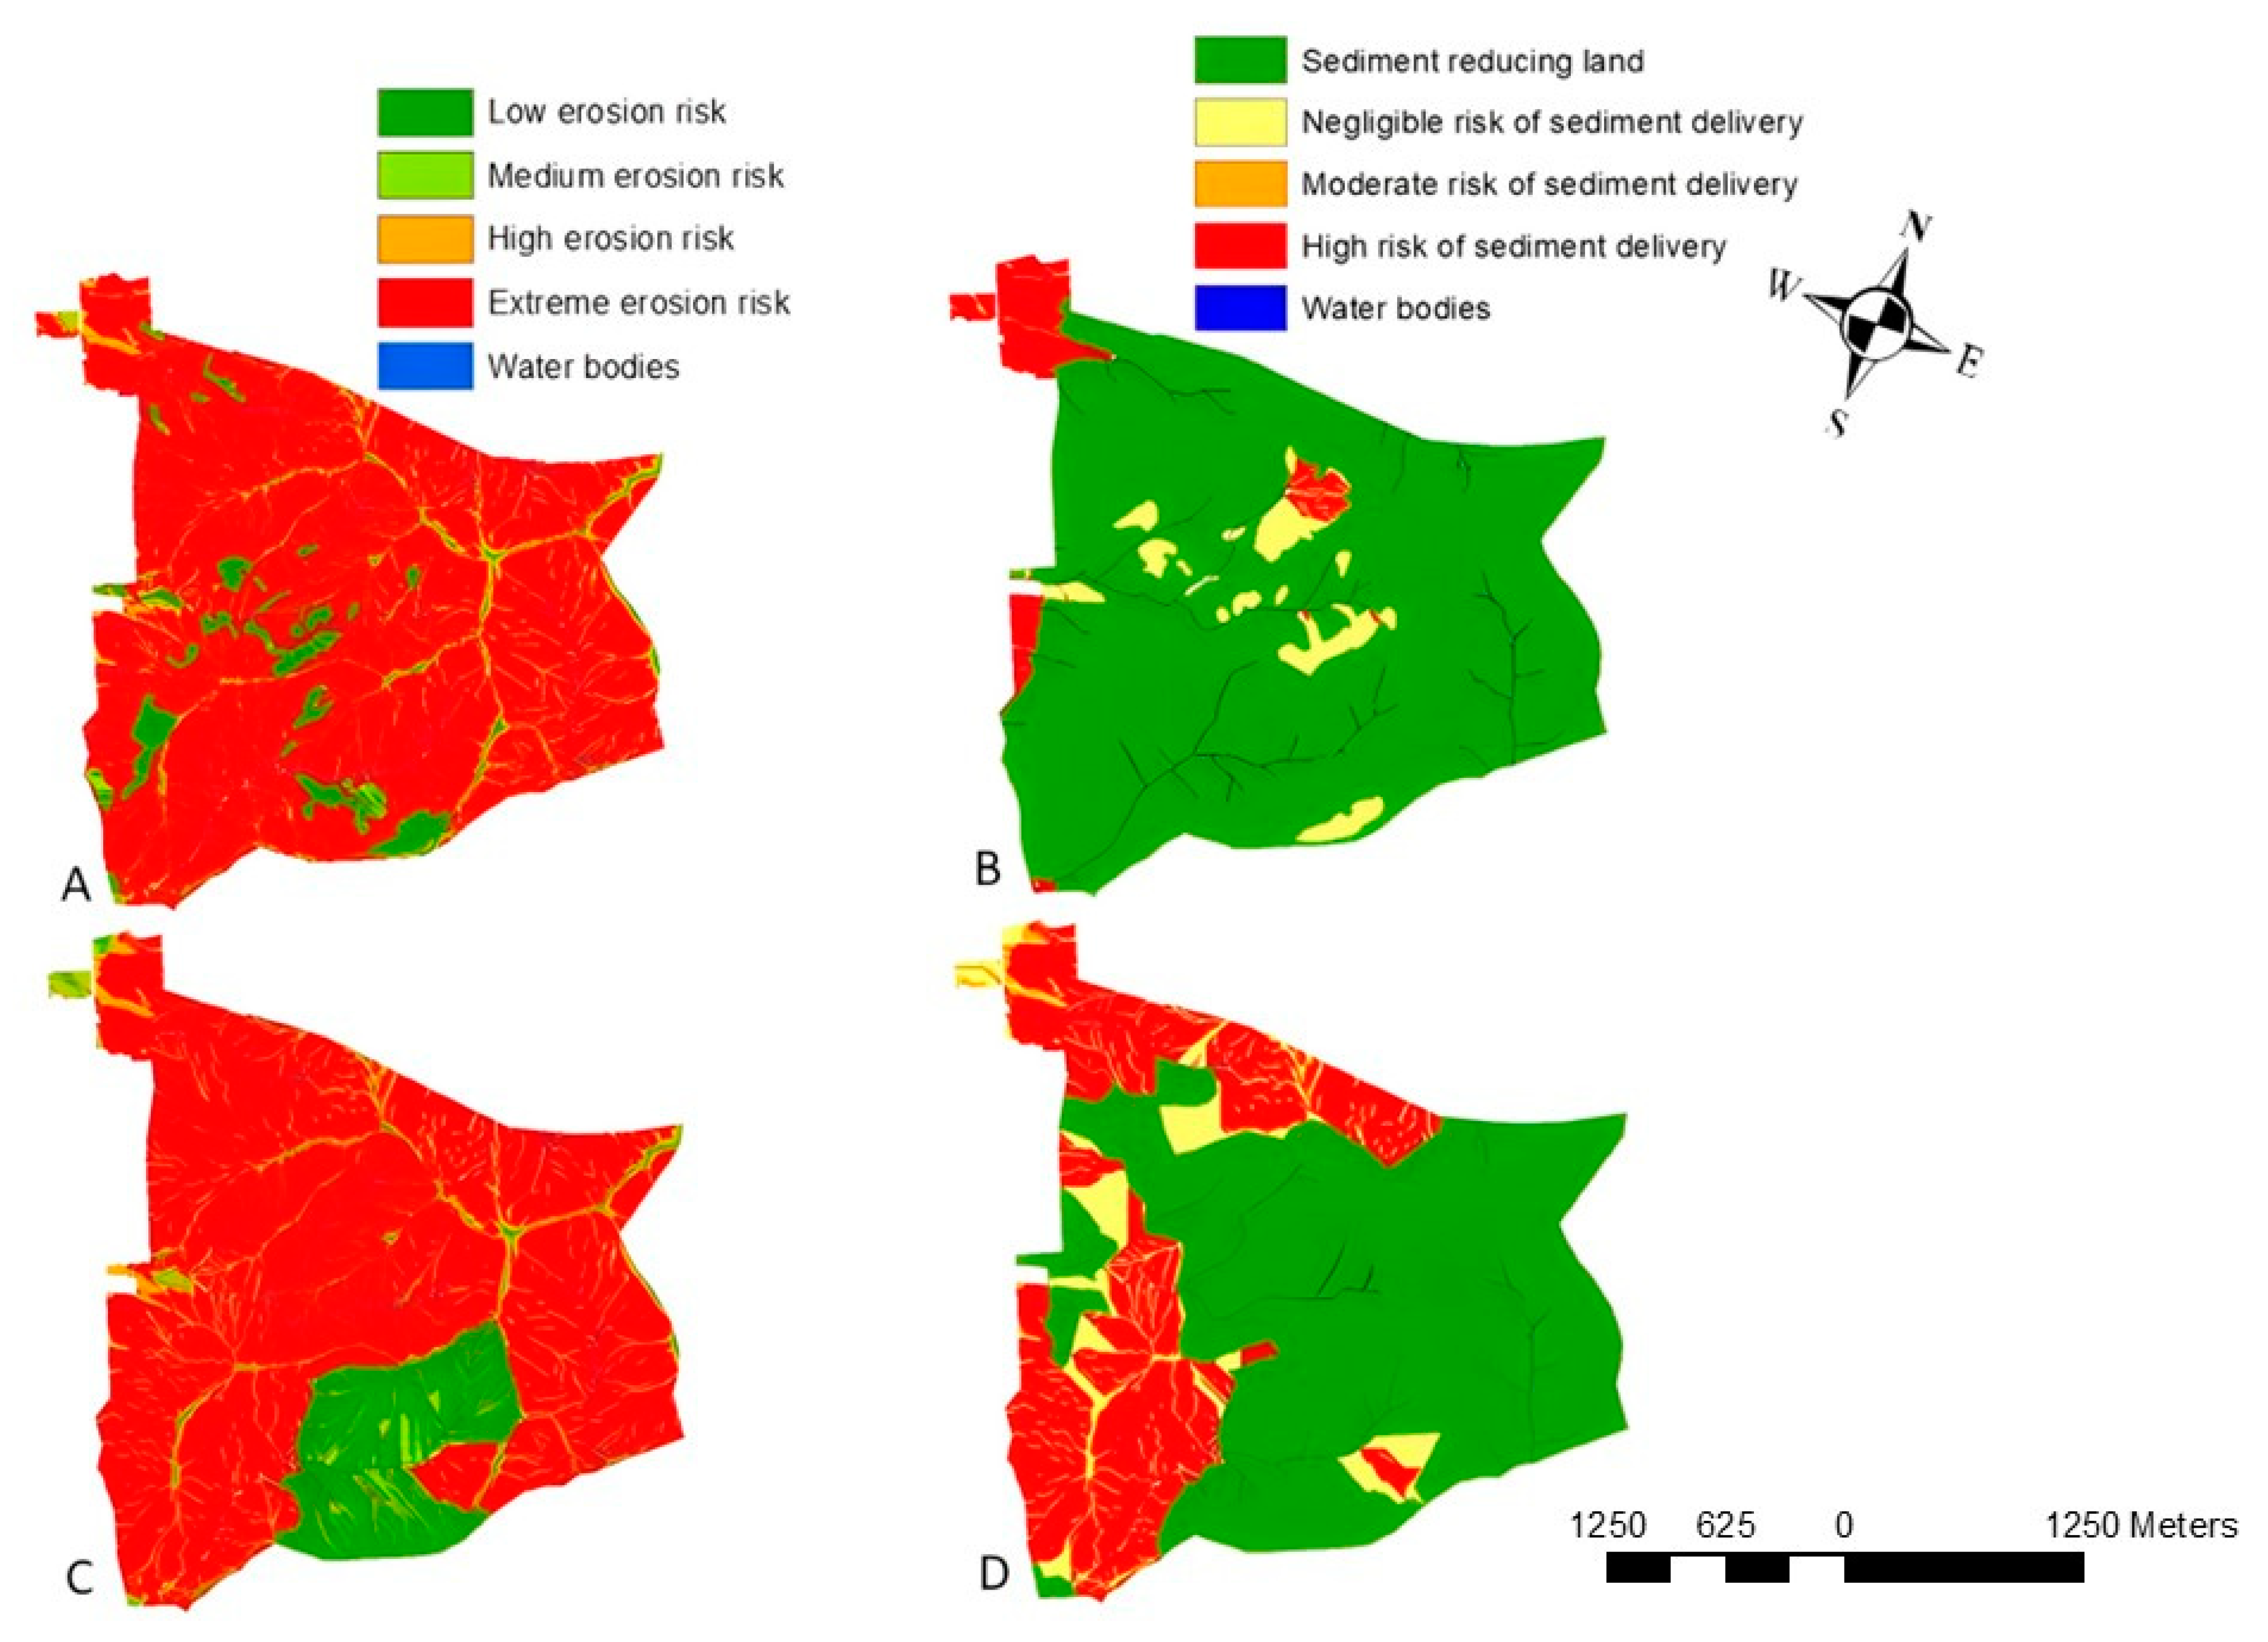
2.3.4. Erosion/Sediment Delivery

The Revised Universal Soil Loss Equation (RUSLE) is used to estimate overland flow erosion from agricultural lands based on information on rainfall, soil erodability, topography, land cover, and management practices [46]. Sediment delivery vulnerability is estimated by checking the flow movement from areas of high/extreme soil losses. If this flow and associated sediments are intercepted or mitigated by vegetation such as riparian planting before it reaches the stream, then the sediment delivery vulnerability is negligible or low.

2.3.5. Nitrogen and Phosphorus Load

LUCI calculates nitrogen and phosphorus loads on land and stream networks through a modified export coefficient approach that uses the main LUCI inputs of biophysical and geoclimatic characteristics.

2.3.6. Trade-Off Tool

Trade-off tools evaluate the individual ecosystem services against each other to illustrate where trade-offs or synergies occur between them and identify areas where interventions could benefit multiple services or neutralize or jeopardize some of the services.

2.4. LUCI Outputs

LUCI generates quantitative and qualitative spatial outputs that classify DEM grid cells into a red-orange-green colour scheme, with blue for water bodies and black for residential areas. Green indicates that these areas are providing ecosystem services and warrant protection, while red indicates areas of opportunity for potential management interventions to improve services.

3. Results

3.1. Agricultural Productivity

The first generated map (Figure 3A) illustrates the agricultural evaluation of LUMGS’s current land regime based on the vegetation cover database and indicates most of the station has marginal productivity (86.7%), while a small portion is classified as high productivity (4.92%) is restricted to flat areas of the station. The second map (Figure 3B) shows the predicted optimal agricultural utilisation, it evaluates the value of the land of the station independently of its current land regime. The value is calculated according to topographic (slope, aspect, soil hydraulic properties, soil fertility) and climatic information of the station, the majority was classified as having marginal or very marginal productivity (74%). The agricultural utilisation status map (Figure 3C) illustrates where the land appears to be over or under-utilised by considering differences between predicted productivity and current productivity/land use. Around 30% of the station is considered to have optimum utilisation (high ecosystem service provision), 50% is at near optimum utilisation (moderate ecosystem service provision), and 20% is at non-optimum utilisation (low ecosystem service provision).
When using the second approach for land cover to run LUCI over LUMGS to assess the current land use regime, 37.4% of LUMGS was classified as having high productivity, and 44.3% was classified as having marginal productivity (Figure 4A). For the predicted optimal agricultural utilisation, as the value of land is calculated based on the topography of the site, the results were the same as before. Outcomes from the difference between predicted productivity and current productivity/land use show that only 15% of LUMGS has optimal utilisation, around 30% has near-optimum utilisation, around 30% has non-optimum utilisation, and around 20% has a production potential not realised (Figure 4B).

3.2. Flood Mitigation

Virtually all the station (90%) has the potential of mitigating flooding (Figure 5A), while only 5% of the area prone to flood is considered non-mitigated, where water flow is either being generated or accumulates. Areas on the upper slope located close to water bodies (4.27% of the station) were considered as mitigated flood land, which means that those are intercepted areas by mitigating areas elsewhere (e.g., areas with trees intercepting water flow to nearby areas). The capacity of LUMGS to mitigate flood was reduced to 60% when the user-defined land cover was used as input for LUCI, and the area prone to flood increased to roughly 30% (Figure 5B). Mitigated flood land area was similar to previous results.

3.3. Carbon Sequestration

Most of the LUMGS area (97%) is classified as having high rates of C sequestration (up to 1.5 Mg/ha/year) as shown in Figure 6A. When the user-defined land cover database is considered (Figure 6B), the area classified as having high rates of C sequestration (up to 1.5 Mg/ha/year) is reduced to 70%, and areas classified as having moderate CO2 emissions (up to 1.5 Mg/ha/year) increased to 25% of the station.

3.4. Erosion/Sediment Delivery

The vulnerability of LUMGS topography to erosion and sediment delivery is shown in Figure 7A,B, respectively. Areas with an extreme risk of erosion are those that can lose more than 10 Mg/ha/year and represent 82% of the station. Around 12% of the farm is at low erosion risk (between 2.5 and 5 Mg/ha/year). On the other hand, almost 90% of the station is classified as sediment-reducing land which implies areas with breaking connections (densely vegetated areas or areas with an abundance of trees) that intercept sediment delivery to the stream. Areas with a high risk of sediment delivery are flatter, gentle contour areas located at the base of hills; foothill positions.
Similar results of erosion risk (Figure 7C) were obtained with the user-defined land cover database, with 73% of the station being at extreme risk of erosion and only 18% of the station at low erosion risk. The results of sediment delivery (Figure 7D) changed compared to the national land cover database. The total area considered sediment-reducing land decreased by 60% and the total area classified as having a high risk of sediment delivery increased to 30%.

3.5. Nitrogen and Phosphorus Load

Around 57% of the farm is classified as having a low to moderate nitrogen load (≤0.1 kg per year) and 36.71% of the farm is classified as having a critical nitrogen concentration load (>0.1 kg per year in the whole station area, Figure 8A). Phosphorus accumulation does not represent a significant concern as 95% of the station has a low to moderate load (≤10 g per year), and only 3.31% of the farm has a critical phosphorus concentration load (>10 g per year in the whole station area, Figure 8B).
The area classified as having a very critical nitrogen accumulated load (>1.0 kg N) at the farm increased with the user-defined land cover database (Figure 8C) compared to the national land cover database from 5% to 20%. Although the area classified as low to moderate phosphorus load reduced from 95% to 70% between the two land cover datasets, phosphorus accumulation still does not represent a significant concern (Figure 8D).

3.6. Trade-Off Tool

By running the trade-off tool with all the single ecosystem services, we identified that within an area of 6.6 km2 of the farm associated with locations of high elevations or near water bodies (Figure 9A), a trade-off between ecosystem services would occur, meaning that any intervention would negatively affect at least one of the services. We also ran the trade-off tool to identify where interventions would benefit at least one or all the following ecosystem services: erosion, flood mitigation, nitrogen, and phosphorus concentration (Figure 9B), without negatively affecting others, from which we only identified 1.5 km2 of the total farm.

4. Discussion

The Land Utilisation and Capability Indicator (LUCI) model was applied to Lincoln University Mount Grand Station as a case study to map the capability of high-country stations to deliver ecosystem services as a tool to identify best grazing management strategies to design multifunctional grazing systems. Overall, LUMGS has the potential for agriculture productivity varying spatially, a high flood mitigation capacity, a high capacity of C sequestration, an extreme risk of erosion, a capacity to reduce sediment delivery to stream, and a low to moderate nitrogen and phosphorus accumulation. Results slightly changed when the user-defined land cover was used as input for LUCI. The capacity of LUMGS to mitigate flooding, sequester C, and reduce sediment was decreased and areas with an accumulated load of nitrogen and phosphorus increased compared to the national database.
Topography (slope, soil fertility, aspect) plays an important role in determining the agricultural value of land especially in high-country stations where the heterogeneous landscape hampers the land productivity in certain locations (steep areas, low soil fertility, difficult to manage). Thus, the management of the land needs to be adequate for a specific context. In the case of LUMGS, 74% of the area is classified as marginally productive and only 30% is classified as having optimum utilisation, indicating that there are either accessible and suitable areas for agriculture that are not utilised, or that there is a more intensive agricultural land use where topography-soil combinations are not suitable. Areas considered productive, according to the parameters set by the user in the model (areas located under 900 m of elevation and 30° of a slope) are suitable for a land management regime with higher agricultural value than “low-producing grassland” cover as is the case of LUMGS. This class, according to the New Zealand Land Cover Database (LCDB) classification, reflects low soil fertility and extensive grazing management or non-agricultural use, which would explain why a productive area covered by “low-producing grassland” is classified as low optimum utilisation. Likewise, flat areas seem to support other agricultural activities, such as “Sheep farming” in an intensive grazing system, rather than only grasslands which would be more suitable for their high fertility and productive potential. Those divergencies suggest that land management regimes should be spatially adjusted for local topography-soil parameters.
Elevation and steepness variation in high-country stations are also determinants of the land capacity to mitigate flooding. Flat areas are usually prone to flood and have a high risk of sediment delivery as they receive quick overland water and drain flow from the steep slopes, which are dominant runoff pathways in hillslopes [47]. Overland flow from steep slopes down to flat areas can be controlled by trees or shrubs in the foothill area, as the type of vegetation contributes to intercepting the overland flow and reducing the flood risk due to its density (roughness) [48,49]. For instance, woodlands have greater permeability, consequently, greater potential in flood mitigation than grazed grasslands due to improved soil porosity and structure [50] and improved soil hydraulic properties [47]. Thus, the strategic planting of trees and shrubs could be an alternative for flood mitigation and sediment delivery in flat areas of high-country stations.
The soil capacity to control overland flow is also affected by grazing animals. Soil structure and hydraulic function benefit from the organic material incorporated into the soil surface, which can be absent when grassland is heavily or inadequately grazed [50]. Grazing animals can also negatively affect the capacity of soil to control overland flow by affecting the soil’s physical and hydraulic properties and reducing soil ground cover during treading due to compaction or pugging [51,52]. On the other hand, rotational grazing with high stock density and more uniform grazing shall provide large flows of organic matter returning to the soil due to the concentrated and well-distributed manure deposits, which activate soil biocenosis and improve plant productivity, thus improving soil ground cover and function [53,54]. Furthermore, trampling facilitates the decomposition of dead plant biomass and the incorporation and allocation of C into the soil [54,55]. Thus, grazing animals can promote positive effects on the soil, preserve soil health and function and further mitigate flood and sediment delivery, providing that grazing is adjusted in terms of frequency and pressure to the soil treading capacity. As the soil capacity to support treading is spatial and temporally variable, implying that different areas from the same station respond differently to grazing intensity, grazing management needs to be adaptive, flexible, and carefully planned [56].
Adequate grazing management can contribute to controlling soil erosion and nutrient delivery and accumulation [57]. Naturally, erosion susceptibility is usually high in high-country stations due to the soil steepness [21,56], and inadequate grazing can further jeopardize soil function and increase soil loss by erosion [52]. For instance, cattle grazing at higher elevations and slopes can cause more soil erosion and nutrient delivery than other stock types [58] due to a higher pressure exerted on the soil during treading that can reduce ground cover and, hence, soil protection against disturbances and erosive forces [51,52]. Thus, grazing management should be based on strategies that suit the natural spatiotemporal variability and capacity of the landscape to erosion and withstand livestock activity [56]. This includes an integrated regime with the selection of the most suitable stock type for a particular area and soil condition and topography [56,57]; an adjusted grazing frequency and pressure to the seasonal growth of plants [57]; and an adequate rest period in between grazing times to allow plants to recover for a complete restoration of roots reserve and accumulation of nutrients for a vigorous regrowth [59,60].
Natural land cover has a great role in controlling erosion and sediment delivery [61]. Likewise, the roots of trees and shrubs promote better soil structure stabilisation than shallow-rooted pasture species and contribute more to control erosion than grasslands [58]. This is confirmed by the low erosion risk classification of areas covered by “native bush” or “Mānuka or/Kānuka” in the LUMGS case. Nevertheless, in managed grasslands where vegetation is usually composed of exotic and naturalised plant species, guaranteeing a persistent and healthy ground cover is also a strategy to prevent or reduce surface erosion [62]. Results from a study in Australia showed an increase in ground cover in rotational grazing where paddocks were frequently rested compared to a continuous system [63]. Similarly, Badgery et al. (2017) [64] concluded that increasing grazing pressure in a rotational system by evenly distributing grazing across the landscape resulted in greater herbage growth, herbage mass, and ground cover of native species in a heterogeneous landscape (variable in aspects, elevation, slope) in Australia than a continuous system with the same stocking rate.
A persistent and healthy ground cover would also contribute to reducing the delivery of nutrients to streams [57]. Nitrogen and P losses are a function of climate, topography, and hydrology, but the management applied to the land may be of great influence [65], which explains the increased N and P load accumulation when “sheep and beef farming” were included as land management regime in LUMGS. A review of N and P loss, and sediment delivery from New Zealand grassland catchments found that any livestock farming types—deer, sheep, or mixed farms (more than one stock) results in greater N and P loss and sediment delivery than non-agricultural rural land (exotic plantation and native forest), although there is a difference in loads between livestock farming types depending on the farm intensity and the strategies adopted to mitigate the losses [58]. Restricting grazing when soil is wet to reduce soil compaction and pugging is a common strategy to reduce P and N losses [66]. Other grazing management strategies to reduce P were reviewed by McDowell and Nash (2012) [65] and include fencing streams and providing water troughs to avoid livestock access to those areas, testing soil and maintaining P levels within the range for pasture production and only applying fertiliser (low solubility) if necessary during times when surface runoff is unlikely, and provide a better distribution of shade and shelter to avoid animal camping in the same areas, which would increase the faecal load concentration on them.
Ruminants are appointed as great contributors to greenhouse gas emissions due to the enteric methane (CH4) [67], which explains why the inclusion of “Sheep and beef farming” as a land management regime negatively changed the C sequestration potential of LUMGS. However, well-managed pastures, following the same principles as the strategies that guarantee a healthy and persistent ground cover (recovery period in between grazing, adequate grazing intensity) to control soil erosion and nutrients delivery/accumulation, can offset C emissions from livestock due to the greater C sequestration as a consequence of increased productivity of plants [68,69,70]. Adequate management also facilitates better control of plant growth to identify the best time for grazing, when the highest herbage mass is associated with the highest protein and lowest fibre content, a strategy of improved forage nutritional value to reduce CH4 emissions [70].
In addition to grazing management, a strategy to enhance station C storage in high-country stations as mitigation for livestock greenhouse gas emissions would be the establishment of an agroforestry system with indigenous trees [71]. A predominant tree of LUMGS is kānuka (Kunzea ericoides) an indigenous New Zealand specie that is highly used for honey production, and whose leaves contain several medicinal properties, such as antibacterial, antioxidant, and anti-inflammatory [72]. Although not measured here, the benefits of having Kānuka at the station are extended to enriched chemoscape and then the healthscape value of the station [73,74], in addition to increasing the multifunctionality due to honey production [75], the landscape biodiversity, the aesthetic, and cultural values, and providing shelter for animals [76].
Acknowledging the synergies and trade-offs between ecosystem services is essential for providing landowner insights about the best utilization of land for achieving different goals (e.g., increasing diversity or controlling erosion). Trade-offs may occur across all LUMGS if interventions are made (Figure 9), but only an area of 1.5 km2 of the total farm synergies were identified. The trade-off output indicates that those areas are more vulnerable and need extra attention when planning any intervention. Still, strategies to modulate one ecosystem service will most likely positively affect others. For example, Tran et al. (2022) [20] when modelling ecosystem services in a hill country station also in New Zealand demonstrated that including Mānuka trees in the station for honey production increased the provision of fresh water, erosion control, and diversity as well. In the case of the current study, we appointed the strategic planting of trees to control flood mitigation, sediment delivery, and enhance C sequestration. Likewise, the negative effects of including livestock production in the provision of ecosystem services can be managed by applying strategies adjusted for the landscape configuration [77]. For instance, enhanced C sequestration by trees would offset greenhouse gas emissions from livestock. Moreover, adequate grazing management based on context-adjusted strategies and extra attention to the most vulnerable areas such as flat areas and near water body areas would not only ameliorate the negative impacts of including livestock in the system but bring other benefits. Those include enhanced primary productivity, microbiology activity on soil, and C persistence in ecosystems [78,79]. Therefore, applying management that aligns with the complexity of high-country stations is key to creating more sustainable multifunctional grazing systems that deliver multiple ecosystem services.

Limitations

The modelling results provide useful information on the LUMGS landscape configuration and its association with the pattern distribution of multiple ecosystem services, representing the heterogeneous nature of high-country stations in New Zealand. Nevertheless, it is crucial to acknowledge the model or database limitations for a prudent interpretation of outcomes. The national database used for this study is coarse and has no detailed experimental data for model calibration and validation. It considers the land regime as the vegetation cover and does not include detailed on-farm information on grazing management (stocking rate, occupation periods), irrigation, and fertiliser application. The user-defined database improves the land regime information by including the farming activities of the station at the paddock level. Although it still relies on regional data for management information, it represents the grazing management usually applied to high-country stations. Finally, the temporal variation of ecosystem services delivery is neglected by the model. Overcoming those limitations is suggested as they would increase the accuracy of the model outcomes and our understanding of land use changes and ecosystem services delivery. Our goal is to reinforce the need for context-adjust and holistic management to enhance the health of grasslands as opposed to reductionist and generalist management approaches. While studies mapping ecosystem services in high-country stations are scarce, our work, despite its limitations, contributes to a paradigm change.

5. Conclusions

Within the model limitations, the use of the Land and Capability Indicator model (LUCI) provided useful information on the spatial capability of LUMGS to deliver multiple ecosystem services, as a case study representing NZ high-country ecosystems. Model outcomes display the spatial visualisation of ecosystem services associated with the landscape topography, soil, and vegetation patterns, and the effects of land management regime on ecosystem services delivery. Those findings enable the identification of neglected areas and the planning of best place-based management practices, including allocating livestock to the most productive areas and adjusting grazing intensity accordingly, adopting agroforestry systems, and planting trees in strategic places (foothills and around water bodies), and adjusting grazing to the spatial treading capacity of soils. Although further research into model refinement and validation of the model outcomes is warranted, this work contributes to demonstrating that the spatial variation in ecosystem services and the impacts of livestock establishment on grasslands require holistic management and that this approach should be guided by design rather than by default. The use of geospatial models such as a LUCI is an available design tool for decision-makers that can contribute to providing a comprehensive diagnostic of grassland capacity in providing ecosystem services. Such exercise suggests the need of changing the paradigm of using single and simplistic approaches on complex and dynamic systems such as high-country grasslands for the design of context-adjusted and holistic management for creating multifunctional and sustainable agricultural landscapes.

Author Contributions

F.C.P. contributed to the concept of this work in consultation with all co-authors. F.C.P. performed the model simulations, analysed the data, and wrote the manuscript. S.C. contributed to the data presentation. S.C., C.M.S.S., T.M.R.M. and P.G. contributed to the review and edition of the manuscript. All authors have read and agreed to the published version of the manuscript.

Funding

This research was funded by the Centre of Excellence, Designing Future Productive Landscapes, Lincoln University (4350 AGLS-INT 4908 AGLS-113043), and by the John Barnes Postgraduate Scholarship from Lincoln University.

Data Availability Statement

No new data was created.

Acknowledgments

The authors acknowledge the assistance of LUCI team in running the model. Special thanks to Rubianca Benavidez.

Conflicts of Interest

The authors declare no conflict of interest.

References

  1. Sala, O.E.; Yahdjian, L.; Havstad, K.; Aguiar, M.R. Rangeland ecosystem services: Nature’s supply and humans’ demand. In Rangeland Systems; Briske, D.D., Ed.; Springer Nature: Cham, Switzerlan, 2017; pp. 467–489. [Google Scholar] [CrossRef] [Green Version]
  2. White, R.P.; Murray, S.; Rohweder, M.; Prince, S.D.; Thompson, K.M. Grassland Ecosystems; World Resources Institute: Washington, DC, USA, 2000. [Google Scholar]
  3. Zhao, Y.; Liu, Z.; Wu, J. Grassland ecosystem services: A systematic review of research advances and future directions. Landsc. Ecol. 2020, 35, 793–814. [Google Scholar] [CrossRef]
  4. Ramankutty, N.; Mehrabi, Z.; Waha, K.; Kremen, C.; Herrero, M.; Rieseberg, L.H. Trends in global agricultural land use: Implications for environmental health and food security. Annu. Rev. Plant. Biol. 2018, 69, 789–815. [Google Scholar] [CrossRef] [PubMed] [Green Version]
  5. Foley, J.A.; De Fries, R.; Asner, G.P.; Barford, C.; Bonan, G.; Carpenter, S.R.; Chapin, F.S.; Coe, M.T.; Daily, G.C.; Gibbs, H.K.; et al. Global consequences of land use. Science 2005, 309, 570–574. [Google Scholar] [CrossRef] [PubMed] [Green Version]
  6. Kanianska, R. Agriculture and its impact on land-use, environment, and ecosystem services. In Landscape Ecology—The Influences of Land Use and Anthropogenic Impacts of Landscape Creation; IntechOpen: London, UK, 2016; pp. 1–26. [Google Scholar]
  7. de Bello, F.; Lavorel, S.; Díaz, S.; Harrington, R.; Cornelissen, J.H.; Bardgett, R.D.; Berg, M.P.; Cipriotti, P.; Feld, C.K.; Hering, D.; et al. Towards an assessment of multiple ecosystem processes and services via functional traits. Biodivers. Conserv. 2010, 19, 2873–2893. [Google Scholar] [CrossRef]
  8. Power, A.G. Ecosystem services and agriculture: Tradeoffs and synergies. Phil. Trans. R. Soc. B 2010, 365, 2959–2971. [Google Scholar] [CrossRef]
  9. Duru, M.; Pontes, L.D.A.S.; Schellberg, J. Grassland Functional Diversity and Management for Enhancing Ecosystem Services and Reducing Environmental Impacts; Agroecosystem Diversity; Elsevier: Amsterdam, The Netherlands, 2019. [Google Scholar]
  10. Rowntree, J.E.; Stanley, P.L.; Maciel, I.C.F.; Thorbecke, M.; Rosenzweig, S.T.; Hancock, D.W.; Guzman, A.; Raven, M.R. Ecosystem Impacts and Productive Capacity of a Multi-Species Pastured Livestock System. Front. Sustain. Food Syst. 2020, 4, 544984. [Google Scholar] [CrossRef]
  11. Fathollahi, H.; Mousavi-Avval, S.H.; Akram, A.; Rafiee, S. Comparative energy, economic, and environmental analyses of forage production systems for dairy farming. J. Clean. Prod. 2018, 182, 852–862. [Google Scholar] [CrossRef]
  12. Rodríguez, J.P.; Beard, T.D., Jr.; Bennett, E.M.; Cumming, G.S.; Cork, S.J.; Agard, J.; Dobson, A.P.; Peterson, G.D. Trade-offs across space, time, and ecosystem services. Ecol. Soc. 2006, 11, 28. [Google Scholar] [CrossRef] [Green Version]
  13. Rallings, A.M.; Smukler, S.M.; Gergel, S.E.; Mullinix, K. Towards multifunctional land use in an agricultural landscape: A trade-off and synergy analysis in the Lower Fraser Valley, Canada. Landsc. Urban Plan. 2019, 184, 88–100. [Google Scholar] [CrossRef]
  14. McGranahan, D.A. Ecologies of scale: Multifunctionality connects conservation and agriculture across fields, farms, and landscapes. Land 2014, 3, 739–769. [Google Scholar] [CrossRef] [Green Version]
  15. Dominati, E.J.; Maseyk, F.J.; Mackay, A.D.; Rendel, J.M. Farming in a changing environment: Increasing biodiversity on farm for the supply of multiple ecosystem services. Sci. Total Environ. 2019, 662, 703–713. [Google Scholar] [CrossRef]
  16. Michalk, D.L.; Kemp, D.R.; Badgery, W.B.; Wu, J.; Zhang, Y.; Thomassin, P.J. Sustainability and future food security—A global perspective for livestock production. Land Degrad. Dev. 2019, 30, 561–573. [Google Scholar] [CrossRef]
  17. Schiere, J.B.; Gregorini, P. Complexity, Crash and Collapse of Chaos: Clues for Designing Sustainable Systems, with Focus on Grassland-Based Systems. Sustainability 2023, 15, 4356. [Google Scholar] [CrossRef]
  18. Pereira, F.C.; Smith, C.; Charters, S.M.; Gregorini, P. Creating a Design Framework to Diagnose and Enhance Grassland Health under Pastoral Livestock Production Systems. Animals 2022, 12, 3306. [Google Scholar] [CrossRef]
  19. Xue, R.; Yang, Q.; Miao, F.; Wang, X.; Shen, Y. Slope aspect influences plant biomass, soil properties and microbial composition in alpine meadow on the Qinghai-Tibetan plateau. J. Soil Sci. Plant Nutr. 2018, 18, 1–12. [Google Scholar] [CrossRef] [Green Version]
  20. Tran, D.X.; Pearson, D.; Palmer, A.; Gray, D.; Lowry, J.; Dominati, E.J. A comprehensive spatially-explicit analysis of agricultural landscape multifunctionality using a New Zealand hill country farm case study. Agric. Syst. 2022, 203, 103494. [Google Scholar] [CrossRef]
  21. Tran, D.X.; Pearson, D.; Palmer, A.; Lowry, J.; Gray, D.; Dominati, E.J. Quantifying spatial non-stationarity in the relationship between landscape structure and the provision of ecosystem services: An example in the New Zealand hill country. Sci. Total Environ. 2022, 808, 152126. [Google Scholar] [CrossRef]
  22. Sharps, K.; Masante, D.; Thomas, A.; Jackson, B.; Redhead, J.; May, L.; Prosser, H.; Cosby, B.; Emmett, B.; Jones, L. Comparing strengths and weaknesses of three ecosystem services modelling tools in a diverse UK river catchment. Sci. Total Environ. 2017, 584, 118–130. [Google Scholar] [CrossRef] [Green Version]
  23. Malinga, R.; Gordon, L.J.; Jewitt, G.; Lindborg, R. Mapping ecosystem services across scales and continents—A review. Ecosyst. Serv. 2015, 13, 57–63. [Google Scholar] [CrossRef]
  24. Owen-Smith, N. Credible models for herbivore-vegetation systems: Towards an ecology of equations. S. Afr. J. Sci. 2002, 98, 445–449. [Google Scholar]
  25. Land Utilisation & Capability Indicator. Available online: https://lucitools.org (accessed on 6 May 2023).
  26. Nature Braid. Available online: https://naturebraid.org/ (accessed on 6 May 2023).
  27. Jackson, B.; Pagella, T.; Sinclair, F.; Orellana, B.; Henshaw, A.; Reynolds, B.; Mcintyre, N.; Wheater, H.; Eycott, A. Polyscape: A GIS mapping framework providing efficient and spatially explicit landscape-scale valuation of multiple ecosystem services. Landsc. Urban Plan. 2013, 112, 74–88. [Google Scholar] [CrossRef]
  28. Trodahl, M.; Burkitt, L.; Bretherton, M.; Deslippe, J.; Jackson, B.; Metherell, A. Developing N & P Export Coefficients for Rural Landscape Modelling in LUCI. In Science and Policy: Nutrient Management Challenges for the Next Generation; Occasional Report No. 30; Currie, L.D., Hedley, M.J., Eds.; Fertilizer and Lime Research Centre, Massey University: Palmerston North, New Zealand, 2017; Available online: http://flrc.massey.ac.nz/publications.html (accessed on 15 September 2022).
  29. Duncan, R.; Lucas, D.; Palmer, C. Mt Grand Station: Baseline Survey for Vegetation and Soils 1997; Department of Plant Sciences, Lincoln University: Lincoln, New Zealand, 1997. [Google Scholar]
  30. Chapman, D.F.; Macfarlane, M.J. Pasture growth limitations in hill country and choice of species. NZGA Res. Pract. Ser. 1985, 3, 25–29. [Google Scholar] [CrossRef]
  31. Smith, C.; Jayathunga, S.; Gregorini, P.; Pereira, F.C.; McWilliam, W. Using Soil Sustainability and Resilience Concepts to Support Future Land Management Practice: A Case Study of Mt Grand Station, Hāwea, New Zealand. Sustainability 2022, 14, 1808. [Google Scholar] [CrossRef]
  32. Morris, S.T.; Kenyon, P.R. Intensive sheep and beef production from pasture—A New Zealand perspective of concerns, opportunities and challenges. Meat Sci. 2014, 98, 330–335. [Google Scholar] [CrossRef] [PubMed]
  33. Wang, Y.; Dai, E. Spatial-temporal changes in ecosystem services and the trade-off relationship in mountain regions: A case study of Hengduan Mountain region in Southwest China. J. Clean. Prod. 2020, 264, 121573. [Google Scholar] [CrossRef]
  34. Mason, N.W.; Palmer, D.J.; Vetrova, V.; Brabyn, L.; Paul, T.; Willemse, P.; Peltzer, D.A. Accentuating the positive while eliminating the negative of alien tree invasions: A multiple ecosystem services approach to prioritising control efforts. Biol. Invasions 2017, 19, 1181–1195. [Google Scholar] [CrossRef]
  35. de Groot, R.; Hein, L. Concept and valuation of landscape functions at di_erent scales. In Multifunctional Land Use; Springer: Berlin/Heidelberg, Germany, 2007; pp. 15–36. [Google Scholar]
  36. Maxwell, T.M.; Moir, J.L.; Edwards, G.R. Grazing and soil fertility effect on naturalized annual clover species in New Zealand high country. Rangel. Ecol. Manag. 2016, 69, 444–448. [Google Scholar] [CrossRef]
  37. Land Information New Zealand Data. Available online: https://data.linz.govt.nz/ (accessed on 5 June 2022).
  38. New Zealand Land Cover Database. Available online: https://lris.scinfo.org.nz/layer/104400-lcdb-v50-land-cover-database-version-50-mainland-new-zealand/ (accessed on 5 June 2022).
  39. National Soil Database. Available online: https://soils.landcareresearch.co.nz/ (accessed on 5 June 2022).
  40. Jackson, B.M.; Metherell, A.K.; Roberts, A.H.C.; Trodahl, M.I.; White, M. Adaption of the LUCI Framework to Account for Detailed Farm Management: A Case Study Exploring Potential for Nutrient Mitigation Using Data from the Southland Demonstration Farm. In Integrated Nutrient and Water Management for Sustainable Farming; Occasional Report No. 29; Currie, L.D., Singh, R., Eds.; Fertilizer and Lime Research Centre, Massey University: Palmerston North, New Zealand, 2016; Available online: http://flrc.massey.ac.nz/publication.html (accessed on 15 September 2022).
  41. Dang, N.A.; Benavidez, R.; Tomscha, S.A.; Nguyen, H.; Tran, D.D.; Nguyen, D.T.H.; Loc, H.H.; Jackson, B.M. Ecosystem Service Modelling to Support Nature-Based Flood Water Management in the Vietnamese Mekong River Delta. Sustainability 2021, 13, 13549. [Google Scholar] [CrossRef]
  42. Tomscha, S.A.; Bentley, S.; Platzer, E.; Jackson, B.; De Roiste, M.; Hartley, S.; Norton, K.; Deslippe, J.R. Multiple methods confirm wetland restoration improves ecosystem services. Ecosyst. People 2021, 17, 25–40. [Google Scholar] [CrossRef]
  43. Emmett, B.A.; Cooper, D.; Smart, S.; Jackson, B.; Thomas, A.; Cosby, B.; Evans, C.; Glanville, H.; McDonald, J.E.; Malham, S.K.; et al. Spatial patterns and environmental constraints on ecosystem services at a catchment scale. Sci. Total Environ. 2016, 572, 1586–1600. [Google Scholar] [CrossRef]
  44. Pereira, F.C.; Smith, C.M.; Maxwell, T.M.; Charters, S.M.; Logan, C.M.; Donovan, M.; Jayathunga, S.; Gregorini, P. Applying Spatial Analysis to Create Modern Rich Pictures for Grassland Health Analysis. Sustainability 2021, 13, 11535. [Google Scholar] [CrossRef]
  45. IPCC. Guidelines for National Greenhouse Gas Inventories. 2006. Available online: https://www.ipcc-nggip.iges.or.jp/public/2006gl/index.html (accessed on 2 September 2021).
  46. Wischmeier, W.H.; Smith, D.D. Predicting Rainfall Erosion Losses: A Guide to Conservation Planning (No. 537); Department of Agriculture, Science and Education Administration: Annapolis, MD, USA, 1978.
  47. Marshall, M.R.; Francis, O.J.; Frogbrook, Z.L.; Jackson, B.M.; McIntyre, N.; Reynolds, B.; Solloway, I.; Wheater, H.S.; Chell, J. The impact of upland land management on flooding: Results from an improved pasture hillslope. Hydrol. Process. 2009, 23, 464–475. [Google Scholar] [CrossRef]
  48. Bond, S.; Kirkby, M.J.; Johnston, J.; Crowle, A.; Holden, J. Seasonal vegetation and management influence overland flow velocity in upland grasslands-dataset. Hydrol. Process. 2020, 34, 3777–3791. [Google Scholar] [CrossRef]
  49. Monger, F.; Bond, S.; Spracklen, D.V.; Kirkby, M.J. Overland flow velocity and soil properties in established semi-natural woodland and wood pasture in an upland catchment. Hydrol. Process. 2022, 36, e14567. [Google Scholar] [CrossRef]
  50. Archer, N.A.L.; Bonell, M.; Coles, N.; MacDonald, A.M.; Auton, C.A.; Stevenson, R. Soil characteristics and landcover relationships on soil hydraulic conductivity at a hillslope scale: A view towards local flood management. J. Hydrol. 2013, 497, 208–222. [Google Scholar] [CrossRef] [Green Version]
  51. Greenwood, K.L.; McKenzie, B.M. Grazing effects on soil physical properties and the consequences for pastures: A review. Aust. J. Exp. Agric. 2001, 41, 1231–1250. [Google Scholar] [CrossRef]
  52. Donovan, M.; Monaghan, R. Impacts of grazing on ground cover, soil physical properties and soil loss via surface erosion: A novel geospatial modelling approach. J. Environ. Manag. 2021, 287, 112206. [Google Scholar] [CrossRef] [PubMed]
  53. Wagner, P.M.; Abagandura, G.O.; Mamo, M.; Weissling, T.; Wingeyer, A.; Bradshaw, J.D. Abundance and Diversity of Dung Beetles (Coleoptera: Scarabaeoidea) as Affected by Grazing Management in the Nebraska Sandhills Ecosystem. Environ. Entomol. 2021, 50, 222–231. [Google Scholar] [CrossRef]
  54. Gosnell, H.; Charnley, S.; Stanley, P. Climate change mitigation as a co-benefit of regenerative ranching: Insights from Australia and the United States: CC Mitigation and Regenerative Ranching. Interface Focus 2020, 10, 20200027. [Google Scholar] [CrossRef] [PubMed]
  55. Wei, Y.; Zhang, Y.; Wilson, G.W.; Guo, Y.; Bi, Y.; Xiong, X.; Liu, N. Transformation of litter carbon to stable soil organic matter is facilitated by ungulate trampling. Geoderma 2021, 385, 114828. [Google Scholar] [CrossRef]
  56. Pereira, F.C.; Donovan, M.; Smith, C.M.; Charters, S.; Maxwell, T.M.; Gregorini, P. A Geospatial Modelling Approach to Understand the Spatio-Temporal Impacts of Grazing on Soil Susceptibility to Erosion. Soil Syst. 2023, 7, 30. [Google Scholar] [CrossRef]
  57. Mackay, A.D.; Wedderburn, M.E.; Lambert, M.G. Sustainable management of hill land. In Proceedings of the New Zealand Grassland Association; New Zealand Grassland Association: Dunedin, New Zealand, 1993; pp. 171–176. [Google Scholar]
  58. McDowell, R.; Wilcock, R. Water Quality and the Effects of Different Pastoral Animals. N. Z. Vet. J. 2008, 56, 289–296. [Google Scholar] [CrossRef] [PubMed]
  59. Voisin, A. Produtividade do Pasto; Mestre Jou: São Paulo, Brazil, 1974. [Google Scholar]
  60. Teague, R.; Provenza, F.; Kreuter, U.; Steffens, T.; Barnes, M. Multi-paddock grazing on rangelands: Why the perceptual dichotomy between research results and rancher experience? J. Environ. Manag. 2013, 128, 699–717. [Google Scholar] [CrossRef] [PubMed]
  61. Woznicki, S.A.; Cada, P.; Wickham, J.; Schmidt, M.; Baynes, J.; Mehaffey, M.; Neale, A. Sediment retention by natural landscapes in the conterminous United States. Sci. Total Environ. 2020, 745, 140972. [Google Scholar] [CrossRef]
  62. Basher, L.; Moores, J.; McLean, G. Scientific Basis for Erosion and Sediment Control Practices in New Zealand; Landcare Research: Nelson, New Zealand, 2016; pp. 1–121. [Google Scholar]
  63. McDonald, S.E.; Reid, N.; Waters, C.M.; Smith, R.; Hunter, J. Improving ground cover and landscape function in a semi-arid rangeland through alternative grazing management. Agric. Ecosyst. Environ. 2018, 268, 8–14. [Google Scholar] [CrossRef]
  64. Badgery, W.B.; Millar, G.D.; Broadfoot, K.; Michalk, D.L.; Cranney, P.; Mitchell, D.; Van De Ven, R. Increased production and cover in a variable native pasture following intensive grazing management. Anim. Prod. Sci. 2017, 57, 1812–1823. [Google Scholar] [CrossRef] [Green Version]
  65. McDowell, R.W.; Nash, D. A review of the cost-effectiveness and suitability of mitigation strategies to prevent phosphorus loss from dairy farms in New Zealand and Australia. J. Environ. Qual. 2012, 41, 680–693. [Google Scholar] [CrossRef]
  66. Nguyen, M.L.; Sheath, G.W.; Smith, C.M.; Cooper, A.B. Impact of cattle treading on hill land: 2. Soil physical properties and contaminant runoff. N. Z. J. Agric. Res. 1998, 41, 279–290. [Google Scholar] [CrossRef] [Green Version]
  67. Gerber, P.J.; Steinfeld, H.; Henderson, B.; Mottet, A.; Opio, C.; Dijkman, J.; Falcucci, A.; Tempio, G. Tackling Climate Change through Livestock—A Global Assessment of Emissions and Mitigation Opportunities; Food and Agriculture Organization of the United Nations (FAO): Rome, Italy, 2013; ISBN 9789251079201.
  68. Stanley, P.L.; Rowntree, J.E.; Beede, D.K.; DeLonge, M.S.; Hamm, M.W. Impacts of soil carbon sequestration on life cycle greenhouse gas emissions in Midwestern USA beef finishing systems. Agric. Syst. 2018, 162, 249–258. [Google Scholar] [CrossRef]
  69. Machado Filho, L.C.P.; Seó, H.L.; Daros, R.R.; Enriquez-Hidalgo, D.; Wendling, A.V.; Pinheiro Machado, L.C. Voisin rational grazing as a sustainable alternative for livestock production. Animals 2021, 11, 3494. [Google Scholar] [CrossRef]
  70. Pereira, F.C.; Machado Filho, L.C.P.; Kazama, D.C.S.; Júnior, R.G.; Pereira, L.G.R.; Enríquez-Hidalgo, D. Effect of recovery period of mixture pasture on cattle behaviour, pasture biomass production and pasture nutritional value. Animal 2020, 14, 1961–1968. [Google Scholar] [CrossRef] [PubMed]
  71. Lorenz, K.; Lal, R. Soil organic carbon sequestration in agroforestry systems. A Review. Agron. Sustain. Dev. 2014, 34, 443–454. [Google Scholar] [CrossRef] [Green Version]
  72. Wyatt, R.M.; Hodges, L.D.; Kalafatis, N.; Wright, P.F.; Wynne, P.M.; Macrides, T.A. Phytochemical analysis and biological screening of leaf and twig extracts from Kunzea ericoides. Phytother. Res. 2005, 19, 963–970. [Google Scholar] [CrossRef] [PubMed]
  73. Villalba, J.J.; Beauchemin, K.A.; Gregorini, P.; MacAdam, J.W. Pasture chemoscapes and their ecological services. Transl. Anim. Sci. 2019, 3, 829–841. [Google Scholar] [CrossRef] [PubMed] [Green Version]
  74. Pereira, F.C.; Gregorini, P. Applying spatio-chemical analysis to grassland ecosystems for the illustration of chemoscapes and creation of healthscapes. Front. Sustain. Food Syst. 2022, 6, 927568. [Google Scholar] [CrossRef]
  75. Ausseil, A.E.; Dymond, J.R.; Newstrom, L. Mapping floral resources for honey bees in New Zealand at the catchment scale. Ecol. Appl. 2018, 28, 1182–1196. [Google Scholar] [CrossRef]
  76. Dominati, E.J.; Mackay, A.; Lynch, B.; Heath, N.; Millner, I. An ecosystem services approach to the quantification of shallow mass movement erosion and the value of soil conservation practices. Ecosyst. Serv. 2014, 9, 204–215. [Google Scholar] [CrossRef]
  77. Powers, B.F.; Ausseil, A.-G.; Perry, G.L.W. Ecosystem service management and spatial prioritisation in a multifunctional landscape in the Bay of Plenty, New Zealand. Australas. J. Environ. Manag. 2020, 27, 275–293. [Google Scholar] [CrossRef]
  78. Wilson, C.H.; Strickland, M.S.; Hutchings, J.A.; Bianchi, T.S.; Flory, S.L. Grazing enhances belowground carbon allocation, microbial biomass, and soil carbon in a subtropical grassland. Glob. Change Biol. 2018, 24, 2997–3009. [Google Scholar] [CrossRef]
  79. Kristensen, J.A.; Svenning, J.C.; Georgiou, K.; Malhi, Y. Can large herbivores enhance ecosystem carbon persistence? Trends Ecol. Evol. 2021, 37, 117–128. [Google Scholar] [CrossRef]
Figure 1. The geographic location of Lincoln University Mount Grand Station, latitude 44°38′01.93″ S; longitude 169°19′42.89″ E, and paddocks boundary. From left to right: The map of New Zealand (NZ), Lake Hawea in Central Otago, and the paddocks boundary of the station.
Land 12 01243 g001
Figure 2. (A) Land cover classification of Lincoln University Mount Grand station (LUMGS) derived from New Zealand Land Cover Database (LCDB) classes at version 5, and (B) land cover classification of LUMGS according to a user-defined parameterisation in which land cover was assigned based on information collected from the farm.
Land 12 01243 g002
Figure 3. (A) Agricultural evaluation of the current land regime of Lincoln University Mount Grand Station (LUMGS) based on the national land cover database (LCDB), (B) agricultural valuation of the land potentiality based on topographic (slope, aspect, soil hydraulic properties, and soil fertility according to New Zealand Fundamental Soil layer) and climatic information, and (C) agricultural valuation to assess if and where LUMGS land is over or under-utilisation, according to a categorisation system based on the land current regime and potential agricultural value as estimated by The Land Utilisation and Capability Indicator (LUCI) model.
Land 12 01243 g003
Figure 4. (A) Agricultural evaluation of the current land regime of Lincoln University Mount Grand Station (LUMGS) based on the user-defined land cover database, and (B) agricultural valuation examining if and where the land is over or under-utilisation, according to a categorisation system based on the current land regime and potential agricultural value based on the station topographic and climatic information as estimated by The Land Utilisation and Capability Indicator (LUCI) model.
Land 12 01243 g004
Figure 5. (A) Flood mitigation classification of Lincoln University Mount Grand Station based on the national land cover database (LCDB) and (B) based on the user-defined land cover database as estimated by The Land Utilisation and Capability Indicator (LUCI) model.
Land 12 01243 g005
Figure 6. (A) Potential C emission/sequestration estimation of Lincoln University Mount Grand Station based on the national landcover database, and (B) based on the user-defined land cover database as estimated by The Land Utilisation and Capability Indicator (LUCI) model.
Land 12 01243 g006
Figure 7. (A) Lincoln University Mount Grand Station erosion vulnerability and (B) sediment delivery vulnerability based on the national land cover database (LCDB), and (C) LUMGS erosion vulnerability and (D) sediment delivery vulnerability based on the user-defined land cover database as estimated by The Land Utilisation and Capability Indicator (LUCI) model.
Land 12 01243 g007
Figure 8. (A) Nitrogen accumulated load classification and (B) phosphorus accumulated load classification of Lincoln University Mount Grand station (LUMGS) based on the national land cover database (LCDB), and (C) nitrogen accumulated load classification and (D) phosphorus accumulated load classification of LUMGS based on the user-defined land cover database as estimated by The Land Utilisation and Capability Indicator (LUCI) model.
Land 12 01243 g008
Figure 9. Areas (red) of Lincoln University Mount Grand station where a management intervention to enhance one ecosystem service (agricultural productivity, flood mitigation, erosion control, C sequestration, reduction of sediment delivery, or reduction of N and P load) would negatively affect at least one of the others services (A) and areas (green) of Lincoln University Mount Grand station where multi ecosystem services (erosion, flood mitigation, nitrogen, and phosphorus concentration) are positively interacting and the priority of one does not negatively affect others (B) as estimated by The Land Utilisation and Capability Indicator (LUCI) model.
Land 12 01243 g009
Disclaimer/Publisher’s Note: The statements, opinions and data contained in all publications are solely those of the individual author(s) and contributor(s) and not of MDPI and/or the editor(s). MDPI and/or the editor(s) disclaim responsibility for any injury to people or property resulting from any ideas, methods, instructions or products referred to in the content.

