Abstract
In the past few decades, human activities have caused the emission of large amounts of carbon dioxide, which has severely impacted the Earth’s ecosystem and human health. Therefore, carbon reduction has become the focus of global attention. In this study, the Zhouyuan region of China, which is rich in ancient remains, is taken as an example. Based on the land use characteristics in 1990, 2000, 2010, and 2020, the spatial-temporal evolution of land use and carbon storage in the Zhouyuan region is simulated using four methods, including land use classification, land use transfer maps, patch-level land-use simulation (PLUS), and the integrated valuation of ecosystem services and trade-offs (InVEST) models under three scenarios, including the natural development scenario, urban development priority, and heritage conservation priority in 2030. According to the results, the carbon storage in the area in 2030 under all three scenario simulations has decreased compared with 2020, indicating that the region faces great challenges in achieving its targets of carbon peak and carbon neutrality. The paper points out four causes for the decrease in carbon storage, and five suggestions for increasing carbon storage are proposed, such as developing a carbon storage master plan, applying energy-saving technologies, establishing an ecological substitution mechanism, and so on. Through the study of carbon storage in the Zhouyuan region, this paper hopes to establish a mechanism to balance urban development, heritage conservation, and carbon sinks on the one hand, and encourage more scholars to participate in the study of carbon sinks in areas rich in ancient remains, so as to to jointly promote their healthy development on the other.
1. Introduction
Terrestrial ecosystem carbon storage is the sum of above-ground and below-ground organic carbon from vegetation, dead organic carbon, and soil organic carbon storage in the ecosystem [1]. Terrestrial ecosystems, as an important global carbon pool [2,3,4], not only reflect the production capacity of regional ecosystems to a certain extent, but also characterize the carrying capacity for carbon emissions of ecosystems [5]. Land use change can directly affect the carbon cycle process of the terrestrial ecosystem, making it an important factor causing the change in regional carbon sinks [6]. Therefore, the application of land use change is considered an essential tool to assess the carbon storage of regional terrestrial ecosystems [7,8].
Recent years have witnessed a slew of research at home and abroad on the driving mechanism of carbon storage in terrestrial ecosystems, the changes in carbon storage at different spatial scales and their effects, and the optimization of carbon storage calculation models on the basis of land use change. Regarding the driving mechanism of carbon storage, Zomer et al. pointed out that preserving the carbon sequestration capacity of agricultural soils is beneficial for decelerating the trend of global warming [9], and the same is true for protecting grassland ecosystems, according to Ma et al. [10]. Atkin et al. showed that plant ecosystems are the key to carbon storage and the culprit behind the “fate of carbon” [11,12]. Additionally, Yue et al. pointed out that the addition of N can enhance the carbon sink of the terrestrial ecosystems [13]. Furthermore, Morford et al. used forest ecosystems as an example to further confirm the critical role of increased N in enhancing carbon storage [14]. Regarding examples of carbon storage at different spatial scales, Pugh et al. investigated the impact of forests on carbon sinks from a global perspective [15]. In the Americas, Williams et al. explored the relationship between forests and carbon sinks in the U.S. [16]. Coffield et al. elaborated on the constraints of climatic factors on carbon storage in California’s wildland ecosystems [17]. In Asia, Asner et al. studied carbon storage changes in Malaysian Borneo [18]. Li et al. examined the spatial and temporal evolution of carbon storage in the Hangzhou region of China [19]. In Europe, Zaehle et al. projected the carbon storage of European land in 2100 based on land use [20], while Višković analyzed the carbon storage of Croatia [21]. In Africa, Ko et al. explored carbon capture and storage in South Africa [22]. In addition, Román conducted a systematic study on carbon capture and storage in three countries: Brazil, South Africa, and India [23]. In terms of optimizing carbon storage calculation models, Wang et al. proposed a method to improve the accuracy of land use change simulation based on the Markov-cellular automata mode [24]. Zhao et al. combined the PLUS and InVEST models to predict regional carbon storage [25]. Van der Voort et al. combined the SoilCASTOR model with remote sensing and machine learning to improve the accuracy of soil carbon calculations [26].
However, research on carbon storage methods or examples rarely involves areas rich in ancient remains. These areas are characterized by repeated changes in land use types, a tendency to fragment land use structures under strict heritage protection measures, and enormous urbanization pressure [27]. They are widely distributed worldwide, such as in Egypt in Africa, Mexico in the Americas, and the Levant in Asia. In addition, according to the results of the third survey of Chinese cultural relics, there are 766,722 ancient remains distributed in China alone (http://www.gov.cn/guoqing/2012-04/11/content_2584143.htm). Therefore, areas rich in ancient remains have become an essential spatial type for studying carbon storage in terrestrial ecosystems. Areas rich in ancient remains often have large amounts of cultivated land, forest land, and grassland, which have good carbon storage capabilities. However, with urbanization, the construction land area has soared, and the carbon storage capacity has decreased. During the process, the region has long been in a conflict between urban construction and heritage conservation [27], but carbon storage is often neglected in either choice of balanced strategies. Therefore, in the process of urbanization, it should focus on the area rich in ancient remains and increase the carbon storage capacity of the area under the premise of protecting cultural relics well. In the present paper, the Zhouyuan region of China is taken as a case study to explore the spatial-temporal evolution of carbon storage in areas rich in ancient remains under the influence of both urbanization and heritage conservation.
Located in the western part of the Guanzhong Plain in Shaanxi Province, the Zhouyuan region harbors abundant ancient remains; hence, it is known as “the cradle of Chinese civilization”. In the process of prosperous urbanization, a large amount of cultivated land, forest land, and grassland have been transformed into construction land, resulting in dramatic changes in the land use structure of the Zhouyuan region, making it one of the most prominent areas in the conflict between China’s urban construction and heritage conservation. In September 2020, the Chinese government proposed a goal of a carbon peak by 2030 and carbon neutrality by 2060 [28], under which great importance has been attached to the study on the carbon storage and the coordination of the relationship between urbanization, heritage conservation, and the increase of carbon storage in the region.
Based on the land use characteristics in 1990, 2000, 2010, and 2020, the spatial-temporal evolution of land use and carbon storage in the Zhouyuan region is simulated using four methods, including land use classification, land use transfer maps, PLUS, and InVEST models under three scenarios, including the natural development scenario, urban development priority, and heritage conservation priority in 2030. According to the study, the carbon storage in the Zhouyuan region in 2030 under all three scenario simulations has decreased compared with 2020, indicating that the region faces great challenges in achieving its targets of carbon peak and carbon neutrality. To increase the carbon storage in the region, the paper points out four causes for the decrease in carbon storage. Furthermore, five suggestions for increasing carbon storage are proposed, hoping to balance the relationship between the increase in carbon storage in the Zhouyuan region and its conservation of urbanization and heritage.
2. Materials and Methods
2.1. Overview of the Study Area and Data Sources
2.1.1. Overview of the Study Area
The Zhouyuan region is located in the western part of the Guanzhong Plain in Shaanxi Province. It is connected to the Qishui River in the east, the Qian River in the west, Qishan Mountain in the north, and the Wei River in the south, roughly located at 107°10’ E–108°5’ E, 34°15’ N–34°40’ N, with a total area of approximately 2389.26 km2 (Figure 1). It mainly includes parts of Chencang District, Fengxiang District, Meixian County, Qishan County, and Fufeng County in Baoji City, parts of Yangling District in Xi’an City, and parts of Wugong County and Qianxian County in Xianyang City. These counties all belong to the warm temperate semi-humid continental monsoon climate zone, with high temperatures and rain in summer and cold temperatures and little snow in winter. In addition, these counties also embrace four distinct seasons, with an average annual temperature of 10 °C–14 °C and an average annual precipitation of 600 mm–700 mm.
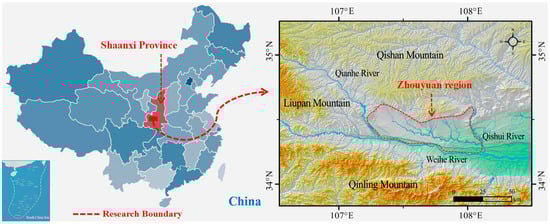
Figure 1.
Research scope map.
The Zhouyuan region is rich in ancient remains; hence, it is the cradle of Chinese civilization. As far back as the Neolithic period (circa 10000 BC–2000 BC), there were human activities in the Zhouyuan region, such as at the Yijiabu site in Fufeng County [29] and the Shuang’an site in Qishan County [30]. In addition, the Zhouyuan region also preserves many ancient remains from the Shang Dynasty (1600 BC–1046 BC), Western Zhou Dynasty (1046 BC–771 BC), Eastern Zhou Dynasty (770 BC–256 BC), Qin Dynasty (221 BC–207 BC), Han Dynasty (202 BC–220 AD), Sui Dynasty (581 AD–618 AD), Tang Dynasty (618 AD–907 AD), etc. The most representative sites are the Zhouyuan site in the Western Zhou Dynasty [31] and the Yongcheng site of Qin in the Eastern Zhou Dynasty [32]. To display the rich ancient remains in the Zhouyuan region more intuitively, the paper drew a distribution map of ancient remains in the Zhouyuan region during the main historical periods (Figure 2) and compiled a list of ancient remains that have been included in the provincial and national key cultural relics protection units (Table 1), according to the Chinese Cultural Relics Atlas Shaanxi branch [33]. In Figure 2, the red dots indicate the locations of ancient remains, and the red dots in the Neolithic figure represent the distribution of ancient remains from the Neolithic period found in the Zhouyuan region to date, and so on. Six maps of the distribution of sites in the Zhouyuan region are drawn for the Neolithic, Shang Dynasty, Western Zhou Dynasty, Eastern Zhou Dynasty, Qin and Han Dynasties, and Sui and Tang Dynasties.
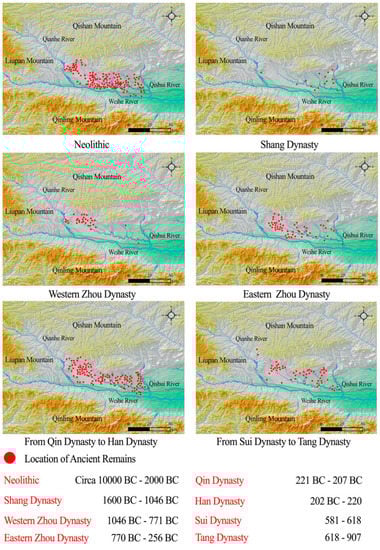
Figure 2.
Ancient remains distribution in Zhouyuan region.

Table 1.
National and provincial key ancient remains in Zhouyuan region.
2.1.2. Data Sources
In this study, data resources for the Zhouyuan region were obtained from remote sensing images of LandSat 5 TM in 1990 and 2010, LandSat 7 ETM+ in 2000, and LandSat 8 OLI in 2020. These original images spanning nearly 30 years come from the USGS (http://glovis.usgs.gov/) website, using the US-developed WGS84 Universal Transverse Mercator (WGS84UTM) coordinate system. The spatial resolution of images for all years was 30 m, and the strip number/line was 128/36. These images were taken from May to June with less than 2% cloudiness. Using ArcGIS 10.1 and ENVI5.1 software, the paper pre-processed the raw images with geometric correction, image alignment, mosaic, crop, enhancement, and supervised classification on the one hand, and further interpreted and analyzed the remote sensing images on the other.
2.2. Research Methodology
2.2.1. Method Overview
In the present paper, four methods, including the land use classification model, the land use transfer map model, the PLUS model, and the InVEST model, were used to investigate the effect of land use change on carbon storage in the Zhouyuan region from 1990 to 2020 and predict the carbon storage in the region in 2030. The research methodology could be divided into three steps (Figure 3): (1) Based on remote sensing image interpretation, this paper investigated the land use structural and transfer changes in the Zhouyuan region from 1990 to 2020 using the land classification model and the land transfer map model. (2) Based on the land use changes from 1990 to 2020, the PLUS model was used to simulate the land use structure of the Zhouyuan region in 2030 under three scenarios, such as the natural development scenario, the urban development priority, and the heritage conservation priority. (3) The InVEST model was used to study changes in carbon storage among land use types over the past three decades, and simulate the carbon storage of each land use type in the Zhouyuan region under the three scenarios in 2030, respectively.
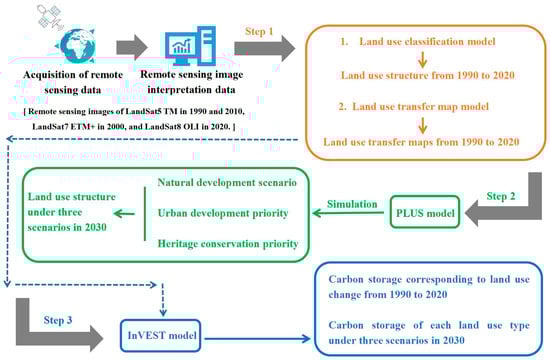
Figure 3.
Method flow chart.
2.2.2. Land Use Classification Model and Land Use Transfer Map Model
Based on remote sensing image data from 1990, 2000, 2010, and 2020, and referring to the classification criteria for current land use status in China (GB/T 21010–2017), the study area was classified into six categories using the maximum likelihood classification: cultivated land (CL), forest land (FL), grassland (GL), water area (WA), construction land (COL), and unutilized land (UL). The land use change drivers are 14 in total, including 6 natural driving factors and 8 social driving factors (Table 2). Among the natural drivers, the annual average temperature and precipitation were obtained from the National Weather Science Database (http://www.nmic.cn/) using inverse distance interpolation. In terms of social drivers, the distances to roads, railways, cities, and water bodies were calculated using the ArcGIS Euclidean Distance Analysis tool. Then, the image interpretation data were calibrated through actual surveys and the government’s land use update data (http://www.baoji.gov.cn/; http://www.xa.gov.cn/; http://www.xianyang.gov.cn/). The calculation of the land use classification model and land use transfer map mode was consistent with Chen et al. [27].
Table 2.
Drivers of land use change in Zhouyuan region.
2.2.3. PLUS Model
The PLUS model is a land-use simulation tool based on cellular automata (CA), with higher simulation accuracy than other models [34]. The model consists of two modules: the land expansion analysis strategy (LEAS) and the CA model based on multi-type random patch seeds (CARS). See the Supplementary Materials of the paper for detailed calculation formulas for LEAS and CARS.
In this paper, the specific parameters of the PLUS model were set as follows: (1) The LEAS module: the number of regression trees was 50, the sampling rate was 0.01, and the mTry was 9. (2) The CARS module: the thread was 0.9, the neighborhood size was 3, the expansion coefficient was 0.5, and the patch generation was 0.5. (3) Three development scenarios: natural development scenario (ND), urban development priority (UD), and heritage conservation priority (HC). In ND, the land use structure of the Zhouyuan region in 2030 was predicted based on land use transfer data from 1990 to 2020 combined with the Markov model. In UD, priority was given to the development of COL, and its transfer out is restricted. The probability of transferring FL, CL, GL, and UL to COL increased by 40%, 30%, 30%, and 20%, respectively. In HC, priority was given to the protection of ancient remains. The probability of transferring CL to FL increased by 40%, the probability of transferring FL and GL to COL was reduced by 40%, and the probability of transferring UL to FL and GL increased by 20%. (4) Accuracy verification: The paper established a confusion matrix using land use data from 1990 to 2020. The results showed that the kappa coefficients were all above 0.9, meeting the accuracy requirements of land use simulation in the PLUS model. See Supplementary Materials for a detailed confusion matrix.
2.2.4. InVEST Model
The InVEST model, namely, the integrated valuation of ecosystem services and trade-offs model, is a tool for assessing the quantity and economic value of ecosystem service functions [35,36]. It mainly consists of four carbon pools, including carbon of above-ground biomass (C-above), carbon of below-ground biomass (C-below), carbon of soil organic matter (C-soil), and carbon of dead organic matter (C-dead). Based on the assumption that the carbon density of a given type is a constant that does not vary with time, the InVEST model can estimate the carbon storage of a specific region in combination with land use data. The calculation formula is as follows:
In Formulas (1) and (2), i is the ith land use type, Ci is the ith total carbon density (t/hm2), Ci-above is the ith above-ground biomass carbon density, Ci-below is the ith below-ground biomass carbon density, Ci-soil is the ith soil organic matter carbon density, and Ci-dead is the ith dead organic carbon density. Ctotal is the total carbon storage (t), n is the total number of land-use types, and Si is the area of ith land use type (hm2).
Carbon density is the most important factor affecting the total carbon storage in the study area, which should be determined by large-scale soil sampling [37,38]. Due to time and cost constraints, many scholars can only use existing sources of carbon density data from the literature [39,40,41]. Based on existing literature [42,43], this paper prioritizes carbon density data from Xi’an, Xianyang, and Baoji cities in Shaanxi Province, followed by carbon density data from the same climatic regions. Sources of carbon intensity data for different land use types are shown in Table 3. See the Supplementary Materials for more detailed formulas.
Table 3.
Carbon density of each land use type in Zhouyuan region (t/hm2).
3. Results
3.1. Land Use Structure from 1990 to 2020
Using ENVI software, the area and proportion of land use types in the Zhouyuan region in 1990, 2000, 2010, and 2020 were extracted by interpreting remote sensing images. Table 4 and Figure 4 show the six land use changes in CL, FL, GL, COL, WA, and UL in the area over the past three decades.
Table 4.
Land use structure from 1990 to 2020.
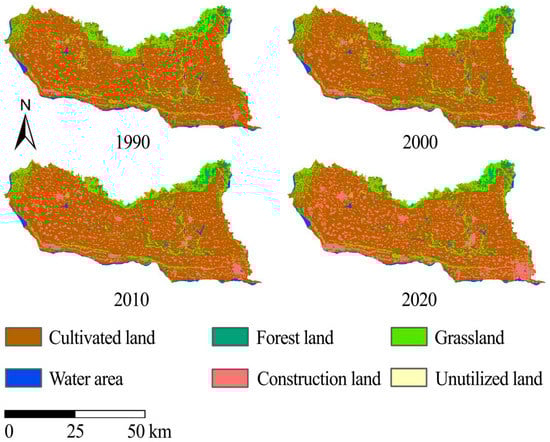
Figure 4.
Land use structure map from 1990 to 2020.
The results showed that CL was the dominant land use type in the Zhouyuan region, followed by COL. The proportion of CL remained above 65% over the past three decades but has significantly declined from 71.72% in 1990 to 66.11% in 2020, a decrease of 5.61% and a reduction of 133.96 km2. However, COL has sharply increased, from 282.48 km2 in 1990 to 462.37 km2 in 2020, an increase of 179.89 km2 or 63.68% compared with 1990. Meanwhile, the reduction in GL was also apparent, with a total reduction of 51.99 km2, or 17.57%, from 1990 to 2020. In addition, FL increased slightly, while WA and UL remained almost unchanged.
3.2. Land Use Transfer Process from 1990 to 2020
Based on land use classification, this paper used ArcGIS to generate land use transfer maps for three periods within the study area, including 1990–2000, 2000–2010, and 2010–2020.
As shown in Table 5 and Figure 5, the conversion of CL to COL (code: 15), FL to COL (code: 25), GL to COL (code: 35), and WA to COL (code: 45) were all very significant during 1990–2020, with a total transfer volume of 191.47 km2, 3.5 km2, 12.36 km2, and 3.09 km2, respectively. Baoji and Xianyang exhibited the fastest change over the last decade due to their rapid expansion of urban areas. For example, converting CL to COL alone was as high as 103.73 km2. In addition, within 30 years, the conversion of FL to GL (code: 23) was 2.65 km2, along with the recession of GL and WA, indicating that the Zhouyuan region may face certain ecological destruction.
Table 5.
Land use change of Zhouyuan from 1990 to 2020.
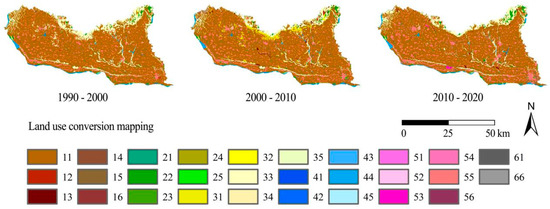
Figure 5.
Land use transfer map from 1990 to 2020.
3.3. Land Use Structure Simulation under Three Scenarios in 2030
Based on the land use evolution from 1990 to 2020, combined with driving factors and the PLUS model, this paper simulated the spatial distribution and structural composition of land use in the Zhouyuan region in 2030 under three scenarios: ND, UD, and HC. As shown in Table 6 and Figure 6, generally, compared with 2020, the COL increased in all three scenarios by 38.06 km2 (ND), 77.97 km2 (UD), and 2.66 km2 (HC), respectively. Specifically, in the ND scenario, the land use structure continued the same trend of change as in the previous three decades. The CL area has decreased to 1548.61 km2, and the COL area has increased to 500.43 km2, and this change mainly occurs in Xianyang City and its surrounding areas. Under the UD scenario, urbanization accelerates, and by 2030, the CL of Baoji and Xianyang will sharply decline, while the COL will soar to 1494.05 km2 and 540.34 km2, respectively. In the HC scenario, CL and COL change slightly, and FL and GL have increased to 51.43 km2 and 244.69 km2, respectively.
Table 6.
Land use structure simulation of Zhouyuan region under three scenarios in 2030 (km2).
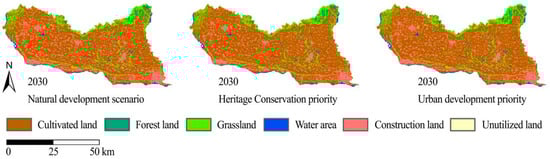
Figure 6.
Land use structure simulation of Zhouyuan region in 2030.
3.4. Changes in Carbon Storage
3.4.1. Changes in Carbon Storage from 1990 to 2020
According to the land use evolution, this paper uses the InVEST model to study the changes in carbon storage in the Zhouyuan region from 1990 to 2020. In Table 7, the changes in COL show the most significant impact on carbon storage. Specifically, due to the increase in COL, the carbon storage in the Zhouyuan region showed a net decrease of 331,035.56 tons, 847,272.80 tons, and 1,264,520.00 tons in 1990–2000, 2000–2010, and 2010–2020, respectively. In addition, the increase in carbon storage in the region over the past three decades was mainly due to the conversion of CL or WA to FL and GL, with a cumulative increase of 441,660.24 tons.
Table 7.
Carbon storage corresponding to land use change in Zhouyuan region from 1990 to 2020.
3.4.2. Carbon Storage Simulation in 2030
Based on the PLUS model to predict the future land use structure, the study simulated the carbon storage of the Zhouyuan region in 2030 using the InVEST model. The carbon storage data and spatial distribution in the three scenarios are shown in Table 8 and Figure 7.
Table 8.
Carbon storage of each land use type under three scenarios in Zhouyuan region.
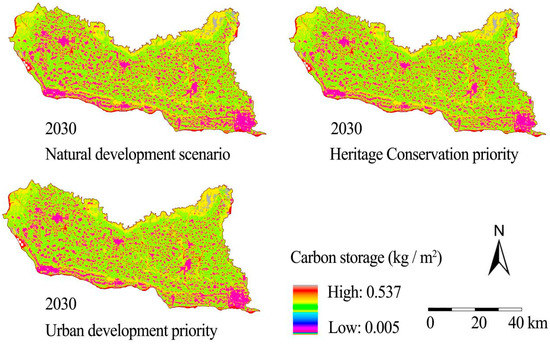
Figure 7.
Carbon storage of Zhouyuan region under three scenarios in 2030.
The carbon storage of the Zhouyuan region by 2030 is estimated to be 31,271.33 × 105 tons, 30,654.37 × 105 tons, and 31,668.45 × 105 tons in the ND, UD, and HC scenarios, respectively. Compared with 2020, they will decrease by 481.53 × 10⁵ tons, 1098.49 × 105 tons, and 84.41 × 10⁵ tons, respectively. Moreover, in Figure 7, the areas with low carbon storage in all three scenarios are located along the Weihe River in the south and in the urban built-up area. However, compared with ND and UD, the color patches indicating high carbon storage, such as the increase of green, yellow, and red in the HC scenario, are mainly concentrated in the northern foothills.
4. Discussion
This study was the first to analyze the spatial-temporal evolution of carbon storage in areas rich in ancient cultural remains at home and abroad using multiple models. Based on the land use classification and transfer map model from 1990 to 2020, the PLUS model was used to predict the land use structure of the Zhouyuan region in 2030 under three different scenarios. On this basis, the InVEST model was used to analyze the spatial-temporal changes in carbon storage in the region during the past three decades, and the carbon storage in 2030 was simulated. The combination of these methods improved the efficiency and accuracy of this study.
The results showed that from 1990 to 2020, the CL area in the Zhouyuan region plummeted, while the COL area increased dramatically, indicating that this region has been in a period of rapid urbanization during the past three decades. During this process, along with the conversion of a large amount of CL to COL and the degradation of a large amount of FL and GL due to destruction, the carbon storage in the Zhouyuan region decreased drastically.
4.1. Comparative Analysis of the Three Scenarios
In the simulation of carbon storage in the three scenarios in 2030, the carbon storage in the Zhouyuan region was reduced in all scenarios compared with that in 2020. Specifically, in the ND scenario, the areas of CL, FL, and GL are shrinking, the area of COL is increasing, and the carbon storage in the Zhouyuan region is decreasing. In the UD scenario, the priority given to urban construction leads to a sharp decrease in CL and a spike in COL. As a result, the carbon storage in the region has precipitously declined. In the HC scenario, the expansion of artificial land such as COL is restricted to a certain extent, and environmental protection measures are strengthened. Hence, carbon storage in the region has decreased slightly, with a cumulative decrease of 84.41 × 10⁵ tons by 2030. The simulation results of carbon storage reduction under all three scenarios indicate that the increase in carbon storage in the Zhouyuan region faces major challenges. However, HC should be the optimal strategy for the region’s goal of carbon neutrality.
4.2. Causes of Carbon Storage Decline
The Zhouyuan region is rich in ancient remains. Despite a series of measures introduced by the local government to protect cultural relics, a large amount of CL is still converted into COL in the surging wave of urbanization, directly leading to carbon storage reduction in the area.
According to the simulation results, this situation will also remain unchanged in 2030. In the ND and UD scenarios, the reduction of carbon storage is noticeable when urban construction maintains a high growth rate. However, in the HC scenario, the carbon storage in the Zhouyuan region in 2030 still decreases after strict measures have been taken, indicating that it is a challenge to achieve carbon neutrality in areas rich in ancient remains. This paper tentatively identifies four specific causes. (1) During the process of urbanization, accompanied by the expropriation of a large amount of CL for urban construction, many ancient remains have been discovered simultaneously. However, most of them were backfilled after being cleaned by archaeologists, and the site continued to be used for urban construction. Therefore, the discovery of ancient remains did not stop the pace of urban construction, but they were mercilessly abandoned during the construction process. (2) Some significant ancient remains, such as the Zhouyuan Shaochen site [44], are mainly protected by building museums, which are also essentially urban construction. Huge buildings and other artificial facilities are encroaching on CL, leading to a reduction in carbon storage. (3) Numerous archaeological excavations of ancient remains are underway in the Zhouyuan region. These archaeological sites occupied tremendous amounts of CL, FL, and GL and lasted for an extended period. For example, the archaeological work at the Zhouyuan site has been going on for about 50 years [45]. Prolonged anthropogenic disturbance of large amounts of CL and other lands is also essential for the decline of carbon storage in this region. (4) The neglect of FL and GL in the conservation of cultural relics has led to ecological damage. For example, in the Baoji Zhouyuan Museum, many buildings, paving, and other artificial facilities have been constructed, but the green space is minimal. This ecological damage due to heritage conservation without proper ecological restoration has further exacerbated the reduction of carbon storage in the region.
4.3. Suggestions for Improving Carbon Storage
The Zhouyuan region is still in the process of rapid urbanization. The conversion of CL, FL, and GL to other artificial lands, such as COL, will continue for a long time, resulting in a severe crisis of carbon storage increase in this area. To achieve the Chinese government’s goal of peaking carbon by 2030 and becoming carbon neutral by 2060 [28], this paper proposes five recommendations. (1) On the basis of the overall urban master plan and cultural relics protection plan, a carbon storage master plan should be formulated as soon as possible to coordinate the relationship between urban development, cultural relics protection, and carbon storage, so as to avoid the phenomenon of low-carbon storage that occurs in the region due to rapid urbanization and one-sided emphasis on cultural relics protection. (2) People should apply energy-saving and low-carbon technologies to heritage conservation, explore new ways of heritage conservation, and coordinate the balance between heritage conservation and carbon storage. For example, when building museums, recycled materials are used to reduce carbon emissions and meet green building standards. (3) While excavating archaeological sites, attention should be paid to protecting the ecological environment and avoiding large-scale and long-term occupation of CL, FL, GL, and WA. (4) Exploration should be carried out to establish an ecological substitution mechanism to maintain the carbon storage in the region by increasing CL, FL, and GL on related land in an off-site area due to heritage conservation. (5) A carbon trading system suitable for heritage conservation should be established, and relevant parties must purchase carbon indicators or pay the penalty to reduce carbon storage caused by heritage conservation.
The study on carbon storage in the Zhouyuan region shows the difficulty of increasing carbon storage in areas rich in ancient remains during the wave of urbanization. With the further acceleration of China’s urbanization process, the conflict between the increase in carbon storage and urban expansion in the region will become more acute. To achieve the goals of carbon neutrality and carbon peak, how to balance the relationship between carbon storage and urbanization in areas rich in ancient remains through technical, economic, or administrative means will become an essential issue for scholars at home and abroad.
Based on the land use characteristics in 1990, 2000, 2010, and 2020, this paper simulated the spatial-temporal evolution of land use and carbon storage in the Zhouyuan region in 2030 under three scenarios, such as the natural development scenario, the urban development priority, and the heritage conservation priority, using a combination of four models, including the land use classification model, the land use transfer map model, the PLUS model, and the InVEST model. The results showed the challenges of increasing carbon storage in the Zhouyuan region and proposed relevant suggestions to increase carbon storage in the region. Compared with the study of carbon storage in metropolitan areas and other geographic pattern units, this paper is the first quantitative research on the spatial-temporal evolution and prediction of carbon storage in areas rich in ancient remains based on the distribution of historical monuments, using the Zhouyuan region as a case study. The authors hope this paper will provide some references and cases for the study of carbon neutralization and carbon peaking in areas rich in ancient remains.
Despite the meaningful results and findings of this study, in-depth exploration and discussion of other issues are needed in further studies. Carbon neutrality and carbon peaking are complex issues. In addition to carbon storage, carbon emissions remain indispensable. However, only carbon storage was discussed in this study, which may not be sufficient to fully reveal the issues of carbon sinks in areas rich in ancient remains, making it necessary to integrate carbon storage with carbon emissions in future research, so as to provide more accurate recommendations for achieving carbon neutrality and carbon peak goals in areas rich in ancient remains. In addition, this paper needs to be optimized for constructing and evaluating the PLUS and InVEST models. In the future, the authors will further construct carbon pools based on field treks and experiments to simulate and explore the carbon storage situation in the study area more objectively.
5. Conclusions
In the process of urbanization, areas rich in ancient remains face a contradiction between heritage conservation and urban construction. With the realization of the strategic goals of carbon neutrality and carbon peak, carbon sink has become a new challenge in this area. For example, in the simulation of carbon storage in the three scenarios in 2030, the carbon storage in the Zhouyuan region was reduced in all scenarios compared with that in 2020, indicating that the Zhouyuan region has some difficulties in increasing carbon storage. However, heritage conservation priorities should be the optimal strategy for the region’s carbon neutrality goal. Through the study of carbon storage in the Zhouyuan region, this paper hopes to establish a mechanism to balance urban development, heritage conservation, and carbon sinks on the one hand, and encourage more scholars to participate and apply more new methods in the study of carbon sinks in areas rich in ancient remains on the other, so as to jointly promote their healthy development on the other.
Supplementary Materials
The following supporting information can be downloaded at: https://www.mdpi.com/article/10.3390/land12061266/s1. Tables S1–S4: Confusion matrix for land use classification accuracy verification from 1990 to 2020. The authors confirm that the data supporting the findings of this study are available within the article and its supplementary materials.
Author Contributions
Conceptualization, J.C. and Y.Z.; methodology, J.C.; software, J.C. and K.W.; validation, J.C. and X.Z.; formal analysis, J.C. and K.W.; investigation, J.C., Z.Y. and W.Z.; resources, Y.Z. and L.N.; data curation, J.C. and X.Z.; writing—original draft preparation, J.C.; writing—review and editing, J.C. and X.Z.; visualization, J.C. and Z.Y.; supervision, J.C. and Y.Z.; project administration, Y.Z. and L.N.; funding acquisition, Y.Z. and X.Z. All authors have read and agreed to the published version of the manuscript.
Funding
This research was funded by the National Natural Science Foundation of China, grant number 31971690, and the Forestry Science and Technology Innovation Project of Shaanxi Province, grant number SXLK2023-02-25.
Data Availability Statement
The authors confirm that the data supporting the findings of this study are available within the article and its Supplementary Materials.
Acknowledgments
We are so grateful to the anonymous reviewers and editors for their suggestions.
Conflicts of Interest
The authors declare no conflict of interest.
References
- Li, J.P.; Xia, S.X.; Yu, X.B.; Li, S.X.; Xu, C.; Zhao, N.; Wang, S.T. Evaluation of Carbon Storage on Terrestrial Ecosystem in Hebei Province Based on InVEST Model. J. Ecol. Rural Environ. 2020, 36, 854–861. [Google Scholar] [CrossRef]
- Fernández-Martínez, M.; Peñuelas, J.; Chevallier, F.; Ciais, P.; Obersteiner, M.; Rödenbeck, C.; Sardans, J.; Vicca, S.; Yang, H.; Sitch, S. Diagnosing destabilization risk in global land carbon sinks. Nature 2023, 615, 848–853. [Google Scholar] [CrossRef] [PubMed]
- Cook, J.; Oreskes, N.; Doran, P.; Anderegg, W.; Verheggen, B.; Maibach, E.W.; Nuccitelli, D. Consensus on consensus: A synthesis of consensus estimates on human-caused global warming. Environ. Res. Lett. 2016, 11, 048002. [Google Scholar] [CrossRef]
- Bose, B. Global warming: Energy, environmental pollution, and the impact of power electronics. IEEE Ind. Electron. Mag. 2010, 4, 6–17. [Google Scholar] [CrossRef]
- Goldberg, M.H.; van der Linden, S.; Maibach, E.; Leiserowitz, A. Discussing global warming leads to greater acceptance of climate science. Proc. Natl. Acad. Sci. USA 2019, 116, 14804–14805. [Google Scholar] [CrossRef]
- Brönnimann, S. Global warming (1970–present). In The Palgrave Handbook of Climate History; Springer: Berlin/Heidelberg, Germany, 2018; pp. 321–328. [Google Scholar] [CrossRef]
- Wang, S.; Zhang, Y.; Ju, W.; Chen, J.M.; Ciais, P.; Cescatti, A.; Sardans, J.; Janssens, I.A.; Wu, M.; Berry, J.A. Recent global decline of CO2 fertilization effects on vegetation photosynthesis. Science 2020, 370, 1295–1300. [Google Scholar] [CrossRef]
- Fernández-Martínez, M.; Sardans, J.; Chevallier, F.; Ciais, P.; Obersteiner, M.; Vicca, S.; Canadell, J.; Bastos, A.; Friedlingstein, P.; Sitch, S. Global trends in carbon sinks and their relationships with CO2 and temperature. Nat. Clim. Chang. 2018, 9, 73–79. [Google Scholar] [CrossRef]
- Zomer, R.J.; Bossio, D.A.; Sommer, R.; Verchot, L.V. Global sequestration potential of increased organic carbon in cropland soils. Sci. Rep. 2017, 7, 1–8. [Google Scholar] [CrossRef]
- Ma, A.; He, N.; Yu, G.; Wen, D.; Peng, S. Carbon storage in Chinese grassland ecosystems: Influence of different integrative methods. Sci. Rep. 2016, 6, 1–10. [Google Scholar] [CrossRef]
- Atkin, O. New Phytologist and the ‘fate’ of carbon in terrestrial ecosystems. New Phytol. 2015, 205, 1–3. [Google Scholar] [CrossRef]
- Bhadra, P.; Maitra, S.; Shankar, T.; Hossain, A.; Praharaj, S.; Aftab, T. Climate change impact on plants: Plant responses and adaptations. In Plant Perspectives to Global Climate Changes; Elsevier: Amsterdam, The Netherlands, 2022; pp. 1–24. [Google Scholar] [CrossRef]
- Yue, K.; Peng, Y.; Peng, C.; Yang, W.; Peng, X.; Wu, F. Stimulation of terrestrial ecosystem carbon storage by nitrogen addition: A meta-analysis. Sci. Rep. 2016, 6, 19895. [Google Scholar] [CrossRef]
- Morford, S.L.; Houlton, B.Z.; Dahlgren, R.A. Increased forest ecosystem carbon and nitrogen storage from nitrogen rich bedrock. Nature 2011, 477, 78–81. [Google Scholar] [CrossRef] [PubMed]
- Pugh, T.A.; Arneth, A.; Kautz, M.; Poulter, B.; Smith, B. Important role of forest disturbances in the global biomass turnover and carbon sinks. Nat. Geosci. 2019, 12, 730–735. [Google Scholar] [CrossRef] [PubMed]
- Williams, C.A.; Collatz, G.J.; Masek, J.; Goward, S.N. Carbon consequences of forest disturbance and recovery across the conterminous United States. In Global Biogeochemical Cycles; Wiley: Hoboken, NJ, USA, 2012; Volume 26. [Google Scholar] [CrossRef]
- Coffield, S.; Hemes, K.; Koven, C.; Goulden, M.; Randerson, J. Climate-driven limits to future carbon storage in California’s wildland ecosystems. AGU Adv. 2021, 2, e2021AV000384. [Google Scholar] [CrossRef]
- Asner, G.P.; Brodrick, P.G.; Philipson, C.; Vaughn, N.R.; Martin, R.E.; Knapp, D.E.; Heckler, J.; Evans, L.J.; Jucker, T.; Goossens, B. Mapped aboveground carbon stocks to advance forest conservation and recovery in Malaysian Borneo. Biol. Conserv. 2018, 217, 289–310. [Google Scholar] [CrossRef]
- Li, Y.; Yao, S.; Jiang, H.; Wang, H.; Ran, Q.; Gao, X.; Ding, X.; Ge, D. Spatial-Temporal Evolution and Prediction of Carbon Storage: An Integrated Framework Based on the MOP–PLUS–InVEST Model and an Applied Case Study in Hangzhou, East China. Land 2022, 11, 2213. [Google Scholar] [CrossRef]
- Zaehle, S.; Bondeau, A.; Carter, T.R.; Cramer, W.; Erhard, M.; Prentice, I.C.; Reginster, I.; Rounsevell, M.D.; Sitch, S.; Smith, B. Projected changes in terrestrial carbon storage in Europe under climate and land-use change, 1990–2100. Ecosystems 2007, 10, 380–401. [Google Scholar] [CrossRef]
- Višković, A.; Franki, V.; Valentić, V. CCS (carbon capture and storage) investment possibility in South East Europe: A case study for Croatia. Energy 2014, 70, 325–337. [Google Scholar] [CrossRef]
- Ko, Y.-C.; Zigan, K.; Liu, Y.-L. Carbon capture and storage in South Africa: A technological innovation system with a political economy focus. Technol. Forecast. Soc. Chang. 2021, 166, 120633. [Google Scholar] [CrossRef]
- Román, M. Carbon capture and storage in developing countries: A comparison of Brazil, South Africa and India. Glob. Environ. Chang. 2011, 21, 391–401. [Google Scholar] [CrossRef]
- Wang, S.Q.; Zheng, X.; Zang, X. Accuracy assessments of land use change simulation based on Markov-cellular automata model. Procedia Environ. Sci. 2012, 13, 1238–1245. [Google Scholar] [CrossRef]
- Zhao, M.; He, Z.; Du, J.; Chen, L.; Lin, P.; Fang, S. Assessing the effects of ecological engineering on carbon storage by linking the CA-Markov and InVEST models. Ecol. Indic. 2019, 98, 29–38. [Google Scholar] [CrossRef]
- van der Voort, T.S.; Verweij, S.; Fujita, Y.; Ros, G.H. Enabling soil carbon farming: Presentation of a robust, affordable, and scalable method for soil carbon stock assessment. Agron. Sustain. Dev. 2023, 43, 22. [Google Scholar] [CrossRef]
- Chen, J.; Zhang, Y.; Liu, X.; Sun, X. Analysis of spatial-temporal evolution of landscape patterns in ancient large city-sites based on multi-temporal Landsat imagery: A case study of the Zhouyuan site region in China. Eur. J. Remote Sens. 2022, 55, 471–484. [Google Scholar] [CrossRef]
- Liu, W.D.; Jiang, W.B.; Tang, C.P.; Han, M.Y. A study on the pathway to carbon peak by 2030 in China—A portfolio analysis based on GDP growth rate. Sci. Sin. (Terrae) 2022, 52, 1268–1282. Available online: https://www.cnki.com.cn/Article/CJFDTOTAL-JDXK202207005.htm (accessed on 3 April 2023).
- Sun, H.; Liu, X. Briefing on the excavation of Yijiaobu site in Fufeng County. Archaeology 1993, 5–13+41. Available online: https://www.cnki.com.cn/Article/CJFDTOTAL-KAGU199301001.htm (accessed on 3 April 2023).
- Liu, J.S. An overview of Neolithic agricultural archaeology in the Baoji area of Shaanxi. Agric. Archaeol. 1990, 98–103. Available online: https://www.cnki.com.cn/Article/CJFDTOTAL-NOSE199001012.htm (accessed on 7 April 2023).
- Chen, J.; Niu, L.X.; Song, J.N.; Wang, K.; Zhang, Y.L. Analysis on Landscape Elements of Courtyard Building A of Fengchu in Zhouyuan Site in the Early Western Zhou Dynasty. Landsc. Archit. Acad. J. 2023, 40, 101–110. [Google Scholar] [CrossRef]
- Hu, Y.T.; Tian, Y.Q. An archaeological observation on the evolution of the military fortification of Qin Yongcheng. Relics Mus. 2023, 57–65. Available online: https://www.cnki.com.cn/Article/CJFDTOTAL-WEBO202301007.htm (accessed on 7 April 2023).
- Bureau, C.C.H. Chinese Cultural Relics Atlas Shaanxi Branch; Xi’an Map Publisher: Xi’an, China, 1998. [Google Scholar]
- Liang, X.; Guan, Q.; Clarke, K.C.; Liu, S.; Wang, B.; Yao, Y. Understanding the drivers of sustainable land expansion using a patch-generating land use simulation (PLUS) model: A case study in Wuhan, China. Comput. Environ. Urban Syst. 2021, 85, 101569. [Google Scholar] [CrossRef]
- Sharp, R.T.; Tallis, H.; Ricketts, T.; Guerry, A.D.; Wood, S.A.; Chaplin-Kramer, R.; Nelson, E.; Ennaanay, D.; Wolny, S.; Olwero, N.; et al. InVEST 3.12.0 User’s Guide; Collaborative Publication by The Natural Capital Project, Stanford University, the University of Minnesota, The Nature Conservancy, and the World Wildlife Fund; Stanford University: Stanford, CA, USA, 2018; Available online: https://naturalcapitalproject.stanford.edu/software/invest (accessed on 6 April 2023).
- Babbar, D.; Areendran, G.; Sahana, M.; Sarma, K.; Raj, K.; Sivadas, A. Assessment and prediction of carbon sequestration using Markov chain and InVEST model in Sariska Tiger Reserve, India. J. Clean. Prod. 2021, 278, 123333. [Google Scholar] [CrossRef]
- Deluz, C.; Nussbaum, M.; Sauzet, O.; Gondret, K.; Boivin, P. Evaluation of the potential for soil organic carbon content monitoring with farmers. Front. Environ. Sci. 2020, 8, 113. [Google Scholar] [CrossRef]
- Vos, C.; Don, A.; Hobley, E.U.; Prietz, R.; Heidkamp, A.; Freibauer, A. Factors controlling the variation in organic carbon stocks in agricultural soils of Germany. Eur. J. Soil Sci. 2019, 70, 550–564. [Google Scholar] [CrossRef]
- Bellassen, V.; Angers, D.; Kowalczewski, T.; Olesen, A. Soil carbon is the blind spot of European national GHG inventories. Nat. Clim. Chang. 2022, 12, 324–331. [Google Scholar] [CrossRef]
- Badgery, W.; Murphy, B.; Cowie, A.; Orgill, S.; Rawson, A.; Simmons, A.; Crean, J. Soil carbon market-based instrument pilot–the sequestration of soil organic carbon for the purpose of obtaining carbon credits. Soil Res. 2020, 59, 12–23. [Google Scholar] [CrossRef]
- Pechanec, V.; Purkyt, J.; Benc, A.; Nwaogu, C.; Štěrbová, L.; Cudlín, P. Modelling of the carbon sequestration and its prediction under climate change. Ecol. Inform. 2018, 47, 50–54. [Google Scholar] [CrossRef]
- Wang, J.M.; Fan, L.; Han, D.; Chen, L. Quantification and configuration of carbon sink matrix for green space in Xi’an under the goal of “double carbon”. Chin. Landsc. Archit. 2023, 39, 108–113. Available online: https://www.cnki.com.cn/Article/CJFDTOTAL-ZGYL202302017.htm (accessed on 11 April 2023).
- Zhou, T.T.; Cui, J.X. GIS-based analysis of spatial and temporal distribution and driving forces of Guanzhong area settlements from Yangshao to Shang and Zhou Dynasties. J. Earth Environ. 2022, 13, 163–175+195. Available online: https://www.cnki.com.cn/Article/CJFDTOTAL-DQHJ202202003.htm (accessed on 14 April 2023).
- Zhouyuan Archaeological Team. Briefing on the excavation of the foundation site of the Western Zhou complex in Shaochen, Fufeng. Cult. Relics 1981, 10–22+97. Available online: https://www.cnki.com.cn/Article/CJFDTOTAL-WENW198103001.htm (accessed on 21 April 2023).
- Zhouyuan Archaeological Team. Briefing on the excavation of the Western Zhou bronze cellar at Zhuangbai No. 1, Fufeng. Cult. Relics 1978, 1–18+98–104. Available online: https://www.cnki.com.cn/Article/CJFDTOTAL-WENW197803000.htm (accessed on 23 April 2023).


Disclaimer/Publisher’s Note: The statements, opinions and data contained in all publications are solely those of the individual author(s) and contributor(s) and not of MDPI and/or the editor(s). MDPI and/or the editor(s) disclaim responsibility for any injury to people or property resulting from any ideas, methods, instructions or products referred to in the content. |
© 2023 by the authors. Licensee MDPI, Basel, Switzerland. This article is an open access article distributed under the terms and conditions of the Creative Commons Attribution (CC BY) license (https://creativecommons.org/licenses/by/4.0/).