Article

Evolution of Industrial Ecology and Analysis of Influencing Factors: The Yellow River Basin in China

1
School of Economics, Lanzhou University, Lanzhou 730000, China
2
School of Accounting, Lanzhou University of Finance and Economics, Lanzhou 730000, China
*
Author to whom correspondence should be addressed.
Land 2023, 12(7), 1277; https://doi.org/10.3390/land12071277
Submission received: 11 May 2023 / Revised: 14 June 2023 / Accepted: 21 June 2023 / Published: 23 June 2023

Abstract

:
The Yellow River Basin is an important ecological function area and economic zone in China that faces the dual pressure of economic development and ecological protection. Industrial ecology designs industrial activities by imitating the ecosystem and would solve the dilemma in the development process of the Yellow River Basin. In this study, we evaluated the industrial ecology of 100 prefecture-level cities along the Yellow River Basin from 2003 to 2020 using the entropy weight method and analyzed their long-term spatial and temporal evolution trends. We also deconstructed the driving factors affecting the industrial ecology in the Yellow River Basin, regarding both internal and external aspects, using the coupled coordination model and the panel quantile model. We found the following: (1) The industrial ecology in the Yellow River Basin was slowly increasing in a “N”-type transformation trajectory, but the overall was still relatively low. (2) The slow improvement in ecosystem efficiency and the low coordination between the industrial system and the ecosystem are the main internal factors limiting the improvement in industrial ecology. (3) The population agglomeration, human capital accumulation, government guidance, and technology level are all important for improvements in industrial ecology in the Yellow River Basin. The impact of the financial level on industrial ecology in the Yellow River Basin was found to be negative. Therefore, it is necessary to take the correlation and coordination between the industrial system and the ecosystem as the main means and actively and positively promote the role of the external influencing factors to improve the industrial ecology in the Yellow River Basin.

1. Introduction

High economic development has effectively contributed to the improvement in people’s living standards; however, a high rate of development, which relies on hard capital inputs such as resources and energy, has caused negative externalities in the ecology [1,2,3,4,5,6]. The serious environmental problems caused by this linear industrial development model of “take–make–dispose” are increasingly becoming a shackle to continued economic development and are not sustainable [7,8]. The contradiction between economic development and the ecological environment has prompted the search for a combination of strategies that can achieve sustainable development by promoting economic efficiency while reducing environmental pollution. Industrial ecology (IE) not only adapts the design and develops industrial activities with the idea of an ecosystem, but it also achieves the goal of waste reduction and clean production through resource recycling and reproduction, and finally realizes the unification of economic, social, and environmental benefits [9]. In addition, it involves pursuing the symbiotic relationship that should be formed between the industrial system and the ecosystem. At the micro level, through sharing resources and technologies between enterprises and regions, it can improve the efficiency of resource utilization and reduce the interference of production activities in the ecosystem. At the macro level, through the construction of an industrial system that harmonizes economy and environment, it can achieve the synergistic development goal of nature, economy, and society [10]. Therefore, IE has gained more favor as an important combination of strategies to achieve sustainable development.
As an important ecological barrier and economic zone in China, the Yellow River Basin (YRB) had the objective reality of sacrificing the environment due to economic development. The problems of ecological protection and economic development must be urgently solved at the same time. Therefore, to solve this dilemma, it is feasible and necessary to design the development of the YRB with the idea of IE that pursues the synergy and symbiosis between industrial systems and ecosystems. Consequently, this study aims to evaluate the IE of cities along the YRB and analyze its influencing factors from both internal and external aspects to find the direction of IE optimization in the YRB. To address the above research questions, the following research objectives are set: first, to clarify the spatial and temporal evolution pattern of IE in the YRB by using the entropy value method and spatial exploratory techniques; second, to analyze the influence of industrial system and ecosystem relationships on IE from the perspective of system composition based on the coupled coordination degree model, which helps to alleviate the possible analytical bias caused by insufficient attention to the relationships among subsystems in existing studies; and third, a panel quantile model is used to explore the role of external factors in different regions and within different industrial ecological intervals, considering the impact of regional differences on the applicability of the study results.

2. Literature Review

2.1. The Connotation of IE

The idea of IE originates from the concept of ecological carrying capacity in biology. “Industrial Ecosystem Theory” highlighted that the connotations of IE include reducing energy demand and consumption, reducing waste generation, and exploring the transformation of waste into new products that can be used in production again [11]. The concept of IE has received more attention from scholars since it was proposed. However, early studies mostly advocated for the construction of a cyclic industrial system in the process of specific industrial production imitating natural ecology, and the coordination between the industrial system and other surrounding systems is maintained through the integration of activities and the circulation of resources [12,13]. The industrial zone originated in Kalundborg, Denmark, which was the earliest region to practice IE. By taking the environment into full consideration in the process of production and consumption and by designing a series of policies and regulations, an industrial symbiosis was established among enterprises in the industrial zone, and the mutual digestion of production waste, byproducts, and energy is realized among enterprises in the zone, which eventually achieved the goal of a closed cycle of resources, eliminating waste and improving the environment [14]. This practice focusing on the idea of IE among enterprises in industrial parks has subsequently been emphasized and developed in China [15,16], Australia [17], France [18], India [19], and Uganda [20], making industrial symbiosis the most important component and representative field of IE.
In view of the important role played by IE in practical applications, its application level has been gradually expanded from the micro-firm level to the meso-industry and macro-regional levels, and the connotations of IE have been further expanded. Lowe (1995) considered IE the result of human rational action behavior, which was an emerging framework for environmental management that sought an industrial development approach that matched inputs and outputs with local environmental carrying capacity and integrated human economic activities and material management into basic ecosystems [21]. Lu et al. (2012) considered that IE in a broad sense is to realize the integration of industry and the environment by constructing an industrial system that conforms to both economic laws and ecological system requirements and coordinates the exchange of materials and energy to achieve harmony and unity. In a narrow sense, IE refers to the imitation of natural ecology to construct a circular industrial system [22], while in a broad sense, it involves resolving regional resource and environmental problems, reducing damage to the ecological environment by designing industrial development chains and models conducive to coordination with the environment, and solving the contradictions between the economy and the environment in a long-term dynamic evolutionary process. This view of IE as a strategic tool to plan national economic, social, and ecological development [23] and its role in reducing the difficulty in sustainability management activities, ensuring the implementation of sustainability policies [24], and creating green production, ecological, and living spaces [25] has also been supported by more research. It can be seen that, with the increasing influence of sustainable development in the world and in various industries, the idea of IE—with resource conservation, clean production, recycling, and industrial symbiosis as important features—has become an important policy tool to coordinate the contradictions between the overall regional environment and economic development [9].

2.2. The Measurement and Influencing Factors of IE

Along with the expansion of the perception of IE, the examination of its measurement and influence factors has also received attention. A good way to evaluate the IE is focusing on whether a closed loop is formed in the production process, from raw-material extraction to final disposal from the perspective of their life cycle [26,27,28]. The material flow analysis method, which focuses on tracking and quantifying the movement of substances or groups of substances through the system, has also been used by a large number of scholars [29,30]. Subsequently, from the basic features of IE, scholars concluded that “industrial eco-efficiency”, which can comprehensively reflect industrial economic output, resource consumption, and ecological consequences, was consistent and coherent with the concept of “IE”. Therefore, some scholars adopted the Data Envelopment Analysis (DEA) models [31,32,33], Stochastic Frontier Approach (SFA) evaluation [34], entropy value method [4,35,36], and other analytical methods to measure industrial eco-efficiency to reflect the external environmental performance of industrial production under environmental constraints and as an alternative index for IE evaluation. The above methods have significant advantages for examining the change in IE from the input–output perspective because they do not require explicit functional relationships among variables [37]. However, these approaches treat IE as a system, ignoring the influence of the relationship between elements within the system overall. In contrast, coupled coordination emphasizes that the close connection and complex interaction among subsystems can determine the direction of system development [10,38,39]. Therefore, the adoption of coupled coordination analysis is an effective measure to address the lack of attention to endogenous factors in the evolution of IE. As for the discussion on the influencing factors and driving mechanisms of IE, the IE practices represented by industrial parks all emphasized the goal of resource saving through industrial agglomeration and shared infrastructure, achieving closed-loop production by expanding industrial scale and optimizing industrial structure [40] and reducing the emergence of environmental uneconomical situations [9]. At the same time, the joint action of market and government has formed many sites practicing IE, including industrial parks, which prompted the flow of technology, capital, and policies to such industries and integrated ecological systems. Therefore, the influence and mechanisms of action of IE, including technological innovation and spillovers [41], financial level [42], environmental regulation [33,43], regional resource endowment [10,44], local fiscal expenditure [45], and population layout [46], have also received more attention from scholars.

2.3. Research Gap

Existing research constitutes an important basis for this study, but the following deficiencies still exist. First, most of the current studies on IE are focused on the provincial level [47], urban clusters [10,48], or industrial parks, and relatively few studies from watershed perspective. Second, the existing research on IE mainly adopts a single method and perspective and pays insufficient attention to the internal mechanism when analyzing the influence factors of IE, which cannot fully reflect the connotation of IE. Third, the attention to regional differences in analyzing the influence of external factors on IE is not detailed enough. Therefore, after evaluating the IE of cities along the YRB over a longer period, this study explores the driving mechanisms of IE from both internal and external dimensions, which expands the scope of IE research and makes up for the lack of comprehensive discussion in existing studies.

3. Research Methodology and Data Sources

3.1. Research Methods

3.1.1. Entropy Method

To calculate IE, we constructed a comprehensive index for 100 prefecture-level cities along the YRB using the entropy method, which determines the weight of indicators based on the amount of information transmitted to decision makers. Thus, this method ensures the objectivity of the index weights to a certain extent and makes the calculation results more credible. The specific calculation process using the entropy method [49,50,51] to calculate IE in the basin consists of the following four steps:
First, data standardization was performed to eliminate deviations caused by differences in scale and sign between the indicators. The polarization method was selected to standardize the original data, in which the positive indicators were standardized using Formula (1), and the negative indicators were standardized using Formula (2), as follows:
y i j = x i j m i n ( x i j ) m a x ( x i j ) m i n ( x i j )
y i j = m a x ( x i j ) x i j m a x ( x i j ) m i n ( x i j )
where x i j is the original index data, y i j is the standardized data value, and m a x   x i j and m i n   x i j are the maximum and minimum values of the jth indicator in the study area, respectively.
Second, entropy value calculations were performed.
The entropy value of each index was calculated according to Formula (3) [52,53]:
e j = k i = 1 n p i j l n p i j
where e j is the index entropy value, 0 ≤ e j ≤ 1; k = 1 / ln n ; and n is the number of evaluation objects; p i j = y i j / i = 1 n y i j .
Subsequently, the weights of each indicator were calculated according to Formula (4):
w i j = 1 e i j i = 1 m ( 1 e i j )
where w i j is the weight of the study indicator, e i j is the indicator entropy value, and m is the number of indicators.
Finally, the score was calculated according to Formula (5):
Y i = w i j · y i j
where w i j is the corresponding index weight, and y i j is the standardized data value.

3.1.2. Coupling Coordination Degree (CCD) Analysis Method

IE is an external manifestation of the interactions and mutual influences between industrial and ecological environmental systems. The relationship between industrial systems and ecosystems is an important internal factor for improving IE. The industrial system dominates the scale and intensity of the interaction between the two systems and provides elements to support the development of the ecosystem, which determines the upper threshold of the interaction and provides a space for the development of the industrial system [11]. The degree of coupling coordination can portray the dynamic transformation process between disordered and ordered states within a system and reflect the interaction relationships between various parameters within the system [54]. This indicator can adequately reflect the symbiosis between industrial systems and ecosystems, a fundamental requirement of industrial ecology [9]. Therefore, CCD analysis can be used to understand the important internal factors that cause changes in IE in the YRB from the perspective of the relationship between the two systems [55,56]. The calculation equations are shown in Equations (6) and (7) [56,57,58].
C = [ F ( x ) × G ( y ) ( F ( x ) + G ( y ) 2 ) 2 ] 1 2
CCD = C × T   ,     T = α × F ( x ) + β × G ( y )
where C is the coupling degree of the industrial system and ecological environment system, with C     [ 0 , 1 ] and a higher C characterizing better system coupling; F ( x ) and G ( y ) denote the evaluation indices of the industrial system and eco-environmental system, respectively; CCD is the coupling coordination degree of the industrial system and ecological environment system, with CCD     [ 0 , 1 ] and a higher CCD characterizing better system coupling coordination; and T refers to the comprehensive development index of ecological and industrial system. In addition, α + β = 1 ; as the industrial system and eco-environmental system are equally important, α and β each take the value of 0.5. Drawing on relevant research results, the CCD of the industrial system and ecological environment system is divided into five stages: the serious-imbalance period (0 ≤ CCD < 0.2), moderate-imbalance period (0.2 ≤ CCD < 0.4), basic-coordination period (0.4 ≤ CCD < 0.5), moderate-coordination period (0.5 ≤ CCD < 0.8), and high-coordination period (0.8 ≤ CCD ≤ 1) [58,59,60].

3.1.3. Panel Quantile Regression

Changes in the location of the conditional distribution of dependent variables may alter the relationships between the variables [61]. The panel quantile approach can reflect the heterogeneous structure of different regions in the basin and reflect the relationship between variables more completely [62]. The YRB flows through nine provinces, and the economic development base and IE in the upstream, midstream, and downstream regions are inherently more heterogeneous. In addition, as the IE of the YRB reflects an N-shaped change trend, quantile regression is more robust to outliers [61,63]. Therefore, this study used a panel quantile fixed-effects model to estimate the influence of each external factor on IE under different conditional quantiles. We expressed the panel quantile model as follows:
Y τ = Q Y i t ( τ | X i t ) = α i ( τ ) + X i t β ( τ )
For any quantile τ ( 0 , 1 ) , τ = P ( ( Y i t < Y τ | X i t ) ) = F ( Y i t | X i t )   ( Y τ ) .
In the above equation, Y τ is the IE at the τ th quantile in the YRB, Y i t is the IE of the i th city in the basin, X i t is a series of external factors affecting IE, α i is an unobservable individual fixed effect, and β ( τ ) is the vector of estimated coefficients.

3.2. Study Geographic Area

This study used the YRB as the research area for the evaluation of IE and the analysis of influencing factors.
First, the YRB is an important ecological function area in China. The Yellow River is the second-largest river in China and the fifth-largest river in the world; its mainstream has a total length of 5464 km. The watershed area of the YRB accounts for 7.9% of the total basin area and 23.01% of the total water resource area in China (Table 1). However, the biggest conflict in the YRB is the shortage of water resources. Most of the upstream and the midstream regions are in the west of the 400 mm equivalent precipitation line, with an arid climate and scarce precipitation. The annual average precipitation is only 446 mm. The total annual average water resources are 64.7 billion m3. The exploitation rate of water resources is up to 80%, far exceeding the ecological alert line of 40%. Therefore, water resources are the biggest rigid constraint for the development of the YRB, and water conservation and water recycling are the basic requirements for industrial development in the YRB. For example, the “Plan for Ecological Protection and High-Quality Development of the YRB” released by the Chinese government clearly proposes to promote water conservation and efficiency in high-water-consuming industries, such as energy, chemical, and building materials, and to strictly limit the development of high-water-consuming industries. At the same time, it should improve the comprehensive utilization of water resources in mining areas by accelerating the promotion and application of water-saving technologies and equipment and speeding up the construction of water-recycling facilities in enterprises. In addition, by increasing the price of water for industrial water over quota, it will force the orderly withdrawal of high-water-consuming projects and industries. Therefore, the conservation and protection of water resources is a key concern in this basin. As the main body of terrestrial ecology, forests play an important role in water conservation and building an ecological foundation. Forested areas of the YRB account for 33% of the total forest area in China, and national nature reserves account for 33.69% of the country’s total nature reserves (Table 1). These values not only reflect the important role of ecological security in the YRB but also confirm the vulnerability of the ecological environment. Therefore, the ecological protection of the YRB, which is an important ecological barrier in China, is urgent and important.
Second, the Yellow River is also an important economic belt in China. From Table 1, the basin is an important agricultural and industrial product supply area, as well as an important industrial base for energy and natural gas. The Yellow River flows through nine provinces, Qinghai, Sichuan, Gansu, Ningxia, Inner Mongolia, Shanxi, Shanxi, Henan, and Shandong, and most of the area within the basin is relatively underdeveloped. These characteristics further indicate that the development of the basin is based on resource endowment, and the linear development model, which relies on resource input, has been the dominant development model used to study the YRB for a long time. The coordinated symbiosis between the industrial system and the ecosystem through recycling resources and clean production is the inevitable way to achieve the sustainable development goal of the YRB.
Areas along the basin currently face the dual pressures of ecological protection and economic development to resolve the problems of declining environmental quality and backward regional development. In summary, this study is highly relevant to exploring the evaluation of IE in the YRB and to analyzing its internal and external influencing factors, considering the development reality of the YRB and its important position in the ecological protection and achievement of high-quality development goals in China.

3.3. Variables and Data

The data used in this study from 100 prefecture-level cities in the provinces in the YRB from 2003 to 2020 were obtained from the China Urban Statistical Yearbook, China Environmental Statistical Yearbook, and statistical yearbooks of each province. Missing values were filled in based on the linear interpolation and mean value methods.
This study constructs an evaluation index system from two dimensions of industrial system and ecosystem to evaluate IE of cities along the YRB according to the connotation of IE in a broad sense. This is determined by the connotation of IE. Therefore, the target layer was to evaluate IE of the YRB, and the guideline layer is the industrial system efficiency and ecosystem efficiency. The industrial system provided the corresponding development basis and elements for the ecosystem and determined the development scale and intensity of IE. Additionally, the ecosystem provided the basic development space for the industrial system, determined the upper limit of IE evolution, and was the basic carrier of IE [60,64,65]. Therefore, after drawing on relevant research and considering the data availability, the corresponding three-level indicators were selected, as shown in Table 2.
Ecosystems are mainly linked to industrial systems by providing resources, accepting waste from domestic and production activities, and improving ecosystem service functions. Therefore, the indicators reflecting ecosystem efficiency are also selected around the above aspects. Firstly, resource conservation is an important feature of IE. Higher indicators in the resource consumption category mean that the industrial system takes more from the ecosystem and the heavier the load on the ecosystem. Coal and electricity provide energy support for living and production activities, while water resources are an important constraint for living and production in the YRB. Therefore, in terms of resource consumption, we select unit GDP energy consumption, unit GDP power consumption, and unit GDP water consumption as indicators to reflect the basic resource supply status of the ecosystem [10]. Secondly, clean production and waste-emission reduction are also important features of IE, and higher indicators in the waste-emission category imply a greater negative impact of the industrial system on the ecosystem. Considering that air pollution and water pollution are the main wastes of industrial activities, and the statistical yearbook does not publish other waste-emission indicators such as industrial solid waste and domestic waste, this study uses industrial SO2 emissions per unit of GDP and industrial wastewater discharge per unit of GDP to reflect the waste-emission status accepted by the YRB ecosystem [66]. Thirdly, resource recycling is a fundamental requirement of IE, which can effectively improve resource utilization and reduce the pressure on the ecosystem. Therefore, the study used industrial solid-waste comprehensive utilization, pollution-free treatment rate of living garbage, and centralized processing rate of industrial wastewater treatment plants to reflect the reuse of resources. Higher indicators in the resource-recycling category imply that the industrial system has less impact on the ecosystem [67]. Fourthly, effective ecological conservation measures can effectively improve the ecological service supply capacity of the ecosystem and reduce the pressure on the ecosystem. Moreover, taking corresponding measures to restore the ecological environment is also an important manifestation of the closed-loop development model of IE. Therefore, this study uses per capita park green area and green-area coverage in the built-up area disclosed in the statistical yearbook to reflect the conservation status of the ecological environment [67].
The industrial system also develops itself in the process of linking with the ecosystem. Industrial development follows a direction from low to high, and the evaluation of industrial systems should focus on the speed and quality of industrial development. Based on the literature and the data availability, five indicators were selected to portray the industrial system: the per capita GDP and the GDP growth rate reflect the regional development level [33,51], the tertiary sector as a percentage of GDP reflects the advanced level of industrial structure [68], the Thiel index reflects the rationalization level of industrial structure [48], and the per capita available foreign investment reflects the vitality of industrial development [69].
The descriptive statistics for the index data are presented in Table 3.

4. Results

4.1. Results of Spatial and Temporal Evolution Analysis of IE in the YRB

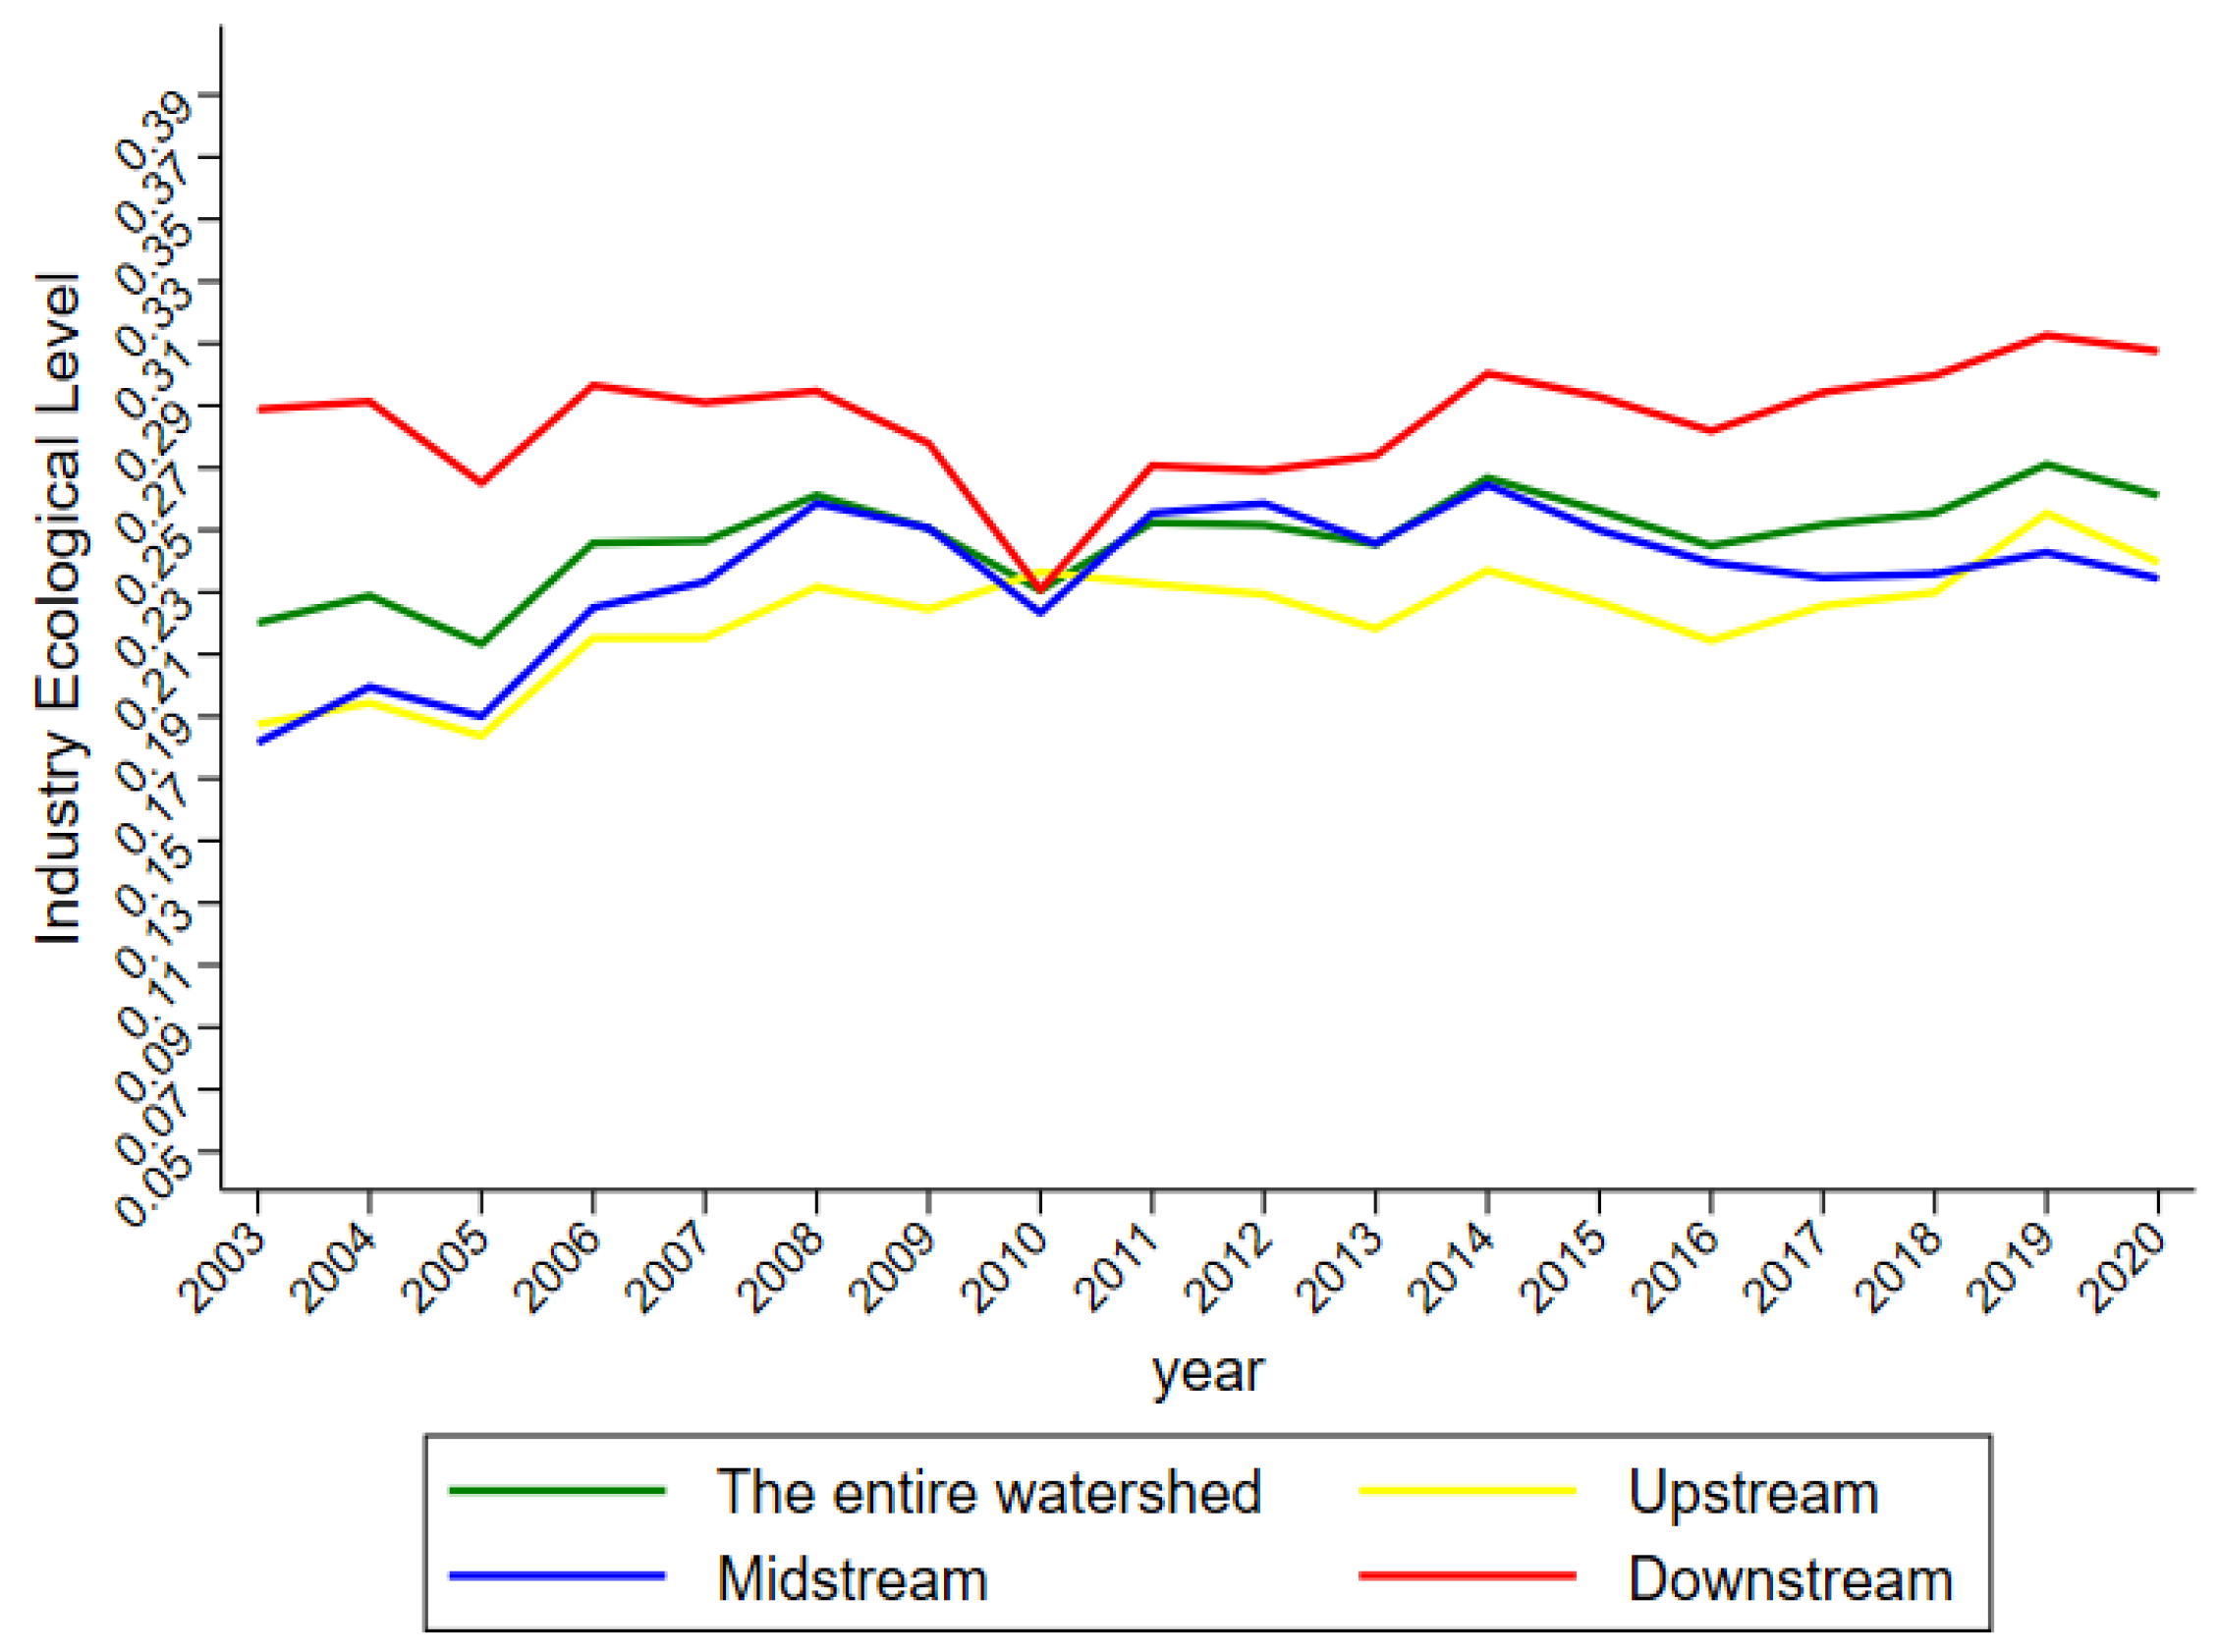
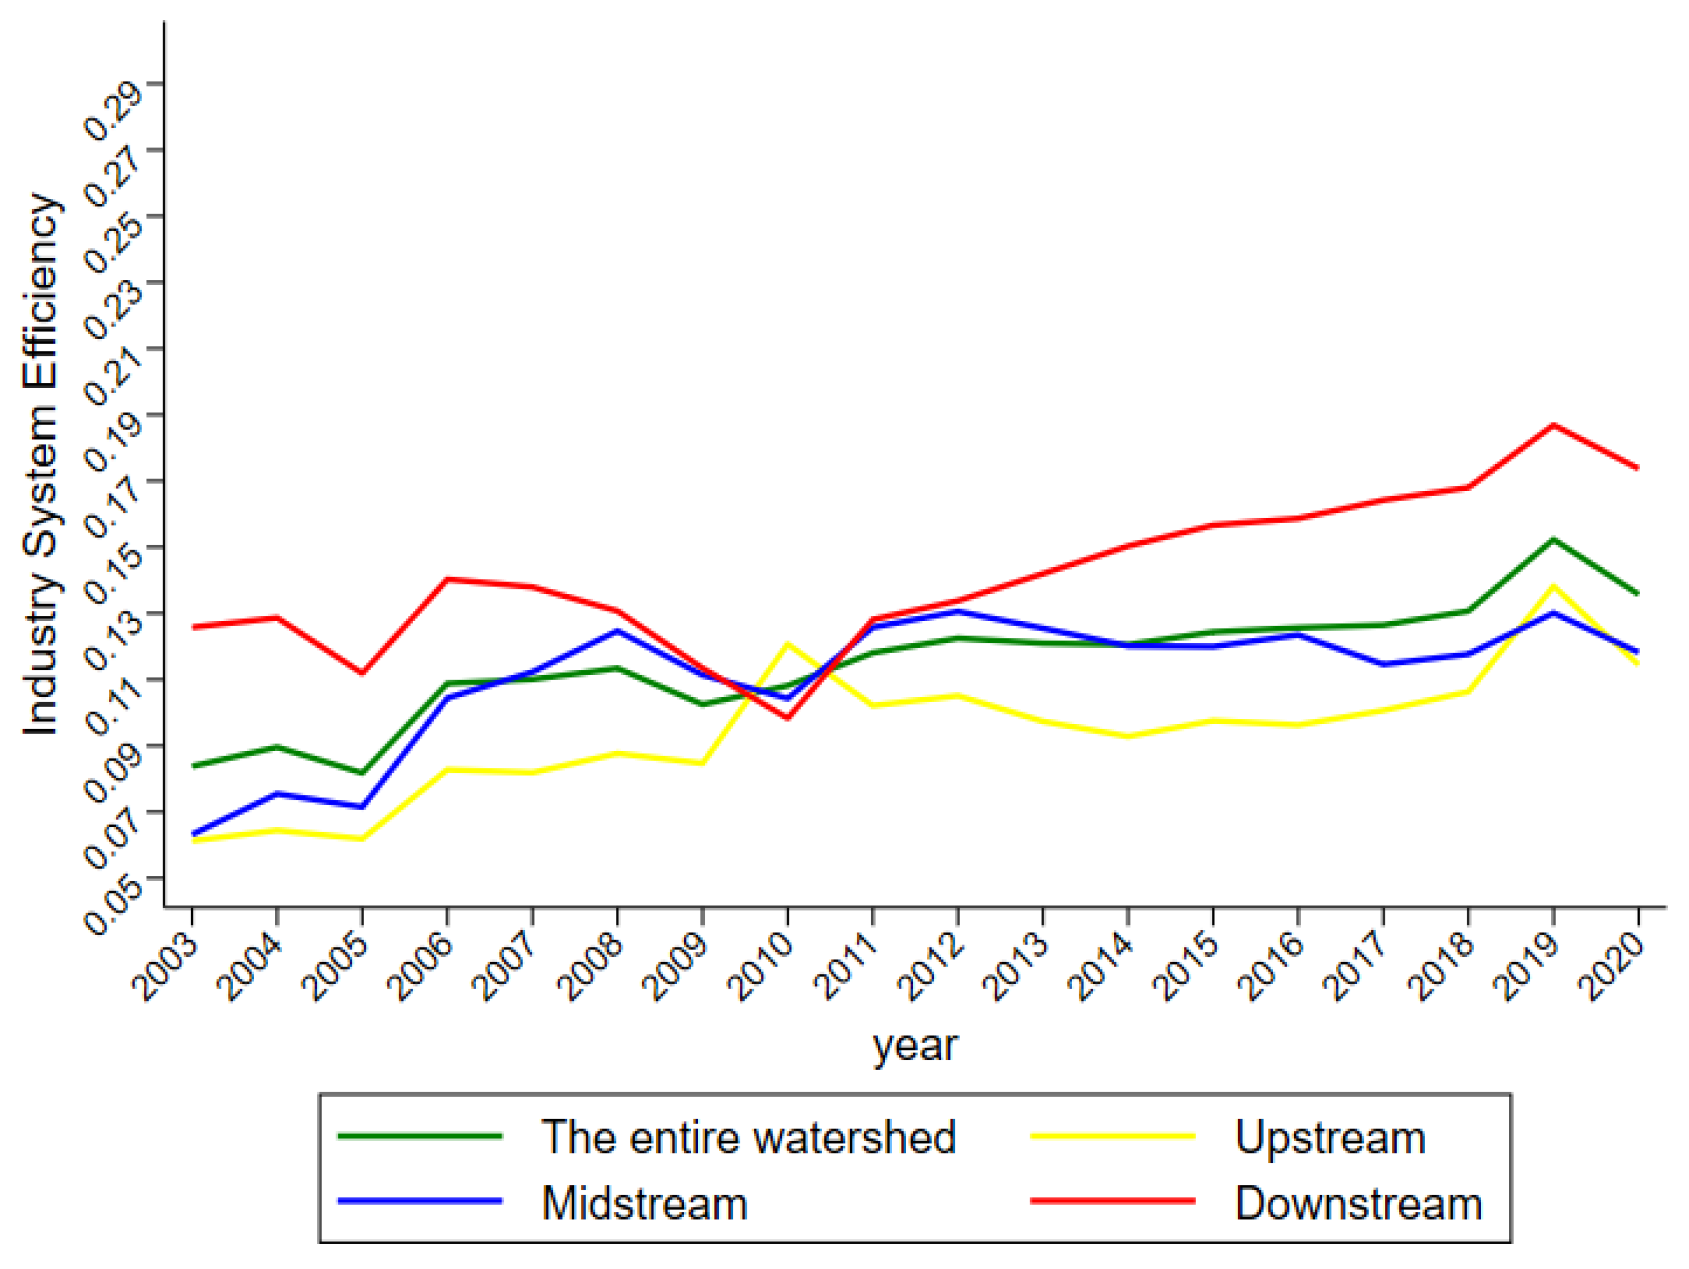
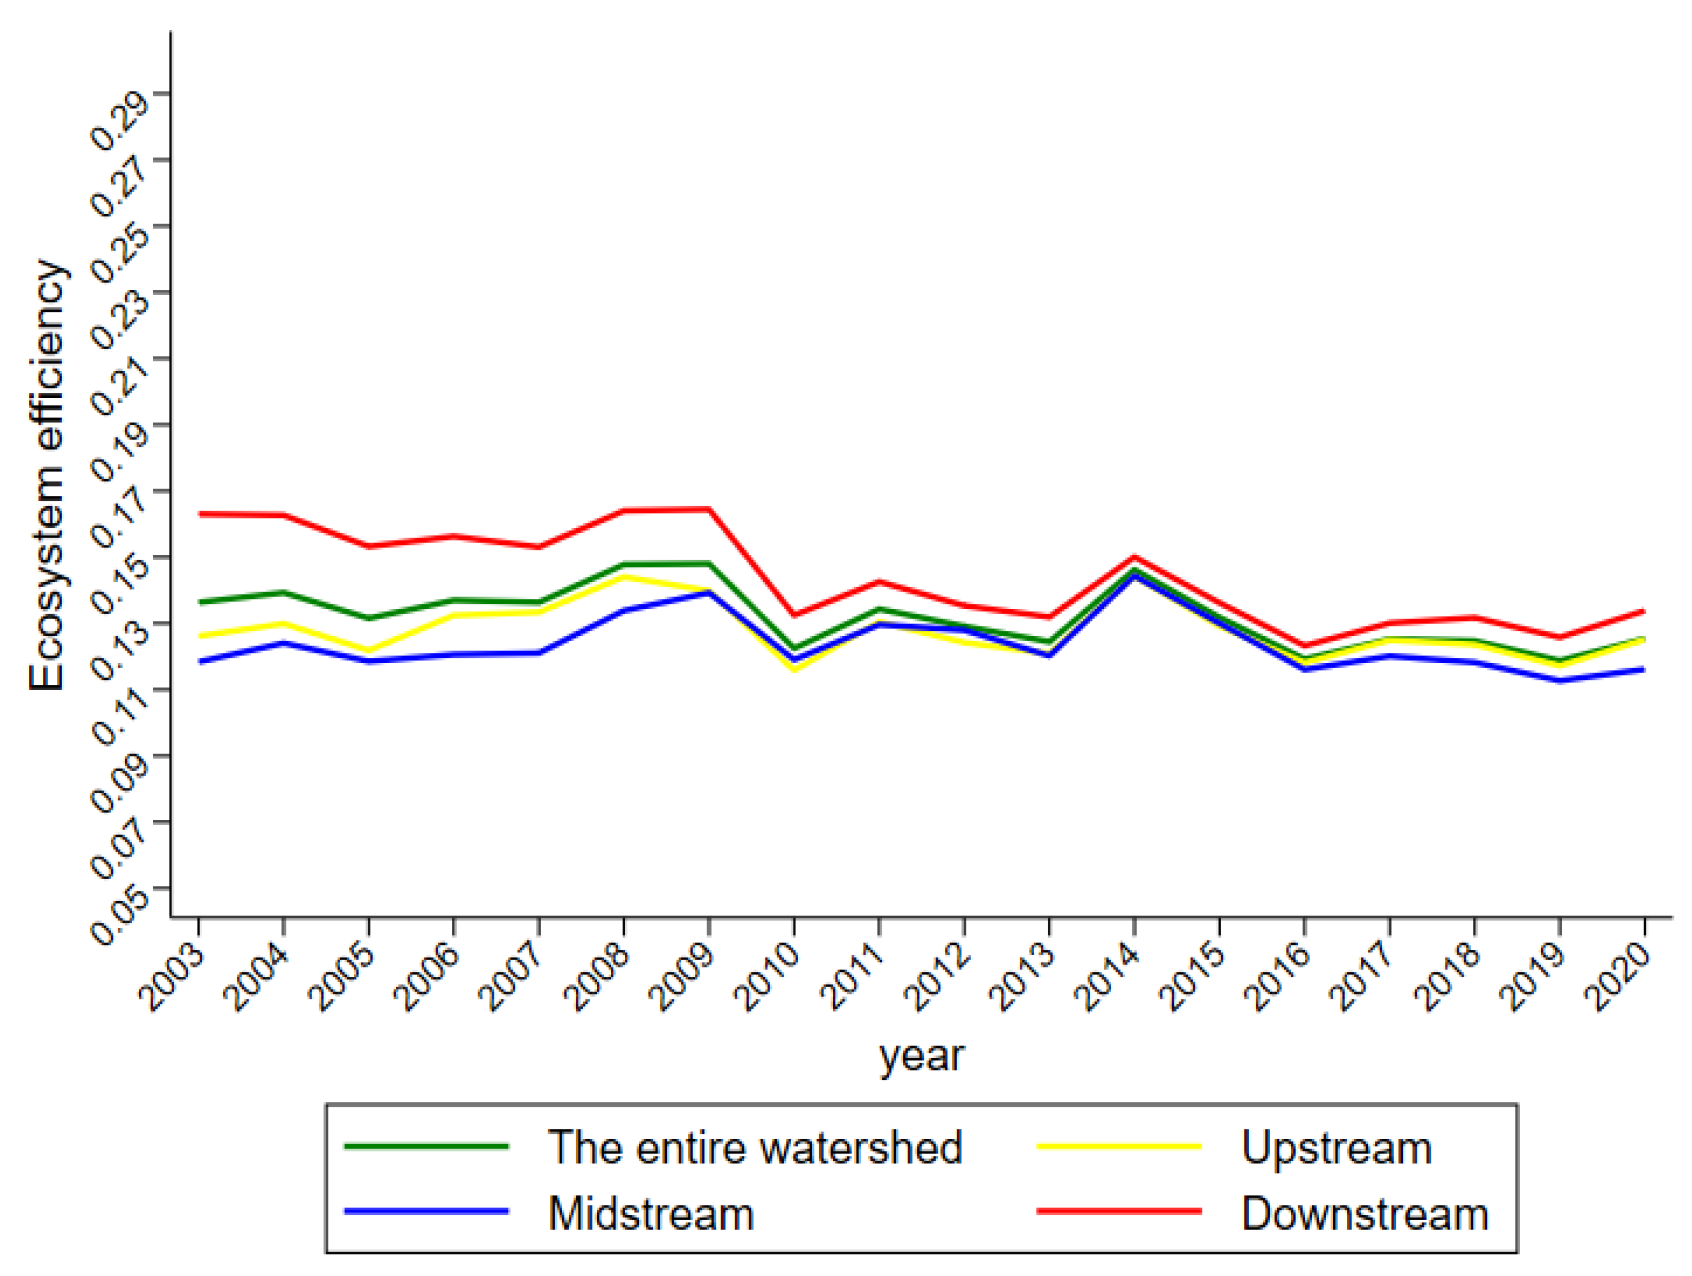
4.1.1. Trends of IE in the YRB

Considering the changes in the IE in the YRB from 2003 to 2020, the following characteristics were identified (Figure 1):
First, the overall mean value of IE in the YRB during the study period was 0.247, which is low and indicates the potential for improvement. Therefore, the coordinated development of ecological protection and economic and social factors in the basin is still a complex and long-term process [10]. Second, IE in the YRB showed an N-shaped form of change. From 2003 to 2008, the IE of YRB increased from 0.220 to 0.261. From 2008 to 2010, a clear downwards trend was observed, with the value decreasing to 0.231 in 2010. This trend was likely due to the impact of the 2008 financial crisis, which caused a decline in IE. After 2010, the IE of YRB exhibited a slow upward trend, reaching 0.271 in 2019. In 2020, the IE of the basin decreased to 0.261; the outbreak of the COVID-19 pandemic was potentially the main reason for the overall decline in IE in the basin. Third, IE in the YRB showed a large regional variability, and this regional difference showed a certain tendency to expand [70]. The study examined the evolution of IE in the upstream, midstream, and downstream regions of the YRB, respectively, and found that from 2003 to 2019, the mean value of IE was ranked from high to low: downstream region, midstream region, and upstream region. This confirmed the argument of some scholars that there is a positive correlation between the level of economic development and the level of ecological protection [71]. However, after 2016, in contrast to the gradual rise of IE in the upstream and downstream regions, IE in the midstream region showed a significant decline. Furthermore, in 2019, IE of the upstream region exceeded that of the midstream region. This indicates that the decline of the IE in the midstream region has become an important reason limiting the improvement of the overall IE in the YRB.

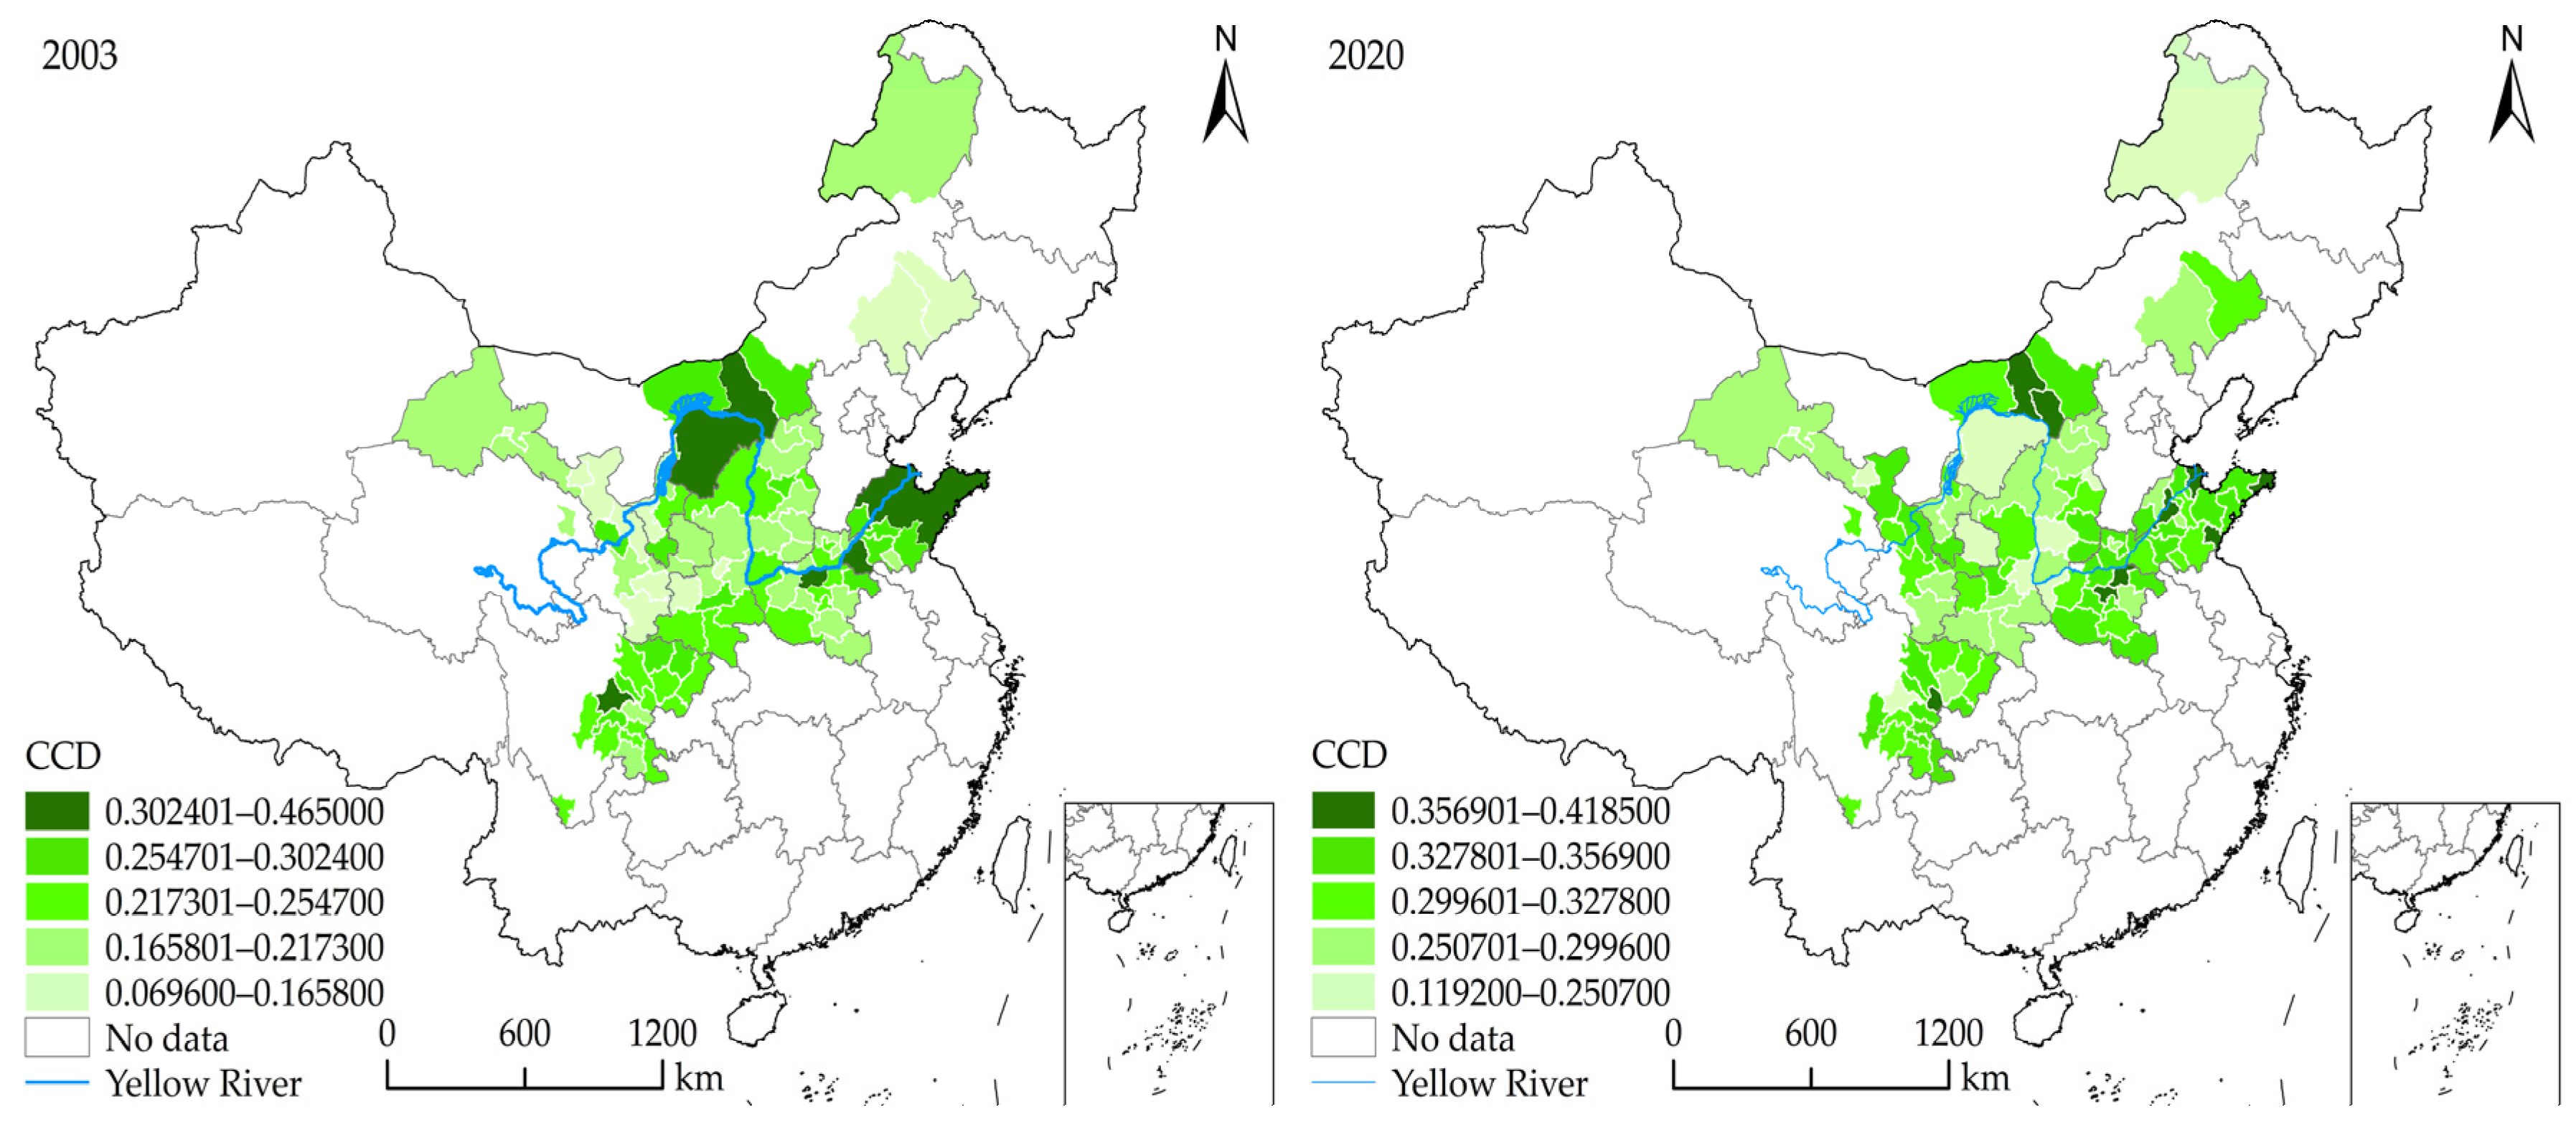
4.1.2. Spatial Distribution of IE in the YRB

The study adopted the natural interruption point method to divide IE of the YRB into five echelons [68]. From Table 4 and Figure 2, IE of the YRB in general showed a pattern of spatial differentiation. Compared to 2003: (1) The number of cities in the upstream and midstream areas in the first echelon increased significantly. (2) The number of cities in the upstream and midstream regions decreased in both the second and third tiers, whereas the number and share of cities in the downstream region increased in both tiers. In 2003, the cities distributed in these two tiers exhibited significant spatial agglomeration, which decreased in 2020. (3) The number of cities in the upstream and midstream regions within the fourth and fifth echelons were relatively high throughout the study period. The midstream region exhibited a more significant increase in the number of the fifth echelons. This change indicates that the IE of upstream and midstream reaches has been relatively low for a long time and the need to improve the IE is severe. To achieve the goal of improving IE in the YRB, reducing the number of cities within the fourth and fifth echelons in the upstream and midstream regions should be considered as a breakthrough. For example, the ecological destruction of the “Sanjiangyuan” area in Qinghai Province, China, was an example of the serious ecological impact of the linear development in the upper reaches. “Sanjiangyuan”, regarded as the “Chinese water tower”, was the birthplace of the Yellow River. The problem of mineral theft and unregulated mining occurred frequently in the “Sanjiangyuan” area between 2000 and 2017, and the mining pits after exploitation were also basically bare and not repaired, resulting in the breakage of the mountain and the destruction of vegetation. Moreover, because the production process did not pay attention to clean production and recycling, a large amount of wastewater from raw-coal washing was directly discharged into the ditches, which were connected to the “Sanjiangyuan” Core Protection Area, causing serious water pollution problems. After 2017, the central and local governments had invested huge financial, material, and human resources to restore the ecology of the damaged areas, and although certain results had been achieved, this linear development method still caused far-reaching impacts and hazards to the ecological security of the source area of the YRB. The number of cities distributed within the fourth and fifth echelons in the downstream region also increased at the end of the study period. This indicates the need to be alert to the decline of IE in downstream areas.

4.1.3. Spatial Agglomeration Analysis of the IE of YRB

The industrial ecology of the Yellow River Basin shows a significant decline in spatial agglomeration. As shown in Table 5, the Moran’s I indices of IE in the YRB from 2003 to 2017 passed the significance test and were positive, indicating a more obvious spatial dependence of the IE of the prefecture-level cities in the YRB in general. Thus, the spatial dependence of the IE of each city in the basin not only influences the IE of neighboring cities but is also influenced by the IE of neighboring cities. The Moran’s I indices also showed a decreasing trend in fluctuations from 0.463 in 2003 to 0.126 in 2020, indicating that the mutual influence IE of cities in the YRB decreased annually, and the interdependence relationship weakened annually.

4.2. Analysis of the Inner Driving Mechanism of IE in the YRB

The narrow definition of IE only imitated the ecosystem in the industrial system, ignoring the importance of their connection and interaction. The industrial system dominates the scale and intensity of the interaction between the two systems and provides elements to support the development of the ecosystem, which determines the upper threshold of the interaction and provides a space for the development of the industrial system [11]. Their coupling and coordination reflect the inherent requirement of synergistic coexistence of the two systems in IE [9,15,72,73]. Therefore, based on the analysis of the evolution of the industrial system and the ecosystem itself, respectively (as shown in Figure 3 and Figure 4), we further analyzed the relationship between the two subsystems using the CCD model (Figure 5 and Table 6). It was found that:
First, the efficiency of the industrial system in the YRB generally showed an upward trend. Except for 2010, the ranking of industrial system efficiency of the YRB during the study period was downstream region > midstream region > upstream region, which was basically consistent with the ranking of the economic development level status of the YRB. The efficiency of the industrial system of the downstream region decreased significantly in 2010, probably because it is in the coastal region and has relatively more economic and trade activities with other countries in the whole basin, so it was relatively more affected by the 2008 financial crisis; however, the recovery of the industrial system in the downstream region went relatively well, due to their relatively strong economic foundation and ability to cope with risks.
Second, the ecosystem efficiency of the YRB showed a decreasing trend in fluctuation in general, which to some extent indicates that the ecological condition of the YRB was deteriorating.
Third, the mean CCD value between the industrial system and the ecosystem in the YRB ranged from 0.244 to 0.328, showing a slowly increasing trend. The degree of coordination between the two systems had been at a moderate dysfunctional stage throughout the study period, suggesting that the low coherence between the industrial system and the ecosystem is also one of the important reasons for the overall low IE in the YRB. Therefore, coordination between the industrial system and the ecosystem in the basin should be improved, and the synergistic development of the two systems should become a priority for cities in the basin in the future.
In Figure 5 and Table 6, the natural interruption point method was also used to divide the CCD between industrial systems and ecosystems in the YRB into five echelons. Throughout the study period, most of the cities in the first echelon of CCD were from the downstream region. Compared with the beginning of the study period, the overall proportion of cities in the upstream region in the second echelon of CCD did not change much. In contrast to the significant decrease in the proportion of cities in the midstream region in this echelon, the proportion of cities in the downstream region increased significantly. In the third echelon of CCD, the proportion of cities distributed in each region remained basically stable. Within the fourth echelon of CCD, the share of the midstream region in the distribution of this echelon increased significantly, while the share of downstream regions declined significantly. Within the fifth echelon of CCD, the share of cities in the upstream region decreased, but the share of both the midstream and downstream regions increased. The spatial–temporal evolution of the distribution of CCD revealed that the incoordination between the industrial system and the ecosystem is more prominent in the midstream region, while the coordination between the two subsystems in the upstream and downstream regions showed a certain trend of increasing.

4.3. Analysis Results of External Influences on IE in the YRB

An improvement in IE indicates that the ecological environment is improving with the development of industry. Achieving this goal requires a high-quality labor force to provide human support, capital, and technology to drive reasonable government guidance. Population concentration guarantees sufficient labor for the development of the regional economy and industry. However, the expansion of production and living space brought about by population growth may squeeze the ecological space to a certain extent. Therefore, a moderate population size is conducive to promoting industrial development while avoiding greater pressure on ecology. To achieve the goal of improving IE, people need to change their development philosophy and fundamentally agree to a sustainable development approach; they also need to have the ability to participate in the circular development model. Human capital reflects the basic condition of the relatively high-quality group of labor force in a region, which is the basis of industrial structure upgrading and the main body of practical application of clean production technology and the circular development model. Therefore, having a high level of human capital can contribute to the overall improvement of IE. The special nature of the river determined that to improve IE in the YRB needed cooperation among the governments in the basin. Moreover, to design and transform the original production activities with the idea of resource recycling and sustainable use, the government needed to play a certain guiding role. Therefore, government guidance has an important impact on both the industrial system and the ecosystem. Both industrial development and ecological protection cannot be separated from the support of finance and technology. While the financial industry directed the flow of funds to the field of recycling and clean production, it can promote the growth of green ecological industrial subjects, promote the ecological transformation of the industry, and achieve the goal of reducing the negative ecological externality impact of industrial development. Green technology progress fundamentally resolved the technical limitations of enhancing resource utilization efficiency and promoting clean production, which was an important external power mechanism to enhance IE. All these external factors are closely related to industrial ecology and need special attention. Therefore, in this study, we selected population density, human capital, financial level, technology level, and government control level as external factors affecting IE in the YRB, and we examined the influence of these five external factors on IE in the basin at different quartiles using a panel quantile fixed-effects model. The regression results are presented in Table 7 and Table 8.
(1)
In this study, the population per square km of land was used to express population density. First, from a basin-wide perspective, the impact of population agglomeration on IE of cities along the YRB during the study period was positive. Each 1% increase in population density increased the 25th quantile of the IE by 0.0847%, the 50th by 0.660%, and the 75th quantile by 0.0606%. However, as IE increases, the promoting effect of population density gradually decreases. Second, the population density trend in the upstream area on IE is consistent with the basin-wide trend. The effect of population density in the upstream area gradually decreases as IE increases and has an inhibitory effect in the 75th quantile. Third, the effect of population density on IE in the midstream region showed an inhibitory effect at both the 25th and 75th quantiles, but the positive contribution at the 50th quartile to IE passes the significance test. Fourth, for cities in the downstream region, population agglomeration showed a negative hindering effect that passed the significance test for each sublocation. The downstream provinces of Henan and Shandong are both populous provinces, indicating that excessive population concentration causes excessive pressure on the ecology, thus causing a decrease in IE.
(2)
Human capital is indicated by the number of college students enrolled per 10,000 people. First, the positive contribution of human capital to IE passed the significance test in the whole basin. Each 1% increase in human capital raised IE at the 25th, the 50th, and the 75th quantiles by 0.0696%, 0.0529%, and 0.0338%, respectively, indicating that this promoting effect decreases as the quartile of IE increases. Second, the direction of the effect of human capital to IE in both the upstream and downstream regions is positive, and both show an initially decreased and then increased trend. Third, the midstream region showed a negative inhibitory effect at the 75th quantile. It indicates that cities with higher IE in the midstream region have relatively insufficient reserves of existing human capital to meet the needs of IE. Fourth, the downstream region consists of relatively economically developed cities in the YRB, the promoting effect of human capital on IE was more significant in the downstream region than in other regions. A high-quality labor force is an important guarantee for achieving both industrial development and ecological protection. In the future, increasing the cultivation of talent and promoting the human capital structure in a more scientific direction, especially in high-tech and clean production, will play important roles regarding human resources in the coordination of economic development and ecological protection in cities along the basin.
(3)
Government control is expressed as the share of fiscal revenue in the GDP. The impact of government control on IE is heterogeneous. First, basin-wide and in the upstream and midstream regions, the impact of government control on IE was positive. For example, basin-wide, each 1% increase in government control is associated with 0.1166%, 0.1267%, and 0.0943% increase in IE at the 25th, 50th, and 75th quartiles, respectively. Second, for cities in the downstream region, the effect of government control on IE showed a significant negative inhibitory effect. The upstream and midstream areas are relatively fossil-energy-rich regions, and extractive and other related industries are among the pillar industries of each city within the region (e.g., Datong, Yulin, Shuozhou in midstream Shanxi Province and Erdos in Inner Mongolia Autonomous Region are cities with relatively rich coal resources in China [74]), and more cities are resource-rich. In the development process of resource-rich cities, there is a phenomenon of “resource curse” due to excessive reliance on natural resources, which results in a single economic structure and serious environmental problems [75,76]. In the transformation development of resource-rich cities, there is a lot of support for the government to promote industrial transformation to reduce or eliminate the negative effects of resource dependence [77,78], and this support is also evidenced in the upper and middle reaches of the YRB. The downstream region has a relatively high level of IE itself and belongs to the region with a relatively high level of economic development and a relatively reasonable industrial structure in the YRB, so there is relatively little room for government policies to be released.
(4)
Financial level is expressed as the share of the available loan balance of financial institutions to GDP at the end of the year. The regression results showed that the effect of financial on IE in the YRB showed a suppressive effect both basin-wide and in the upstream areas. In the midstream region, the effect was shown to be inhibiting first and then promoting. The positive promotional effect of the financial level on IE passed the significance test at the 50th quantile of IE in the midstream region; that is, a 1% increase in the financial level raised IE at the 50th quantile by 0.047%. The effect of the financial level on IE in the downstream region was positive in all cases, and each 1% increase in the level of finance raised IE by 0.0749% and 0.0839% at the 25th and 75th quartiles, respectively. This may be as cities in downstream areas have relatively higher levels of economic development and technology, relatively lower ecological and environmental pressure, and a weaker risk of financial capital flowing to ecological and environmental industries and fields, compared with that in cities in other areas. Thus, financial capital is more likely to enter the ecological and environmental fields and industries, thus contributing to the promotion of IE. Therefore, the financial industry should continue to play a capital-oriented role in promoting the flow of financial capital to ecological industries and should become an important measure to enhance IE in the YRB.
(5)
The level of research and technology is expressed as the share of research and technology expenditures in GDP. First, the effect of research and technology on IE in the basin was positive and passed the significance test in the 25th and 50th quantiles. That is, a 1% increase in the level of research and technology increased IE at the 25th and 50th quantiles by 0.0302% and 0.0454%, respectively. Second, the impact of research and technology on IE shifted from positive promotion to negative inhibition in both the upstream and midstream regions, while the positive promoting effect in the downstream region also tended to decrease. It indicated that the level of clean and green production technologies in the YRB is still relatively rudimentary at the present time, and therefore the contribution to IE at the higher quartiles is relatively limited. However, it is undeniable that by continuing to increase investment in research and improve the level of science and technology to achieve IE, it has been valued and gradually transformed into realistic initiatives. For example, the application of “paste filling technology” in the mining process is a typical representative. This technology prepares mine solid waste such as full-tailing sand into a highly concentrated slurry with the characteristics of saturated state, no water, and toothpaste. Then, it is filled into the surface collapse area or underground mining area, effectively realizing the comprehensive utilization of mine solid waste, thus realizing IE. In the mines of Jinchuan Group in Jinchang City, Gansu Province, a full-tailing sand-waste plaster body intelligent filling system had been established, which effectively relieved the pressure of surface waste rock stockpiles as well as tailing stockpiles and improved the level of solid waste reuse in Jinchuan mines and achieved good economic and ecological benefits. Taiyuan City, Shanxi Province, is cooperating with Huawei Group to build a “smart mine” through 5G technology to realize the industrial internet in the area. The “smart mine” will enable efficient, unmanned, safe, and green mining by connecting the information flow of all aspects of the mine. It can be said that science and technology will be an important contributing factor to IE in the YRB in the future.

5. Discussion

This study examined the spatial and temporal variation in IE and its influencing factors in the YRB. Although relevant studies have been conducted to analyze the relationship between economy and ecology within the region, our study presents some innovations and provides a new perspective for policy making in the YRB.
The results of the spatial and temporal evolution of IE showed that the overall IE of the YRB has improved, with a large regional difference. The mean value of IE was ranked from high to low as downstream, midstream, and upstream regions, respectively, and this regional difference showed an increasing trend. In terms of spatial distribution, the level of IE showed a certain spatial distribution characteristic of “dispersion mosaic”. This is consistent with the results of Song [70]. Therefore, for the YRB, the goal of improving overall IE must not be achieved without the joint efforts of the upstream, midstream, and downstream regions [79].
The results of the analysis of the internal driving mechanism of IE revealed that, first, there were differences in the trends of changes between the two subsystems that constitute IE. That is, while the efficiency of the industrial system in the YRB increased, the efficiency of the ecosystem gradually decreased. This suggests, to some extent, that the increased IE in the YRB during the study period mainly came from the raised efficiency of the industrial system. The results of the study verified that although the YRB has enhanced environmental protection, living and production activities still have a large negative impact on the ecological environment [80]. Second, the CCD between the industrial system and the ecosystem in the YRB had improved but was still at the stage of moderate disorder, which is consistent with the results of Li et al. on the coupling analysis of ecological and economic development in the YRB. It also further demonstrated the importance of the coordination between the two systems for the overall IE of the basin [81]. Third, cities with high CCD of industrial systems and ecosystems in the YRB showed a tendency to expand from downstream to upstream and inland areas, consistent with the findings of some studies [82].
The results of the study on the external influencing factors of IE showed that to enhance IE of the YRB should give full play to the positive role of external factors. The influence of population on IE showed a significant step-like feature. The expansion of production and living space brought about by population growth squeezes ecological space to a certain extent, indicating that the government needed to regulate the population distribution of municipalities within the YRB for the purpose of IE [59]. Human capital accumulation helps overcome the negative impact of diminishing material marginal returns, and the positive contribution of downstream human capital to IE proved that human capital can be an important driving force in improving IE [68,82,83]. The positive contribution of government control to overall IE in the YRB supports that the realization of the IE goal requires rational use of the positive effect of a government active in environmental regulation [37,84]. The effect of financial level on the ecology of industries in the YRB has a gradual increase from upstream to downstream, which is consistent with existing studies and again proves that economic development is the basis for the leading role of the financial sector [82]. The more significant role of research and technology in enhancing IE in the downstream region of the YRB indicates that research and technology innovation is indeed an external driving force in enhancing IE, but this promoting role was not significant in the upstream and midstream regions in the studied period; this finding was consistent with the existing studies [70,85].

6. Conclusions and Limitations

The YRB, an important ecological functional area in China, faces serious environmental and economic problems. Therefore, the synergistic development of its economy and ecology is an important issue affecting the high-quality development of the basin [86]. This study first constructed an index system of IE for each prefecture-level city in the YRB and evaluated IE in the study geographic area from 2003 to 2020 using the entropy weighting method. It also portrayed the evolutionary characteristics of IE in both time and space. Furthermore, the coupled coordination degree model was used to analyze the internal driving mechanisms affecting the IE of the basin. Finally, the external influences on cities along the YRB were examined using a panel quantile model, and the following conclusions were drawn:
(1)
The overall IE of the YRB has improved, with a large regional difference. In terms of spatial distribution, the level of IE showed a certain spatial distribution characteristic of “dispersion mosaic”.
(2)
There were differences in the trends of changes between the two subsystems that constitute IE. The CCD among prefecture-level cities in the YRB is in a moderately disordered stage.
(3)
The population concentration, human capital, government control, financial level, and technology level are all important external factors influencing the change in IE in the YRB. Moreover, each external factor shows a more obvious heterogeneity in the upstream, midstream, and downstream regions.
This study portrays IE in the basin from multiple perspectives and examined the influence of external factors on IE. However, as the basin is a geographically extensive area with significant internal differences, the level of economic development and urgency of ecological protection vary significantly. In future studies, we will assign different weights to the index system according to the different positions in the upper, middle, and lower regions when evaluating and portraying IE in the YRB to develop a more detailed analysis. At the same time, considering the availability of some data, future research can start from a certain industry and collect more micro data to conduct corresponding research.

Author Contributions

Conceptualization, M.Z. and H.W.; methodology, M.Z.; formal analysis, M.Z.; writing—original draft preparation, M.Z.; writing—review and editing, M.Z. and H.W.; supervision, H.W.; funding acquisition, M.Z. and H.W. All authors have read and agreed to the published version of the manuscript.

Funding

This research was funded by the Youth Project of the Philosophy and Social Sciences Plan of Gansu Province, entitled “A study on Eco-industrial Development in the Gansu Section of the Yellow River Basin from a Symbiotic Perspective”, grant number 2021QN019, and the General Program of Humanities and Social Sciences in Gansu Province, entitled “Research on Cultivation and Green Development Model of Eco-industry in Qilian Mountain National Park and Surrounding Areas”, grant number 20ZC18.

Data Availability Statement

The data that support the findings of this study are available on reasonable request from the corresponding author.

Conflicts of Interest

The authors declare no conflict of interest. The funders had no role in the design of the study; in the collection, analyses, or interpretation of data; in the writing of the manuscript; or in the decision to publish the results.

References

  1. Gardiner, R.; Hajek, P. Municipal waste generation, R&D intensity, and economic growth nexus—A case of EU regions. Waste Manag. 2020, 114, 124–135. [Google Scholar] [PubMed]
  2. Magazzino, C.; Mele, M.; Schneider, N.; Sarkodie, S.A. Waste generation, wealth and GHG emissions from the waste sector: Is Denmark on the path towards circular economy? Sci. Total Environ. 2021, 755, 142510. [Google Scholar] [CrossRef] [PubMed]
  3. Zhao, J.; Zhou, N. Impact of human health on economic growth under the constraint of environment pollution. Technol. Forecast. Soc. Chang. 2021, 169, 120828. [Google Scholar] [CrossRef]
  4. Li, Y.; Li, J.; Zhou, Y. Dynamic evaluation, regional disparity, and spatial correlation of industrial ecologicalization level in China. Environ. Sci. Pollut. Res. 2022, 29, 39359–39374. [Google Scholar] [CrossRef]
  5. Hao, Y.; Wu, Y.; Wang, L.; Huang, J. Re-examine environmental Kuznets curve in China: Spatial estimations using environmental quality index. Sustain. Cities Soc. 2018, 42, 498–511. [Google Scholar] [CrossRef]
  6. Yao, J.; Xu, P.; Huang, Z. Impact of urbanization on ecological efficiency in China: An empirical analysis based on provincial panel data. Ecol. Indic. 2021, 129, 107827. [Google Scholar] [CrossRef]
  7. Fang, Y.; Cote, R.P.; Qin, R. Industrial sustainability in China: Practice and prospects for eco-industrial development. J. Environ. Manag. 2007, 83, 315–328. [Google Scholar] [CrossRef] [PubMed]
  8. Sasmaz, M.U.; Karamıklı, A.; Akkucuk, U. The relationship between renewable energy use and health expenditures in EU countries. Eur. J. Health Econ. 2021, 22, 1129–1139. [Google Scholar] [CrossRef]
  9. Yoon, S.; Nadvi, K. Industrial clusters and industrial ecology: Building ‘eco-collective efficiency’ in a South Korean cluster. Geoforum 2018, 90, 159–173. [Google Scholar] [CrossRef]
  10. Sun, Y.; Wang, N. Development and correlations of the industrial ecology in China’s Loess Plateau: A study based on the coupling coordination model and spatial network effect. Ecol. Indic. 2021, 132, 108332. [Google Scholar] [CrossRef]
  11. Frosch, R.A.; Gallopoulos, N.E. Strategies for manufacturing. Sci. Am. 1989, 261, 144–153. [Google Scholar] [CrossRef]
  12. Erkman, S. Industrial ecology: A new perspective on the future of the industrial system. Swiss Med. Wkly. 2001, 131, 531–538. [Google Scholar] [CrossRef] [PubMed]
  13. Graedel, T.E. On the concept of industrial ecology. Annu. Rev. Energy Environ. 1996, 21, 69–98. [Google Scholar] [CrossRef] [Green Version]
  14. Ehrenfeld, J.; Gertler, N. Industrial Ecology in Practice: The Evolution of Interdependence at Kalundborg. J. Ind. Ecol. 2008, 1, 67–79. [Google Scholar] [CrossRef] [Green Version]
  15. Mathews, J.A.; Tan, H. Progress Toward a Circular Economy in China. J. Ind. Ecol. 2011, 15, 435–457. [Google Scholar] [CrossRef]
  16. Bai, L.; Qiao, Q.; Yao, Y.; Guo, J.; Xie, M. Insights on the development progress of National Demonstration eco-industrial parks in China. J. Clean. Prod. 2014, 70, 4–14. [Google Scholar] [CrossRef]
  17. Roberts, B.H. The application of industrial ecology principles and planning guidelines for the development of eco-industrial parks: An Australian case study. J. Clean. Prod. 2004, 12, 997–1010. [Google Scholar] [CrossRef]
  18. Belaud, J.-P.; Adoue, C.; Vialle, C.; Chorro, A.; Sablayrolles, C. A circular economy and industrial ecology toolbox for developing an eco-industrial park: Perspectives from French policy. Clean Technol. Environ. Policy 2019, 21, 967–985. [Google Scholar] [CrossRef] [Green Version]
  19. Singhal, S.; Kapur, A. Industrial estate planning and management in India--an integrated approach towards industrial ecology. J. Environ. Manag. 2002, 66, 19–29. [Google Scholar] [CrossRef]
  20. Buda, G.; Ricz, J. Industrial symbiosis and industrial policy for sustainable development in Uganda. Rev. Evol. Political Econ. 2023. [Google Scholar] [CrossRef]
  21. Lowe, E.A.; Evans, L.K. Industrial ecology and industrial ecosystems. J. Clean. Prod. 1995, 3, 47–53. [Google Scholar] [CrossRef]
  22. Lu, G.; Sheng, L.; Tang, C. Static and dynamic analysis of China’s industrial ecologization level—Empirical study based on provincial data. China Ind. Econ. 2012, 3, 147–159. [Google Scholar]
  23. Chiu, A.S.F.; Yong, G. On the industrial ecology potential in Asian Developing Countries. J. Clean. Prod. 2004, 12, 1037–1045. [Google Scholar] [CrossRef]
  24. Korhonen, J. Industrial ecology in the strategic sustainable development model: Strategic applications of industrial ecology. J. Clean. Prod. 2004, 12, 809–823. [Google Scholar] [CrossRef]
  25. Wang, Z.; Sun, Y.; Wang, B. How does the new-type urbanisation affect CO2 emissions in China? An empirical analysis from the perspective of technological progress. Energy Econ. 2019, 80, 917–927. [Google Scholar] [CrossRef]
  26. Seuring, S. Industrial ecology, life cycles, supply chains: Differences and interrelations. Bus. Strategy Environ. 2004, 13, 306–319. [Google Scholar] [CrossRef] [Green Version]
  27. Ardente, F.; Cellura, M.; Lo Brano, V.; Mistretta, M. Life cycle assessment-driven selection of industrial ecology strategies. Integr. Environ. Assess Manag. 2010, 6, 52–60. [Google Scholar] [CrossRef] [PubMed]
  28. Ingrao, C.; Scrucca, F.; Matarazzo, A.; Arcidiacono, C.; Zabaniotou, A. Freight transport in the context of industrial ecology and sustainability: Evaluation of uni- and multi-modality scenarios via life cycle assessment. Int. J. Life Cycle Assess. 2020, 26, 127–142. [Google Scholar] [CrossRef]
  29. Baldassarre, B.; Schepers, M.; Bocken, N.; Cuppen, E.; Korevaar, G.; Calabretta, G. Industrial Symbiosis: Towards a design process for eco-industrial clusters by integrating Circular Economy and Industrial Ecology perspectives. J. Clean. Prod. 2019, 216, 446–460. [Google Scholar] [CrossRef]
  30. Sendra, C.; Gabarrell, X.; Vicent, T. Material flow analysis adapted to an industrial area. J. Clean. Prod. 2007, 15, 1706–1715. [Google Scholar] [CrossRef]
  31. Shao, L.; Yu, X.; Feng, C. Evaluating the eco-efficiency of China’s industrial sectors: A two-stage network data envelopment analysis. J. Environ. Manag. 2019, 247, 551–560. [Google Scholar] [CrossRef] [PubMed]
  32. Shah, I.H.; Dong, L.; Park, H.-S. Tracking urban sustainability transition: An eco-efficiency analysis on eco-industrial development in Ulsan, Korea. J. Clean. Prod. 2020, 262, 121286. [Google Scholar] [CrossRef]
  33. Li, W.; Chen, X.; Wang, Y. Spatiotemporal Patterns and Influencing Factors of Industrial Ecological Efficiency in Northeast China. Sustainability 2022, 14, 9691. [Google Scholar] [CrossRef]
  34. Xia, C.; Zhao, Y.; Zhao, Q.; Wang, S.; Zhang, N. Exact eco-efficiency measurement in the Yellow River Basin: A new non-parametric approach. Sustainability 2022, 14, 13103. [Google Scholar] [CrossRef]
  35. Xu, A.; Wang, C.; Tang, D.; Ye, W. Tourism circular economy: Identification and measurement of tourism industry ecologization. Ecol. Indic. 2022, 144, 109476. [Google Scholar] [CrossRef]
  36. Luo, J.; Zhang, X.; Shi, P. Land Use Multi-Functionality and Zoning Governance Strategy of Densely Populated Areas in the Upper Reaches of the Yellow River: A Case Study of the Lanzhou–Xining Region, China. Land 2022, 11, 897. [Google Scholar] [CrossRef]
  37. Shi, L.; Cai, Z.; Ding, X.; Di, R.; Xiao, Q. What Factors Affect the Level of Green Urbanization in the Yellow River Basin in the Context of New-Type Urbanization? Sustainability 2020, 12, 2488. [Google Scholar] [CrossRef] [Green Version]
  38. Kong, Y.; Liu, J. Sustainable port cities with coupling coordination and environmental efficiency. Ocean. Coast. Manag. 2021, 205, 105534. [Google Scholar] [CrossRef]
  39. Fang, C.; Liu, H.; Li, G. International progress and evaluation on interactive coupling effects between urbanization and the eco-environment. J. Geogr. Sci. 2016, 26, 1081–1116. [Google Scholar] [CrossRef]
  40. Li, B.; Wang, Z.; Xu, F. Does Optimization of Industrial Structure Improve Green Efficiency of Industrial Land Use in China? Int. J. Environ. Res. Public Health 2022, 19, 9177. [Google Scholar] [CrossRef]
  41. Li, B.; Shi, Z.; Tian, C. Spatio-temporal difference and influencing factors of environmental adaptability measurement of human-sea economic system in Liaoning coastal area. Chin. Geogr. Sci. 2018, 28, 313–324. [Google Scholar] [CrossRef] [Green Version]
  42. Dong, H.; Xu, G.; Rehman, H.U. The spatial panel econometric diagnosis of the influence of green finance on Chinese economic ecologization. Environ. Sci. Pollut. Res. 2023, 30, 15671–15688. [Google Scholar] [CrossRef]
  43. Qiu, F.; Chen, Y.; Tan, J.; Liu, J.; Zheng, Z.; Zhang, X. Spatial-temporal heterogeneity of green development efficiency and its influencing factors in growing metropolitan area: A case study for the Xuzhou metropolitan area. Chin. Geogr. Sci. 2020, 30, 352–365. [Google Scholar] [CrossRef]
  44. Wang, C.; Xu, L.; Huang, M.; Su, X.; Lai, R.; Xu, A. Research on the evolution of spatial network structure of tourism eco-efficiency and its influencing factors in China’s provinces based on carbon emission accounting. PLoS ONE 2022, 17, e0272667. [Google Scholar] [CrossRef] [PubMed]
  45. Wang, L.; Su, M.; Kong, H.; Ma, Y. The impact of marine technological innovation on the upgrade of China’s marine industrial structure. Ocean. Coast. Manag. 2021, 211, 105792. [Google Scholar] [CrossRef]
  46. Wu, M. Measurement of regional industrial ecological efficiency in China and an analysis of its influencing factors. J. World Econ. Res. 2020, 9, 33–40. [Google Scholar]
  47. He, K.; Zhu, N.; Jiang, W.; Zhu, C. Efficiency Evaluation of Chinese Provincial Industrial System Based on Network DEA Method. Sustainability 2022, 14, 5264. [Google Scholar] [CrossRef]
  48. Chen, Y.; Li, X.; Sun, Y.; Chen, Y. Evolution Characteristics and Its Influencing Factors of Industrial Ecologicalization in the Coastal Areas of China. Econ. Geogr. 2020, 40, 133–144. [Google Scholar] [CrossRef]
  49. Sun, X. Green city and regional environmental economic evaluation based on entropy method and GIS. Environ. Technol. Innov. 2021, 23, 101667. [Google Scholar] [CrossRef]
  50. Sikdar, S.K.; Sengupta, D.; Harten, P. More on aggregating multiple indicators into a single index for sustainability analyses. Clean Technol. Environ. Policy 2012, 14, 765–773. [Google Scholar] [CrossRef]
  51. Jin, H.; Qian, X.; Chin, T.; Zhang, H. A global assessment of sustainable development based on modification of the human development index via the entropy method. Sustainability 2020, 12, 3251. [Google Scholar] [CrossRef] [Green Version]
  52. Shannon, C.E. A mathematical theory of communication. Bell Syst. Tech. J. 1948, 27, 379–423. [Google Scholar] [CrossRef] [Green Version]
  53. Wang, Z.; Wang, J.; Zhang, G.; Wang, Z. Evaluation of Agricultural Extension Service for Sustainable Agricultural Development Using a Hybrid Entropy and TOPSIS Method. Sustainability 2021, 13, 347. [Google Scholar] [CrossRef]
  54. Zhao, H.; Guo, S.; Zhao, H. Comprehensive benefit evaluation of eco-industrial parks by employing the best-worst method based on circular economy and sustainability. Environ. Dev. Sustain. 2018, 20, 1229–1253. [Google Scholar] [CrossRef]
  55. Jin, S.; Mei, Z.; Duan, K. Coupling Coordination of China’s Agricultural Environment and Economy under the New Economic Background. Agriculture 2022, 12, 1147. [Google Scholar] [CrossRef]
  56. Zeng, P.; Wei, X.; Duan, Z. Coupling and coordination analysis in urban agglomerations of China: Urbanization and ecological security perspectives. J. Clean. Prod. 2022, 365, 132730. [Google Scholar] [CrossRef]
  57. Sun, X.; Zhang, Z. Coupling and Coordination Level of the Population, Land, Economy, Ecology and Society in the Process of Urbanization: Measurement and Spatial Differentiation. Sustainability 2021, 13, 3171. [Google Scholar] [CrossRef]
  58. Li, Y.; Li, Y.; Zhou, Y.; Shi, Y.; Zhu, X. Investigation of a coupling model of coordination between urbanization and the environment. J. Environ. Manag. 2012, 98, 127–133. [Google Scholar] [CrossRef]
  59. Li, J.; Sun, W.; Li, M.; Meng, L. Coupling coordination degree of production, living and ecological spaces and its influencing factors in the Yellow River Basin. J. Clean. Prod. 2021, 298, 126803. [Google Scholar] [CrossRef]
  60. Yuan, J.; Bian, Z.; Yan, Q.; Pan, Y. Spatio-temporal distributions of the land use efficiency coupling coordination degree in mining cities of western China. Sustainability 2019, 11, 5288. [Google Scholar] [CrossRef] [Green Version]
  61. Allard, A.; Takman, J.; Uddin, G.S.; Ahmed, A. The N-shaped environmental Kuznets curve: An empirical evaluation using a panel quantile regression approach. Environ. Sci. Pollut. Res. 2018, 25, 5848–5861. [Google Scholar] [CrossRef] [PubMed] [Green Version]
  62. Cade, B.S.; Noon, B.R. A gentle introduction to quantile regression for ecologists. Front. Ecol. Environ. 2003, 1, 412–420. [Google Scholar] [CrossRef]
  63. Hübler, M. The inequality-emissions nexus in the context of trade and development: A quantile regression approach. Ecol. Econ. 2017, 134, 174–185. [Google Scholar] [CrossRef]
  64. Wang, M.; Zhao, X.; Gong, Q.; Ji, Z. Measurement of regional green economy sustainable development ability based on entropy weight-topsis-coupling coordination degree—A case study in Shandong Province, China. Sustainability 2019, 11, 280. [Google Scholar] [CrossRef] [Green Version]
  65. Cudjoe, D.; Wang, H.; Zhu, B. Assessment of the potential energy and environmental benefits of solid waste recycling in China. J. Environ. Manag. 2021, 295, 113072. [Google Scholar] [CrossRef]
  66. Fan, Y.; Bai, B.; Qiao, Q.; Kang, P.; Zhang, Y.; Guo, J. Study on eco-efficiency of industrial parks in China based on data envelopment analysis. J. Environ. Manag. 2017, 192, 107–115. [Google Scholar] [CrossRef]
  67. Li, Z.; Zhang, W.; Sarwar, S.; Hu, M. The spatio-temporal interactive effects between ecological urbanization and industrial ecologization in the Yangtze River Delta region. Sustain. Dev. 2023, 1–18. [Google Scholar] [CrossRef]
  68. Liu, L.; Yang, Y.; Liu, S.; Gong, X.; Zhao, Y.; Jin, R.; Duan, H.; Jiang, P. A comparative study of green growth efficiency in Yangtze River Economic Belt and Yellow River Basin between 2010 and 2020. Ecol. Indic. 2023, 150, 110214. [Google Scholar] [CrossRef]
  69. Guo, F.; Tong, L.; Liu, Z.; Zhao, H.; Hou, A. Spatial-temporal pattern and influencing factors of industrial ecology in Shandong province: Based on panel data of 17 cities. Geogr. Res. 2019, 38, 2226–2238. [Google Scholar]
  70. Song, C.; Yin, G.; Lu, Z.; Chen, Y. Industrial ecological efficiency of cities in the Yellow River Basin in the background of China’s economic transformation: Spatial-temporal characteristics and influencing factors. Environ. Sci. Pollut. Res. Int. 2022, 29, 4334–4349. [Google Scholar] [CrossRef]
  71. Liu, Y.; Li, J.; Yang, Y. Strategic adjustment of land use policy under the economic transformation. Land Use Policy 2018, 74, 5–14. [Google Scholar] [CrossRef]
  72. An, S.; Zhang, S.; Hou, H.; Zhang, Y.; Xu, H.; Liang, J. Coupling Coordination Analysis of the Ecology and Economy in the Yellow River Basin under the Background of High-Quality Development. Land 2022, 11, 1235. [Google Scholar] [CrossRef]
  73. Zhang, K.; Dong, Z.; Guo, L.; Boyer, E.W.; Liu, J.; Chen, J.; Fan, B. Coupled coordination spatiotemporal analyses inform sustainable development and environmental protection for the Yellow River Basin of China. Ecol. Indic. 2023, 151, 110283. [Google Scholar] [CrossRef]
  74. Zhang, H.; Shen, L.; Zhong, S.; Elshkaki, A. Coal resource and industrial structure nexus in energy-rich area: The case of the contiguous area of Shanxi and Shaanxi Provinces, and Inner Mongolia Autonomous Region of China. Resour. Policy 2020, 66, 101646. [Google Scholar] [CrossRef]
  75. Smith, B. The resource curse exorcised: Evidence from a panel of countries. J. Dev. Econ. 2015, 116, 57–73. [Google Scholar] [CrossRef] [Green Version]
  76. Tolvanen, A.; Eilu, P.; Juutinen, A.; Kangas, K.; Kivinen, M.; Markovaara-Koivisto, M.; Naskali, A.; Salokannel, V.; Tuulentie, S.; Simila, J. Mining in the Arctic environment—A review from ecological, socioeconomic and legal perspectives. J. Environ. Manag. 2019, 233, 832–844. [Google Scholar] [CrossRef]
  77. Li, Q.; Zeng, F.e.; Liu, S.; Yang, M.; Xu, F. The effects of China’s sustainable development policy for resource-based cities on local industrial transformation. Resour. Policy 2021, 71, 101940. [Google Scholar] [CrossRef]
  78. Fan, F.; Zhang, X. Transformation effect of resource-based cities based on PSM-DID model: An empirical analysis from China. Environ. Impact Assess. Rev. 2021, 91, 106648. [Google Scholar] [CrossRef]
  79. Xu, J.-J.; Wang, H.-J.; Tang, K. The sustainability of industrial structure on green eco-efficiency in the Yellow River Basin. Econ. Anal. Policy 2022, 74, 775–788. [Google Scholar] [CrossRef]
  80. Jiang, L.; Zuo, Q.; Ma, J.; Zhang, Z. Evaluation and prediction of the level of high-quality development: A case study of the Yellow River Basin, China. Ecol. Indic. 2021, 129, 107994. [Google Scholar] [CrossRef]
  81. Li, D.; Liang, D.; Li, T.; Chen, S. Ecological-economic coordination in the Yellow River basin: Spatial and temporal evolution and driving mechanisms. Environ. Dev. Sustain. 2022. [Google Scholar] [CrossRef]
  82. Liu, K.; Qiao, Y.; Shi, T.; Zhou, Q. Study on coupling coordination and spatiotemporal heterogeneity between economic development and ecological environment of cities along the Yellow River Basin. Environ. Sci. Pollut. Res. Int. 2021, 28, 6898–6912. [Google Scholar] [CrossRef] [PubMed]
  83. Luo, L.; Wang, Y.; Liu, Y.; Zhang, X.; Fang, X. Where is the pathway to sustainable urban development? Coupling coordination evaluation and configuration analysis between low-carbon development and eco-environment: A case study of the Yellow River Basin, China. Ecol. Indic. 2022, 144, 109473. [Google Scholar] [CrossRef]
  84. Chen, X.; Chang, C.P. Fiscal decentralization, environmental regulation, and pollution: A spatial investigation. Environ. Sci. Pollut. Res. Int. 2020, 27, 31946–31968. [Google Scholar] [CrossRef] [PubMed]
  85. Chen, W.; Si, W.; Chen, Z.-M. How technological innovations affect urban eco-efficiency in China: A prefecture-level panel data analysis. J. Clean. Prod. 2020, 270, 122479. [Google Scholar] [CrossRef]
  86. Zhao, Y.; Hou, P.; Jiang, J.; Zhai, J.; Chen, Y.; Wang, Y.; Bai, J.; Zhang, B.; Xu, H. Coordination study on ecological and economic coupling of the yellow river basin. Int. J. Environ. Res. Public Health 2021, 18, 10664. [Google Scholar] [CrossRef] [PubMed]
Figure 1. Evolution of the IE of the YRB.
Land 12 01277 g001
Figure 2. Distribution of IE at the beginning and end of the study period in the YRB.
Land 12 01277 g002
Figure 3. Evolution of the efficiency of the industrial system in the YRB.
Land 12 01277 g003
Figure 4. Evolution of eco-efficiency in the YRB.
Land 12 01277 g004
Figure 5. Distribution of the CCD between the industrial system and the ecosystem at the beginning and end of the study period in the YRB.
Land 12 01277 g005
Table 1. Overview of the YRB.
IndicatorsYRBChinaProportion
(%)
Watershed area (square km)75,277.309,506,678.007.92
Total water resources (billion m3)7272.8031,605.2023.01
Forest area (million hectares)7327.3222,044.6233.23
Area of national nature reserve (million hectares)3309.709821.3033.69
Area of irrigated arable land (thousands of hectares)21,912.5069,160.5031.68
Total sown area of crops (thousands of hectares)57,689.50167,487.0034.44
Meat production (million tons)2528.707748.4032.63
Raw coal production (million tons)315,365.00390,158.0080.83
Natural gas production (billion m3)1178.781924.9561.23
Population (million people)42,140.00141,212.0029.84
GDP (billion CNY)253,861.611,012,415.0025.07
Table 2. Index system of IE in the YRB.
Target LayerGuideline LayerEvaluation IndicatorMeasuring UnitPolarity
IndustrialIndustrial Per capita GDPCNY+
EcologySystemGDP growth rate%+
Tertiary sector as a percentage of GDP%+
Industrial rationalization Tl index+
Per capita available foreign investmentCNY/person+
EcosystemUnit GDP energy consumptionTons of standard coal/10,000 CNY-
Unit GDP power consumptionkWh/10,000 CNY-
Unit GDP water consumptionCubic m/CNY-
Industrial SO2 emissions per unit of GDPTons/10,000 CNY-
Industrial wastewater discharge per unit of GDPTons/10,000 CNY-
Industrial solid waste comprehensive utilization%+
Pollution-free treatment rate of living garbage%+
Centralized processing rate of industrial wastewater treatment plant%+
Per capita park green areaSquare m/person+
Green-area coverage in the built-up area%+
Table 3. Descriptive statistics for the index data.
VariablesMeanStandard
Deviation
Minimum ValueMaximum Value
Per capita GDP36,31529,8401892256,877
GDP growth rate10.885.381−20.63108.8
Tertiary sector as a percentage of GDP36.889.97011.3868.67
Industrial rationalization 0.3360.2990.0001163.902
Per capita available foreign investment531.6102208631
Unit GDP energy consumption0.001730.003030.000007480.0359
Unit GDP power consumption820.0110335.4014,348
Unit GDP water consumption9.72314.820.687305.8
SO2 emissions per unit of GDP0.01000.01690.0000150.238
Industrial wastewater discharge per unit of GDP6.2929.1080.0381215.2
Industrial solid-waste comprehensive utilization73.5326.260.240106.5
Pollution-free treatment rate of living garbage83.3523.312.710100
Centralized processing rate of wastewater treatment plant74.8124.761100
Per capita park green area12.0015.780.0764131.8
Green-area coverage in the built-up area35.379.350095.25
Table 4. Distribution of the IE in the YRB.
20032020
UpstreamMidstreamDownstreamUpstreamMidstreamDownstream
First echelon0%0%100%25%50%25%
Second echelon27%9%64%11%0%89%
Third echelon17%21%62%20%13%67%
Fourth echelon56%29%15%48%20%32%
Fifth echelon41%59%0%36%61%3%
Table 5. Global Moran’s I index of IE in the YRB.
YearMORAN-IZ Value
20030.463 ***7.679
20040.449 ***7.425
20050.390 ***6.404
20060.387 ***6.333
20070.334 ***5.502
20080.342 ***5.573
20090.293 ***4.953
20100.347 ***5.743
20110.267 ***4.475
20120.249 ***4.247
20130.248 ***4.189
20140.260 ***4.369
20150.213 ***3.637
20160.222 ***3.767
20170.160 ***2.756
20180.158 **2.720
20190.111 *1.914
20200.126 **2.159
Notes: *, **, and *** represent significance at the 0.1, 0.05, and 0.01 level, respectively.
Table 6. Distribution of the CCD between the industrial system and the ecosystem in the YRB.
20032020
UpstreamMidstreamDownstreamUpstreamMidstreamDownstream
First echelon6%18%76%11%22%67%
Second echelon40%27%33%34%13%53%
Third echelon44%30%26%48%28%24%
Fourth echelon31%38%31%30%52%17%
Fifth echelon67%33%0%45%45%9%
Table 7. Panel quantile regression results of external influences on IE in the YRB.
Entire WatershedUpstream
VariablesQuantile (25)Quantile (50)Quantile (75)Quantile (25)Quantile (50)Quantile (75)
lnpopdes0.0847 ***0.0660 ***0.0606 ***0.1085 ***0.0781 **−0.0062
(26.79)(12.49)(2.66)(8.46)(2.43)(−0.30)
lnhuman0.0696 ***0.0529 ***0.0338 ***0.0924 ***0.01560.0357 ***
(46.49)(3.89)(3.96)(3.65)(0.83)(3.78)
lngov0.1166 ***0.1267 ***0.0946 ***0.0943 ***0.1383 ***0.1379 ***
(6.90)(4.21)(4.40)(3.23)(3.40)(3.38)
lnfin−0.0399 ***−0.0380 **−0.0460−0.0043−0.0042−0.0674
(−11.16)(−2.32)(−0.85)(−0.21)(−0.20)(−1.56)
lntec0.0302 ***0.0454 ***0.00450.0199 *0.0160−0.0165
(2.99)(9.94)(0.40)(1.89)(0.60)(−0.90)
Observations180018001800648648648
Number of groups100100100363636
*, **, and *** are significant at the 0.1, 0.05, and 0.01 level, respectively.
Table 8. Panel quantile regression results of external influences on IE in the YRB.
MidstreamDownstream
VariablesQuantile (25)Quantile (50)Quantile (75)Quantile (25)Quantile (50)Quantile (75)
lnpopdes−0.00460.0213 ***−0.4904−0.1327 ***−0.1726 ***−0.1190 ***
(−0.46)(6.23)(−0.63)(−11.74)(−6.92)(−4.62)
lnhuman0.0501 ***0.0872 ***−0.61440.1161 ***0.0678 **0.1750 ***
(4.63)(25.55)(−0.39)(14.53)(2.25)(13.99)
lngov0.0979 ***0.1337 ***0.4719−0.0208 **−0.1444 ***−0.1235 **
(5.99)(19.12)(0.49)(−2.47)(−3.62)(−2.23)
lnfin−0.00060.0470 ***0.64510.0749 ***0.00390.0839 ***
(−0.03)(5.78)(0.47)(9.00)(0.08)(2.88)
lntec0.0353 ***0.0572 ***−0.61960.0280 ***0.0604 ***0.0200
(4.00)(17.28)(−0.52)(5.24)(4.07)(1.29)
Observations540540540612612612
Number of groups303030343434
**, and *** are significant at the 0.05, and 0.01 level, respectively.
Disclaimer/Publisher’s Note: The statements, opinions and data contained in all publications are solely those of the individual author(s) and contributor(s) and not of MDPI and/or the editor(s). MDPI and/or the editor(s) disclaim responsibility for any injury to people or property resulting from any ideas, methods, instructions or products referred to in the content.

