Article

Innovation Networks of Science and Technology Firms: Evidence from China

1
Department of Urban Planning, School of Urban Design, Wuhan University, Wuhan 430072, China
2
Digital City Research Center, School of Urban Design, Wuhan University, Wuhan 430072, China
3
Center for Geographic Analysis, Harvard University, Cambridge, MA 02138, USA
*
Author to whom correspondence should be addressed.
Land 2023, 12(7), 1283; https://doi.org/10.3390/land12071283
Submission received: 7 June 2023 / Revised: 21 June 2023 / Accepted: 21 June 2023 / Published: 25 June 2023

Abstract

:
Examining and assessing the characteristics of innovation networks among science and technology firms at the city level is essential for comprehending the innovation patterns of cities and improving their competitiveness. Nevertheless, the majority of studies in this field solely rely on patent and paper data, neglecting the analysis of networks across diverse scales and dimensions. Websites offer a novel platform for companies to exhibit their products and services, and the utilization of hyperlink data better captures the dynamics of innovative cooperation. Thus, to attain a more realistic and precise comprehension of China’s technology enterprise cooperation networks, enhance the understanding of intra-city and cross-border cooperation within innovation networks, and offer more scientific guidance to cities in enhancing their innovation capabilities by investigating the factors influencing innovation scenarios and the mechanisms of their interactions, this study constructs an innovation network based on the hyperlink data extracted from Chinese science and technology enterprises’ websites in 2022. It explores the network’s inherent characteristics and spatial patterns across multiple dimensions and scales. Additionally, it employs GeoDetector to analyze the driving factors behind the heterogeneity of city quadrants across each dimension. The findings suggest the following: (1) Evident polarization of innovation capability exists, with a more pronounced differentiation of cities between high capability zones. (2) Contrary to the conventional notion of geographical proximity, cross-region website cooperation prevails, with cross-provincial cooperation being more prevalent than intra-provincial cross-city cooperation. (3) Enterprise cooperation tends to align with partners of similar scale, and small and medium-sized enterprises primarily engage in internal cooperation, primarily concentrated in second and third-tier cities. (4) Cities with high degree centrality and structure holes are primarily located in the construction areas of Chinese urban agglomerations, while those with low degree centrality and structure holes are situated near double-high cities. (5) The spatial heterogeneity of innovation networks across the four dimensions is primarily influenced by STI, while cooperation intensity and innovation capacity dimensions are strongly influenced by traffic capacity. The intra- and inter-city cooperation intensity dimensions are significantly impacted by administrative grade, and the enterprise scale and network location dimensions are most affected by the level of digital infrastructure.

1. Introduction

The urban innovation network plays a crucial role in exploring collaborative innovation within and between cities, as it reflects the exchange of innovative ideas and practices, as well as the intensity and dissemination capacity of urban innovation elements. Enterprises, as micro-entities within urban innovation, serve as key actors in shaping urban innovation ecosystems, and their science and innovation activities at the city level are essential focal points for analyzing urban innovation networks. Simultaneously, the advent of information innovation has brought new dimensions to the study of innovation networks, transforming global industrial development patterns [1]. With the advancement of the mobile Internet, numerous enterprises both domestically and internationally have begun establishing portals to engage with users, showcase product information, and access external innovation resources. These websites contain registration details, product services, cooperation strategies, and more, which may be pertinent to the innovation activities of enterprises. As this trend becomes increasingly prevalent, traditional data such as patents or papers no longer fully capture the dynamics of a firm’s innovation collaboration activities. Thus, innovation metrics need to be updated when constructing collaboration networks.
Freeman [2] originally introduced the concept of innovation networks, highlighting the pivotal role of firm collaborations in shaping the fundamental structure of these networks. Subsequently, interdisciplinary fields such as urban geography, economic statistics, and other social sciences, along with advancements in information technology, have prompted scholars from diverse disciplines to extensively investigate innovation networks. These scholars have analyzed innovation networks from various scales and utilized a wide range of innovation indicators.
The exploration of innovation networks from various perspectives has yielded research findings at different scales and dimensions, although most studies have predominantly focused on a single level. For instance, Anyu Yu et al. assessed the R&D and commercialization status of high-tech firms on a national scale, providing insights into the dynamic evolution of innovation performance at the national level. While this macro-level perspective offers valuable guidance for innovation, it lacks a micro-level examination [3]. Zhang et al. discussed the relationship between cities and innovation from a city-scale perspective, with a particular emphasis on large cities and the reasons behind innovation clustering at that scale. However, their findings may be less applicable to innovation in smaller and medium-scale cities [4]. In a similar vein, Kong, XD et al. focused their research on Shanghai, analyzing the interaction between innovation performance in the high-end equipment manufacturing industry and the characteristics of the cooperative network within Shanghai based on its structural properties. Although their research provides specific insights, its scale is limited and not universally applicable [5]. Previous research has predominantly concentrated on investigating the structure of innovation networks or specific dimensions at a singular spatial scale, primarily emphasizing horizontal features, spatial diversity, and dynamic evolution. However, these studies have not thoroughly explored the underlying causes of spatial pattern variations in these networks. In reality, cooperative innovation activities occur not only within regions but also across regions. Additionally, the characteristics of cooperative networks may differ depending on the dimensions under examination, and the mechanisms through which influential factors exert their influence can also vary across dimensions. Therefore, conducting a comprehensive comparative analysis of cooperative networks across multiple scales and dimensions is crucial. Moreover, an in-depth exploration of the mechanisms that underlie the impact of influential factors on each sub-dimension is essential to develop a comprehensive understanding of the intrinsic features of innovation networks.
The selection of indicators for measuring innovation has gradually expanded from traditional metrics such as paper and patent collaboration and the flow of top talent to include virtual data derived from enterprise websites. For example, Xie and Su utilized 31 consecutive years of Chinese patent data to investigate the temporal and spatial evolution of innovation network patterns [6]. Sun et al. explored the impact of various innovation factors on regional innovation capacity, incorporating data on talent mobility, taxation, and other relevant aspects [7]. However, traditional innovation indicators may not offer an accurate and timely depiction of modern innovation networks [8,9,10]. These indicators often require significant time for collection and processing, resulting in a time lag of over a year between the availability of information and the occurrence of collaboration. As a result, scholars have turned to corporate websites as a source of information for collaborative innovation research. Kinne and Axenbeck utilized the hyperlink structure of corporate websites as an indicator for evaluating innovation, analyzing R&D collaborative activities among entities [11]. Youtie et al. employed a web crawler to extract web text information from 30 German SMEs in the field of nanotechnology, using similarity analysis of the text content to identify the specific stage of innovation development and characterize the cognitive proximity between innovation subjects [12]. Gök et al. employed keyword techniques to collect web text content for evaluating the R&D activities of 296 UK companies, comparing the results with patent and paper indicators and finding that website indicators were more accurate [13]. It is observed that, prior to considering website information as an innovation indicator, the use of traditional and limited data types was common, resulting in a narrow representation of innovation networks. However, leveraging timely and detailed website information can help overcome this limitation and provide insights into the current state of corporate innovation. Nevertheless, accurately describing the structural characteristics of collaborative networks remains a challenge, as the website text currently employed is more suitable for evaluating innovation levels. Therefore, when selecting website information, it is preferable to choose data types that better reflect the connection relationships between nodes in the innovation network. Website hyperlink data, as compared to traditional data, may better capture the distinct characteristics of online collaboration, which may no longer be constrained by geographical costs once a certain level of intensity is reached.
Based on the aforementioned context, we employ the ARGUS web mining tool to crawl cooperation hyperlinks from enterprise websites, enabling the construction of the 2022 Chinese technology industry innovation network. Social Network Analysis (SNA) serves as a valuable tool to characterize the network’s topology, analyze the role played by innovation subjects within the network, and provide insights into the connectivity among subjects. In addition, the two-dimensional quadrant method (TDQ) proves instrumental in distinguishing between different levels of innovation and the unique characteristics of cities within a specific context. Thus, by leveraging these two methods, we delve into the structural characteristics and spatial patterns of the network. Moreover, we establish a comprehensive system of influencing factors that impact the innovation activities of science and technology enterprises. Through the application of GeoDetector, we analyze the degree of influence exerted by these factors and explore their mechanisms of interaction, uncovering urban heterogeneity within each TDQ perspective. Our objective is to offer a comprehensive understanding of the innovation network among Chinese technology enterprises, deepen our knowledge of intra- and inter-city collaboration within the network, explore the factors influencing the collaboration dynamics of innovation across each dimension, and elucidate the mechanisms governing their interactions. This research endeavor aims to provide a scientific foundation for enhancing innovation capacity and fostering coordinated development within the innovation network.
This paper is structured as follows. Section 2 provides an explanation for the selection of the study area and outlines the research framework. Section 3 details the data preparation process and presents the research methodology employed. In Section 4, the empirical results are presented. Subsequently, Section 5 discusses the findings presented in the paper. Finally, Section 6 concludes the paper by summarizing the key points, acknowledging the limitations of the study, and offering prospects for future research.

2. Research Design

2.1. Study Area: China

China provides a unique context for studying regional innovation networks due to its distinctive characteristics as a transitioning economy [14,15]. Chinese policymaking tends to prioritize internal considerations, leading to variations in science and technology policy orientations at the local level [7]. Consequently, this further contributes to the differentiation of cooperative innovation dynamics across different scales. Furthermore, given the complexity of innovation activities in China, a multidimensional and comprehensive examination is necessary to enhance understanding and accurately describe the network [16]. Moreover, the uneven development within China results in the coexistence of multiple stages of innovation in various regions for an extended period. Additionally, there is spatial heterogeneity in innovation performance, which must be explored as a source of variability to foster coordinated development of innovation capabilities.
On the other hand, website hyperlinks enable firms to share information and enhance social visibility in a cost-effective and geographically unrestricted manner. Consequently, an increasing number of Chinese technology firms are engaging in the establishment of open innovation platforms, with corporate websites becoming a new avenue for showcasing innovation capabilities. Presently, there are over 150,000 Chinese firms with websites, of which more than 40,000 feature website cooperation profiles, and over 70,000 have established collaborations. Thus, investigating the collaborative dynamics among these firms can serve as a valuable addition to the evaluation criteria for innovation networks.

2.2. Research Framework

This paper addresses the research gap concerning the need for multi-scale analysis of innovation networks and the limited representativeness of traditional innovation indicators. It specifically focuses on China, which possesses distinctive innovation characteristics, and takes science and technology enterprises as the primary research subjects. The paper constructs a network of Chinese science and technology enterprises based on the hyperlinks found on their websites. Subsequently, it conducts a quantitative analysis of the network’s structural characteristics and explores the factors that drive its formation. The research findings offer valuable insights for improving the existing collaborative network structure and enhancing comprehensive innovation performance. The research process is divided into four stages, as illustrated in Figure 1.

3. Methodology

3.1. ARGUS-Based Web Mining

The data used in this study are divided into two parts: urban statistical data and enterprise data. The urban statistical data are obtained from various Chinese statistical yearbooks and the results of the seventh population census. They include urban economic data such as GDP and public budget expenditure; urban science and technology data such as the number of patents granted for inventions and financial investment in science and technology; and urban population data such as population age and education information. The enterprise data set includes basic information and website information, obtained from the QCC platform and the web mining tool ARGUS, respectively. The basic information includes company registration, staff, and business information, while the website information is the hyperlink data collected through web mining using the Scrapy Python framework [11].
The process of constructing the enterprise database can be divided into several steps. First, a keyword search was conducted in the QCC platform to obtain information on 3.26 million technology enterprises and their affiliations. Next, enterprises in prefecture-level cities and above with websites were selected. The enterprise URLs were then fed into the ARGUS web scraper to retrieve website hyperlink data. To ensure accuracy, data cleaning was necessary. In the first step, the authenticity of each company was determined by checking whether its website displayed corporate products; false companies were removed. In the second step, unique linked objects were identified under each main web page based on registration time and participation information sorting. Duplicate-linked objects were then removed on the principle of one-to-one cooperation. After cleaning, a total of 75,727 collaborative hyperlink data were obtained. Finally, the cleaned hyperlinks were matched with the basic information to form a complete enterprise innovation dataset.

3.2. Social Network Analysis (SNA)

Social network analysis is a widely used method for quantitatively analyzing the relationship structure of networks and their attributes. It allows for the scientific construction of innovation networks and exploration of the influence of network structure characteristics on innovation subjects [17]. In this study, we utilized Gephi and UCINET software to construct innovation networks, where cities served as nodes and website hyperlinks as edges. We measured several network metrics, including degree centrality (DC), closeness centrality (CNC), betweenness centrality (BC), and structural holes (SH). Degree centrality represents the number of collaborative hyperlinks among websites and serves as an indicator of a city’s ability to acquire resources. It quantifies the size of a city’s network connections [18]. Closeness centrality measures the efficiency of information transfer in the network for a particular city. It reflects the time, economic, and other costs required for the subject to transfer resources within the network. Higher closeness centrality indicates greater efficiency in information dissemination [18]. Betweenness centrality quantifies the impact of a city’s position and function within the network on its overall importance. It measures the extent to which a city connects different parts of the network and acts as a bridge or intermediary between other cities. Cities with higher betweenness centrality play a crucial role in connecting various network components [18]. Structural holes refer to the “gaps” that exist between unrelated cities in the network. Cities that occupy these structural holes have access to more diverse information and enjoy resource advantages compared to cities without such structural advantages [19,20]. The formulas for calculating each network indicator are presented below: The formulas for calculating each indicator are presented below:
C A D i = j = 1 n M i j
In the equation, C A D i is the degree centrality of the city i, and M i j is the actual value of the linkage flow between city i and j.
C R P i = n 1 j = 1 n d i j
In the equation, C R P i is the closeness centrality of the city i, d i j is the number of edges contained in the shortest path between city i and j, and n is the number of nodes.
C R B i = 2 j = 1 n k = 1 n [ g j k i g j k ] n 2 3 n + 2
In the equation, C R B i is the betweenness centrality of the city i, g i k is the number of shortest paths that exist between city i and k, and g j k i is the number of shortest paths that exist between city j and k through the city i.
E i = i ( 1 q P i q m j q ) N
In the equation, E i is the structural hole efficiency where city i is located, P i q is the proportional intensity of the relationship between city q and i, m j q is the marginal intensity of city j concerning q, and N is the total number of cities.
To better capture the effect of location differences on cities’ attributes in the network, we classified cities based on their administrative level and economic-geographic subdivisions after computing the network indicators of each city using social network analysis. Then, we aggregated the indicator results for each group and used t-tests and ANOVA to assess the statistical significance of inter-group differences.

3.3. Two-Dimensional Quadrant (TDQ)

The two-dimensional quadrant method is an appropriate analytical tool for classifying and analyzing objects based on two significant attributes. This approach is less commonly used in innovation network research [21]. Figure 2 illustrates the fundamental concept of this approach:
The figure displays the two critical attributes of the study object along the x and y axes. The division thresholds of the two attributes, denoted by a and b, are determined based on practical considerations. The four quadrants represent different categories of objects. Objects in the first quadrant possess both attributes above the threshold level, while objects in the third quadrant have both attributes below the threshold level.
To gain insight into the collaborative nature of innovation networks across various scales and dimensions and explore their spatial structural characteristics, we utilize the two-dimensional quadrant method and establish four dimensions: (1) collaboration capacity, which includes collaboration intensity and innovation capacity; (2) collaboration intensity, which encompasses intra- and inter-city collaboration; (3) collaboration scale, which considers collaborations among enterprises of differing or similar scales; and (4) structural posture, which encompasses the attributes and positions of cities within the network.

3.4. GeoDetector

GeoDetector is a statistical method commonly used for identifying spatial heterogeneity of objects and investigating driving factors. It has found applications in various fields, including economics, social sciences, ecology, and environmental studies [22,23,24]. In this paper, we employ GeoDetector to analyze the impact of different factors on the quadrant distribution of cities across four dimensions. The factors considered in our analysis include infrastructure, economic development, science and technology innovation, government support, and openness to the outside world. These factors are chosen based on the importance of understanding the development of technology enterprises and existing research in the field [25,26]. By using factor and interaction detectors, we aim to assess the individual influence of each factor and explore their interactions within the innovation network. The goal of this analysis is to determine the degree of influence of each factor on the distribution of cities in different quadrants and to gain insights into how these factors interact to shape the innovation landscape. By applying GeoDetector, we can uncover the relative importance of each factor and understand the underlying mechanisms driving the observed spatial heterogeneity.
The specific formula for factor detection is as follows:
Q = 1 h = 1 H N h σ h 2 N σ 2
In the equation, Q is the detection power indicator and takes values in the range of [0, 1]. The larger the value of Q, the greater the influence degree of the factor; N is the sample size; H (h = 1, 2, …, H) is the stratification number of the influence factor; σ h 2 and σ 2 are the variance of the h level and the overall, respectively.
Interaction detection is the calculation of the Q value after the interaction of two factors to identify the explanatory power of different factors when they act together on the dependent variable and the type of their interaction. Q(X1⋂X2) is calculated by superimposing Q(X1) and Q(X2) in a graphical layer. Finally, it is compared with Q(X1) and Q(X2).

4. Results of Website Collaboration at the City Scale

4.1. Statistical Overview of Websites Collaboration

Website cooperation is shown in Table 1: first, it is divided into three categories according to the geographic location of the collaborators: intra-city collaboration (both collaborators are in the same city), intra-provincial inter-city collaboration (both collaborators are in the same province but in different cities), and inter-provincial collaboration (both collaborators are from different provinces). Inter-provincial cooperation is the most common, accounting for 77.1%; intra-provincial cooperation is also dominated by same-city cooperation, accounting for 89.2%, and intra-provincial inter-city cooperation only accounts for 10.8%. This indicates that each technology enterprise generally prefers to choose partners who are more geographically distant in online cooperation, especially inter-provincial cooperation, while intra-city cooperation, which is closer in the distance, is preferred within a particular spatial scope. Second, the cooperation patterns are divided into cross-scale cooperation and similar-scale cooperation according to the scale. The similar-scale cooperation types can be subdivided into cooperation between large enterprises and between small and medium enterprises. It can be found that the frequency of similar-scale cooperation mode is nearly twice that of cross-scale cooperation, accounting for 65.4%; among them, cooperation between small-, medium-, and micro-enterprises is the dominant mode, accounting for 99.4%, and cooperation between large enterprises only accounts for 0.6%. Finally, the basic information on website cooperation was spatially counted (Figure 3). The results show that the distribution of enterprises with operating websites and those with a high frequency of website cooperation is basically the same. The overall trend is high in the southeast and low in the northwest. Among them, the enterprises with websites are sorted by the provinces they belong to. The regions at the top are both coastal and inland, which coincide with the location of the city clusters that China is focusing on. The statistics of website cooperation show that the high frequency of cooperation in all coastal distribution, the three significant nodes are Guangdong, Jiangsu, and Beijing, and the intensity of cooperation from the coast to inland gradually reduced.

4.2. Results of Social Network Analysis

We constructed an innovation network to examine the spatial structure characteristics of the innovation network and how network location affects innovation performance. The nodes’ size and edge widths are sorted based on their centrality and the number of URL hyperlinks, respectively. Beijing has a clear advantage in network centrality, followed by Guangzhou, Chengdu, and Changsha. Nodes in the central region represent critical cities in North, Central, South, and Southwest China, covering several of China’s more developed administrative and geographic regions. The most critical links for collaboration are between Beijing and Shanghai, followed by Beijing–Guangzhou, Beijing–Chengdu, and Guangzhou–Shanghai. Despite the geographic and spatial distance, some partner cities engage in online cooperation, suggesting that geographic costs do not entirely constrain collaboration.
To further investigate the impact of network location on innovation performance, we grouped and analyzed the indicators. The results of the city classification based on administrative location (Table 2) indicate that the average values of DC, CNC, BC, and SH in provincial capitals are higher than those in non-capital cities. The corresponding p-values are less than 0.05, suggesting that provincial capitals not only occupy a central position in the network in terms of geographic location, but also play a more significant role in promoting effectiveness by serving as a “bridge” in the network. This difference in performance between provincial capitals and non-capital cities is statistically significant.
Based on the statistical tests of geographic subdivisions on city groupings (Table 3), the mean levels of the three centrality-related indicators show a clear pattern of being highest in the eastern cities, followed by the central and western cities. While the p-values of the indicators are not significant, to ensure the accuracy of the comparison, we conducted multiple comparisons using the least significant difference (LSD) method after ANOVA. The results reveal significant differences in DC and CNC between the eastern and western cities, indicating a substantial gap between the cities in these two regions in terms of their position in the network and the efficiency of resource transfer. However, for the structural hole indicator, the central cities score the highest, followed by the eastern and western cities. The results indicate significant differences among the groups, highlighting the structural efficiency of the three groups of cities in the network. The central cities have more information and control advantages than the eastern and western cities, thus allowing them to reap more benefits in the innovation network.

4.3. Results of Social Network Analysis

After multi-dimensional and multi-scale analysis of the urban innovation network, the results of the city quadrant distribution for each dimension are summarized in Table 4:

4.3.1. Collaboration Intensity and Innovation Capability

First, we examine the correlation between cities’ collaboration intensity (CD) and innovation capacity (IC). In this analysis, a single city is used as the statistical unit. Collaboration intensity is measured as the proportion of firms with collaboration links among all firms with websites; innovation capability is measured as the average number of collaborations among firms, which is the ratio of the total number of collaborations to the total number of firms. The threshold for quadrant division is set as the average of the two datasets.
According to the quadrant statistics results in Table 4, the highest number of cities falls under the low CD/low IC category, accounting for 40.7%. This is followed by the high CD/low IC cities and high CD/high IC cities, while cities with low CD/high IC have the lowest count, accounting for only 8.7%. Figure 4a illustrates that most cities are close to the average CD and have a significant divergence in the IC dimension. Most of these cities are concentrated in the low-level area, while the high-level area has more prominent internal differentiation. Based on the spatial distribution in Figure 4b, cities with high CD/high IC are mainly concentrated in the economically developed regions in Southeast China, particularly in the Yangtze River Delta and middle reaches of the Yangtze River urban agglomeration, consistent with the direction of the Yangtze River economic belt. Cities with low/low are primarily located in economically underdeveloped inland areas but are geographically close to the high/high cities. Cities with low CD/high IC are primarily located in the southeastern coastal or offshore regions. This suggests that cities with higher collaborative capacity tend to have a lower intention to collaborate with foreign cities. Lastly, the number of cities with high CD/low IC is second-highest, after the low/low cities. They are more evenly distributed and mostly located away from the coast. However, their collaborating companies are primarily located in developed coastal areas.

4.3.2. Intra- and Inter-City Collaboration Intensity

Second, the relationship between intra-city and cross-city cooperation intensity is investigated. The intra- and inter-city collaboration intensity is represented by the ratio of same-city and inter-city links to the number of enterprises with collaborative hyperlinks on all websites, respectively. The average of the two datasets is also used here as the quadrant division threshold.
The results of the quadrant statistics (Table 4) show that the highest number of cities located in low intra- and low inter-city CD is 64.5%, followed by high intra- and low inter-city CD cities, and low intra- and high inter-city CD cities. The lowest number of cities is those with high intra- and high inter-city CD, accounting for only 6.9%. Figure 5a shows that over 81.1% of cities are clustered around the average point, indicating that most cities are close to the average with little variation. According to the spatial distribution (Figure 5b), the high/high cities are primarily the central cities in domestic urban agglomerations, such as those in the Beijing–Tianjin–Hebei, Chengdu–Chongqing, Changzhutan urban agglomeration and other regions. The number of cities with low CDs both inside and outside the city is the largest, i.e., most cities have fewer cooperative links both within and between cities. Additionally, cities in the second quadrant are primarily located in less economically developed inland areas and are characterized by intercity cooperation, indicating that companies located in these areas are more willing to form partnerships with companies from other cities. On the other hand, cities with high intra-city/low inter-city CD are mainly situated in more economically developed regions, such as the eastern coastal or offshore areas. This indicates that firms in these regions may possess higher innovation capacity and are more likely to collaborate and exchange with similarly developed firms in the same region. Overall, the overall value of inter-city CD is higher than intra-city CD, i.e., for cities, the overall tendency is for intercity cooperation to be greater than intra-city cooperation, showing a trend of de-localization.

4.3.3. Cross-Scale Collaboration and Similar-Scale Collaboration

Third, according to China’s enterprise classification standards, enterprises can be divided into four categories: large, small, medium, and micro. As policy differentiation is often made for enterprises of different sizes, they can be further divided into two echelons: large enterprises and small and medium-sized enterprises. The cooperation mode is classified based on the size of the cooperating parties. If one of the cooperating parties is a large enterprise and the other is a small and medium-sized enterprise, it is cross-level cooperation (CSC). If the cooperating parties are the same large-scale enterprises, or both are small and medium-sized enterprises, it is similar-level cooperation (SSC). A more detailed TDQ is established for SSC, which includes large-scale inter-enterprise cooperation and small, medium, and micro-enterprise cooperation. Taking a city as a statistical unit, we measure the level of cooperation between large and large enterprises (BB) and between small and medium enterprises (SMEs) models as the proportion of each type of cooperation among the number of all cooperations, respectively.
For the relationship between CSC and SSC, the quadrant statistics results (Table 4) show that the number of cities in low CSC/low SSC is the highest, accounting for 88.3%. This is followed by cities with low CSC/high SSC and high CSC/high SSC, and no cities with high CSC/low SSC. Among them, Figure 6a shows that most cities in the third quadrant are located on or near the y-axis, i.e., the level of cross-level cooperation is close to 0. From the spatial distribution (Figure 6b), the cities with high CSC/high SSC are basically the capital cities of each province, and also the central cities for the construction of urban agglomerations, all of which are distributed in the southeast of China, with the main gathering area being the Yangtze River Delta region. Furthermore, the cities with low CSC/high SSC are widely distributed in the eastern region. The specifics of the similar scale cooperation among them are analyzed more deeply in later sections. It is worth noting that no cities fall into the pattern of cross-scale cooperation stronger than similar-scale cooperation. Generally, the frequency of similar-scale cooperation is much higher than that of cross-scale cooperation, i.e., for cities, there is a preference for cooperation among similar-scale firms. Moreover, those cities with high intensity of cross-scale cooperation are basically central cities with developed economic policy conditions.
Secondly, in terms of the relationship between the level of cooperation between large enterprises and MSMEs, the results of the quadrant statistics (Table 4) show that the largest number of cities are located in the low BB/low SMEs quadrant, accounting for 87.4%. This is followed by cities with low BB/high SMEs and high BB/high SMEs, while the fewest cities are in the high BB/low SMEs quadrant, with only Guiyang and Nanchang accounting for 0.9% each. From Figure 7a, it can be seen that most cities in the low BB/low SMEs quadrant are distributed on or near the y-axis, indicating that the cooperation between both partners are large enterprises, and the intensity of this mode is close to 0. From the spatial distribution (Figure 7b), the cities with high BB/high SMEs are basically the central cities in the development of each area in China, which are clustered in the economically developed areas of the eastern coast, mainly in the Pearl River Delta, Yangtze River Delta, and Bohai Bay region. Notably, the cities with high intensity of SME cooperation in the low BB/high SME quadrant are dominated by second- and third-tier cities in China. Only Guiyang and Nanchang have a higher intensity of cooperation between large enterprises than between SMEs.

4.3.4. Degree Centrality and Structural Hole

Fourth, the relationship between the attributes and positions of cities in the network is explored. The degree centrality and structural hole were calculated using the social network analysis to obtain the average value of the two indicators as the threshold to divide the four quadrants.
From the quadrant statistics (Table 4), the number of cities with low DC/low SH is the largest, accounting for 49.4%, followed by cities with low DC/high SH; high DC/high SH, and high DC/low SH cities are the same, both accounting for 13.0%. Figure 8a shows that most cities are close to the DC mean line, with significant vertical stratification along the SH axis. This indicates that the main difference between cities lies in their different network locations. The number of website collaborations among enterprises in each city is basically close to or at the average level. However, there is a big difference in their positions in the network, and the influence is differentiated. From the spatial distribution (Figure 8b), the cities with high DC/high SH are all located in the southeast of China, starting from the core area of China’s urban agglomeration construction and spreading to the surrounding cities; the distribution basically matches the coverage of Yangtze River Economic Belt. The cities with low DC/low SH geographically surround those with high DC/high SH. The cities distributed in the northwest region belong to low DC/high SH; that is, the number of enterprises that establish direct web links with them is small, but as a “bridge-builder” in the cooperative network, they can transform the information advantage into the control advantage of the western part of the network, which can enhance their influence in the network. Most cities with high DC/low SH are located at the network’s edge. Although the number of URL link cooperation is not low, the connectivity of the region in the network is low, the efficiency of the structural hole is lower than average, and the influence on the overall network is low.

4.4. Results of GeoDetector

4.4.1. Driving Factor Detection

Based on 13 factors in 5 dimensions, the factor detector was applied sequentially to identify the intensity of influence on the city-level spatial heterogeneity of different dimensions of the cooperation network of Chinese science and technology enterprises, and all 13 factors in 5 dimensions passed the 1% or 5% significance level test, and the specific results are shown in Table 5.
First, for the city-level differences between the degree of enterprise cooperation and innovation capacity, the main influencing dimensions are science and technology innovation, openness to the outside world, and infrastructure, with a minor influence of government support; specifically, the dominant factors are innovation capacity, financial strength, and economic openness, with a minor influence of traffic carrying capacity. Secondly, for the difference in intra-city and inter-city cooperation intensity, the main influencing dimensions are science and technology innovation, external openness, and government support, and the influence of infrastructure is the least; specifically, the dominant factors are foreign investment linkage, GDP per capita and talent pool, and the influence of digital infrastructure is the least. Third, for the cooperation situation of enterprises of different scales, the main influencing dimensions are science and technology innovation and government support, and the influence of external opening is the least; among them, when there is a big gap between the scales of the two partners, the influence of infrastructure is more vital than economic development, while the influence of economic development is more potent than infrastructure when the scales of both parties are equal; specifically, the dominant factors are innovation capacity, financial strength, and administrative rank. Fourth, for the difference of cities’ status in the cooperation network, the main influencing dimensions are science and technology innovation, government support and infrastructure, and the influence of opening up is the least; among them, innovation ability, financial strength, and urbanization rate are the leading factors, and the influence of labor productivity is the least.

4.4.2. Interaction Detection

Further, the interaction detector was used to detect the type and magnitude of the interaction between the two factors, and the results indicated (Figure 9) that all the interaction factors had a significant enhancement on the distribution of cities in all dimensions, and the influence under the interaction was much stronger than that of the single factor, indicating that these factors need to interact with other factors to have better influence. The magnitude of the interactions is roughly divided into four levels according to the natural breakpoint method.
First, regarding the city-level differences between the degree of enterprise cooperation and innovation capacity (Figure 9a), weak interaction effects were observed between the administrative grade and other factors, all of which were at the third level. Meanwhile, most of the interactions between other factors were at the first and second levels, with strengths above the medium level. Among these interactions, the highest interaction influence was observed between financial support and digital infrastructure at 0.644, indicating that the mutual promotion effect of these two factors is the most prominent in terms of perfect cooperation. The lowest interaction influence was observed between traffic capacity and administrative grade at 0.228, suggesting that the mutual promotion effect of these two factors is relatively weak. Additionally, it was found that the difference in traffic capacity was the most significant in the case of interaction or not, which increased from 0.134 to 0.485–0.607, with an average enhancement of 4.134 times. This finding shows that the influence of this factor is significantly enhanced when it interacts with other factors.
Second, regarding the differences between intra- and inter-city cooperation intensity (Figure 9b), the interaction effects of GDP per capita, talent reserve, and foreign contact strength with other factors are vital and basically belong to the first and second levels. In contrast, the interaction effects between administrative grade, traffic capacity, population urbanization rate, and other factors are weaker and mainly belong to the third and fourth levels. In addition, the administrative grade is the factor with the most significant difference in the interaction condition, rising from 0.020 to 0.109~0.495, with an average enhancement of a factor of 13.548.
Third, in terms of collaboration among enterprises of different scales, in the case of collaborating across scales (Figure 9c), the interaction effect between traffic capacity and other factors is substantial, basically all at the first and second levels, while the interaction effect between industrial structure and other factors is moderately weak, all at the second and third levels. The interaction effect between digital infrastructure and traffic capacity is the highest at 0.788, indicating that the interaction effect between these two factors is the strongest when choosing partners with significant scale differences, while the interaction effect between digital infrastructure and economic openness is the lowest and the weakest at 0.397. Further discussion under the similar scale cooperation model (Figure 9d) reveals that the interaction effect between the two factors is relatively balanced. Furthermore, the difference in the influence of digital infrastructure is more than four times when it interacts with other factors, indicating that the influence of the level of digital infrastructure is relatively limited when different-sized enterprises cooperate. However, when it is associated with other factors, the influence is significantly stronger.
Fourth, for the difference of cities’ position in the network (Figure 9e), the interaction effect between digital infrastructure and other factors is vital, mainly at the first and second levels, while the interaction effect between administrative grade and other factors is weak, both at the third and fourth levels. Among them, the interaction effect of digital infrastructure and innovation capability is the highest and the strongest, at 0.665; administrative rank and talent reserve are the lowest and the weakest, at 0.255. In addition, the difference in the influence of whether digital infrastructure interacts with other factors can reach 4.948 times on average.
In summary, the results show that what influences the cooperation situation of enterprises is the comprehensive environment formed by the interaction and synergy of a series of factors. Therefore, when integrating resources to promote the optimization of cooperative innovation networks of Chinese technology enterprises, attention should be paid to the effect of the synergistic influence of multiple factors, especially when laying out digital infrastructure; the interaction effect with other factors should be given full play to enhance the comprehensive influence.

5. Discussion

This study focuses on conducting an innovation network analysis using the cooperation hyperlinks among Chinese science and technology enterprises’ websites. The analysis aims to uncover the spatial pattern of the cooperation network across four dimensions and identify the factors that drive differences in cooperation as well as the mechanisms of their interaction using geographic detectors. The findings of this study indicate that website hyperlinks offer a more comprehensive and timely perspective on the innovation activities and cooperation dynamics of domestic science and technology enterprises compared to traditional data sources such as patents and papers. By utilizing website hyperlinks, this study provides valuable insights into the advantages of studying enterprise innovation networks through this data source.
This paper presents several significant findings that contribute to the understanding of the geographical distribution of innovation capacity and cooperation patterns among Chinese cities, emphasizing the need for regional development strategies to address the disparities and promote balanced innovation growth across the country. One notable finding is the observed polarization of innovation capacity, particularly among cities with high innovation capacity, which has received less attention in previous research. The analysis reveals that cities with high levels of cooperation and innovation capacity are predominantly located in developed coastal regions, while cities with lower levels of cooperation and innovation capacity are primarily situated in underdeveloped inland areas. This spatial disparity suggests regional disparities in innovation development within China. Another important finding is the identification of a general trend showing higher innovation capacity in the southeast and lower capacity in the northwest, with a gradual decrease from coastal to inland areas. This spatial pattern highlights the influence of geographic location on innovation dynamics in China. Additionally, the study finds that the primary nodes for cooperation are located in China’s central cities, which aligns with findings from traditional knowledge network studies [27,28]. However, the study does not uncover significant new insights that highlight the advantages of applying new data sources.
Second, regarding the dual scale of intra-city and inter-city cooperation, the study found that, contrary to previous research using data from patent offices, the analysis of website hyperlinks reveals a higher intensity of inter-city cooperation across provinces compared to inter-city cooperation within provinces [29,30]. This indicates that online technology companies are more likely to collaborate with partners from different regions rather than focusing on geographically close counterparts. The trend of inter-regional cooperation observed in the study suggests a shift towards delocalization in collaboration patterns. This finding contradicts Christian Rammer’s research [31], which emphasized the importance of geographic proximity in cooperation. The study suggests that websites prioritize diverse perspectives and resources by seeking cross-regional cooperation, potentially to avoid functional homogeneity. These findings shed light on the changing dynamics of cooperation patterns in the online technology sector. They highlight the significance of inter-regional collaboration in promoting innovative activities and provide valuable insights into how geographic proximity influences cooperation dynamics in the Chinese context [32].
The third significant finding of the study indicates that companies tend to collaborate with partners of similar sizes, particularly observed among small and medium enterprises (SMEs). This pattern may arise from the limited resources and capabilities of smaller firms, which may restrict their ability to engage in extensive innovative experiments compared to larger companies. However, an interesting exception is found in the case of cross-scale cooperation between Guiyang and Nanchang. Despite being cities of different scales, their collaboration is stronger than similar-scale cooperation. This can be attributed to the significant development of the digital and computing industries in Guiyang, with the city promoting large-scale information service industry clusters. Similarly, Nanchang City has been actively driving the “Digital Economy One Project” and demonstrates strong science and technology revenue performance. In terms of spatial distribution, cross-scale and intra-enterprise collaborations predominantly occur in developed regions of China, while collaborations involving SMEs are concentrated in second- and third-tier cities. This pattern can be explained by the fact that the cooperation model of large-scale enterprises requires a high level of regional social and economic conditions, leading to a limited operating area. Conversely, the relatively moderate competitive environment in second- and third-tier cities is conducive to the survival and growth of SMEs, providing them with broader development opportunities. Moreover, SME industrial clusters can contribute to increased social employment and help alleviate the labor supply–demand imbalance [33]. This finding serves as a valuable complement to previous research, which has primarily focused on the development of large enterprises, thus enhancing our understanding of the overall enterprise cooperation landscape.
The fourth notable finding pertains to the network characteristics of the innovation collaboration among Chinese science and technology enterprises. Municipalities directly under the central government and provincial capitals emerge as major contributors to the network, surpassing other cities in terms of their involvement in collaborative activities. Additionally, eastern cities exhibit a higher level of contribution compared to their western counterparts, aligning with the findings of Fang et al. [
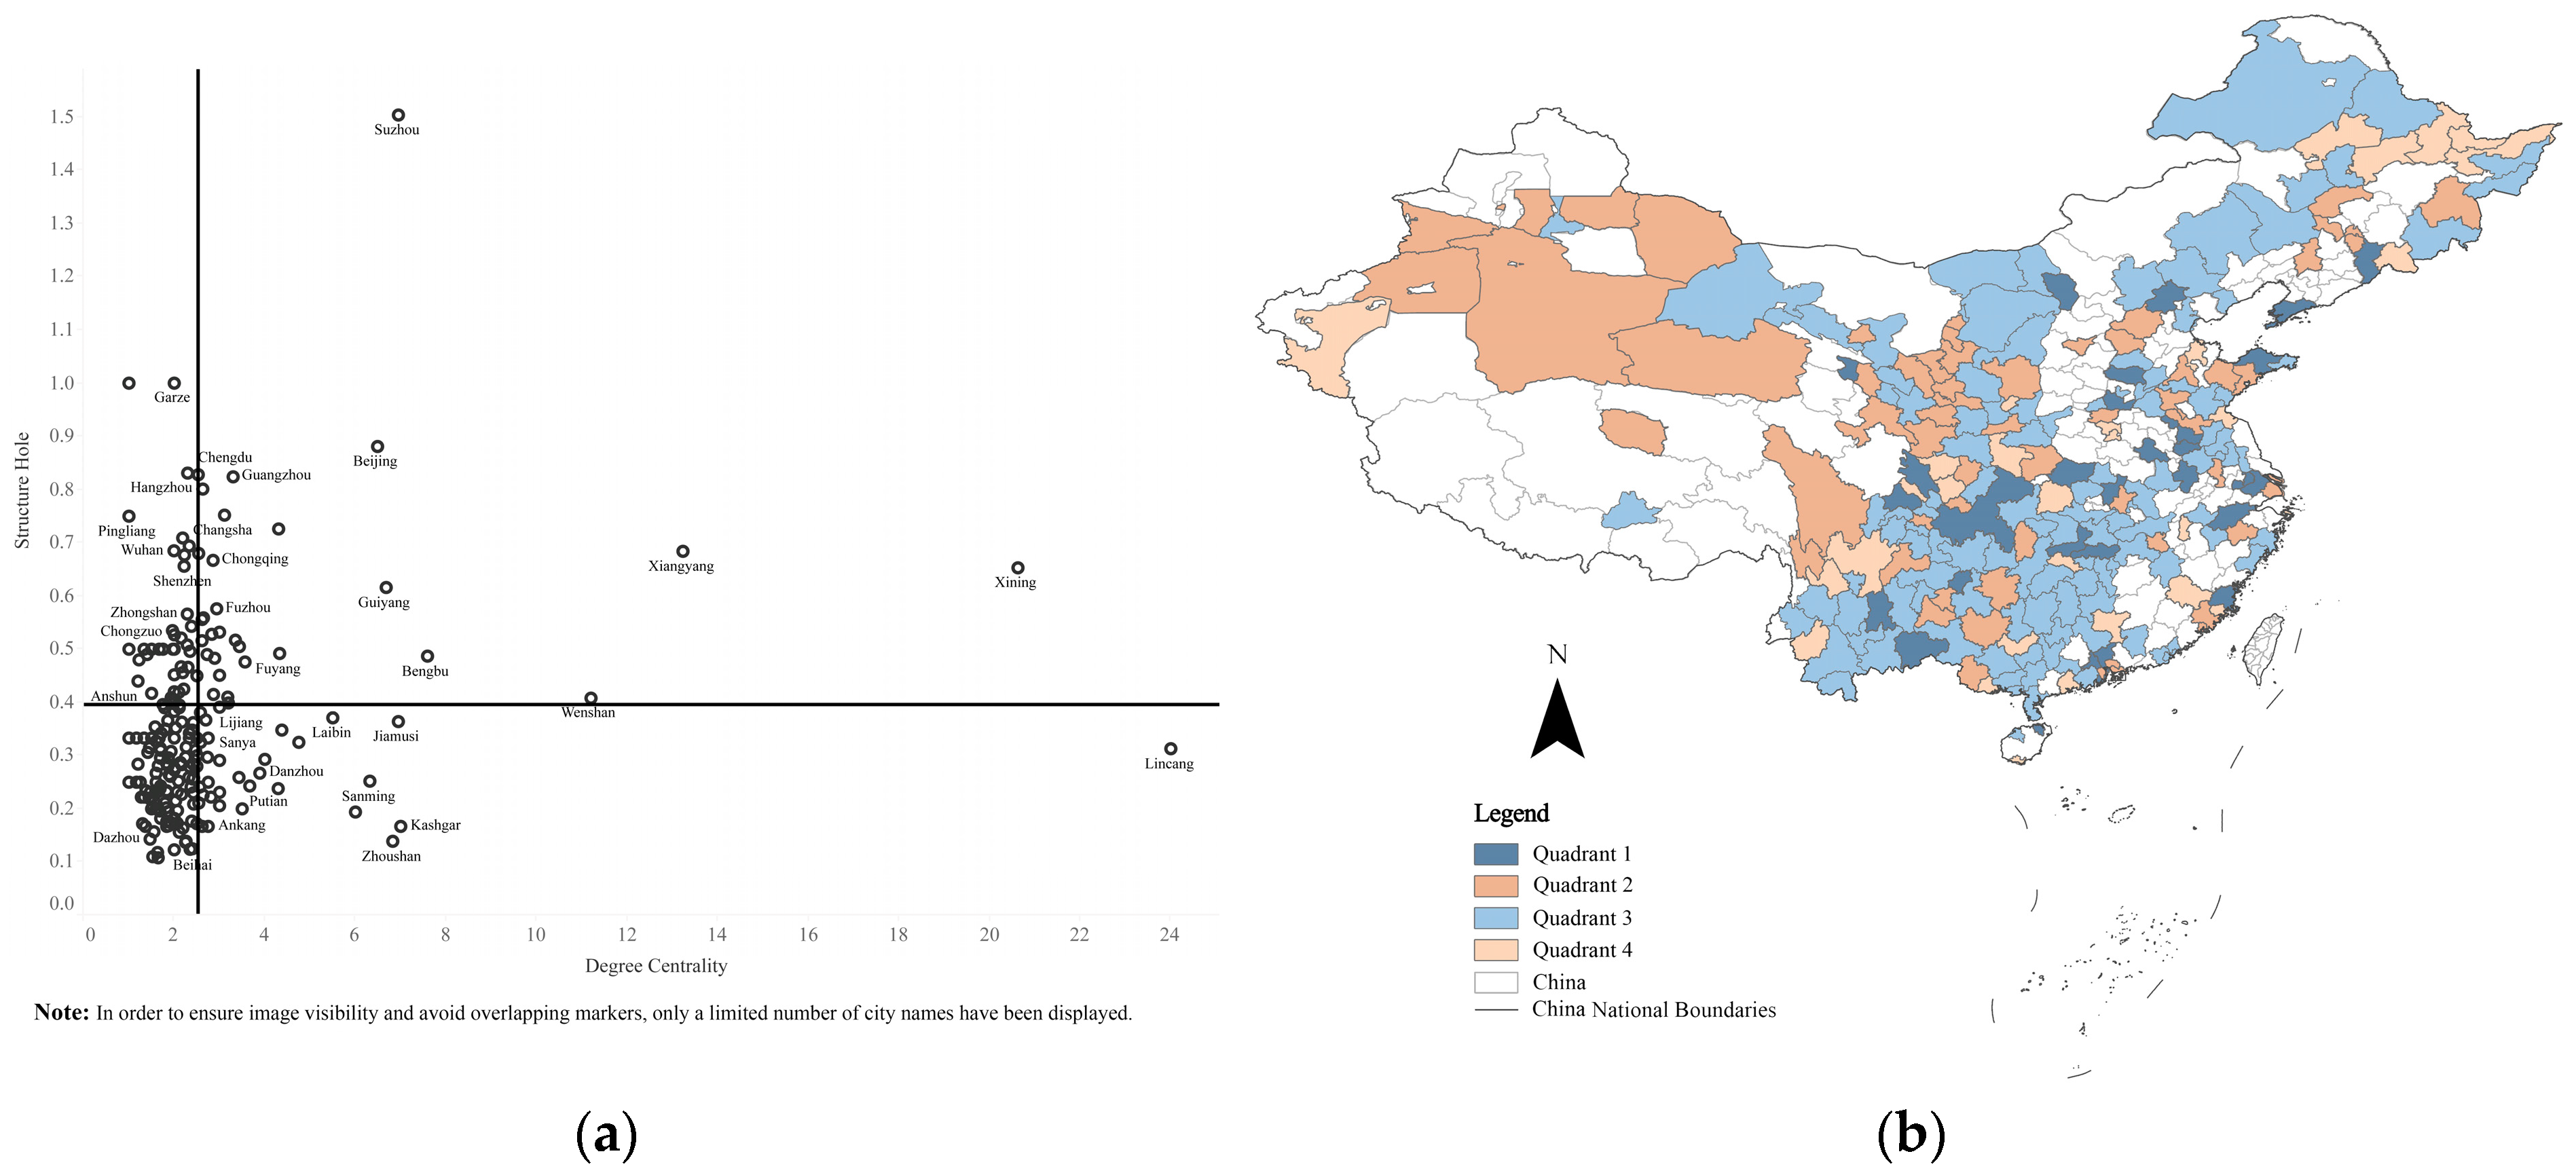
34]. Core urban clusters within China demonstrate high levels of structural holes and degree centrality, indicating their pivotal roles in the network. Interestingly, cities with low degree centrality and structural holes tend to be located in close proximity to cities with high centrality. This phenomenon could be attributed to the “strong provincial capitals” strategy, which leads to an urban siphoning effect, causing significant spatial concentration of resources and collaborative activities around central cities. This effect, although not extensively discussed in previous studies on innovation networks, emerges as a noteworthy aspect in understanding the dynamics of the network.
The final key finding of the study relates to the factors influencing the spatial differences observed in each dimension of the innovation network. Surprisingly, all dimensions are primarily influenced by science, technology, and innovation (STI) factors, which deviates from the findings of previous studies relying on paper and patent data [35]. Furthermore, the interaction between different factors significantly enhances the impact on each dimension. However, the specific factors that exhibit the most significant enhancement vary across dimensions. Under the dimension of cooperation and innovation capacity, the traffic capacity factor stands out, while the administrative grade factor plays a prominent role in the dimension of intra-city and inter-city cooperation relationships. Lastly, digital infrastructure emerges as a critical factor in both the dimensions of cooperative enterprise size and network status, displaying the most significant enhancement multipliers after interaction. These findings underscore the importance of STI factors and the interaction among different influencing factors in shaping the spatial differences observed in the innovation network.

6. Conclusions

This comprehensive study offers a thorough examination of cooperation networks among Chinese science and technology enterprises across different scales and dimensions. By establishing a framework of influencing factors and analyzing their interaction mechanisms, the paper provides a deeper understanding of the underlying characteristics of innovation networks. The multi-scale and multi-dimensional analysis enhances the universality of the research findings and broadens the scope of their application, allowing for a more comprehensive consideration of various innovation scenarios, including macro and micro perspectives, as well as intra-regional and extra-regional dynamics. Furthermore, utilizing website hyperlink data as the basis for constructing the innovation network is a more contemporary approach compared to traditional sources such as patents and papers. The use of website information provides a more practical reflection of enterprise innovation dynamics, making the established network and analyzed results more scientifically grounded. This approach captures the current state of innovation activities more accurately, contributing to a more up-to-date understanding of innovation networks in the context of Chinese science and technology enterprises.
The study acknowledges two limitations that can be addressed in future research. Firstly, relying solely on website link data may introduce bias and limitations in fully representing the innovation network. While website data provide advantages in terms of timeliness and representativeness, integrating additional data sources such as website text data and cooperative patent data could offer a more comprehensive assessment and potentially yield more accurate results. By incorporating multiple data types, a more holistic understanding of the innovation network can be achieved. Secondly, the study only analyzed one year of enterprise website link data, which provide a relatively short time span for assessing the spatial pattern of innovation networks. This limitation may lead to episodic results and hinder the analysis of network characteristic changes over time. Future research could aim to collect longer-term web link data through web mining techniques, allowing for a more extensive temporal dimension in studying the spatial and temporal evolution of the innovation network, as well as its driving factors. By addressing these limitations and conducting further research in these areas, a more comprehensive and accurate understanding of the innovation network can be achieved, facilitating better insights into its dynamics and driving factors.

Author Contributions

Conceptualization, C.L. and L.L.; Methods, C.L. and L.L.; Software, C.L. and S.L.; Validation, C.L. and Z.P.; resources, L.L.; data organization, C.L.; writing—original draft preparation, C.L.; writing—review and editing, Z.P.; visualization, C.L. and S.L.; supervision, Z.P.; funding acquisition, Z.P. All authors have read and agreed to the published version of the manuscript.

Funding

This research was funded by National Natural Science Foundation of China, grant number 52078390 and number 51978535.

Data Availability Statement

Not applicable.

Conflicts of Interest

The authors declare no conflict of interest.

References

  1. Wang, X.; Li, B.; Yin, S.; Zeng, J. Formation Mechanism for Integrated Innovation Network among Strategic Emerging Industries: Analytical and Simulation Approaches. Comput. Ind. Eng. 2021, 162, 107705. [Google Scholar] [CrossRef]
  2. Freeman, C. Networks of Innovators: A Synthesis of Research Issues. Res. Policy 1991, 20, 499–514. [Google Scholar] [CrossRef]
  3. Yu, A.; Shi, Y.; You, J.; Zhu, J. Innovation Performance Evaluation for High-Tech Companies Using a Dynamic Network Data Envelopment Analysis Approach. Eur. J. Oper. Res. 2021, 292, 199–212. [Google Scholar] [CrossRef]
  4. Zhang, F.; Wu, F. Rethinking the City and Innovation: A Political Economic View from China’s Biotech. Cities 2019, 85, 150–155. [Google Scholar] [CrossRef]
  5. Xiao-dan, K.; Dan, Z. The Influence of Knowledge Cooperation on Enterprise Innovation Performance in Innovation Network-The Moderating Effect of Network Characteristics. In Proceedings of the 2018 25th Annual International Conference on Management Science & Engineering; Tao, M., Ed.; IEEE: New York, NY, USA, 2018; pp. 31–39. [Google Scholar]
  6. Xie, Q.; Su, J. The Spatial-Temporal Complexity and Dynamics of Research Collaboration: Evidence from 297 Cities in China (1985–2016). Technol. Forecast. Soc. Chang. 2021, 162, 120390. [Google Scholar] [CrossRef]
  7. Huang, Y.; Li, S.; Xiang, X.; Bu, Y.; Guo, Y. How Can the Combination of Entrepreneurship Policies Activate Regional Innovation Capability? A Comparative Study of Chinese Provinces Based on FsQCA. J. Innov. Knowl. 2022, 7, 100227. [Google Scholar] [CrossRef]
  8. Nagaoka, S.; Motohashi, K.; Goto, A. Patent Statistics as an Innovation Indicator. In Handbook of the Economics of Innovation; Hall, B.H., Rosenberg, N., Eds.; North-Holland: Amsterdam, The Netherlands, 2010; Volume 2, pp. 1083–1127. [Google Scholar]
  9. OECD. OECD Patent Statistics Manual; Organisation for Economic Cooperation and Development: Paris, France, 2009. [Google Scholar]
  10. Squicciarini, M.; Dernis, H.; Criscuolo, C. Measuring Patent Quality: Indicators of Technological and Economic Value; OECD: Paris, France, 2013. [Google Scholar]
  11. Kinne, J.; Axenbeck, J. Web Mining for Innovation Ecosystem Mapping: A Framework and a Large-Scale Pilot Study. Scientometrics 2020, 125, 2011–2041. [Google Scholar] [CrossRef]
  12. Abbasiharofteh, M.; Krüger, M.; Kinne, J.; Lenz, D.; Resch, B. The Digital Layer: Alternative Data for Regional and Innovation Studies. Spat. Econ. Anal. 2023, 0, 1–23. [Google Scholar] [CrossRef]
  13. Gok, A.; Waterworth, A.; Shapira, P. Use of Web Mining in Studying Innovation. Scientometrics 2015, 102, 653–671. [Google Scholar] [CrossRef] [Green Version]
  14. Zhao, S.; Li, J. Impact of Innovation Network on Regional Innovation Performance: Do Network Density, Network Openness and Network Strength Have Any Influence? J. Sci. Technol. Policy Manag. 2022. [Google Scholar] [CrossRef]
  15. Zhu, K.; Gu, Z.; Li, J. Analysis of the China’s Interprovincial Innovation Connection Network Based on Modified Gravity Model. Land 2023, 12, 1091. [Google Scholar] [CrossRef]
  16. Yiqun, Z.; Jingxiang, Z. Exploring Regional Innovation Growth Through a Network Approach: A Case Study of the Yangtze River Delta Region, China. Chin. Geogr. Sci. 2022, 32, 16–30. [Google Scholar] [CrossRef]
  17. Zhao, R.; Zhang, H.; Zhang, M.Y.; Qu, F.; Xu, Y. Competitor-Weighted Centrality and Small-World Clusters in Competition Networks on Firms’ Innovation Ambidexterity: Evidence from the Wind Energy Industry. Int. J. Environ. Res. Public Health 2023, 20, 3339. [Google Scholar] [CrossRef]
  18. Feng, C.; Wang, Y.; Kang, R.; Zhou, L.; Bai, C.; Yan, Z. Characteristics and Driving Factors of Spatial Association Network of China’s Renewable Energy Technology Innovation. Front. Energy Res. 2021, 9, 686985. [Google Scholar] [CrossRef]
  19. Hao, J.; Li, C.; Yuan, R.; Ahmed, M.; Khan, M.A.; Olah, J. The Influence of the Knowledge-Based Network Structure Hole on Enterprise Innovation Performance: The Threshold Effect of R&D Investment Intensity. Sustainability 2020, 12, 6155. [Google Scholar] [CrossRef]
  20. Wu, H.; Gu, X.; Zhao, Y.; Liu, W. Research on the Relationship between Structural Hole Location, Knowledge Management and Cooperative Innovation Performance in Artificial Intelligence. Knowl. Manag. Res. Pract. 2020. [Google Scholar] [CrossRef]
  21. Sun, Y.; Cao, C. Intra- and Inter-Regional Research Collaboration across Organizational Boundaries: Evolving Patterns in China. Technol. Forecast. Soc. Chang. 2015, 96, 215–231. [Google Scholar] [CrossRef]
  22. Wu, Q.; Hu, W.; Wang, H.; Liu, P.; Wang, X.; Huang, B. Spatial Distribution, Ecological Risk and Sources of Heavy Metals in Soils from a Typical Economic Development Area, Southeastern China. Sci. Total Environ. 2021, 780, 146557. [Google Scholar] [CrossRef]
  23. Wang, H.; Liu, Y.; Cai, L.; Fan, D.; Wang, Y.; Yao, Y. Regional Differentiation in the Ecological Effects of Land Cover Change in China. Land Degrad. Dev. 2022, 33, 346–357. [Google Scholar] [CrossRef]
  24. Zhou, C.; Zhu, N.; Xu, J.; Yang, D. The Contribution Rate of Driving Factors and Their Interactions to Temperature in the Yangtze River Delta Region. Atmosphere 2020, 11, 32. [Google Scholar] [CrossRef] [Green Version]
  25. Liu, K.; Xue, Y.; Chen, Z.; Miao, Y. The Spatiotemporal Evolution and Influencing Factors of Urban Green Innovation in China. Sci. Total Environ. 2023, 857, 159426. [Google Scholar] [CrossRef] [PubMed]
  26. Wang, K.-L.; Zhang, F.-Q.; Xu, R.-Y.; Miao, Z.; Cheng, Y.-H.; Sun, H.-P. Spatiotemporal Pattern Evolution and Influencing Factors of Green Innovation Efficiency: A China’s City Level Analysis. Ecol. Indic. 2023, 146, 109901. [Google Scholar] [CrossRef]
  27. Guan, M.; Wu, S.; Liu, C. Comparing China’s Urban Aviation and Innovation Networks. Growth Chang. 2022, 53, 470–486. [Google Scholar] [CrossRef]
  28. Huggins, R.; Prokop, D. Network Structure and Regional Innovation: A Study of University–Industry Ties. Urban Stud. 2017, 54, 931–952. [Google Scholar] [CrossRef]
  29. Gao, X.; Guan, J.; Rousseau, R. Mapping Collaborative Knowledge Production in China Using Patent Co-Inventorships. Scientometrics 2011, 88, 343–362. [Google Scholar] [CrossRef]
  30. Jiang, S.; Shi, A.; Peng, Z.; Li, X. Major Factors Affecting Cross-City R&D Collaborations in China: Evidence from Cross-Sectional Co-Patent Data between 224 Cities. Scientometrics 2017, 111, 1251–1266. [Google Scholar] [CrossRef]
  31. Rammer, C.; Kinne, J.; Blind, K. Knowledge Proximity and Firm Innovation: A Microgeographic Analysis for Berlin. Urban Stud. 2020, 57, 996–1014. [Google Scholar] [CrossRef]
  32. De Noni, I.; Orsi, L.; Belussi, F. The Role of Collaborative Networks in Supporting the Innovation Performances of Lagging-behind European Regions. Res. Policy 2018, 47, 1–13. [Google Scholar] [CrossRef]
  33. Zeller, C. The Pharma-Biotech Complex and Interconnected Regional Innovation Arenas. Urban Stud. 2010, 47, 2867–2894. [Google Scholar] [CrossRef]
  34. Fang, X.; Li, M.; Huang, W.-C. Mechanism and Empirical Study of Excise Tax Affecting Green Development in China’s Provincial Capitals-Mediating Effect Based on Technological Innovation. Sustainability 2023, 15, 1300. [Google Scholar] [CrossRef]
  35. Liu, C.; Gao, X.; Ma, W.; Chen, X. Research on Regional Differences and Influencing Factors of Green Technology Innovation Efficiency of China’s High-Tech Industry. J. Comput. Appl. Math. 2020, 369, 112597. [Google Scholar] [CrossRef]
Figure 1. The research framework.
Land 12 01283 g001
Figure 2. Schematic diagram of the two-dimensional quadrant method.
Land 12 01283 g002
Figure 3. The spatial distribution of website cooperation statistics.
Land 12 01283 g003
Figure 4. The results of quadrant distribution of city collaboration degree and innovation capacity: (a) The results for the two-dimensional quadrant; (b) The spatial distribution of cities in each quadrant. In order to ensure image visibility and avoid overlapping markers, only a limited number of city names have been displayed.
Land 12 01283 g004
Figure 5. The results of quadrant distribution of Intra- and Inter-city collaboration degree: (a) The results for the two-dimensional quadrant; (b) The spatial distribution of cities in each quadrant. In order to ensure image visibility and avoid overlapping markers, only a limited number of city names have been displayed.
Land 12 01283 g005
Figure 6. The results of quadrant distribution of cross- and similar-size collaboration situation: (a) The results for the two-dimensional quadrant; (b) The spatial distribution of cities in each quadrant. In order to ensure image visibility and avoid overlapping markers, only a limited number of city names have been displayed.
Land 12 01283 g006
Figure 7. The results of quadrant distribution of BB and SMEs-size collaboration situation: (a) The results for the two-dimensional quadrant; (b) The spatial distribution of cities in each quadrant. In order to ensure image visibility and avoid overlapping markers, only a limited number of city names have been displayed.
Land 12 01283 g007
Figure 8. The results of quadrant distribution of degree centrality and structural hole of cities: (a) The results for the two-dimensional quadrant; (b) The spatial distribution of cities in each quadrant. In order to ensure image visibility and avoid overlapping markers, only a limited number of city names have been displayed.
Land 12 01283 g008
Figure 9. Detection results of interaction factor of spatial heterogeneity in each TDQ: (a) The results of city collaboration degree and innovation capacity; (b) The results of Intra- and Inter-city collaboration degree; (c) The results of cross- and similar-size collaboration situation; (d) The results of BB and SMEs-size collaboration situation; (e) The results of degree centrality and structural hole of cities.
Land 12 01283 g009
Table 1. The website cooperation information statistics of technology companies in China.
IndicatorsValue
Company InformationTotal Num3,264,584
Num with Web156,748
Num with Co-Web46,029
City Collaboration Intensity (%)29.46%
Co-Web-timesTotal Num75,727
Based on Geographical position
Intra-city15,474
Inter-cityWithin province1868
Across province58,385
Based on size difference
Cross-Scale26,195
Similar-ScaleLarge inter-company314
SMEs inter-company49,218
Table 2. Comparison of the role of the provincial capital cities and other cities in the network.
Statistical IndicatorProvincial Capital CitiesOther CitiesStudent’s t Test
MEANS.D.MEANS.D.tp
Degree Centrality (DC)0.6570.3370.1230.1427.8370.000
Closeness Centrality (CNC)0.4790.0490.3790.0598.2440.000
Betweenness Centrality (BC)0.0280.0410.0010.0033.3380.000
Structural Hole (SH)0.6080.1700.3670.2155.3460.000
Table 3. Comparison of the role of cities in different locations in the network.
Statistical IndicatorEastern CitiesCentral CitiesWestern CitiesFisher’s Protected Multiple Comparisons
MEANS.D.MEANS.D.MEANS.D.Sig.LSD
Degree Centrality (DC)0.2300.2470.1990.2090.1510.2450.665Eastern/Western 0.080 **
Closeness Centrality (CNC)0.4040.0690.4000.0440.3790.0690.605Eastern/Western0.024 **
Betweenness Centrality (BC)0.0050.0250.0030.0070.0040.0130.531Not significant
Structural Hole (SH)0.3750.1830.3830.1950.4090.2360.046
Note: ** indicate significant at the 5% levels.
Table 4. The results of two-dimensional quadrant statistics.
Number of Cities in Each TDQCD/CCIntra/InterCross/SimilarBB/SMEsDC/SH
Quadrant 15016101230
Quadrant 22019171552
Quadrant 394149204202114
Quadrant 467470230
Table 5. The significance and determination of factors on the spatial heterogeneity of innovation network of Technology Enterprises in China.
DimensionalityFactorCD/IC
Q Value
Intra-/Inter-CD
Q Value
CSC/SSC
Q Value
BB/ SMEs
Q Value
DC/SH
Q Value
InfrastructureDigital Infrastructure0.2080.194 ***0.0840.055 **0.3140.127 ***0.2700.130 ***0.1860.106 **
Financial Strength0.295 ***0.126 ***0.519 ***0.455 ***0.283 ***
Traffic Capacity0.134 ***0.071 **0.295 ***0.224 ***0.170 ***
Economic DevelopmentUrbanization level0.1980.215 ***0.1570.071 **0.3070.306 ***0.2990.277 ***0.1800.228 ***
Economy level0.180 ***0.326 **0.355 ***0.372 ***0.176 ***
Industry Structure0.238 ***0.147 **0.298 ***0.268 ***0.213 ***
Labor productivity0.160 ***0.084 **0.268 ***0.278 ***0.103 **
Science and technology innovationTalent Reserve0.2660.209 ***0.2580.309 **0.4320.307 ***0.4070.281 ***0.2530.202 ***
Innovation Capability0.323 ***0.206 ***0.557 ***0.533 ***0.304 ***
Government SupportAdministrative grade0.1550.139 ***0.1780.0200.4020.424 ***0.3580.389 ***0.1870.198 ***
Financial Support0.170 ***0.178 ***0.379 ***0.327 ***0.175 ***
Openness to the outside worldEconomic openness0.2190.251 ***0.2360.127 **0.2250.245 ***0.2340.249 ***0.1220.121 ***
Foreign contact strength0.186 ***0.345 **0.204 ***0.219 ***0.123 ***
Note: ** and *** indicate significant at the 5% and 1% levels, respectively.
Disclaimer/Publisher’s Note: The statements, opinions and data contained in all publications are solely those of the individual author(s) and contributor(s) and not of MDPI and/or the editor(s). MDPI and/or the editor(s) disclaim responsibility for any injury to people or property resulting from any ideas, methods, instructions or products referred to in the content.

