Abstract
Soil erosion and surface pollution near reservoirs can adversely affect water quality and safety. Soil aggregate stability is an important predictor of soil water loss and erosion resistance that is strongly influenced by land use. This study therefore aimed to identify factors affecting soil aggregate stability near reservoirs to provide empirical and theoretical insights that could guide the development of management measures to increase land quality, optimize land use, and maximize sustainability. This study focuses on the land around the Shitoukoumen Reservoir in China and examines the effects of six land use types, eleven soil physicochemical properties, and five environmental factors. Ninety-four sets of soil samples were collected in 2021 for analysis of soil aggregates and properties. Particle size classification of soil aggregates was carried out using the wet sieve method and four indicators were calculated to evaluate the effects of land use, soil physicochemical properties, and environmental factors on soil aggregate stability: water stable aggregates (WSA), mean weight diameter (MWD), geometric mean diameter (GMD), and fractal dimension (D). Descriptive statistics and geostatistics were used to explore the spatial distributions of soil aggregate stability around the reservoir and the influence of soil properties was studied using correlation analysis and path analysis. The conclusion indicates that land use type significantly affects aggregate stability. The most stable aggregates were found in paddy fields (WSA = 0.77, MWD = 0.76, GMD = 0.57) and forests (WSA = 0.75, MWD = 0.76, GMD = 0.55), followed by an orchard, irrigated land, and grassland. Aggregate stability was worst in upland sites (WSA = 0.61, D = 2.28), where soil aggregates were highly fragmented. There were clear spatial correlations between all four stability indicators. The environmental factors and soil physicochemical characteristics with the strongest influence on aggregate stability were soil organic matter, pH, soil clay content, total nitrogen, and temperature changes. Path analysis revealed that some soil properties affect aggregate stability indirectly, with particularly complex relationships between clay, soil organic matter, and pH. In conclusion, land use type, soil organic matter, pH, soil clay content, total nitrogen, these soil physicochemical properties, and environmental factors, especially temperature, significantly affect soil aggregate stability around reservoirs. In the future, it is necessary to appropriately change upland into paddy land, increase forest land, and appropriately add organic fertilizer to improve soil quality.
1. Introduction
Soil aggregates are structural units <10 mm in diameter that are formed from soil particles under natural conditions [1]. They strongly affect the structure and fertility of the soil, so their formation is essential for maintaining the quality of arable land. The properties of soil aggregates depend on the properties of the soil-forming parent material as well as the soil fauna, microorganisms, plant roots, and inorganic binding agents that are present. Their basic structure develops gradually as fresh organic matter enters the soil from plant roots and is decomposed by animals and microorganisms, becoming an effective binder of mineral soil components [2]. Additionally, they provide habitats for animals and microorganisms, and their presence increases the suitability of arable land for cultivation [3,4,5]. Soil erosion is a major environmental problem worldwide and an important constraint on food security, ecological optimization, and social sustainability [6]. The formation of soil aggregates enhances soil structural stability and thus increases resistance to soil erosion. Different degrees of erosion in each land use type lead to differences in the stability of soil aggregates: land types with no artificial disturbance and more complex vegetation are more stable [7]. Therefore, favorable soil agglomeration characteristics facilitate the preservation of high-quality arable land. Previous studies have shown that overuse of agricultural land significantly affects soil structure and composition. This in turn reduces the supply of nutrients for plants and soil microorganisms, which accelerates soil erosion and reduces crop yields [8]. Maintaining a favorable soil structure with high aggregate stability is therefore essential for improving land fertility and achieving sustainable agriculture.
Analyses of soil aggregate stability commonly divide aggregates into four size classes that are separated by wet sieving: large macro-aggregates (>2 mm), small macro-aggregates (0.25–2 mm), micro-aggregates (0.053–0.25 mm), and the silt and clay fraction (<0.053 mm) [9,10]. Indicators of stability used in such analyses include soil water-stable aggregates (WSA) and the mean weight dimension (MWD), geometric mean diameter (GMD), and fractal dimension (D) of the aggregates [11,12]. Studies on factors affecting soil aggregate stability have investigated the influence of soil carbon pools, nitrogen pools, and land management practices. Xu et al. [13] suggested that organic carbon retention has a stronger effect on soil aggregate stability than the abundance of recalcitrant carbon and argued that reducing soil disturbance will be vital for future forest management. Additionally, Zhong et al. [14] suggested that vegetation restoration promotes the physical protection of soil organic carbon by increasing the abundance of soil aggregates, and that the formation of macro-aggregates is important for maintaining steady soil carbon levels. Finally, Ameer et al. [15] reported a strong correlation between soil organic carbon and soil aggregates, leading them to conclude that fallow periods can enhance soil fertility. The stability of soil aggregates depends on both environmental factors and the soil’s physicochemical properties, and the results of previous studies suggest that this fertility enhancement may be primarily due to changes in the organic carbon content that indirectly affect aggregate stability [16]. It is also well established that plant roots act as cementing agents that promote the aggregation of fine soil particles into stable macro-aggregates by adding organic matter to the soil [17]. In addition, temperature and moisture condition changes can influence soil aggregate stability [18]. Previous studies have also found that elevated rainfall contributes to the stability of soil aggregates [19]. Dramatic temperature changes (freeze–thaw cycles) also have a significant impact on soil aggregate stability [20]. Understanding the interplay between these factors will be crucial for maintaining soil fertility and enhancing agricultural productivity.
Reservoirs are areas exposed to severe soil erosion. Soil conditions in their surrounding areas are vital for sustainable management of water resources and maintenance of local ecological stability, and also play central roles in regional development. China has more reservoir dams than any other country in the world [21]. Reservoirs, formed by reservoir construction, are characterized by complex topographic conditions, concentrated rainfall, significant regional temperature, distinct soil properties, and severe soil erosion [22]. They also play a key role in the functioning of local ecosystems. Consequently, the impact of human activities on soil structure in reservoir areas has been studied extensively [23]. A deep understanding of the effects of soil properties, land use types, environmental factors, and their interactions on soil aggregate stability is vital for understanding soil quality and erosion resistance, and also for predicting water loss from land in ecologically sensitive sites such as reservoir areas. However, most studies on factors affecting soil aggregate stability in such areas have investigated the influence of individual factors using traditional statistical methods or spatial correlation analysis [18]. There have been few analyses of reservoir-scale spatial correlations, the effects of interactions between different factors, and the degree to which different factors act directly or indirectly on aggregate stability.
In this study, we hypothesize that soil aggregate stability changes periodically as a dynamic property of soil under the control of various mechanisms. Soil aggregate stability is affected by a combination of soil properties, natural factors, and human factors. Natural and human factors can indirectly affect soil aggregate stability by changing soil environmental properties, and soil itself can also indirectly affect soil aggregates through changes in other soil properties. The study’s objectives were to (a) clarify the spatial distribution of soil aggregate stability and land use in the Shitoukoumen reservoir area; (b) investigate the effect of land use on soil aggregate stability; and (c) identify the driving factors affecting soil aggregate stability. The results obtained will provide valuable support for future efforts to improve the quality of arable land in the reservoir area, optimize patterns of land development and protection, promote rational use of land resources in the reservoir area, and achieve sustainable development. In addition, they will provide a useful theoretical and practical reference for similar efforts in other reservoir areas.
2. Materials and Methods
2.1. Study Area and Soil Samplings
The Shitoukoumen Reservoir watershed is located near Changchun City in Jilin Province, northeastern China (between 43°06′~44°52′30″ N and 125°44′40″~126°18′20″ E) and covers an area of 8255 km2, excluding the Yitong River. The soil types are mainly dark brown loam and albic soil, which are suitable for cultivation. Moreover, this area is in the midtemperate continental semihumid monsoon climate zone, with a large temperature difference between cold and summer seasons. It is a major source of drinking water for Changchun City, which has over nine million residents. The reservoir itself is located in the middle reaches of the Yinma River, which is a tributary of the Songhua River. Drastic hydrothermal changes in the area have caused frequent droughts and floods that have severely affected the local soil’s physicochemical properties (Soil pH, organic matter, total nitrogen, total phosphorus, and total potassium range from 4.1 to 7.3, 8.7 to 100.4 g/kg, 0.2 to 5.2 g/kg, 0.00004 to 2.6 g/kg and 10.0 to 102.5 g/kg, respectively), and the reservoir’s water quality has fallen in recent years. Reliable information on the stability of the watershed’s soil aggregates is therefore needed to guide efforts to control and prevent further soil erosion.
To investigate the stability of soil aggregates around the reservoir, 94 sampling points with a minimum spacing of 1000 m were chosen randomly in July 2021. Their locations were then overlaid on a land use map for the studied area based on data from the Resource and Environmental Science Data Center of the Chinese Academy of Sciences to determine the land use type at each sampling point. Six land use types were found in the studied area: upland (UP), paddy field (PF), irrigated land (IL), grassland (GL), forest land (FL), and orchard (OR). The land use data come from the third national land resource survey conducted by the Ministry of Natural Resources, China. Soil samples were collected within 1 m of each sampling point at a depth of 0–20 cm. In each point, five soil samples were taken randomly and mixed into one composite sample. These samples, which weighed 1–1.5 kg, were thoroughly mixed before being analyzed. Figure 1 shows the land use types present in the study area at the time of sampling.
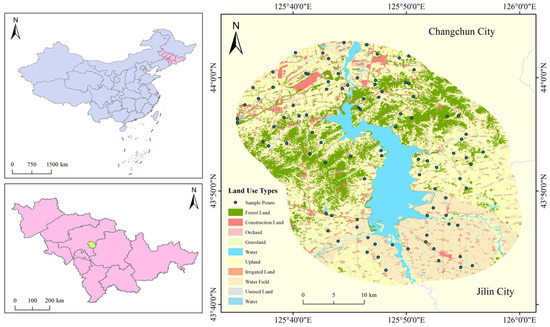
Figure 1.
Current land use distribution in the Shitoukoumen Reservoir area.
2.2. Analysis of Soil Properties
2.2.1. Analysis of Soil Aggregate Properties
Soil aggregates in each sample were separated into >2 mm, 1~2 mm, 0.25~1 mm, 0.05~0.25 mm, and <0.05 mm size fractions and the abundance of each fraction was recorded. Aggregate particle size classification was performed using the wet sieving method (refer to [24]). In this method, an 80 g soil sample is weighed on a 2 mm sieve that is then placed in an aluminum box containing deionized water and submerged for 5 min, keeping the soil below the water level. The sieve is then shaken vertically for about 3~5 min and any material remaining on the sieve is rinsed with deionized water and retained. The filtered water–soil mixture is then subjected to the same procedure using 1 mm, 0.25 mm, and 0.05 mm sieves in succession.
The indices used to evaluate soil aggregate stability in this work were WSA, MWD, GMD, and D. WSA, MWD, and GMD reflect the structural quality of the soil; higher values of these indices indicate greater structural stability, while lower values suggest unstable soil structures and an elevated likelihood of soil nutrient loss. D relates more to the characteristics of the aggregates themselves; lower values of D indicate more stable soil aggregate structures. The equations used to calculate these indices are:
Here, is the weight of aggregates larger than 0.25 mm, is the total mass of aggregates, is the weight percentage of soil aggregates in each aggregate fraction, and is the average diameter of each aggregate fraction [16,25]. is the average diameter of the aggregates in the ith aggregate fraction, is the average diameter of the largest aggregate fraction, and is the cumulative mass of aggregates with a particle size below [26]. Soil fractal dimensions are obtained by calculating linear fits for different particle size classes. For more detailed formula information refer to [4].
2.2.2. Soil Properties and Supplemental Data
Soil properties measured in this work include the soil sand content (Sand), soil silt content (Silt), soil clay content (Clay), soil pH, soil organic matter (SOM), total phosphorus (TP), available phosphorus (AP), total nitrogen (TN), available nitrogen (AN), total potassium (TK), and available potassium (AK). The procedures used to measure these properties are detailed in Soil Sampling and Analysis Methods, edited by Li et al. [27].
A DEM was generated using 30 m Shuttle radar mapping data from SRTM project images; elevation (ELE), slope, and aspect data were generated from this the Shuttle data using the ArcGIS10.7 software package. Temperature data were obtained from Landsat8OLI satellite images downloaded from the geospatial data cloud (https://www.gscloud.cn (accessed on 11 February 2023)); the annual average land surface temperature (LST) and seasonal land surface temperature difference (ΔLST) for the area of interest were determined by selecting 11 remote sensing images at 30 m resolution with low cloudiness. The LST data were obtained by inversion of the atmospheric correction method, which is performed in Figure 2.
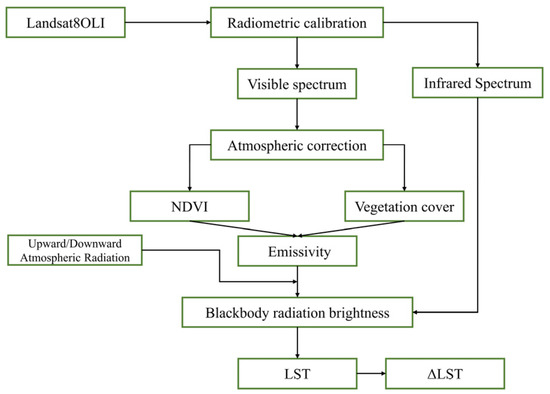
Figure 2.
Process diagram for calculating temperature.
2.3. Statistical Analysis
A one-way ANOVA test was used to calculate the effect of land use types on the stability of aggregates. Multiple comparisons use the Tukey’ HSD test. Spatial correlation analysis was used to characterize spatial correlations between the observed distributions of soil aggregate stability and land use patterns. Spatial autocorrelation models for WSA, GMD, MWD, and D were established using semivariance functions in GS+ 9.0, and ordinary Kriging interpolation was performed using ArcGIS 10.7. To enhance the spatial correlation of the data, the initial MWD and GMD values were logarithmically transformed.
The effects of soil properties on soil aggregate stability were evaluated first using Pearson correlation analysis and then by using path analysis to clarify the direct and indirect effects of soil properties on aggregate stability. It is worth noting that the accuracy of the interpolation process used in this study requires further discussion, limited by the large ratio of the study area to the number of samples and the uneven distribution of sample points.
Path models are based on multiple linear regression equations that decompose the correlations between independent and dependent variables into direct and indirect effects to clarify the interactions between independent, intermediate, and dependent variables [28]. The calculation procedure used in this work was described in detail by Song et al. [29].
3. Results
3.1. Soil Aggregate Size and Stability
The soil samples were separated into five size fractions: >2 mm, 2~1 mm, 1~0.25 mm, 0.25~0.05 mm, and <0.05 mm (Table 1).

Table 1.
Soil aggregate properties. Multiple comparisons use the Tukey’ HSD test. Different letters indicate significant difference between land use types at p = 0.05 level. PF: paddy field; IL: irrigated land; FL: forest land; UP: upland; OR: orchard; GL: grassland.
The 1~0.25 mm size fraction dominated, accounting for 58.66% of the total aggregate mass on average, followed by the 0.25~0.05 mm fraction (21.71% of the total aggregate mass). The <0.5 mm size fraction was least abundant overall, accounting for just 6.01% of the total aggregate mass. However, the 2–1 mm size fraction was least abundant in irrigated land and uplands, accounting for 2.38% and 3.06% of the total aggregate mass, respectively. Orchards had the lowest content of >2 mm aggregates (3.83% of the total aggregate mass; Figure 3). Macro-aggregates were more abundant in paddy and forest soils, while silt and clay were more abundant in uplands.
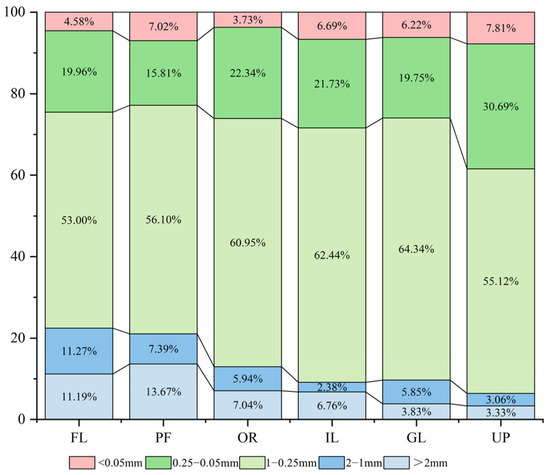
Figure 3.
Relative abundance of different soil aggregate size fractions by land use type.
Inspection of normal Q-Q plots revealed that the aggregate stability index data satisfied the criteria for normality (Table 2).
Table 2.
Soil aggregate stability. WSA: water stable aggregates; MWD: mean weight diameter; GMD: geometric mean diameter; D: and fractal dimension (D).
As shown in Figure 4, paddy fields had the highest WSA, MWD, and GMD values, followed by forest land, indicating that these land use types were associated with the greatest soil aggregate stability.
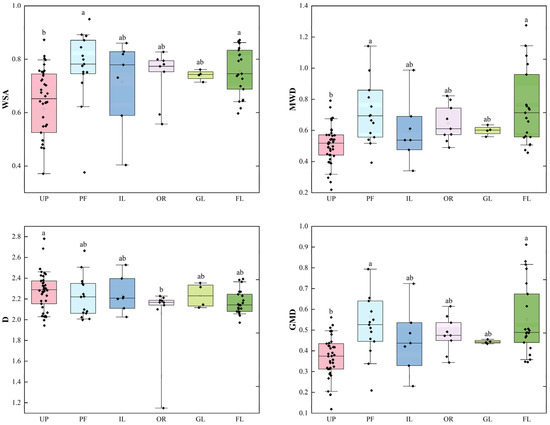
Figure 4.
Soil aggregate stability indices for different land use types. Multiple comparisons use the Tukey’ HSD test. Different letters indicate significant difference between land use types at p = 0.05 level.
The proportion of macro-aggregates was also higher in irrigated land and forests, suggesting that the presence of water-stable macro-aggregates can help maintain soil structure and enhance overall aggregate stability. There were some notable differences between the values of the soil aggregate stability indices for different land use types, suggesting that land use type has an important effect on aggregate stability. However, the mean values of D for different land use types other than orchards were relatively similar (ranging from 2.06 to 2.28), indicating a lack of clear fractal characteristics.
3.2. Spatial Distribution of Soil Aggregate Stability
The parameters of the semivariance function for each index were calculated using GS + 9.0 (Table 3).
Table 3.
Geostatistical analysis results.
Gaussian models were generated for each soil aggregate stability indicator, giving regression coefficients (R2) ranging from 0.347 to 0.862. The models for all indices other than D had high R2 values. The residual sum of squares (RSS) for each index was small, indicating acceptably reliable data fits. The nugget (C0) parameter represents the undetectable experimental error and microscale variation. The C0 values for the aggregate stability indices ranged from 0.009 to 0.082, indicating that the error between sampling points was small. The partial sill (C + C0) values reflect the spatial variability due to natural and socioeconomic factors and were similarly low for all indices, indicating that environmental factors were the dominant source of variation in soil aggregate stability. The nugget:partial sill ratio indicates the strength of the system’s spatial correlation, which is generally considered to be strong if the ratio is <25%, intermediate if it is between 25% and 75%, and weak otherwise. The ratios for WSA, MWD, and GMD were close to 50%, indicating intermediate spatial correlation, while that of D was smaller, indicating a strong spatial correlation. The range variable indicates the distance over which spatial autocorrelation exists for the index in question. All indices other than D had relatively high range values. These results indicated that Kriging interpolation analysis could be performed for all four indices. However, the large ratio of study area to the number of samples and the uneven distribution of samples reduces the accuracy of the calculation of the semivariance function, which has an impact on the interpolation results.
Ordinary Kriging interpolation analysis was therefore performed in ArcGIS 10.7 by combining the semivariance functions discussed above to characterize the spatial distributions of WSA, MWD, GMD, and D in the study area (Figure 5). In general, higher values of WSA, MWD, and GMD were associated with smaller values of D. The soil WSA in the reservoir area ranged from 0.087 to 0.950, with higher values in the south (0.697 to 0.829), followed by the north, and lower values in the west, northwest, and central regions.
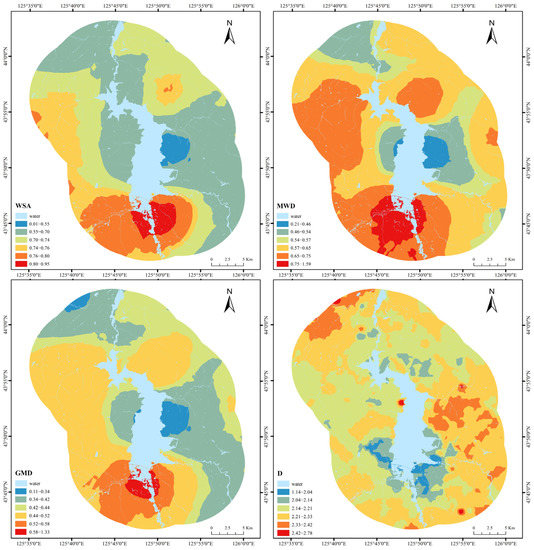
Figure 5.
Interpolation-derived spatial distributions of WSA, MWD, GMD and D.
The spatial distributions of WSA, MWD, and GMD were all similar and indicate that the southern and western parts of the reservoir area have relatively high proportions of large soil aggregates and good soil stability whereas the central and northwestern parts have fewer macro-aggregates and worse soil stability. The values of D vary between 1.14 and 2.78 due to the low variance of the corresponding semivariance function. Together with the low spatial correlation distance of D, this meant that the distribution obtained for this index by Kriging interpolation was relatively fragmented. Overall, D was low in the reservoir area’s south-central and north-western regions but high in the central and eastern parts, exhibiting a negative spatial correlation with WSA, MWD, and GMD.
In conclusion, the soil aggregates are most stable in the southwest, west, and northeastern regions of the studied area, followed by the northern and southeastern regions, while the central region’s soil aggregates are less stable. By comparing these findings to the land use map shown in Figure 1, it can be seen that the regions of the study area with high soil aggregate stability are dominated by paddy fields and forests, while those with poor aggregate stability are dominated by construction land and uplands. This confirms the general conclusion that soil aggregates in paddy fields and forests are more stable than those in upland sites.
3.3. Relationships between Soil Properties and Soil Aggregate Stability
The semivariance functions and Kriging interpolation results discussed in the preceding section can also be used to analyze the relationships between the spatial distribution of soil aggregate fractions and soil properties. The spatial heterogeneity of aggregate stability indices is influenced by natural environmental factors and human activities, the latter of which can affect both the internal properties of the soil and socio-economic factors such as topographic conditions and land use patterns. Topographic factors influence soil properties by affecting local regional climatic conditions, vegetation cover, water, and thermal conditions as well as land use. The environmental factors whose influence on soil aggregate stability was evaluated in this work were ELE, aspect, slope, LST, ΔLST, sand, silt, clay, pH, SOM, TP, AP, TN, AN, TK, and AK (Table 4). The direct and indirect effects of these factors on soil aggregate stability were investigated using Pearson correlation analysis and path analysis.
Table 4.
Statistical data on soil properties in the studied area. ELE: elevation; ΔLST: seasonal land surface temperature difference; LST: temperature; Sand: soil sand content; Silt: soil silt content; Clay: soil clay content; SOM: soil organic matter; TP: total phosphorus; AP: available phosphorus; TN: total nitrogen; AN: available nitrogen; TK: total potassium; AK: available potassium.
Pearson correlation analysis was used to obtain the correlation matrix for the soil aggregate stability indices and soil physicochemical properties (Figure 6). There were strong and significant positive correlations between WSA, MWD, and GMD, and all of them had significant negative correlations with D, in accordance with the Kriging interpolation results. Sand had significant negative correlations with MWD and GMD, while clay, pH, SOM, and TN had significant positive correlations with WSA, MWD, and GMD. Clay, pH, SOM, and TN also exhibited significant positive correlations with WSA, MWD, and GMD, while D was significantly and negatively correlated with pH, SOM, slope, and aspect. Finally, the temperature variables LST and ΔLST had significant negative correlations with WSA, MWD, and GMD. These results show that multiple soil physicochemical properties and environmental factors significantly affect soil aggregate stability.
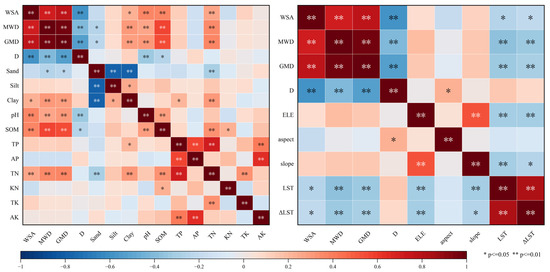
Figure 6.
Correlations between soil stability indices, soil physicochemical properties, and environmental factors.
Path analysis was used to determine the direct and indirect effects of soil physicochemical properties on soil aggregate stability by using stepwise linear regression method in SPSS (Figure 7). The route analysis included WSA, MWD, and GMD, but no significant influential elements were found for D, so it was impossible to perform a path analysis for this index. Indicators with significant effects on WSA were SOM, AN, pH, and clay. The indirect effect of pH was substantial: 37.7% of its total impact on WSA resulted from indirect effects on SOM and AN. AN had a negative direct effect on WSA but also had a positive indirect effect via SOM and Clay. Indicators with significant effects on MWD and GMD included SOM, Clay, ELE, and pH. The latter two of these indicators had relatively strong indirect effects; ELE had a negative indirect effect on SOM via clay and pH as well as a strong positive direct effect on MWD and GMD. Conversely, pH had a positive indirect effect on MWD and GMD via SOM. In this context, it should be noted that the residual factors of WSA, MWD, and GMD in the path analysis were 0.84, 0.72, and 0.75, respectively; the magnitude of these values indicates that the path analysis neglected some important influential factors [29].
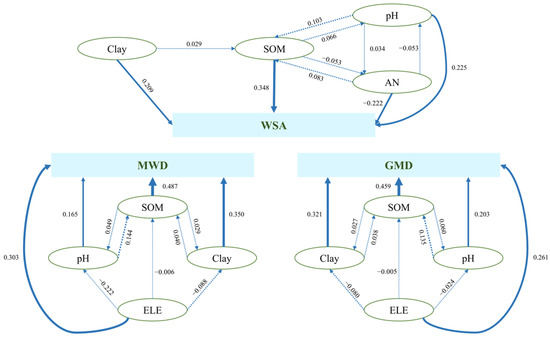
Figure 7.
Path analysis of factors affecting soil aggregate stability indices. The thickness and value of the line reflect the degree of influence, with the solid line indicating a direct influence and the dashed line indicating that the beginning element has an influence on an indicator by indirectly influencing the ending element.
To verify the influence of land use patterns on soil aggregate stability, we investigated the relationships between land use types with the environmental factors and land use types with soil physicochemical properties found to correlate significantly with soil aggregate stability pH, Clay, SOM, TN, ELE, and Silt (Figure 8). The observed distribution of ELE is explained by the fact that higher parts of the reservoir area were dominated by forests and orchards, while lower parts were dominated by paddy fields and irrigated land. Paddy fields and forests were the land use types with the highest soil aggregate stability, followed by orchards and irrigated lands; grasslands and uplands had the lowest aggregate stability. In accordance with the previously discussed correlations, pH, Clay, SOM, and TN were highest in paddy fields and forests also had high SOM values. The lowest values of TN, SOM, and pH occurred in uplands, and grasslands also had low SOM and TN values. This shows that land use type significantly affects the soil elements and leads to differences in the stability of soil aggregates. It is worth noting that the large error in the data may be due to the sample size setting and the measurement accuracy, which needs to be regarded in the future study (Figure 8).
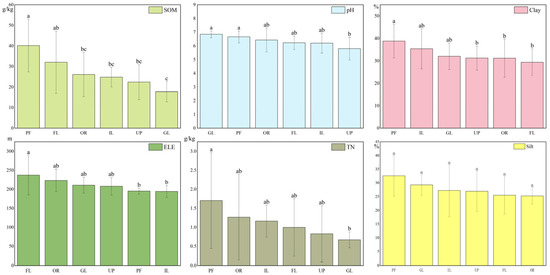
Figure 8.
Relationships between land use and soil properties. The elements that are more relevant to the soil aggregate stability were selected for mapping. Multiple comparisons use the Tukey’ HSD test. Different letters indicate significant difference between land use types at p = 0.05 level.
Soil texture distribution is shown in Figure 9, revealing that clay is predominant in paddy fields where soil aggregates were more stable. Sandy clay loam is also one of the main soil types, and the soil type with worse aggregate stability than clay is dominated by dry land and orchards, which is consistent with our conclusion.
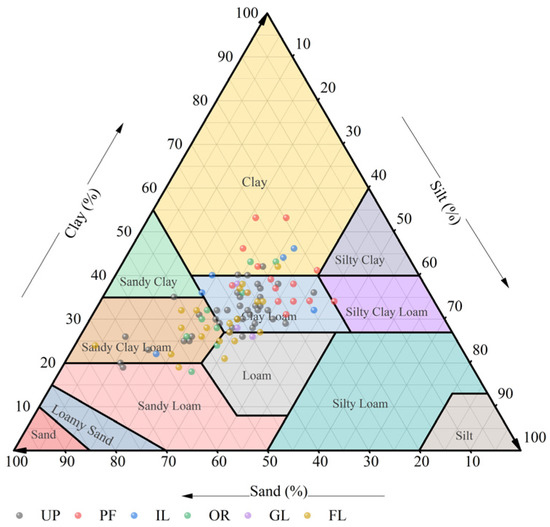
Figure 9.
Soil texture composition under different land use types.
4. Discussion
4.1. The Effects of the Environment on Soil Aggregate Stability
The topographic slope of land is known to correlate positively with the degree of surface soil erosion and the resulting loss of organic carbon and macro-aggregates. Conversely, elevation, and aspect are positively associated with soil aggregate stability. An earlier study on the hilly areas of the Lodgen watershed in Iran confirmed the conclusion that soil structure stability is higher in areas with shallower slopes [30], while another study found that topographic factors such as slope and aspect affect aggregate stability indirectly via their effects on vegetation activity (flat terrain and sunny areas have more lush vegetation), soil microorganisms (microbial carbon content is higher in flat land), hydrothermal conditions, and land use [31]. This is broadly consistent with our finding that elevation affected MWD and GWD indirectly via pH and Clay.
Land use changes under specific climatic conditions can affect soil aggregate stability. We also found that increases in LST and ΔLST had a significant negative impact on soil aggregate stability. This may be because seasonal temperature changes affect soil bulk density, soil moisture, and soil permeability, leading to higher erodibility [32]. It has also been suggested that intense temperature change process reduce soil aggregate stability [33]. However, another study suggested that aggregates are compressed when ice crystals grow in the pore spaces upon freezing, increasing their stability. However, upon thawing these crystals become liquid pore water, which disfavors macro-aggregate formation [34]. These results indicate a need to clarify the effects of freeze–thaw cycles on soil aggregate stability.
4.2. The Effects of Soil Properties on Soil Aggregate Stability
Previous studies have shown that soil texture, organic matter, and soil oxides dominated by iron and aluminum have important effects on soil aggregate stability. Our results indicate that soil organic matter has a significant positive effect on soil aggregate stability, which may be mainly due to the enhancement of soil structural stability resulting from the colloidal effect of organic matter [35,36]. The addition of organic matter promotes the formation of more stable multistage aggregates by increasing matrix molecular polarity and strengthening attractive electrostatic forces [37]. Additionally, interactions between organic material and minerals can strengthen the Van der Waals forces between adjacent particles in soil aggregates and thus mitigate electrostatic repulsion, leading to improved soil aggregate stability [38]. This suggests that soil structure stability and the quality of farmland around the Shitoukoumen Reservoir could be improved by treatment with organic fertilizer.
Soil texture is another important factor affecting soil aggregate stability; previous studies have found that stickier soil textures are associated with an increased abundance of macro-aggregates [39]. Aluminum and clay were identified as the most important binders for soil macro-aggregates, but elemental Fe also has a notable binding effect [39]. Additionally, Angers [40] suggested that mucilage enhances soil sorption by providing a direct surface for soil contact, leading to the formation of larger aggregates. The influence of clay particles is related to the soil-forming parent material, which is dominated by dark brown loam, black soil, white pulpy soil, and meadow soil in the research area. All of these materials are rich in expansive clay minerals such as montmorillonite and kaolinite. Taken together with the findings of Brubaker et al. [41], these results clarify the effects of clay on soil aggregate stability and highlight the beneficial effects of expansive minerals.
We also found that aggregate stability correlated positively with soil pH, TN, TK, TP, and AK, with the correlations for TN and pH being statistically significant. These results suggest that soil AP and AK promote the growth of small water-stable aggregates into larger ones and thus increase aggregate stability [42,43]. The amount of nitrogen in the soil is a key measure of its fertility, and soil macro-aggregates are one of the most significant nitrogen reservoirs. Additionally, nitrogen is one of the main aggregate binders [44]. Therefore, the more macro-aggregates there are, the more nitrogen is present in the soil. The positive effect of pH on macro-aggregates may be due to its beneficial effect on the stability of plant roots and their surface residues, which promote microbial activity and thus enhance the soil’s content of organic carbon and thus favor macro-aggregate formation [45]. This hypothesis is consistent with our observation that pH had positive indirect effects on WSA, MWD, and GMD via SOM [11,45]. However, other studies suggest that high pH suppresses macro-aggregate formation, possibly by reducing the thickness of the organic matter layer on the mineral surface or by causing clay particles to acquire negative surface charges and to thus repel one-another, causing clay dispersion [30,46]. Efforts should therefore be made to identify optimal pH ranges that maximize soil aggregate stability for different soil textures.
The path analysis revealed some of the indirect relationships between soil properties and aggregate stability. Clay, pH, and SOM were found to have indirect effects on all three aggregate stability indicators included in the path analysis, with pH being the most influential. The indirect effect of clay on SOM was attributed to the retention of SOM on clay, in accordance with previous reports indicating that clay is a more important reservoir of soil carbon than sand and silt [47]. AN also has an indirect effect on WSA via SOM because soil carbon cycling and N uptake are mutually coupled processes [48], and maintaining a reasonable C:N ratio has a positive effect on soil fertility. The soil N content in the research area is low, so adding organic N fertilizer could enhance soil fertility and promote macro-aggregate formation. However, SOM had a negative indirect effect on WSA via alkaline N, which is inconsistent with the previously discussed effect; the reason for this discrepancy is unclear. In summary, the influence of soil properties on soil aggregates is a complex and integrated mechanism. It is necessary to improve soil texture, add SOM, N, and P to improve the quality of soil aggregates.
4.3. The Effects of Land Use Type on Soil Aggregate Stability
The distribution of soil aggregate size fractions across different land use types observed in this work is consistent with previous reports [49]. Land use types significantly affected soil aggregate stability, with paddy fields and forests having the highest stability, followed by orchards, irrigated land, and grasslands; uplands had the lowest aggregate stability and the most fragmented aggregates, in accordance with previous findings [24,50,51]. In general, natural undisturbed soils have higher proportions of macro-aggregates and more stable aggregates than those subjected to artificial disturbance [52]. The agricultural soils in research area are mainly located in uplands and their soil aggregates are less stable due to suboptimal usage of chemical fertilizers and pesticides under artificial tillage conditions that cause mechanical and structural damage [52,53]. In contrast, forest land is rich in natural organic matter and plant root residues, suffers less soil disturbance, and has a more well-developed microbial community. Consequently, its soils have a high content of organic matter that favors macro-aggregate formation and increases aggregate stability [54,55]. Our results confirmed the beneficial effects of the high organic matter content of forest soils. Similar benefits appear to exist in paddy fields despite their extensive artificial disturbance because they have unique water circulation systems that increase their soil organic carbon levels and thus enhance aggregate stability [56]. The fertility of arable land near reservoirs in semi-arid or arid zones could thus be maintained by establishing paddies. It has been suggested that natural grasslands have higher organic matter input than uplands and that this organic matter decomposes slowly due to limited disturbance, leading to high soil aggregate stability [7]. However, our results do not support this position.
In conclusion, soil aggregate stability, as one of the key characteristics of land quality, has been a hot spot in the field of land quality evolution and land quality sustainability. For a long time, scholars at home and abroad have made many excellent systematic studies on the effects of natural environment, anthropogenic activities, and soil essential characteristics on soil aggregates, and detailed mechanisms of individual key influencing factors have been elaborated. The presented findings in this study highlight the interacting effects of land use type, soil attributes, and environmental factors on aggregate stability to improve soil quality.
5. Conclusions
The >0.25 mm fraction was the dominant size fraction among the water-stable soil aggregates in the studied area. Additionally, land use type significantly affected soil aggregate stability, which was highest in forests and paddy fields followed by orchards, irrigated land, and grassland; upland soil had the least stable soil aggregates. Geostatistical and interpolation analyses revealed high spatial autocorrelation of soil aggregate stability indices, confirming the effects of land use. Correlation analyses revealed that soil aggregate stability had significant positive correlations with SOM, pH, Clay, and TN but correlated negatively with environmental factors such as LST and ΔLST. Several factors indirectly affected soil aggregate stability via their effects on SOM. Overall, our results show that land use type has significant effects on soil properties and thus on soil aggregate stability. However, further research is needed to clarify the mechanisms determining soil aggregate stability and to identify additional variables with significant effects on aggregate structure. The findings of this study can provide certain theoretical reference and scientific support for soil and water conservation, resistance to soil erosion and soil erosion prevention and control, and optimal allocation of land resources in Shitoukoumen reservoir area.
Author Contributions
H.L., Conceptualization, Methodology, Software, Formal analysis, Visualization, Investigation, and Writing—original draft; L.C., Methodology and Writing—review and editing; Y.W., Formal analysis and Data curation; Y.L., Conceptualization, Supervision, Funding acquisition, and Writing—review and editing. All authors have read and agreed to the published version of the manuscript.
Funding
This work was supported by the National Natural Science Foundation of China (grant no. 42177447) and the Science and Technology Development Plan Project of Jilin Province (grant no. 20210203010SF).
Data Availability Statement
The data presented in this study are available in the article.
Conflicts of Interest
The authors declare no conflict of interest.
References
- Six, J.; Bossuyt, H.; Degryze, S.; Denef, K. A History of Research on the Link between (Micro)Aggregates, Soil Biota, and Soil Organic Matter Dynamics. Soil Tillage Res. 2004, 79, 7–31. [Google Scholar] [CrossRef]
- Guhra, T.; Stolze, K.; Totsche, K.U. Pathways of Biogenically Excreted Organic Matter into Soil Aggregates. Soil Biol. Biochem. 2022, 164, 108483. [Google Scholar] [CrossRef]
- Du, J.; Liu, K.; Huang, J.; Han, T.; Zhang, L.; Anthonio, C.K.; Shah, A.; Khan, M.N.; Qaswar, M.; Abbas, M.; et al. Organic Carbon Distribution and Soil Aggregate Stability in Response to Long-Term Phosphorus Addition in Different Land-Use Types. Soil Tillage Res. 2022, 215, 105195. [Google Scholar] [CrossRef]
- Tang, X.; Qiu, J.; Xu, Y.; Li, J.; Chen, J.; Li, B.; Lu, Y. Responses of Soil Aggregate Stability to Organic C and Total N as Controlled by Land-Use Type in a Region of South China Affected by Sheet Erosion. CATENA 2022, 218, 106543. [Google Scholar] [CrossRef]
- Wang, Y.; Zhang, J.H.; Zhang, Z.H. Influences of Intensive Tillage on Water-Stable Aggregate Distribution on a Steep Hillslope. Soil Tillage Res. 2015, 151, 82–92. [Google Scholar] [CrossRef]
- Nishigaki, T.; Sugihara, S.; Kilasara, M.; Funakawa, S. Surface Runoff Generation and Soil Loss Under Different Soil and Rainfall Properties in the Uluguru Mountains, Tanzania. Land Degrad. Dev. 2017, 28, 283–293. [Google Scholar] [CrossRef]
- Saha, D.; Kukal, S.S.; Sharma, S. Landuse Impacts on SOC Fractions and Aggregate Stability in Typic Ustochrepts of Northwest India. Plant Soil 2011, 339, 457–470. [Google Scholar] [CrossRef]
- Egan, G.; Crawley, M.J.; Fornara, D.A. Effects of Long-Term Grassland Management on the Carbon and Nitrogen Pools of Different Soil Aggregate Fractions. Sci. Total Environ. 2018, 613–614, 810–819. [Google Scholar] [CrossRef]
- Cao, S.; Zhou, Y.; Zhou, Y.; Zhou, X.; Zhou, W. Soil Organic Carbon and Soil Aggregate Stability Associated with Aggregate Fractions in a Chronosequence of Citrus Orchards Plantations. J. Environ. Manag. 2021, 293, 112847. [Google Scholar] [CrossRef]
- Li, H.; Zhu, H.; Liang, C.; Wei, X.; Yao, Y. Soil Erosion Significantly Decreases Aggregate-Associated OC and N in Agricultural Soils of Northeast China. Agric. Ecosyst. Environ. 2022, 323, 107677. [Google Scholar] [CrossRef]
- Zhu, G.; Shangguan, Z.; Deng, L. Variations in Soil Aggregate Stability Due to Land Use Changes from Agricultural Land on the Loess Plateau, China. CATENA 2021, 200, 105181. [Google Scholar] [CrossRef]
- Hu, L.; She, D.; Yang, Z. Stability of soil aggregates and its differentiation characteristics in small watersheds in loess hilly region of northwestern shanxi. Res. Soil Water Conserv. 2022, 29, 72–77. [Google Scholar] [CrossRef]
- Xu, C.; Lin, T.-C.; Yang, Z.; Liu, X.; Xiong, D.; Chen, S.; Wu, F.; Yang, Y. Forest Conversion Effects on Soil Organic Carbon Are Regulated by Soil Aggregate Stability and Not by Recalcitrance: Evidence from a Reforestation Experiment. CATENA 2022, 219, 106613. [Google Scholar] [CrossRef]
- Zhong, Z.; Han, X.; Xu, Y.; Zhang, W.; Fu, S.; Liu, W.; Ren, C.; Yang, G.; Ren, G. Effects of Land Use Change on Organic Carbon Dynamics Associated with Soil Aggregate Fractions on the Loess Plateau, China. Land Degrad. Dev. 2019, 30, 1070–1082. [Google Scholar] [CrossRef]
- Ameer, I.; Kubar, K.A.; Ali, Q.; Ali, S.; Khan, T.; Shahzad, K.; Riaz, M.; Shah, Z.; Rajpar, I.; Ahmed, M.; et al. Land Degradation Resistance Potential of a Dry, Semiarid Region in Relation to Soil Organic Carbon Stocks, Carbon Management Index, and Soil Aggregate Stability. Land Degrad. Dev. 2023, 34, 624–636. [Google Scholar] [CrossRef]
- Xue, T. Characteristics of Soil Aggregation Stability and Its Spatial Variability in the Small Watershed of South Hunan Province. Master’s Thesis, Hunan Agricultural University, Changsha, China, 2010. [Google Scholar]
- Tisdall, J.M.; Oades, J.M. Organic Matter and Water-Stable Aggregates in Soils. J. Soil Sci. 1982, 33, 141–163. [Google Scholar] [CrossRef]
- Veihe, A. The Spatial Variability of Erodibility and Its Relation to Soil Types: A Study from Northern Ghana. Geoderma 2002, 106, 101–120. [Google Scholar] [CrossRef]
- Cerdà, A. Aggregate Stability against Water Forces under Different Climates on Agriculture Land and Scrubland in Southern Bolivia. Soil Tillage Res. 2000, 57, 159–166. [Google Scholar] [CrossRef]
- Tang, S.; Yuan, P.; Tawaraya, K.; Tokida, T.; Fukuoka, M.; Yoshimoto, M.; Sakai, H.; Hasegawa, T.; Xu, X.; Cheng, W. Winter Nocturnal Warming Affects the Freeze-Thaw Frequency, Soil Aggregate Distribution, and the Contents and Decomposability of C and N in Paddy Fields. Sci. Total Environ. 2022, 802, 149870. [Google Scholar] [CrossRef]
- Tan, J.; Ren, X.; Li, Q.; Xu, Y.; Xu, K. Reservoir dam safety in new era. Yangtze River 2021, 149–153. [Google Scholar] [CrossRef]
- Xin, Z.; Xia, J. Soil Erosion Calculation in the Hydro-Fluctuation Belt by Adding Water Erosivity Factor in the USLE Model. J. Mt. Sci. 2020, 17, 2123–2135. [Google Scholar] [CrossRef]
- Wang, L.H.; Huang, J.L.; Du, Y.; Hu, Y.X.; Han, P.P.; Wang, J.L. Priority Areas Mapping for Controlling Soil Erosion in Danjiangkou Reservoir Area. AMR 2012, 610–613, 2995–2999. [Google Scholar] [CrossRef]
- Zhao, J.; Chen, S.; Hu, R.; Li, Y. Aggregate Stability and Size Distribution of Red Soils under Different Land Uses Integrally Regulated by Soil Organic Matter, and Iron and Aluminum Oxides. Soil Tillage Res. 2017, 167, 73–79. [Google Scholar] [CrossRef]
- Xu, Y. Stability of Soil Aggregates and Nutrient Distribution Characteristics under Different Land Use Practices in the Qinghai River Basin. Master’s Thesis, Shandong Normal University, Jinan, China, 2021. [Google Scholar]
- Yang, H.; Zhang, L.; Yu, S.; Cao, J. Effects of Different Land-Uses on the Features of Water-Stable Aggregates in Karst and Clasolite Areas in Maocun, Guilin. Carsologica Sin. 2012, 31, 265–271. [Google Scholar]
- Li, B.; Li, Y.; Ren, T.; Dynasty, H.; Xu, J. Soil Sampling and Analysis Methods; Electronic Industry Press: Beijing, China, 2022. [Google Scholar]
- Wang, X.; Zhang, C.; Li, Q. Path analysis between vegetation coverage climate factors in the Loess Plateau. Acta Ecol. Sin. 2023, 43, 719–730. [Google Scholar] [CrossRef]
- Song, X.; Zhu, Z.; Liu, Y.; Zhao, H. Application of path analysis in stepwise linear regression SPSS. Arid. Zone Res. 2016, 33, 108–113. [Google Scholar] [CrossRef]
- Ye, L.; Tan, W.; Fang, L.; Ji, L. Spatial Analysis of Soil Aggregate Stability in a Small Catchment of the Loess Plateau, China: II. Spatial Prediction. Soil Tillage Res. 2019, 192, 1–11. [Google Scholar] [CrossRef]
- Teng, M.; Zeng, L.; Xiao, W.; Huang, Z.; Zhou, Z.; Yan, Z.; Wang, P. Spatial Variability of Soil Organic Carbon in Three Gorges Reservoir Area, China. Sci. Total Environ. 2017, 599–600, 1308–1316. [Google Scholar] [CrossRef]
- Ye, L.; Ji, L.; Chen, H.; Chen, X.; Tan, W. Spatial Contribution of Environmental Factors to Soil Aggregate Stability in a Small Catchment of the Loess Plateau, China. Agronomy 2022, 12, 2557. [Google Scholar] [CrossRef]
- Oztas, T.; Fayetorbay, F. Effect of Freezing and Thawing Processes on Soil Aggregate Stability. CATENA 2003, 52, 1–8. [Google Scholar] [CrossRef]
- Dagesse, D. Effect of Freeze-Drying on Soil Aggregate Stability. Soil Sci. Soc. Am. J. 2011, 75, 2111–2121. [Google Scholar] [CrossRef]
- Xing, X.; Wang, H.; An, T.; Li, S.; Pei, J.; Liang, W.; Wang, J. Effects of Long-Term Fertilization on Distribution of Aggregate Size and Main Nutrient Accumulation in Brown Earth. J. Soil Water Conserv. 2015, 29, 267–273. [Google Scholar]
- Liu, Z.; Sun, Z.; Lyu, Y. Effect of Long-Term Fertilization on Soil Aggregate Formation in Greenhouse and Farmland Conditions in the North China Plain. Chin. J. Eco-Agric. 2017, 25, 1119–1128. [Google Scholar]
- Zhang, Y.; Zhao, S.; Wang, Z.; Li, X.; Li, M.; Du, C. Distribution and Function of Cementing Materials of Soil Aggregates on the Loess Plateau, Western China. Sci. Soil Water Conserv. 2015, 13, 145–150. [Google Scholar]
- Yu, Z.; Zhang, J.; Zhang, C.; Xin, X.; Li, H. The Coupling Effects of Soil Organic Matter and Particle Interaction Forces on Soil Aggregate Stability. Soil Tillage Res. 2017, 174, 251–260. [Google Scholar] [CrossRef]
- Wang, J.; Yang, W.; Yu, B.; Li, Z.; Cai, C.; Ma, R. Estimating the Influence of Related Soil Properties on Macro- and Micro-Aggregate Stability in Ultisols of South-Central China. CATENA 2016, 137, 545–553. [Google Scholar] [CrossRef]
- Angers, D. Water-Stable Aggregation of Québec Silty Clay Soils: Some Factors Controlling Its Dynamics. Soil Tillage Res. 1998, 47, 91–96. [Google Scholar] [CrossRef]
- Brubaker, S.C.; Holzhey, C.S.; Brasher, B.R. Estimating the Water-Dispersible Clay Content of Soils. Soil Sci. Soc. Am. J. 1992, 56, 1226–1232. [Google Scholar] [CrossRef]
- Qiu, L.; Lian, L.; Zhang, L.; Liu, Q.; Lu, F. Study on the Characteristics and Influencing Factors of Water Stable Aggregates of Forest Soil. J. Yangzhou Univ. (Agric. Life Sci. Ed.) 2016, 37, 74–80. [Google Scholar]
- Guo, L.; Zhang, W.; Gao, J.; Hao, C.; Zhang, B.; Li, C. Stability Features and Evolution Mechanism of Soil Water-Stable Aggregates in Pinus Tabulaeformis Plantation in Taihang Mountain. Res. Environ. Sci. 2019, 32, 1861–1868. [Google Scholar]
- Zhang, Y.; Wu, Y.; Li, Q.; Zhang, D.; Chen, J.; Liu, X. Characteristics and Relationship between Soil Nitrogen and Aggregates in Alpine Meadows with Different Degradation in Eastern Qilian Mountains. Acta Agrestia Sin. 2021, 29, 2286–2293. [Google Scholar]
- Zhang, J.; Gu, F.; Zhu, B.; Zhou, M. Effects of Forest and Grass Restoration on Soil Aggregate Stability, and Organic Carbon and Nitrogen Characteristics in an Eroded Area of the Reshui River. Pratacult. Sci. 2021, 38, 1012–1023. [Google Scholar]
- Regelink, I.C.; Stoof, C.R.; Rousseva, S.; Weng, L.; Lair, G.J.; Kram, P.; Nikolaidis, N.P.; Kercheva, M.; Banwart, S.; Comans, R.N.J. Linkages between Aggregate Formation, Porosity and Soil Chemical Properties. Geoderma 2015, 247–248, 24–37. [Google Scholar] [CrossRef]
- Araujo, M.A.; Zinn, Y.L.; Lal, R. Soil Parent Material, Texture and Oxide Contents Have Little Effect on Soil Organic Carbon Retention in Tropical Highlands. Geoderma 2017, 300, 1–10. [Google Scholar] [CrossRef]
- Han, X.; Guo, N.; Li, D.; Xie, M.; Jiao, F. Effects of Nitrogen Addition on Soil Carbon and Nitrogen and Biomass Change in Different Grassland Types in Inner Mongolia. Acta Pratacult. Sin. 2022, 31, 13–25. [Google Scholar]
- Liu, M.-Y.; Chang, Q.-R.; Qi, Y.-B.; Liu, J.; Chen, T. Aggregation and Soil Organic Carbon Fractions under Different Land Uses on the Tableland of the Loess Plateau of China. CATENA 2014, 115, 19–28. [Google Scholar] [CrossRef]
- Ebabu, K.; Tsunekawa, A.; Haregeweyn, N.; Adgo, E.; Meshesha, D.T.; Aklog, D.; Masunaga, T.; Tsubo, M.; Sultan, D.; Fenta, A.A.; et al. Exploring the Variability of Soil Properties as Influenced by Land Use and Management Practices: A Case Study in the Upper Blue Nile Basin, Ethiopia. Soil Tillage Res. 2020, 200, 104614. [Google Scholar] [CrossRef]
- Duan, L.; Sheng, H.; Yuan, H.; Zhou, Q.; Li, Z. Land Use Conversion and Lithology Impacts Soil Aggregate Stability in Subtropical China. Geoderma 2021, 389, 114953. [Google Scholar] [CrossRef]
- Bhattacharyya, R.; Rabbi, S.M.F.; Zhang, Y.; Young, I.M.; Jones, A.R.; Dennis, P.G.; Menzies, N.W.; Kopittke, P.M.; Dalal, R.C. Soil Organic Carbon Is Significantly Associated with the Pore Geometry, Microbial Diversity and Enzyme Activity of the Macro-Aggregates under Different Land Uses. Sci. Total Environ. 2021, 778, 146286. [Google Scholar] [CrossRef]
- Feng, H.; Wang, S.; Gao, Z.; Pan, H.; Zhuge, Y.; Ren, X.; Hu, S.; Li, C. Aggregate Stability and Organic Carbon Stock under Different Land Uses Integrally Regulated by Binding Agents and Chemical Properties in Saline-sodic Soils. Land Degrad Dev. 2021, 32, 4151–4161. [Google Scholar] [CrossRef]
- Blanco-Canqui, H.; Lal, R. Mechanisms of Carbon Sequestration in Soil Aggregates. Crit. Rev. Plant Sci. 2004, 23, 481–504. [Google Scholar] [CrossRef]
- Okolo, C.C.; Gebresamuel, G.; Zenebe, A.; Haile, M.; Eze, P.N. Accumulation of Organic Carbon in Various Soil Aggregate Sizes under Different Land Use Systems in a Semi-Arid Environment. Agric. Ecosyst. Environ. 2020, 297, 106924. [Google Scholar] [CrossRef]
- Kögel-Knabner, I.; Amelung, W.; Cao, Z.; Fiedler, S.; Frenzel, P.; Jahn, R.; Kalbitz, K.; Kölbl, A.; Schloter, M. Biogeochemistry of Paddy Soils. Geoderma 2010, 157, 1–14. [Google Scholar] [CrossRef]


Disclaimer/Publisher’s Note: The statements, opinions and data contained in all publications are solely those of the individual author(s) and contributor(s) and not of MDPI and/or the editor(s). MDPI and/or the editor(s) disclaim responsibility for any injury to people or property resulting from any ideas, methods, instructions or products referred to in the content. |
© 2023 by the authors. Licensee MDPI, Basel, Switzerland. This article is an open access article distributed under the terms and conditions of the Creative Commons Attribution (CC BY) license (https://creativecommons.org/licenses/by/4.0/).