Review

Assessing Trade-Offs between Agricultural Productivity and Ecosystem Functions: A Review of Science-Based Tools?

1
Département Environnement et Forêts, Institut de l’Environnement et de Recherches Agricoles, Ouagadougou 03 BP 7047, Burkina Faso
2
Swedish Water House, Stockholm International Water Institute, P.O. Box 101 87, 100 55 Stockholm, Sweden
3
Lund University Centre for Sustainability Studies, Lund University, P.O. Box 170, 221 00 Lund, Sweden
4
Laboratoire Biosciences, Unité de Formation et Recherche en Sciences de la Vie et de la Terre, Université Joseph Ki-Zerbo, Ouagadougou 03 BP 7021, Burkina Faso
5
Gothenburg Center for Sustainable Development, P.O. Box 100, 412 96 Gothenburg, Sweden
6
Department of Thematic Studies—Environmental Change, Linköping University, 581 83 Linköping, Sweden
*
Author to whom correspondence should be addressed.
Land 2023, 12(7), 1329; https://doi.org/10.3390/land12071329
Submission received: 8 May 2023 / Revised: 23 June 2023 / Accepted: 27 June 2023 / Published: 30 June 2023

Abstract

:
Global population growth, especially in developing countries, will most likely require an increase in agricultural production, but the sustainability of this production cannot be achieved without the preservation of ecosystem functions. Therefore, farmers need to know about, and deal with, the trade-offs between agricultural productivity and ecosystem functions and services. This review aims to assess practical science-based tools that can be used to make decisions for sustainable agricultural production. We reviewed 184 articles and divided them into categories depending on whether they describe tools, practices, ecosystem services, models, or other topics. Although many studies were global in scope, the approach to analyzing and assessing trade-offs appears to vary geographically. The review showed that trade-offs between agricultural productivity and ecosystem functions are most commonly studied in Europe and Asia, while few studies have been conducted in sub-Saharan Africa. Most tools in the review addressed only one or a bundle of ecosystem services, related to water, biodiversity, or climate regulation, and were designed for different types of land use and ecosystems and applicable at different scales. More practical tools for trade-off analysis have mainly been developed and applied by development organizations with support from science. Closer collaboration between practitioners, development organizations, and scientists is suggested to foster co-development of tools useful for identifying sustainable strategies for closing the yield gap, increasing productivity and for balancing ecosystem services, building on the Sustainable Development Goal’s framework and its targets for agricultural productivity and ecosystem services for trade-off analysis. We recommend the development and fine-tuning of the identified tools to specific contexts and landscapes through innovation platforms bringing together farmers, extension workers, scientists, and local decision-makers.

1. Introduction

The global challenge of food security is a critical issue for the future and raises many questions around the impact of increased demand caused by population increase, the multifaceted impact of climate change, unequal access, and distribution, as well as the desire and need to produce food in a sustainable way [1]. Ecosystem functions and services support the basic needs of farming activities via a combination and an interdependent mix of water, soil, sun, and nutrients, but the linkages with agriculture are poorly exploited [2]. The Millennium Ecosystem Assessment [3] defined Ecosystem Services as “the benefits people derive from ecosystems” and organized them into four types of services: provisioning, regulating, supporting and cultural services. Each of these four services are composed of many sub-services. For example, provisioning services are the products directly obtained from ecosystems (e.g., food, fiber, timber, as well as non-timber forest products (NTFPs)).
One argument for the weak interest in working with ecosystem services in agriculture is that external inputs have been focused on boosting provisioning services, such as yields, while the costs have been placed on public goods (regulating and supporting ecosystem services) in terms of degraded and overused resources. These ecosystem services often entail temporal and spatial scales far beyond the farm unit or growing season, which makes the impact assessment more complex than that of a well-defined farm, or field decisions usually taken by individual farmers or land use planners. Rong et al. [4] identified the yield-limiting factors, including climate, water availability, nutrients, moisture, crop varieties, planting dates and socioeconomic factors, such as farm characteristics, household conditions, access to markets, gender inequality, and agricultural extension services coverage, as described by Nkonya et al. [5], highlighting the connection between agricultural productivity and ecosystem functions, as well as the socio-economic context.
One area that has been in focus and proposed as an entry point to link agriculture to ecosystem functions and services is to identify and minimize the yield gap. The yield gap is identified as the difference between the potential and the actual yield, and as such it is a targeted area where management practices and policy instruments could help improve overall ecosystem services outcomes and increase agricultural productivity. For the three major global food crops, wheat, maize and rice, a recent review [4] indicated a yield gap of around 50%, and it is even larger in some parts of the world where the African continent has fallen behind the Green Revolution boom and shows large gaps. The current yields of maize, millet, and rice in Africa are only half of those in Asia [6].
In addition to food production and ecosystem functions and services, and as has been increasingly pointed out by scientific assessments in recent years, the nexus of food, climate change, energy and biodiversity is a constant intertwined web of interdependency. Despite this complexity, it is a challenge that needs to be addressed in order to find paths towards a more holistic and sustainable production of food and provision of ecosystem services [7,8,9]. This is also seen from international policy perspectives where there is a call for new policies to halt climate change, increase food security, secure biodiversity and move towards a more resilient and sustainable development pathway in line with Agenda 2030 [10,11]. Pradhan et al. [12] showed that positive correlations among Sustainable Development Goals (SDGs) largely outweigh the negative ones. However, SDG-15 (Life on Land) that has several ecosystem-related targets encapsulating critical ecosystem functions shows possible trade-offs with several SDGs, including SDG-1 (No Poverty) and SDG-2 (Zero Hunger).
The situation then leads us to the following: there is a need to increase agricultural productivity and food production, especially in Africa, to feed a growing population. There is a yield gap between actual and potential yield caused by inadequate ability to manage resources, plan, and produce [13], and the mistake of not contextualizing agricultural practices to different locations and situations in terms of advice and policy [14]. This is combined with a direct and strong dependency on healthy, resilient, and sustainable ecosystems and their functions and services related to water or soil for any agricultural production to take place, and particularly for increasing yield. The bottom-line is that the farmers producing our food must make very critical decisions and consider trade-offs between different ecosystem functions and services when planning or changing practices to increase productivity. This is many times contextualized as an economic decision, while securing the fundamental building blocks for agriculture—the ecosystem functions and services—now and for the years to come, is necessary.
With these considerations as a backdrop, the aim of this paper is to carry out a global review of: (i) the availability of practical tools to assess the issues related to agricultural productivity and trade-offs with ecosystem functions for the core producers of food—the farmers, and (ii) the readiness of scientific findings in supplying support and guidance in this respect. Hence, this review was conducted with the aim of answering the following research question: “What evidence-based practical tools exist that assess the trade-offs between agricultural productivity and ecosystem functions/services?”. The purpose was to synthesize and translate existing science into useful guidance for the ongoing Agriculture for Food Security program and, in particular, for our parklands management activities in Sahelian Africa.

2. Materials and Methods

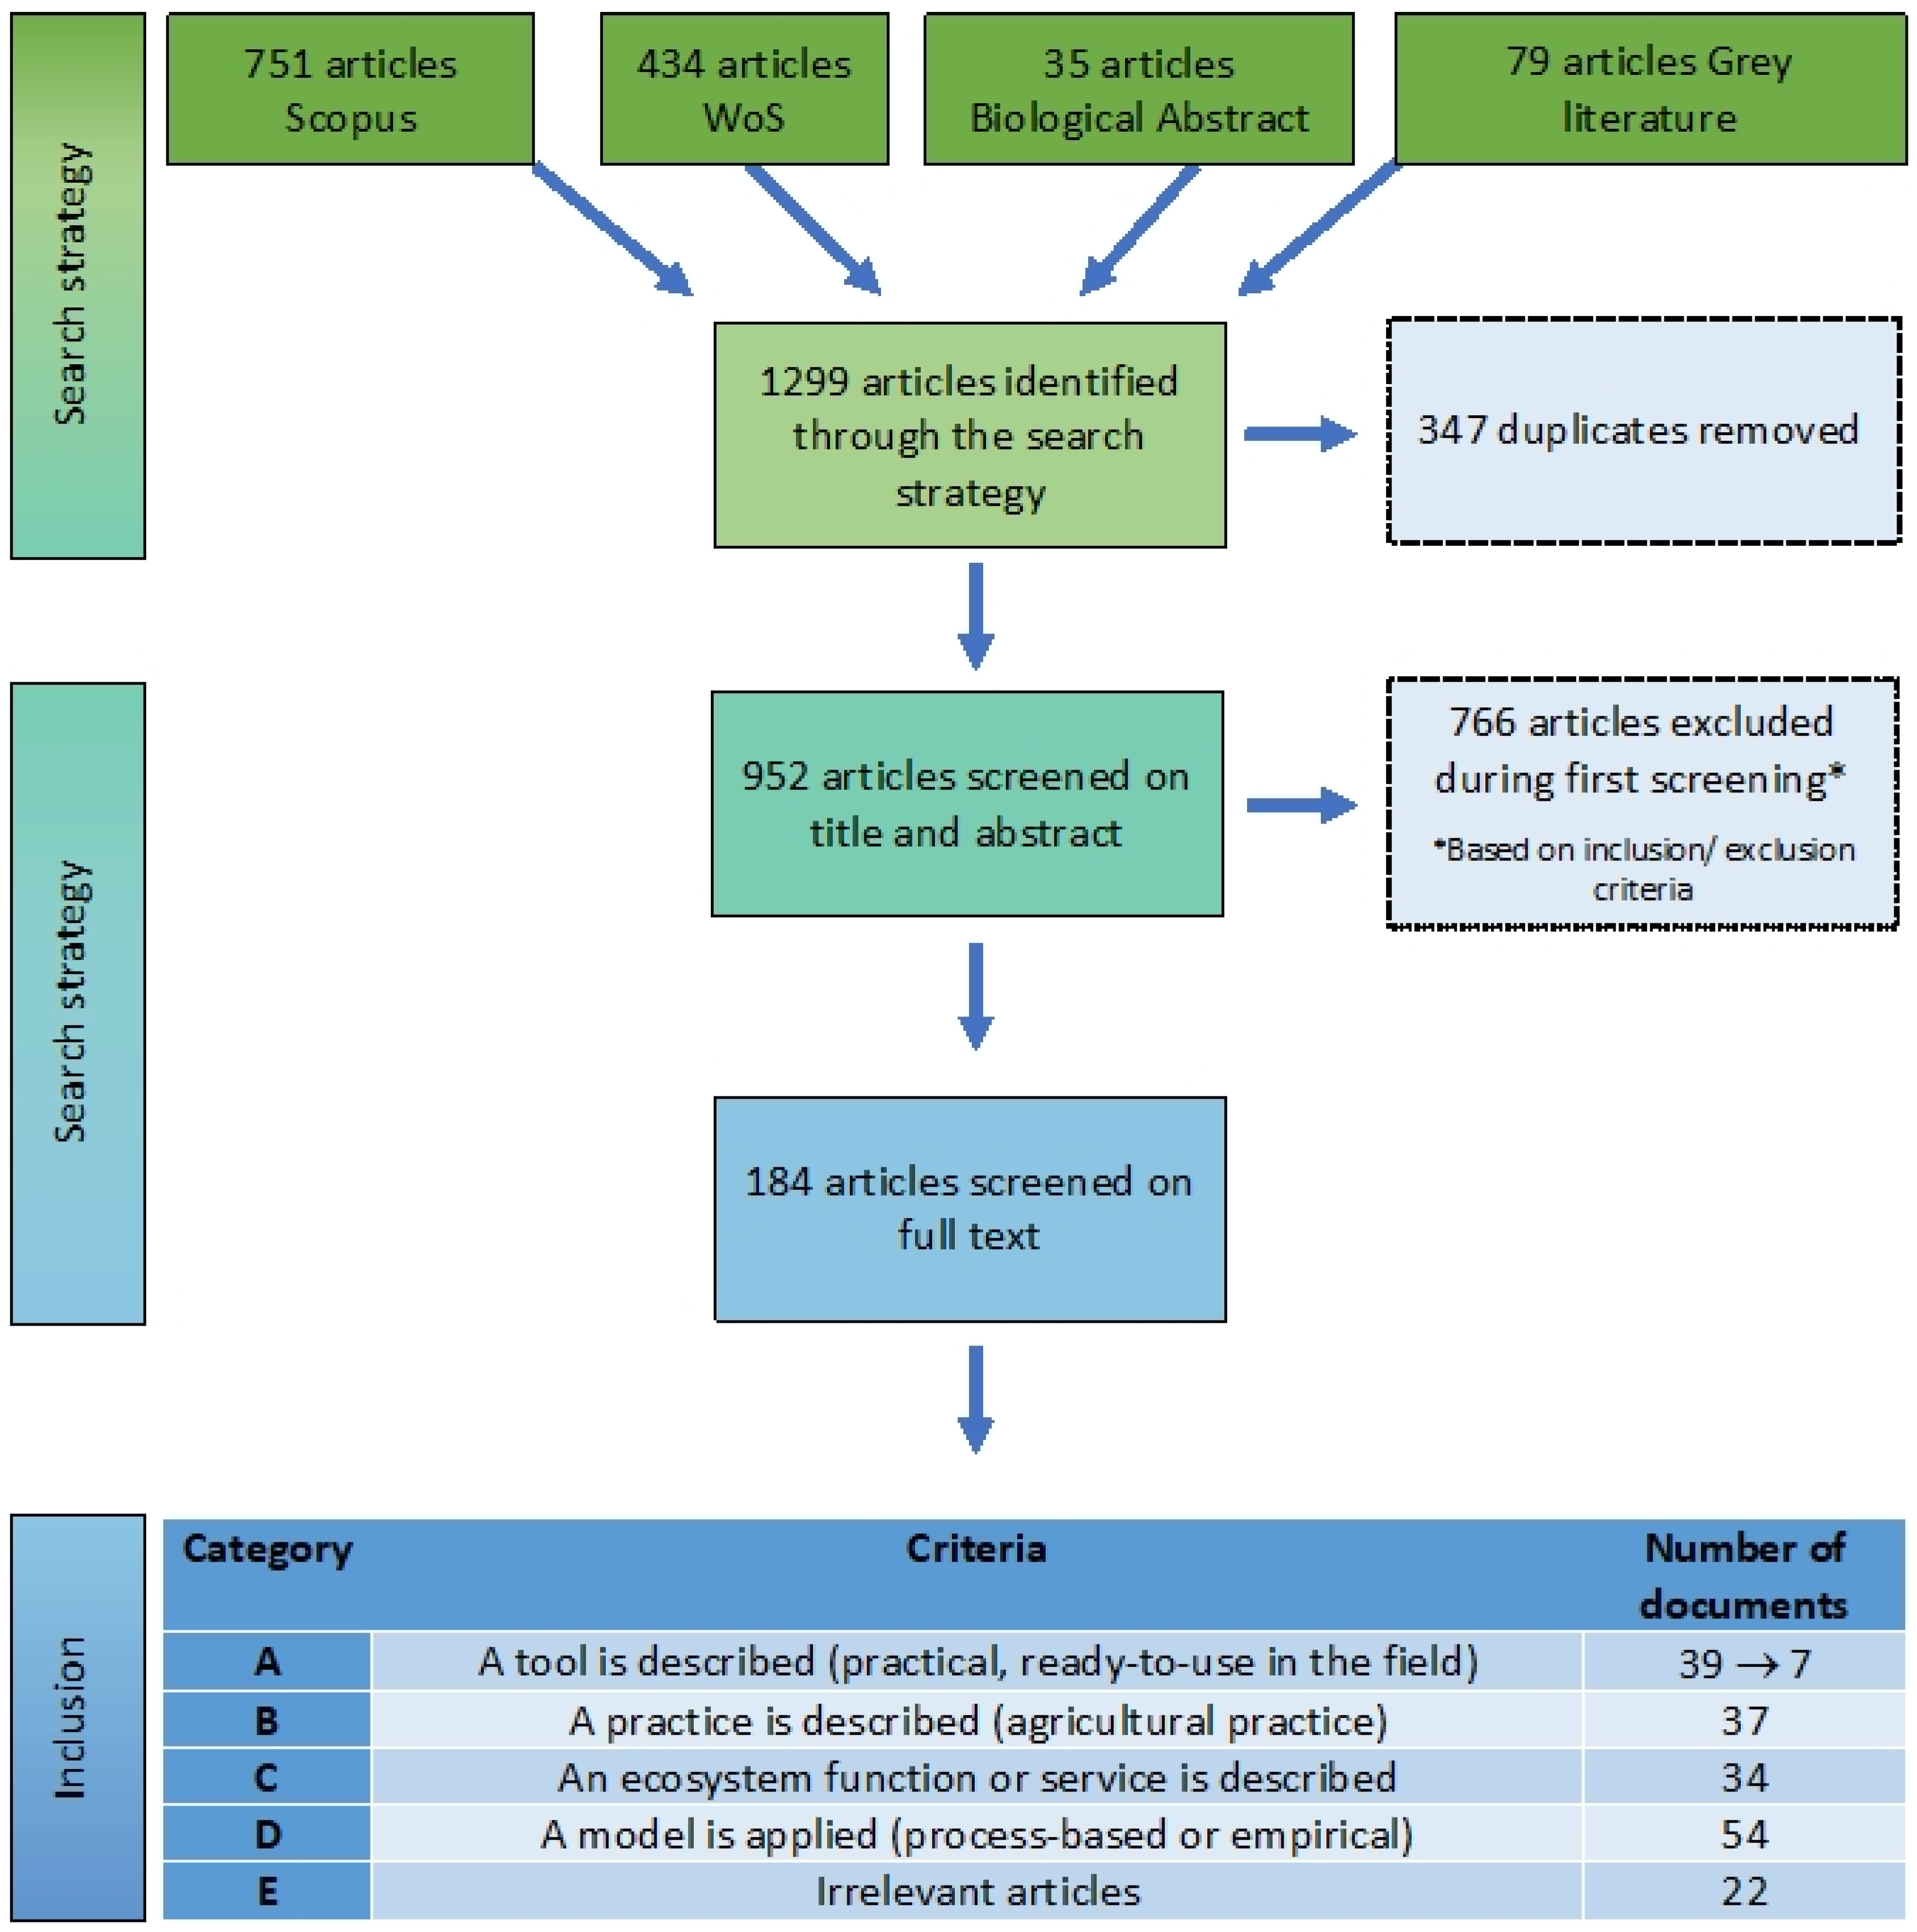
2.1. Design of the Review and Search Strategy

This systematic review was designed according to the PRISMA-P guide [15]. To guide the search process, the PICO approach was utilized, framing the research question into Patient (Ecosystem Functions/Services), Intervention (Tools and Trade-offs), Comparison (not pertaining to this study as we treated tools individually), and Outcome (Agriculture). This method provided structure to the search in order to give a clear understanding of the scope of the planned review. The core review team was comprised of four individuals with different knowledge and expertise (sustainability science, environmental science, agriculture, ecophysiology, agroforestry). The systematic review was conducted following four main steps: (1) establishment of the research question, (2) collection of the documents, (3) sorting of documents with/without relevance, (4) analyzing and reporting the results. The Rayyan software (https://rayyan.ai/ (accessed on 21 October 2021)) was used for our systematic review [16].
The search was conducted in September and October 2021. Three electronic databases were used: Scopus, Web of Science (WoS), and Biological Abstract. The search string presented in the supplementary information (Section S1) was applied whenever possible. Nevertheless, for the grey literature, the search was not as comprehensive, since sites, or search features, did not enable the utilization of Boolean/Proximity operators. The publication time frame for the collected papers was set to 1975–2021. The search included both English and French articles.

2.2. Screening Process

The review process was organized into several steps. A detailed flow chart of each step of the review based on Tsafnat et al. [17] is presented in Section S1 and Figure 1. At the first step, we started collecting articles from the three databases (Scopus, WoS, and Biological abstract) using the search strings (Section S1). Grey literature was searched for, using Google and Google Scholar. At this step, 1299 article were identified. After removing the duplicates, 952 articles went through the first screening assessment determining the relevance of the articles by reading titles and abstracts and applying the eligibility criteria in Table 1. For an article to be relevant and stay in the assessment, all six criteria had to be met. Some grey literature did not contain an abstract. Thus, to facilitate the screening, either the executive summary, the guidance section, or the conclusions were assessed. At this step, 766 articles were excluded.
After the first eligibility review step, 184 articles were judged relevant and were read in full and analyzed. From this reading it became clear that we had one group of high relevance for our purpose, i.e., that which described a tool (A). However, several other relevant topics became apparent and gave us a classification matrix of five categories: the description of a tool (A), a practice (B), an ecosystem function or service (C) and application of a model (D). The fifth category (E) (bottom of Figure 1) contained 22 of the 184 papers that were considered irrelevant at a closer reading, and were hence not part of the final analysis. Some papers were recorded to be relevant for several categories and therefore appear twice (Figure 1).
The number 7 at category A, indicates that in the end only seven tools were regarded as ready to use by farmers and hence fully practical.

3. Results

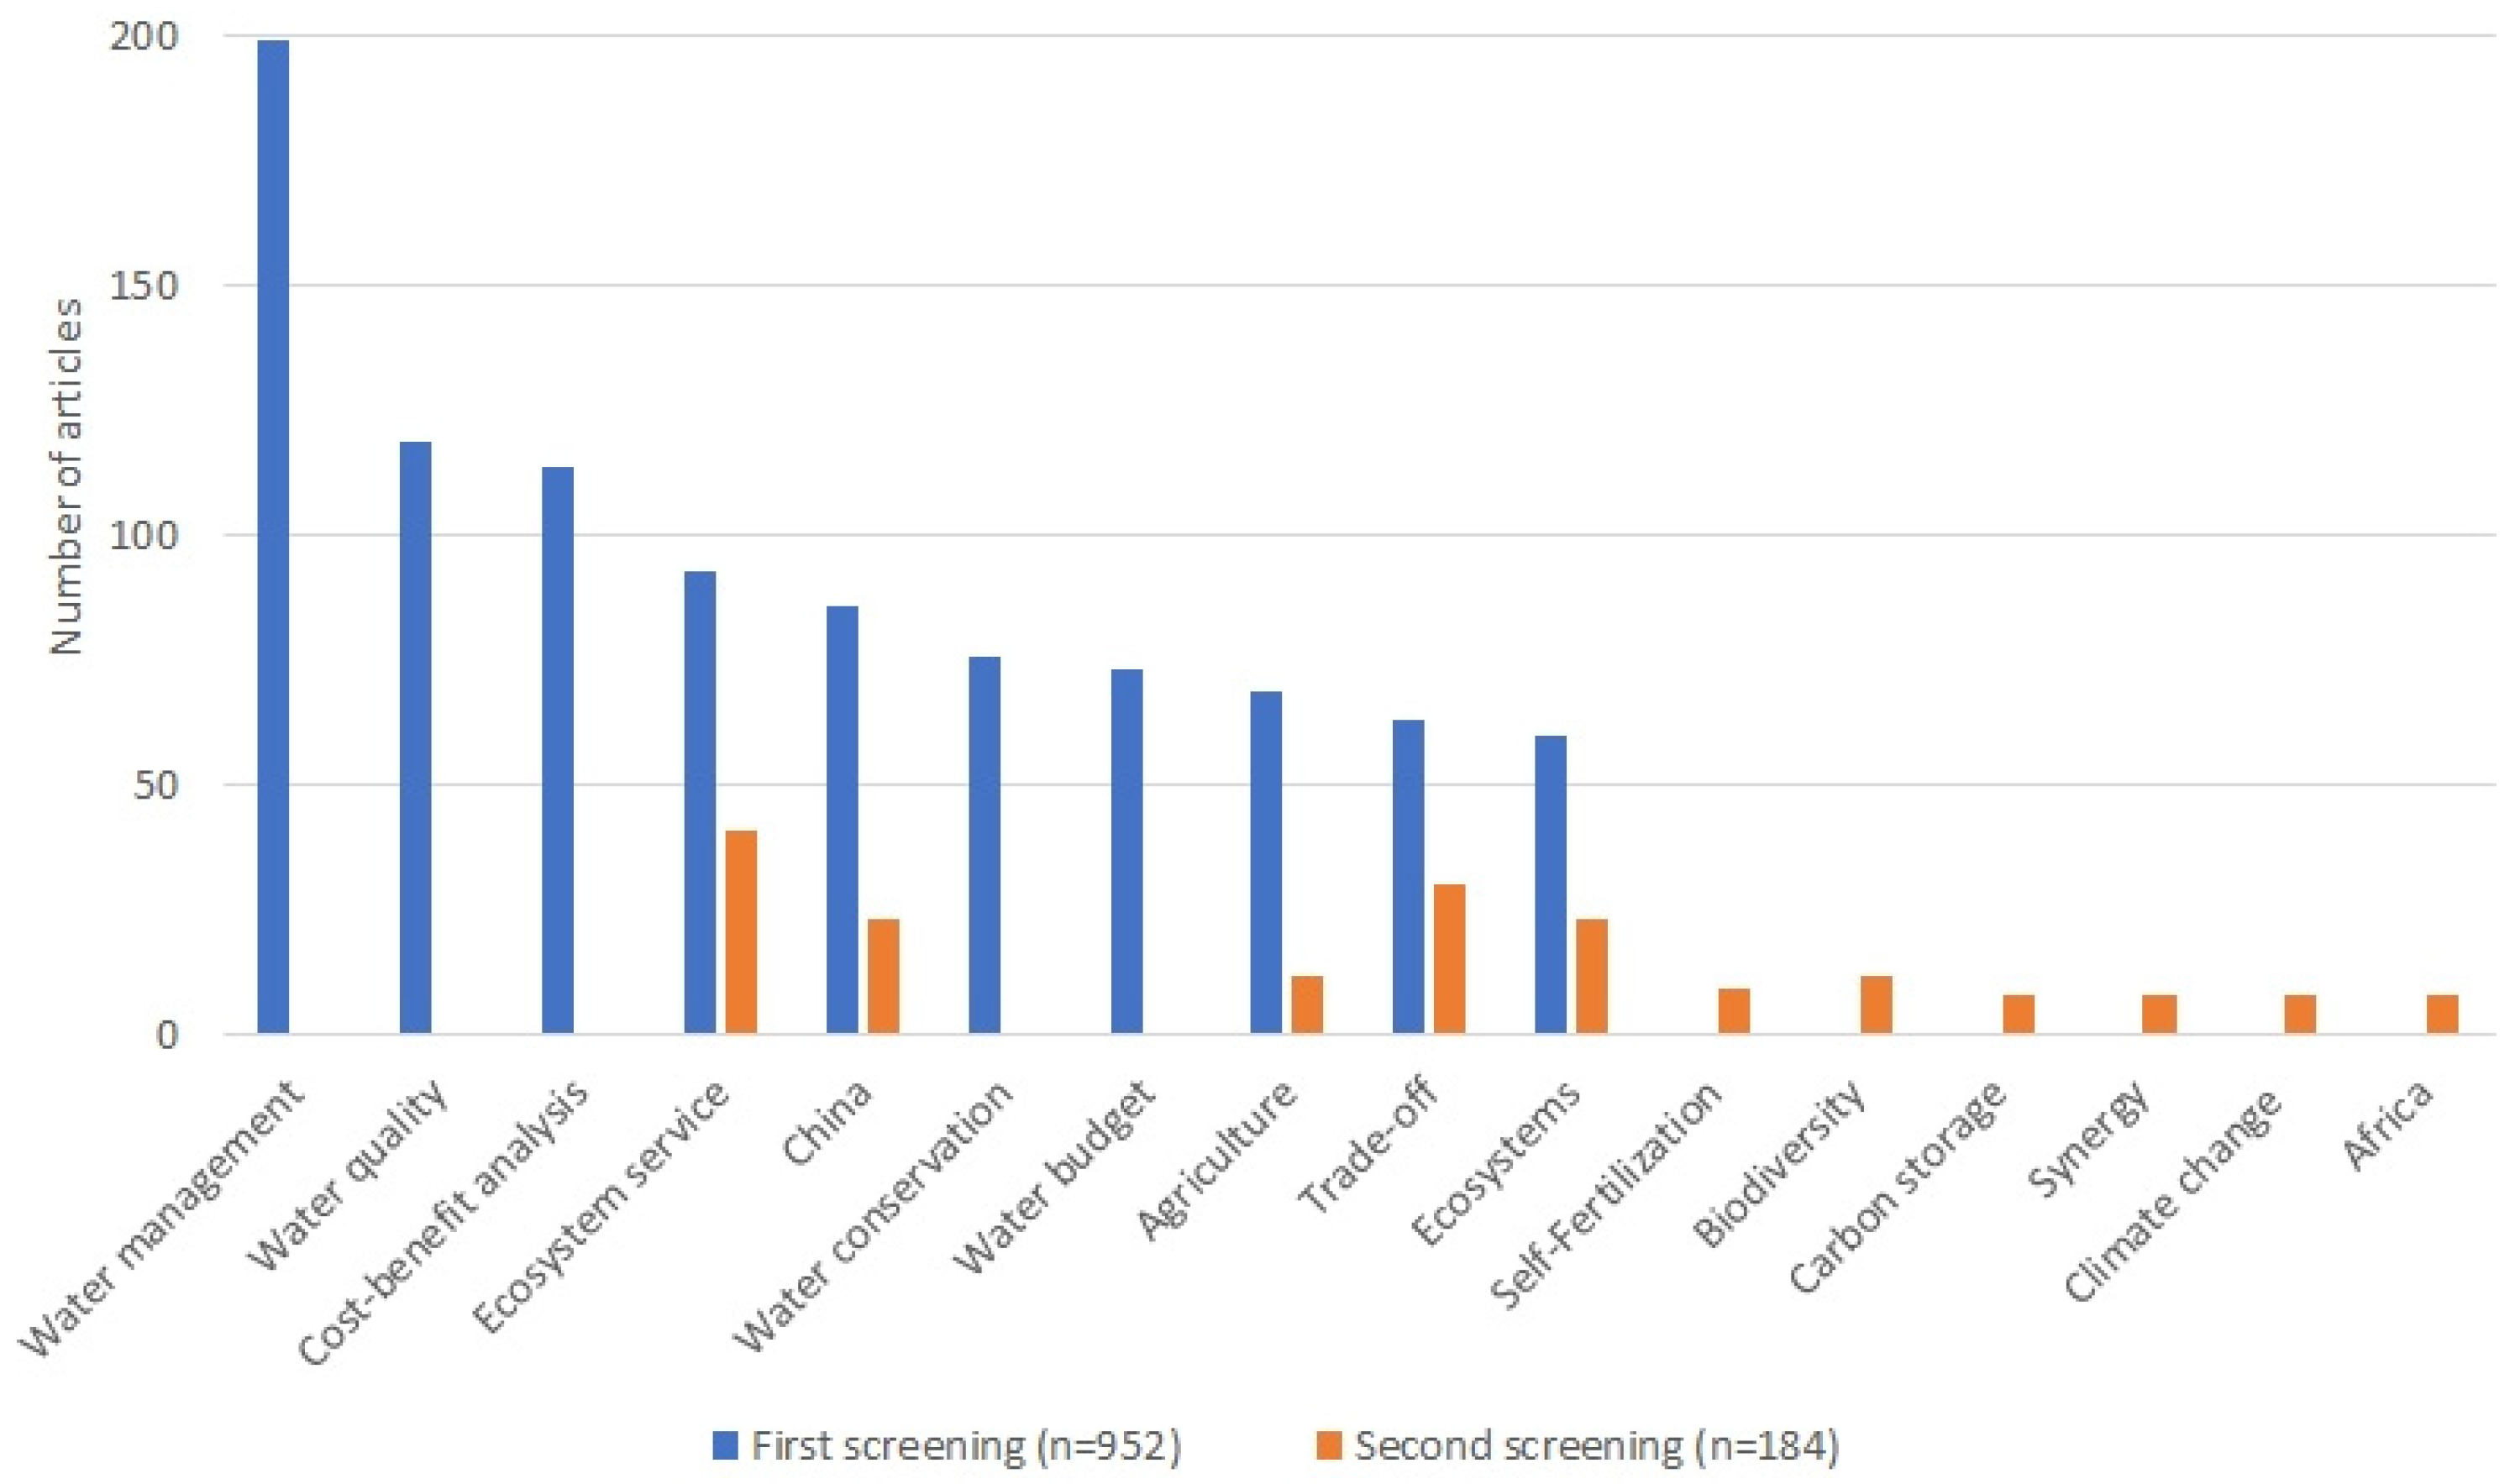
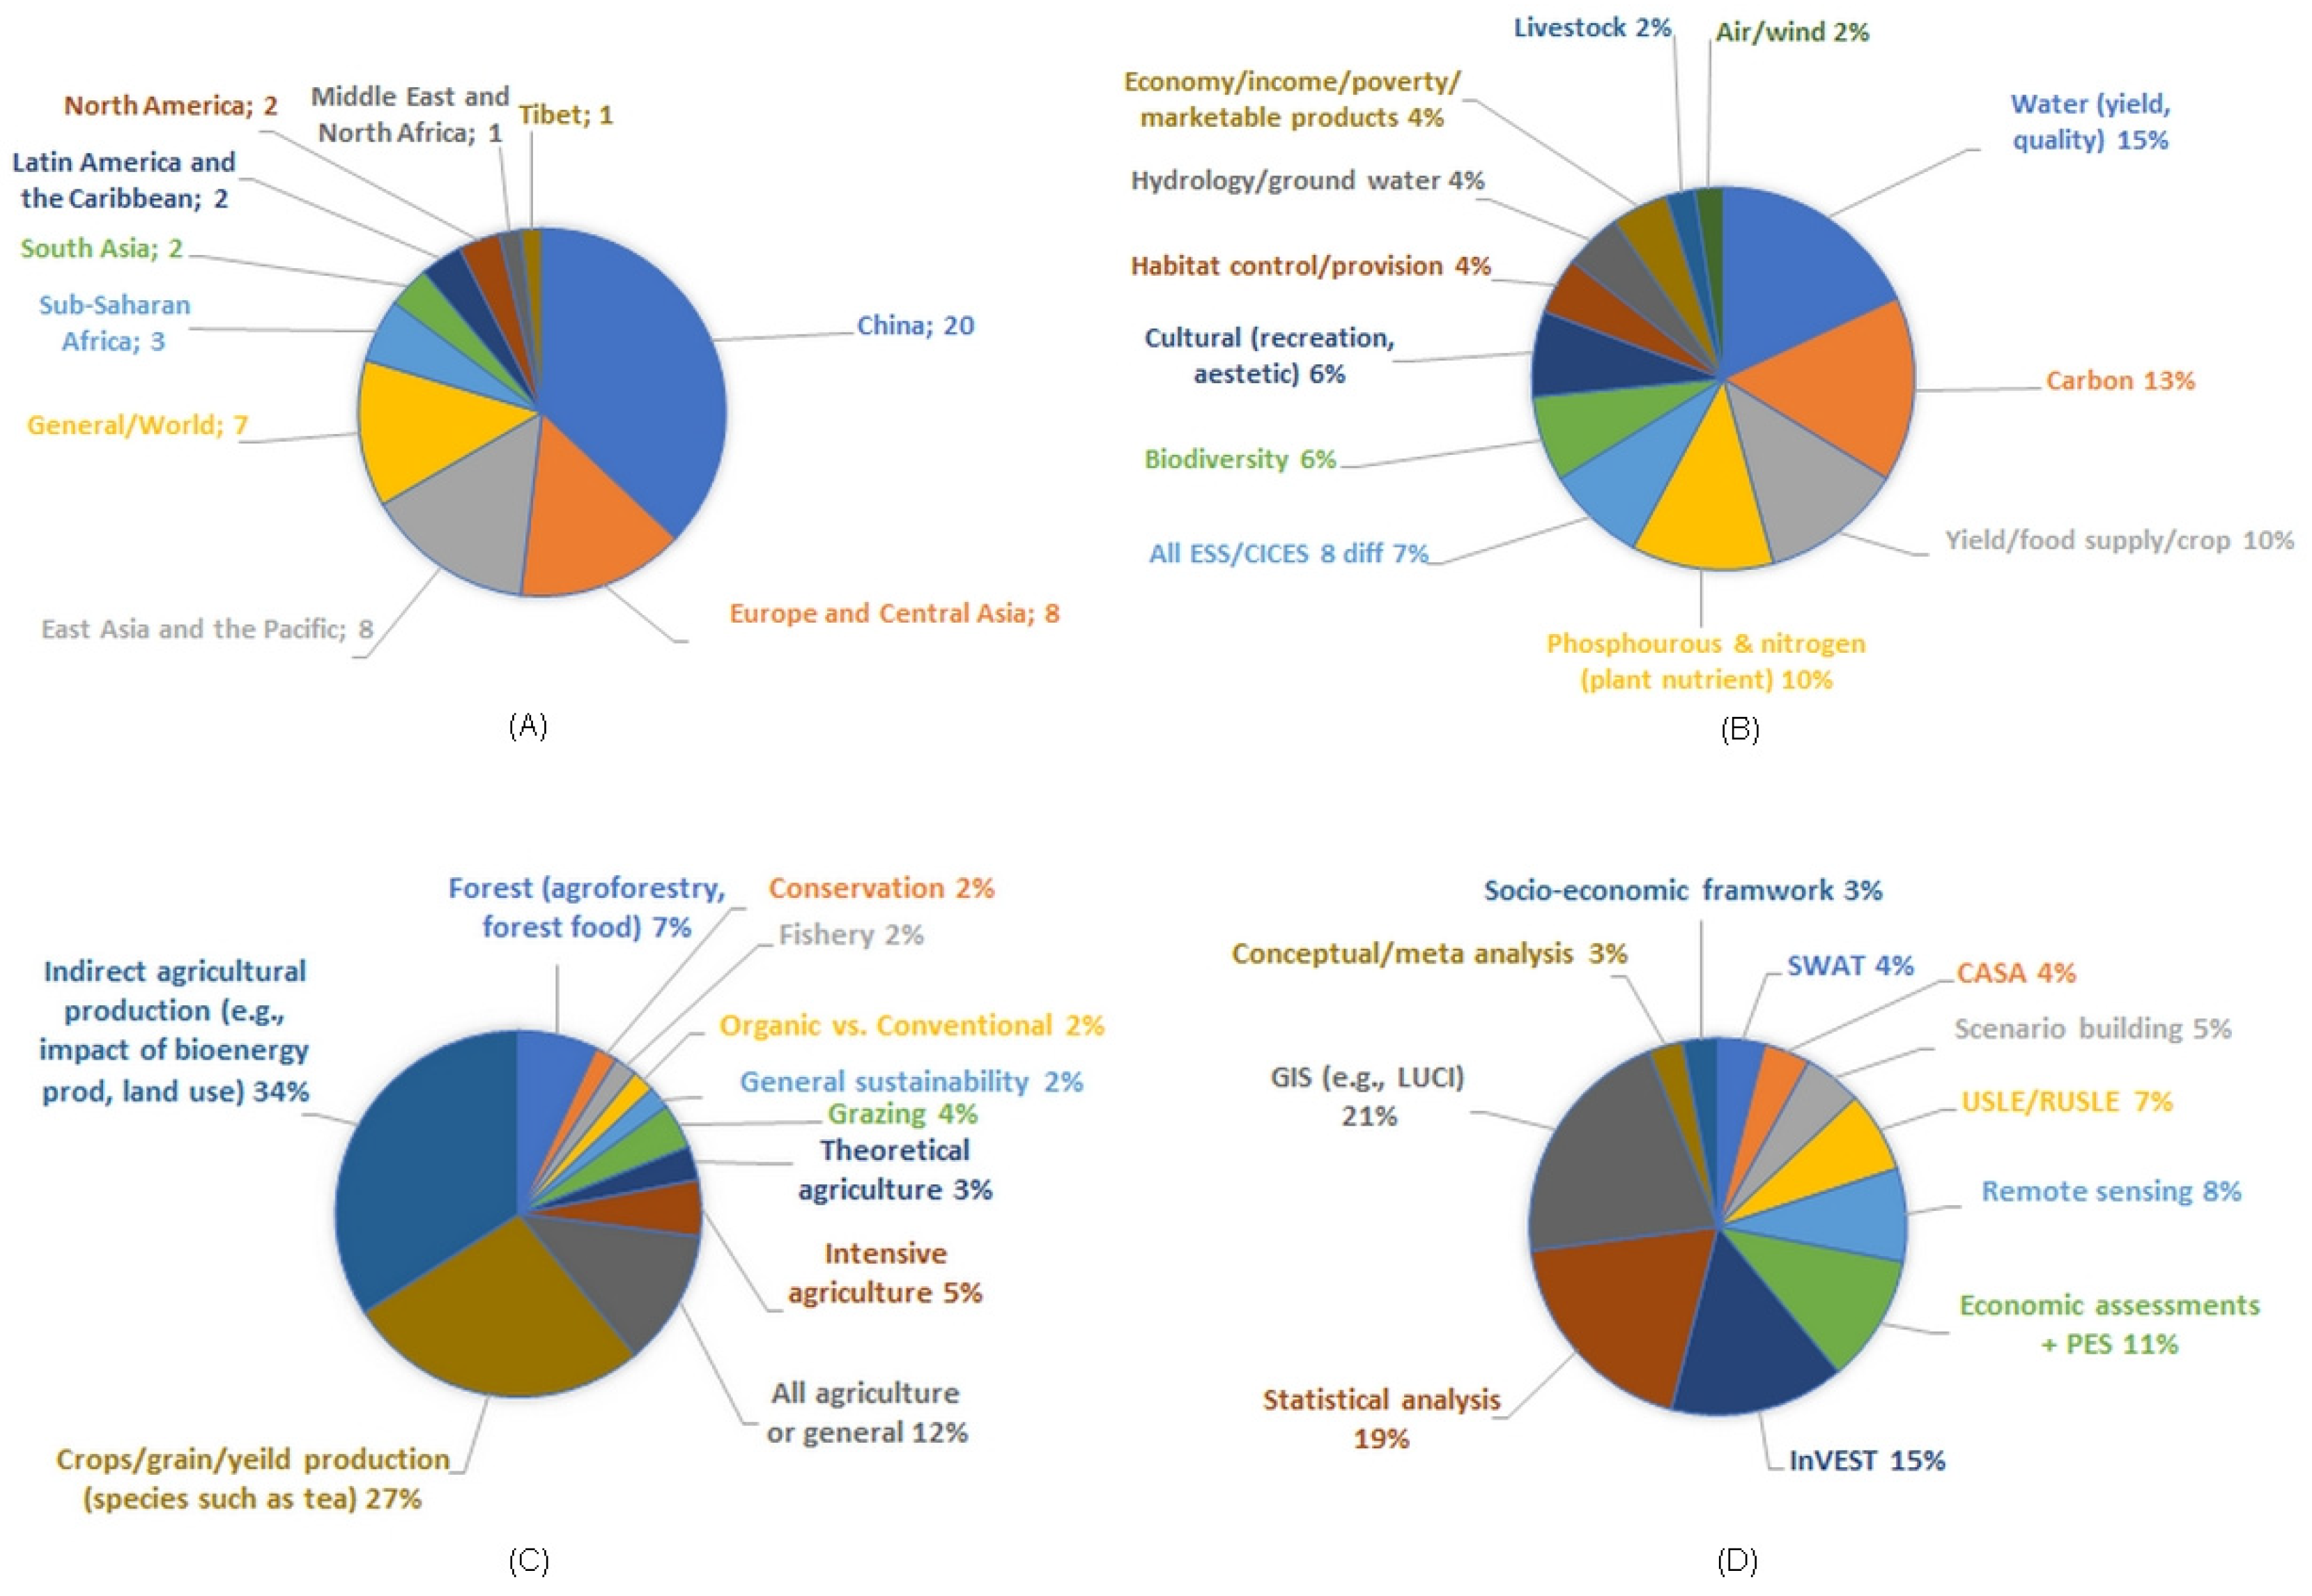
3.1. Overview of Results

The 952 articles selected for the first screening had a high frequency of topics related to water (Figure 2) according to the Rayyan software. Water management and water quality were the most frequent topics, followed by cost–benefit analysis and ecosystem service(s). Many of the articles focusing on water were published prior to the shift in focus to ecosystem services that took place in connection with the publication of the Millennium Ecosystem Assessment [3]. Agriculture was only the eighth most frequent topic. In contrast, for the 184 articles selected for the second screening, ecosystem services were the most frequent topic, followed by trade-offs, ecosystems, and China (Figure 2), indicating that our process became more focused towards our target areas as the screening evolved. China is the only country in the top ten topics for both screenings, while Africa appears in the top ten in the second screening.

3.2. Practices

Even though the 37 articles in this category primarily described practices, the analysis dividing practices and ecosystem services partially overlaps with several articles falling into both categories. The focus of the 37 articles with practices as the primary category was on improving agricultural yield (Category B Figure 1; see Section S2 for references). As shown in Figure 3, 10 of the articles were reviews that covered many regions of all continents. Sub-Saharan Africa (8) as well as East Asia and the Pacific (8) were the two regions with most articles focused on practices.
From the 16 types of practices identified, soil fertility improvement and agricultural systems were the most widely studied in the articles (7 and 6, respectively), followed by organic farming (4). The soil fertility improvement practices included the application of mycorrhizal inocula (liquid, liquid mix, solid, and native arbuscular mycorrhizal spores), composting, manure and synthetic fertilizer applications, biochar application, fallow crop used as green manure and the application of wheat straw mulch [18,19,20,21,22,23]. The agricultural systems studied were monoculture and polyculture, the intensification of cereals and grain legumes in both intercrops and/or rotations, agroforestry, agricultural land-use practices, farming systems and agroecology [24,25,26,27,28]. The articles dealing with organic farming were comparisons of this practice to conventional agriculture and organic farming in urban agriculture [29,30,31].
Three articles tested groups of practices called best management practices that included agronomic practices intended to intensify oil palm production and improve yield at a given site using cost-effective approaches, crop rotation and diversification, planting of cover crops, no-till systems (or reduced till), integrated pest management, integration between livestock and crops, agroforestry practices and precision farming [32,33,34]. Conservation agriculture practices (rotations, reduced or no tillage, soil cover) and water reuse practices were each the subject of three articles [35,36,37]. Two articles were focused on tillage (moldboard plow, chisel plow, spring disk, ridge-tillage, no-tillage, rotation and minimum tillage). Other practices, including agricultural land consolidation, climate-smart agriculture, revegetation, seed treatment (priming), soil and water conservation technologies, soil-less agriculture (floating bed) and sustainable land management were the topic of only one article each.
Concerning the link between practices and ecosystem services, most of the practices in the 37 articles aim to improve the provisioning services (36), followed by the supporting services that are covered by 29 of the articles, and the regulating services by 22. The least studied ecosystem services are cultural services (1). Except for revegetation practices, all the other practice types were evaluated for provisioning services while cultural services were only assessed in relation to agricultural systems (Figure 4). A high number of articles (15) analyzed ecosystem services in relation with soil fertility improvement, followed by different agricultural systems (e.g., monoculture, polyculture, agroforestry), organic farming, best management practices, conservation agriculture and water reuse practices (Figure 4).

3.3. Ecosystem Functions and Services

A total of 34 articles were classified as primarily dealing with an ecosystem function or service (Category C, Figure 1; see Section S2 for references). In terms of geographical distribution, global studies were most frequent (13) followed by articles focusing on China (8) and Europe (8). Sub-Saharan Africa, East Asia and the Pacific, South Asia and Latin America had relatively few studies in the ecosystem functions and services category (Figure 5A).
Four papers were generic or purely theoretical but dealt with all four ecosystem service categories (provisioning, regulating, supporting and cultural services). Food supply (13 articles) was the most frequent ecosystem service (ES) addressed, followed by water regulation (12) and soil conservation (11) (Figure 5B). Food supply included crop production, dairy, meat and non-wood forest products [38,39,40,41], while water regulation refers to water quality, water flows, waterlogging and ground water recharge [42,43,44,45]. Soil conservation encompassed the reduction of soil erosion, nutrients retention, soil organic matter conservation and sand fixation [39,46,47].
The other ES studied in the articles are biodiversity (seven articles), carbon sequestration (six), habitat provision (five) and cultural services (five), which include recreational opportunities [44,48,49,50]. The ESs with a lower number of articles are pollination (three), climate regulation (two), land degradation prevention including landscape aesthetic (two), pest control (one) and provision of forest products, which include wood, wild animals, and non-wood forest products (one).
Some studies show that ecosystem services were not static over time and that agricultural intensification and urbanization are key factors that reduce ES [51]. Climate change also affects ES provision [48]. Using spatial correlation, [52] shows that synergy relations exist among crop production, carbon sequestration, carbon storage and nutrient retention. All agricultural systems present multifunctionality to a varying degree and large-scale systems produce more ES than small-scale systems [53]. In the study by Luo et al. [44], soil retention, carbon sequestration, water purification and habitat provisioning for biodiversity increased significantly across the different land use types over several decades, but not hydrological regulation.
There are quantitative methods available for analyzing ES associations. Multiple ecosystem services have different degrees of positive and negative correlations [48]. Relationships between ES were found to vary in different regions and over different time periods, depending on regional specific conditions and agricultural activities. Socio-economic factors (use of fertilizers, population density, urbanization, GDP per land area) make a larger relative contribution to ES provision than environmental factors (temperature, precipitation) in all climate zones.

3.4. Models for Trade-Off Analysis

Category D with models as the primary category (Figure 1) included 54 articles (Figure 1; see Section S2 for references) and could at a first glance be perceived as tools for assessing trade-offs, which is also the reason they appeared in our search. However, these tools are methodologically very sophisticated in nature and require expertise in specific fields, high technical know-how and computer power. They are, hence, not perceived as being practical tools to be used by practitioners and farmers. In Figure 6A–D some of the characteristics are presented. In terms of what geographical area is covered (Figure 6A), China appears more frequently (37%) than any other country or even continent.
In terms of the ecosystem service or function assessed in the articles (Figure 6B), there are five dominant groups that together cover 61% of the issues: soil, water, carbon, crop yield and nutrients. Many of the articles assessed trade-offs between functions and services or the bundling effect of groups of ecosystem functions [48,54]. Of the agricultural thematic areas (Figure 6C) represented in the model papers, only 27% clearly dealt with crop production and agricultural yield [18,55], while the largest group (34%) covered agricultural production indirectly by assessing land use in general [56,57]. Agricultural productivity, the scope of our assessment, was very often included as one of the ecosystem functions, among others.
The most dominant type of model used various types of GIS application (21%), often in combination with other approaches or models, such as statistical modelling. InVEST (Integrated Valuation of Ecosystem Services and Tradeoff) was the single most common developed model, used in 15% of the papers, with a dominance in China [58,59] (Figure 6D). Being a spatially explicit model, it is strongly linked to the use of GIS, but can be run independently and give results in either biophysical terms (e.g., yield or carbon) or economic terms.

3.5. Practical Tools for Trade-Off Analysis

The final step in the analysis of articles involved identification of practical tools (Category A, Figure 1) that could be used by practitioners on-the-ground for assessing trade-offs between agricultural productivity and ecosystem functions and services, also in more data scarce environments, such as in developing countries in Africa. In total, 39 articles were selected for this analysis (see Section S2 for references). Several of the reviewed articles present blueprints and protocols for selection of indicators for trade-off analysis using frameworks based on principles in ecology and economics [60], and existing models, such as InVest or SolVES [61], standardized protocols for data collection [62], agricultural indicators and Sustainable Development Goals (SDG) targets [63,64], biodiversity indicators [65], composite indices of multiple ecosystem services [66], and GIS frameworks [67,68]. These protocols and indicators can serve as useful guidance for trade-off analysis, but are not sufficient on their own, and are often not very practical and easy to apply and require similar types of expertise as category D models discussed above.
There were also articles that focused on economic assessment of ecosystem services [69], with examples of cost–benefit analysis of climate-smart agricultural practices in West Africa [70] and financial analysis of soil and water conservation in East Africa [71]. More complex assessment tools use agri-environmental indices to target investments and payments to farmers [72] and payment for ecosystem services schemes for agroforestry [73]. Studies focusing on decision support and policy tools use ranking of ecosystem services [74], focus on mainstreaming of ecosystem services in policies and engagement of local stakeholders [75,76], and apply multi-criteria decision analysis using available data and ranking of management options identified in the field [77], as well as the triple bottom-line approach [78]. Trade-off analysis based on scenario development is also common and there are examples that use the Drivers, Pressures, State, Impact and Response (DPSIR) framework [79]. Scenarios can also be developed using a combination of existing maps, modelling and GIS tools [80] and be used for educational purposes [81]. Below we highlight the seven tools that meet our objective best, that is, they are practical and can be used directly in the field by practitioners without expertise skills (Table 2). Specifically, these tools:
  • do not require special equipment or machinery,
  • do not require expertise skills such as computer programming, GIS, or sophisticated economic analysis,
  • produce information that can be understood and interpreted by practitioners and farmers and that can support a decision-making process, or
  • are available to practitioners, farmers/groups of farmers, and the agricultural extension service or equivalent can help in adapting the tools and making them available.
Based on the requirement set for being a practical tool, we found that tools fully addressing agricultural productivity as well as being practical at a farm level were hard to find, since the tools giving yield and productivity tend to be too costly, technical or complex. Instead, we identified seven tools that can be used as a proxy for quantitatively addressing productivity and yield, that instead focused on the relationship with agricultural practices and ecosystem services. One relevant argument for this is that yield and productivity are usually the main focus of the farmer, while the ecosystem functions are more indirect and not the primary parameter in decision making, hence a tool for showing its importance can be very helpful for yield and productivity in the long run.

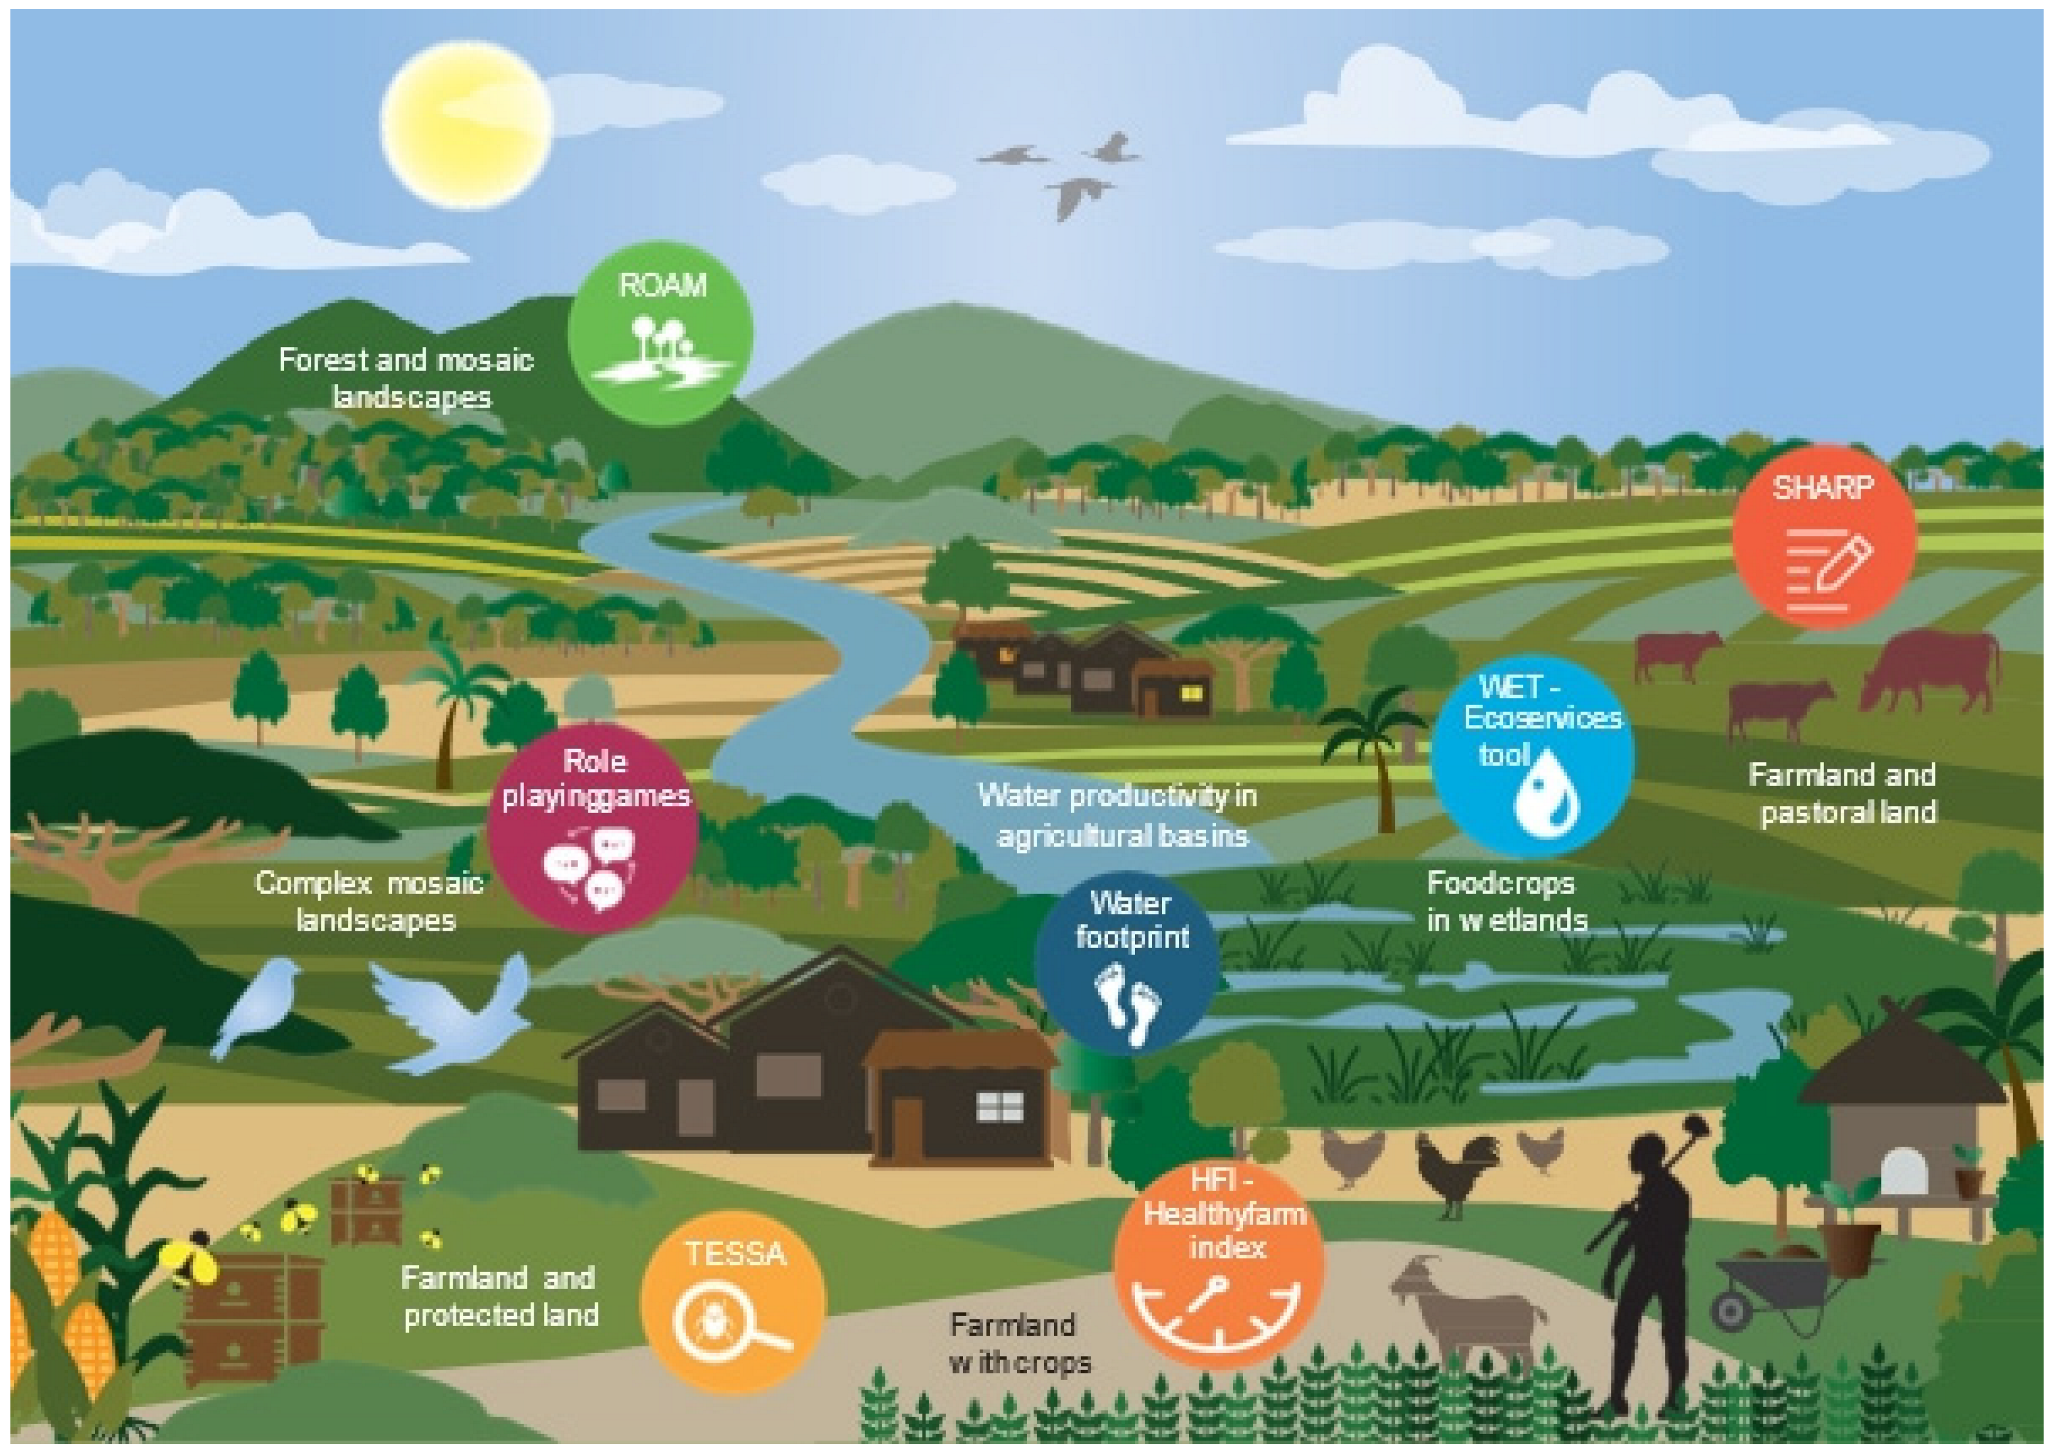
3.6. Practical Tools of Relevance

A water footprint of a product is the total volume of freshwater used to produce the product [82]. It is based on relatively simple calculations by considering the runoff fractions from certain land uses to become blue water available within a catchment or basin. Van der Laan et al. [83] applied the water footprint approach in a water scarce environment in the Kenyan highlands based on simple and transparent assumptions, as opposed to more complex hydrological modelling. The approach includes: (i) characterizing the target basin or catchment by identifying the geographical area; (ii) estimating the share or actual volume of blue and green water availability based on available data and key assumptions; (iii) estimating the share or actual volume of blue and green water consumption for different land uses and other human activities. The assessment covered two contrasting agricultural products (maize and roses) and the water footprint for maize was estimated to be 6.6 times higher than for roses. Several inaccuracies were acknowledged due to the broad assumptions made, but a rough estimate of the water footprint of a bag of maize or a bunch of flowers may help the various water users to better appreciate the finite amount of produce that can be produced in a season from a shared resource, including their trade-offs. An assessment of the advantages and disadvantages of the approach is presented in Table 2.
Table 2. Different types of trade-off tools.
Name of ToolEcosystem Service(s) TargetedMeasure of Agricultural ProductivityRecommended Area of ApplicationAdvantagesDisadvantages
Water Footprint approach in data-scarce regions van der Laan et al., 2021 [83]Water provision—it divides water consumption into blue water (water from rivers, dams and underground sources) and green water (rainfall stored in the soil and available for vegetation growth)Modelled water productivity per m3 in terms of monetary value and labor opportunities for selected cropsAgricultural basins and catchments in water scarce areas—focuses on water productivity
  • Based on relatively simple calculations and can be used in drainage basins where water is a limiting factor for agricultural production.
  • Suitable for data-poor regions to bring together information on total water availability and consumption within a basin.
  • A metric that a broad range of stakeholders are able to engage with
  • Could be used to test different “what-if” scenarios and policy options.
  • Limited only to water or its impact, and hence does not help with assessment of all ES
  • Inaccuracies due to broad assumptions related to precipitation, runoff estimations, and evaporation estimates
  • Water quality and ecological flow requirements are not part of the framework.
Healthy Farm Index (HFI) (Quinn et al., 2012 [84])
  • Biodiversity—planned and associated species and ecosystem diversity
  • Provisioning (yield), regulating and cultural ES
Yield averages of selected common regional crops (e.g., maize, soybean, wheat) based on farm questionnaireFarmland with e.g., maize, soybean, wheat
  • Builds on available information and data and is easy to calculate in a digital spreadsheet
  • Focus on the farm scale
  • Trade-offs can be evaluated
  • Has not been tested outside the U.S.
  • May require a certain minimum farm size to be meaningful
  • May not be as easy to use in more data scarce environments
WET-Ecoservices (Rebelo et al., 2019 [85]; Kotze et al., 2007 [86]))
  • 15 ES focused on three ES complexes:
  • Water flow regulation
  • Climate regulation
  • Water quality regulation
Scoring of the 15 ES are compared for different types of land use, including agricultural areas thereby showing trade-offs between ES and food production.Catchments and landscapes where agriculture is replacing wetlands
  • Easy to use for a wide range of stakeholders
  • Rapid assessment of possible trade-offs between ES is possible
  • Includes many relevant parameters in a nexus-approach
  • Limited tests and experiences focus on wetlands in South Africa
  • More useful at catchment and landscape scale than at farmer field level
Role-Playing Games (RPG)
  • Regulation of climate (carbon), water, soil fertility
  • Provision of habitat for biodiversity
  • Provision of food and agricultural productivity
Participatory simulation of land use change and impacts on livelihoods (cropping, livestock and collection of NTFPs) and ES based on agreed scores.Complex mosaic landscapes—examples from farmland in France and slash-and-burn agriculture in Asia
  • Can improve collaboration and management planning among multiple stakeholders
  • Can test the acceptance of new public policies and explore prospective scenarios.
  • Can be very time consuming, as each new situation requires a new game design
  • More useful at landscape than farm level.
SHARP—Self-evaluation and holistic assessment of climate resilience of farmers and pastoralists
  • Regulating ES to achieve climate resilience
Participatory self-assessment survey and ranking to inform and guide farmers’ practices.Farmland and pastoral land
  • Assesses ES from a resilience perspective
  • Can be time consuming and costly.
  • Requires expertise and/or special training
TESSA—Tool kit for Ecosystem Service Site-based Assessment
  • Coastal protection
  • Cultivated goods
  • Cultural services
  • Global climate regulation
  • Hydrological services
  • Harvested wild goods
  • Pollination
Site-based assessment of agricultural productivity translated into a monetary value, based on primary data collection and stakeholder consultationsFarmland and protected/conserved Land
  • Is a compilation of rapid ES assessment methods to help non-experts to understand the impacts of ES
  • Relatively cheap
  • Does not help with assessment of all ES
  • Results represent snapshots of the current and alternative state
  • Does not produce spatial outputs
  • Can be time consuming depending on the context
ROAM—Restoration Opportunities Assessment Methodology
  • Climate regulation through Carbon storage and sequestration
  • Provision of habitat for biodiversity
ES trade-offs with agricultural productivity are only indirectly assessed through stakeholder prioritization of restoration optionsForest and mosaic landscapes
  • A set of rapid assessment methods to help non-experts to assess ES
  • Cheap and relatively rapid—a national-level assessment typically requires 15–30 days spread over a two-to-three-month period.
  • Does not help with assessment of all ES
  • Trade-offs with agricultural productivity are only indirectly assessed
The Healthy Farm Index (HFI) was developed to assist farmers in managing biodiversity and ecosystem services [84]. Metrics of biodiversity include measures of planned and associated species and ecosystem diversity. As a species-level metric of associated diversity, the HFI focuses on wild bird diversity. As metrics of provisioning ES, the HFI measures yields of selected common regional crops (e.g., maize, soybean, wheat) and alternative income opportunities provided by biodiversity and nature, such as ecotourism. As metrics for regulating ES, it measures conservation structures, such as field buffers and cover crops, to indicate soil retention. Water regulation is measured as the percentage of waterways protected by buffers. Cultural services are measured by land tenure, calculated as the percentage of farmland owned by the farmer, and self-evaluation of individual satisfaction with farm profit and the farm management system. A digital tool for the HFI has been developed and applied in Nebraska among organic famers with support of the extension service. It appears practical and easy to use but may require a certain minimum farm size to be meaningful. Further work is needed to evaluate whether the use of the HFI changes farmers’ perception of the costs and benefits of increased diversity, ultimately affecting their behavior (https://johnquinniv.wixsite.com/agroecology/healthy-farm-index (accessed on 25 October 2021)).
The purpose of the WET-Ecoservices tool is to provide quick ecosystem service assessments for decision makers, governments, planners, consultants, and educators. Rebelo et al. [85] used the tool to assess trade-offs between two different land-use scenarios: wetlands or the agriculture that would replace them. The first step is to classify the wetlands into hydro-geomorphic types, such as seep, valley-bottom, floodplain and depression. It assesses 15 ecosystem services using scores from 0 to 4 (highest) based on questionnaires that have been developed for each ES. Scores are based on field observations or easy-to-do measurements, calculations and information from literature, databases and expert knowledge. In the study by Rebelo et al. [85], the tool was used against measured and calculated data from three wetlands in the Cape Floristic Region, South Africa. They found that an important trade-off appeared to exist between the potential food provision of the wetlands and water-related ecosystem services, as well as with carbon storage. The tool appears relatively easy to apply in the field by non-experts, but it has a limited scope with its focus on South African wetlands [86]. However, after some adaptation, it could probably be scaled up to other areas with sub-tropical peat/wetlands.
Role playing games can facilitate dialogue between multiple stakeholders and promote shared learning on environmental issues through the construction of a common artificial world, using computer models or other means such as hand drawn maps, leading to the emergence of a shared representation of the complex system and problem to test the acceptance of new public policies and explore prospective scenarios. This approach was tested in north-western France to understand the poor performance of agri-environmental schemes [87]. In a practical example from southeast Asia, communities explored scenarios for the development of their local agriculture, negotiated trade-offs between ecosystem services, and identified potential ‘winners and losers’ among the ES using a board game [88]. A consensual land-use plan emerged that was expected to inform the design of Payment for ecosystem services (PES)/Reducing emissions for deforestation and forest degradation (REDD+) schemes in tropical forests with slash and burn systems. This type of tool has many similarities with the various tools for participatory land use planning found in the grey literature [89] and used by many development projects and practitioners.
SHARP—Self-evaluation and holistic assessment of climate resilience of farmers and pastoralists—is a tool for assessing rural households’ resilience to climate change that uses a participatory self-assessment survey complemented by community mapping and cropping calendar development in combination with climate data to inform and guide farmers’ practices [90,91]. Farmers or pastoralists assess the adequacy and importance of different aspects of their farming or pastoralist systems to their livelihoods and produce a priority ranking. In the assessment of resilience, several indicators for ecological self-regulation are included, as well as landscape functioning and diversity, thus integrating the concept of regulating ecosystem services. There is also an indicator of ‘reasonably profitable’ related to the farming or pastoral systems. The fact that SHARP is looking at how to balance ecosystem functions to enhance resilience with profitability that depends heavily on agricultural productivity makes the tool relevant for this review. However, full implementation can be time consuming and requires one to three months and special training or support from experts and sometimes Farmer Field Schools, as demonstrated in East Africa. (http://www.fao.org/in-action/sharp/en (accessed on 25 October 2021)).
TESSA—Tool kit for Ecosystem Service Site-based Assessment—is one of several tools assessed by IUCN for measuring, modelling, and valuing ecosystem services, including agricultural production [92]. The toolkit emphasizes the importance of comparing estimates for alternative states of a site (for example, before and after conversion to agriculture) so that decision-makers can assess the net consequences of such a change, and hence the benefits for human well-being that may be lost through the change or gained by conservation. There are two key steps, starting with a preliminary scoping appraisal conducted through a stakeholder workshop which produces qualitative information about the ES provided by the site. This is followed by a full assessment that provides multiple methods for quantifying individual ES focusing on collecting local data and engaging with stakeholders at the site. The two steps mean that the tool can be used for qualitative assessment only, or for quantifying the value of selected ES in biophysical and monetary units to provide approximate service estimates that are robust enough for informing decision making, without necessitating investment of costly resources and technical expertise. The TESSA assessment toolkit does not cover all ES, but includes full assessment methods for coastal protection, cultivated goods, cultural services, global climate regulation, hydrological services, harvested wild goods, and pollination. It requires primary data collection including vegetation surveys, soil sampling, and stakeholder consultations, and can therefore be time consuming (up to 255 working days) depending on the context. TESSA has been applied in, e.g., the Moeyungyi Wetland in Myanmar, where it was demonstrated that the value of rice production was a fraction of the value of other ecosystem services provided by the wetland, such as water provision, harvested wild goods, and carbon sequestration [93] (http://tessa.tools (accessed on 26 October 2021)).
IUCN has also in recent years had a strong focus on Forest Landscape Restoration (FLR) and developed the Restoration Opportunities Assessment Methodology—ROAM [94]. ROAM was not captured by our original search but is relevant, as it focuses on restoration of mosaic landscapes that include agricultural areas. ROAM involves a stepwise and iterative application of a series of analyses to identify the best set of FLR opportunities applicable to the area in question. Important steps include stakeholder prioritization of restoration interventions, restoration opportunities mapping, economic modelling, and validation, followed by cost–benefit carbon modelling using relatively simple tools, diagnosis of the presence of key success factors and finance and resource analysis. Trade-offs with agricultural productivity are only indirectly assessed through stakeholder prioritization of restoration options, including food production through, e.g., agroforestry and silvi-pasture. ROAM has been tested in a number of Asian countries and a national-level assessment typically requires 15–30 days spread over a two-to-three-month period [95].
As can be seen above and in Table 2, many tools focus on just one or a bundle of ES and are designed for different types of land use and/or ecosystems and applied at different scales. Therefore, tools need to be selected based on the context, priority ES and site characteristics. Moreover, participatory tools and rapid assessments may in some instances need to be complemented by more sophisticated models and tools based on empirical data, computer modelling, GIS, and detailed economic assessment to validate the findings and assess their credibility in terms of trends. However, practical, and participatory tools, such as role-playing games, TESSA and ROAM, could contribute to negotiations and resolution of conflicts in the landscape related to trade-offs that is beyond the scope of more technical and scientific tools.

4. Discussion

Based on the aim of this paper to address the two issues regarding (i) the availability of practical tools to assess many of the critical issues related to agricultural productivity and trade-offs with ecosystem functions and services, and (ii) the readiness of scientific findings in supplying support and guidance in this respect, the questions that we find relevant in light of our findings are addressed below.
What is the scientific focus related to agricultural productivity and ecosystem functions? Water seems to be included in many studies on agricultural productivity and ecosystems functions [96]. The most dominant topic when looking at all the articles from the search was related to water. After the second screening, food production became the most common topic for articles focusing on ecosystem functions and services [97]. Fertility improvement and agricultural systems were the most common topics for articles focusing on agricultural practices, while soil, water, carbon, crop yield and nutrients were the most common in articles focusing on models. Two of the seven practical tools also had a focus on water (Figure 7). Modelling has opened possibilities of more holistic and integrated approaches, where expert assumptions are added, enabling the real world’s complexity to be simplified, quantified and transparent. Here, the interdependence and trade-offs between crop yield impact on soil, water, carbon, and nutrients can be assessed, which has pushed science forward and given new insights into how causality and correlation between multiple criteria behave, even though simplified compared to real life and often mathematically highly complex.
Where have these studies been conducted and does that matter? In terms of regional differences, our analysis shows that studies with ecosystem functions and services as the entry point were primarily global in scope, followed by a focus on Asia and Europe. Many studies on practices to enhance agricultural productivity were also global, but there were also many from Sub-Saharan Africa followed by East Asia and the Pacific. China is more frequent than any other country or even continent in model-based studies. It thus appears that different regions of the world have different approaches to the analysis of trade-offs between agricultural productivity and ecosystem functions. This could reflect the food security state of these regions. In Sub-Saharan Africa and Asia, where subsistence agriculture by small farmers is dominant [98], studies focused on how to fill the yield gap (productivity). This is explained by the fact that small farmers are the most vulnerable to food insecurity [99]. The yield gap between Sub-Saharan Africa (SSA) and the rest of the world is growing: the average cereal yield in SSA was 57% of that of the world average in the 1960s but reduced to 42% of the world average by the 1990s [100]. In contrast, in areas where food production is not a limiting factor for food security such as Europe, there are more studies on ecosystem functions and services. This result does, however, only show the geography of empirical data or assessment and does not show where the researchers are active. In terms of the practical, ready-to-use tools, they can primarily be grouped according to the segment of the landscape they are applicable to (Figure 7) and not according to region, although the seven identified tools cover three different continents.
What practices are assessed that increase agricultural productivity? We can see that the scientific publications on agricultural practices had a strong focus on soil fertility improvement and different farming systems, such as agroforestry [101], as well as organic farming [102]. None of these studies were considered to encompass any practical tools ready to use for assessment of trade-offs with ecosystem services. The models reviewed also addressed different agricultural practices, from agroforestry, fisheries, organic and intensive agriculture. However, complex models have their limitations as very few practitioners can use these tools and they are rarely applied outside of research, and are not used to support policy and decision making in the real world [103,104]. More recent studies report progress with developing models for trade-off assessments between food production and other ES, but are still based on complex equations and calculations [105,106]. This shows the difficulty of using results from scientific research for practical purposes. In essence, from our 184 articles, one can conclude that little of what science has produced in terms of results is readily available to use in practice. Even though ‘practical use’ might not be the main purpose of science, there is an increasingly strong call for ‘usability’ of results from publicly funded research [107,108]. Hence, a description of societal relevance is often needed when applying for funding. Even though it is desirable that scientists make their work more relevant, the task of making results readily available for society might be overwhelming and requires other types of expertise. Middlemen, brokers and translators can play a role here, as discussed below.
Are, then, practical tools for trade-off analysis useful in addressing the yield gap and the challenge of food security? Many of the practical tools were found in the grey literature and developed by international organizations, such as FAO, IUCN, and conservation NGOs, and perhaps it is here that we could find the brokers between science and practice. The tools that these organizations developed were often focused on conservation of nature, landscape restoration and resilience. Trade-offs with agriculture were merely considered as a step in the analysis and agricultural productivity was not necessarily the decisive factor. However, practical tools are needed to support decision making about trade-offs and different management options and practices at the farm level to maximize benefits to farmers in terms of incomes and food security, while ensuring environmental sustainability [109]. Indeed, in the context of small farmers in SSA with reduced field area, poor soils and family labor, there is a trend of using more mineral fertilizer and pesticides (herbicide and insecticide) to reduce the yield gap that results in environmental degradation and increased poverty [100]. Practical tools are also needed to support planning, decision and policy making at landscape and basin scale to ensure the sustainable development of these areas so that they can support farming by local communities while generating ecosystem services demanded downstream by growing urban centers. This includes ES related to regulation and provision of water and biodiversity, as well as provision of recreation and cultural experiences [71]. Tools for adaptation to climate change in the agricultural sector are also under development [110].
What is the use and development potential of our seven identified tools for trade-off analysis? Simple quantitative measures and indices, such as the Water Footprint and the Healthy Farm Index, are useful for rapid assessments at basin and farm level, respectively, to generate a snapshot of the situation. Based on this, more sophisticated quantitative models for trade-off analysis could be employed, or more qualitative approaches, depending on the context. As already mentioned above, practical and participatory tools, such as ROAM, TESSA, SHARP and role-playing games, are useful for negotiating and resolving conflicts in the landscape between different landscape actors related to trade-offs, an issue that numerical models may not be able to address. Figure 7 illustrates where in the landscape the different tools could be applied and for what purpose. However, to offer a solid and practical tool to assess the critical trade-off between agricultural productivity and ecosystem functions, these tools should be further tested and iteratively developed and adapted to different contexts. Our ongoing case study on parklands in Burkina Faso indicates that participatory tools, such as ROAM, could be used or tested by the innovation platforms (discussion fora that include practitioners, farmers, NGOs, local policymakers, extension services and scientists) set up at local level to select the most relevant and feasible restoration intervention and identify priority areas for restoration in the parklands. In addition, TESSA could be useful for the innovation platforms to draw the attention of policy and decision makers to the trade-offs between agricultural productivity and ecosystem functions and services in parkland management by giving a monetary value to each ES. The use of these tools could then lead to better informed land-use planning and the adoption of environmentally sustainable practices that also increase food production and improve livelihoods. The SDGs provides the most appropriate framework for assessing trade-offs between SDG 2 on Zero Hunger and its target 2.3 on doubling agricultural productivity and incomes of small-scale food producers by 2030 and all ecosystem targets under SDG 15 on Life on Land, target 6.6 on water-related ecosystems under SDG 6 on Water and Sanitation, as well as target 13.1 on strengthening resilience and adaptive capacity to climate-related hazards and natural disasters under SDG 13 on Climate Action.
Finally, could science support the development of more or better tools? As we have described above, there seems to be a place for everything—complex models, field trials, assessment of practices and impacts on ecosystem functions and services. Through validation, system and nexus approaches, results from a variety of disciplines do enhance the understanding of agriculture productivity and ecosystem functions. Our review and analysis show that the step needed for the findings from these multiple areas of research to be useful in trade-off analysis, is that the translation or usability of scientific results have taken place through brokers in development organizations that develop usable tools to support the design of development interventions that balance farming and livelihood needs with sustainable management of natural resources (i.e., soils, water, and ecosystems). One way forward in this area could be to promote closer and constructive collaboration between practitioners, development organizations, NGOs and scientists, where the expertise of each actor group is acknowledged together with their interdependencies, which could form the basis for co-creation and co-development of practical tools that meet farmers’ needs and could inform decision making.

5. Conclusions

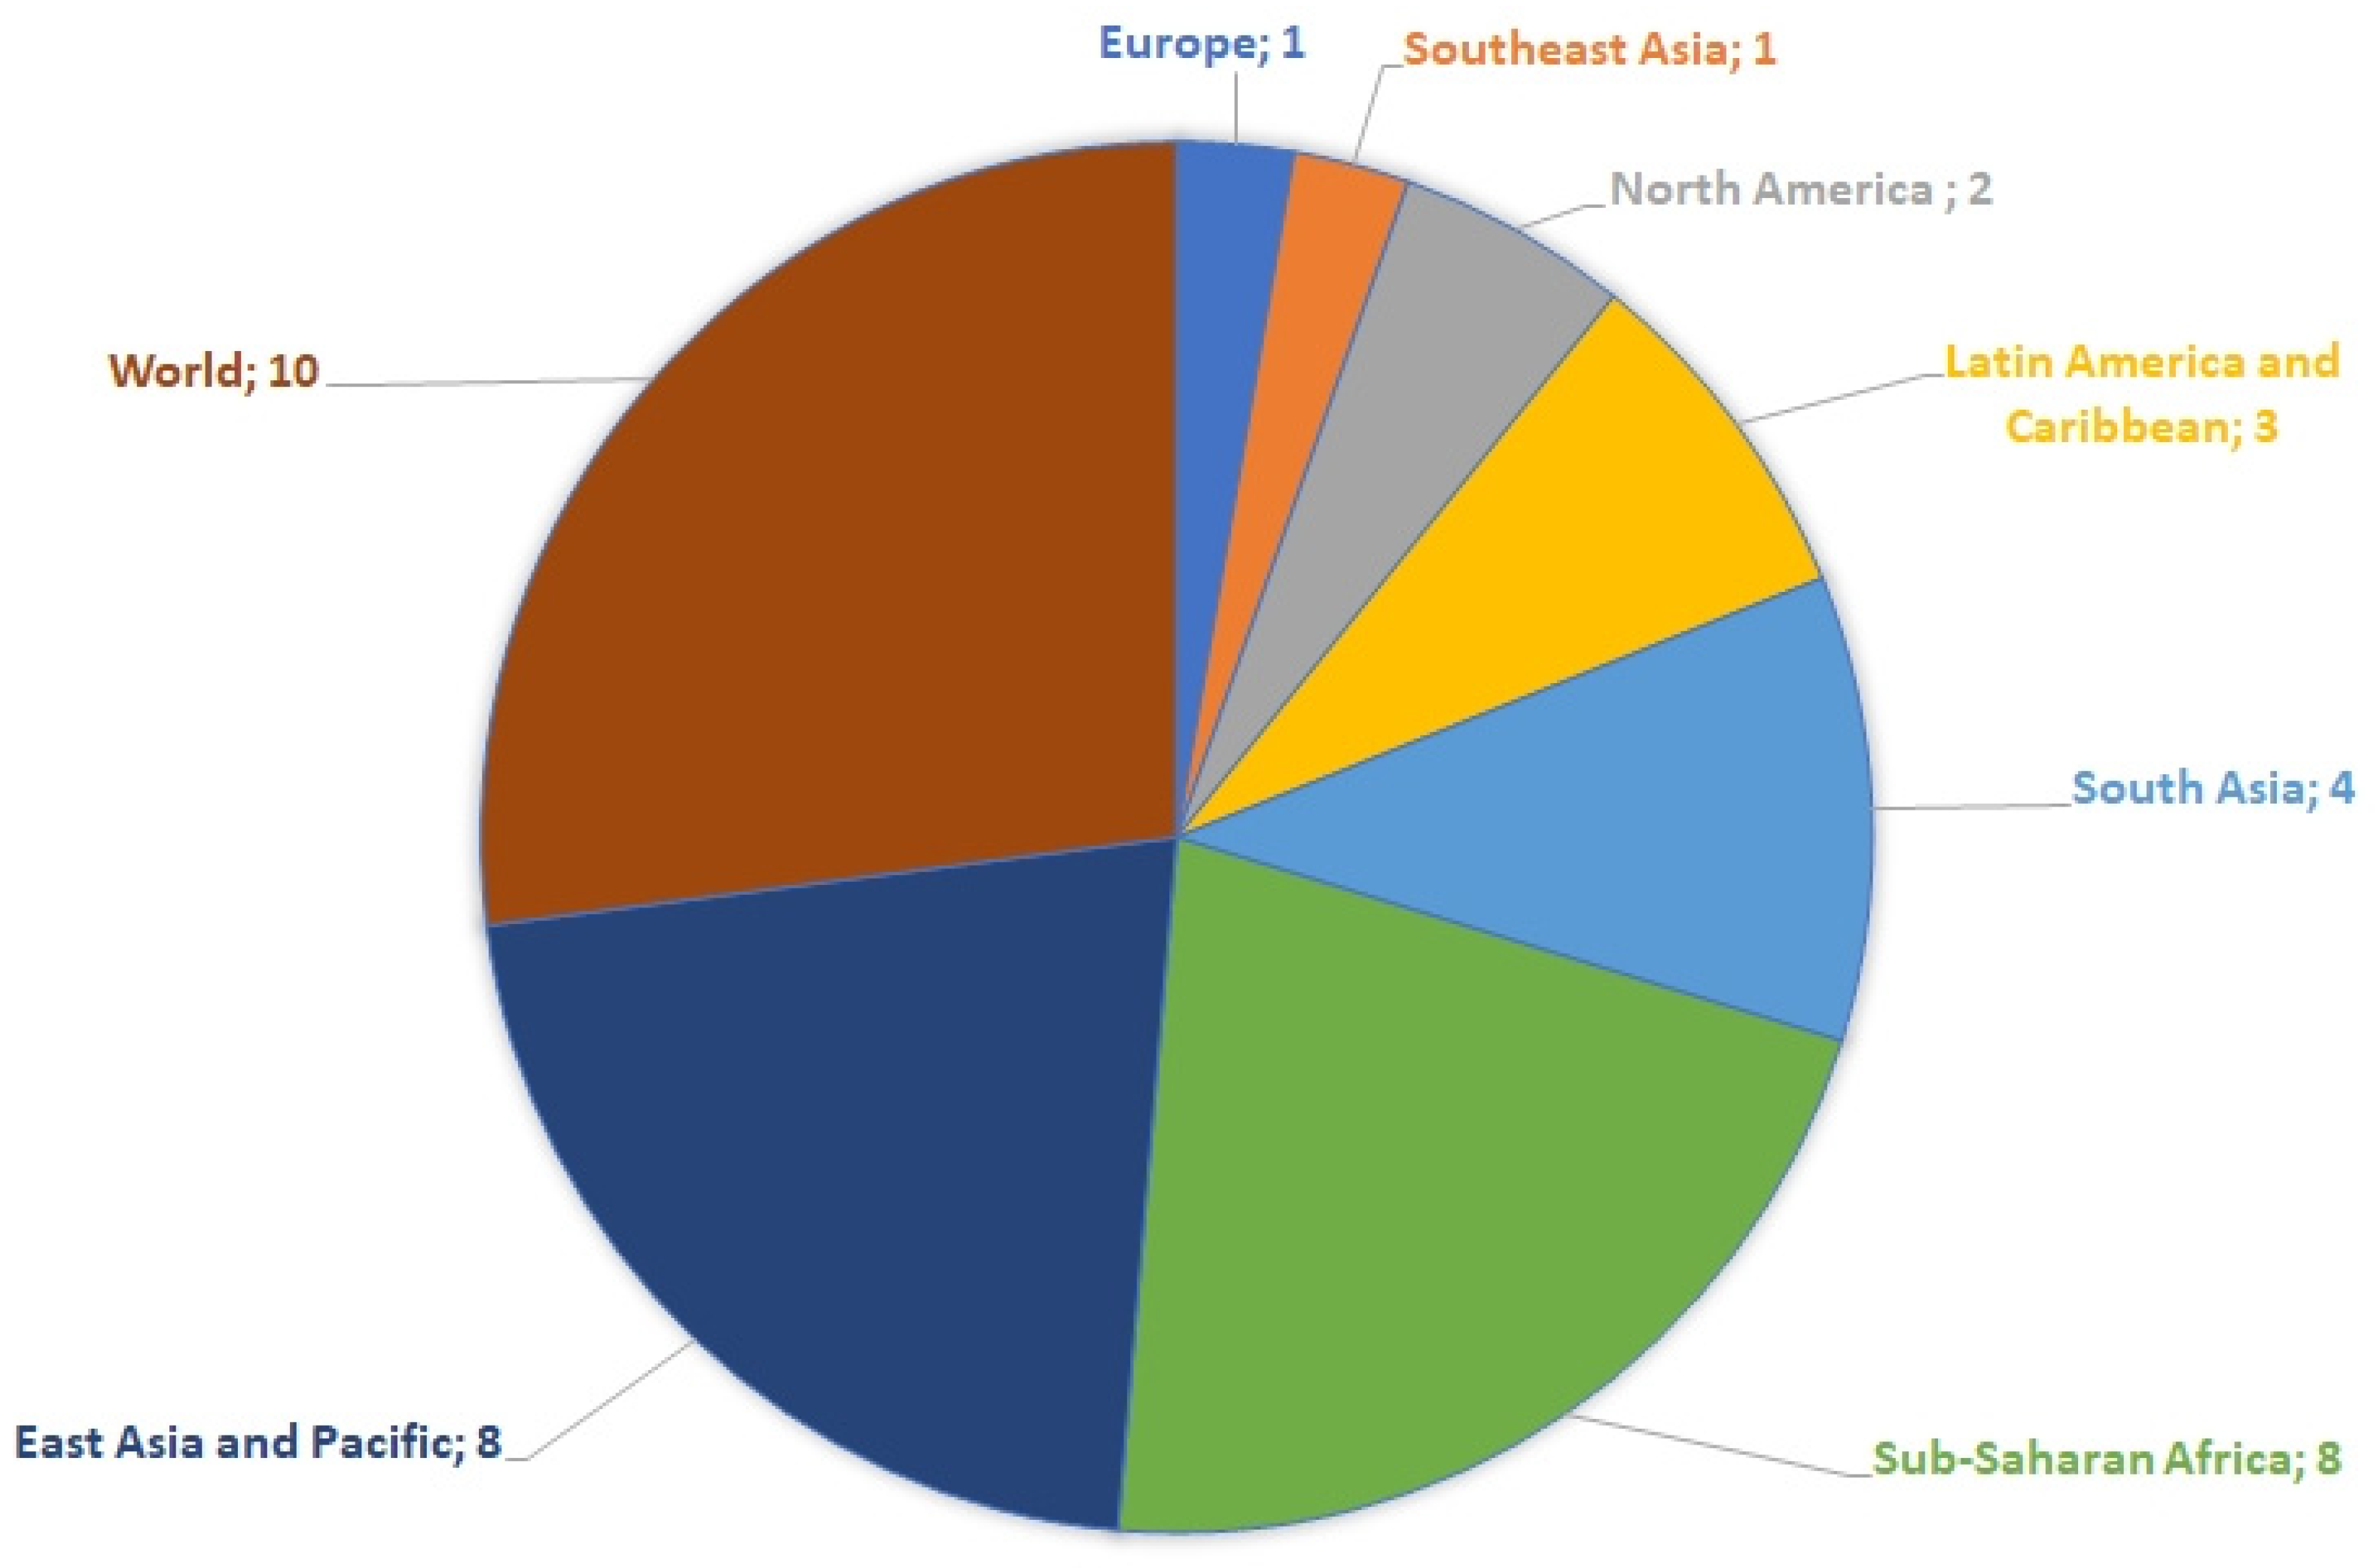
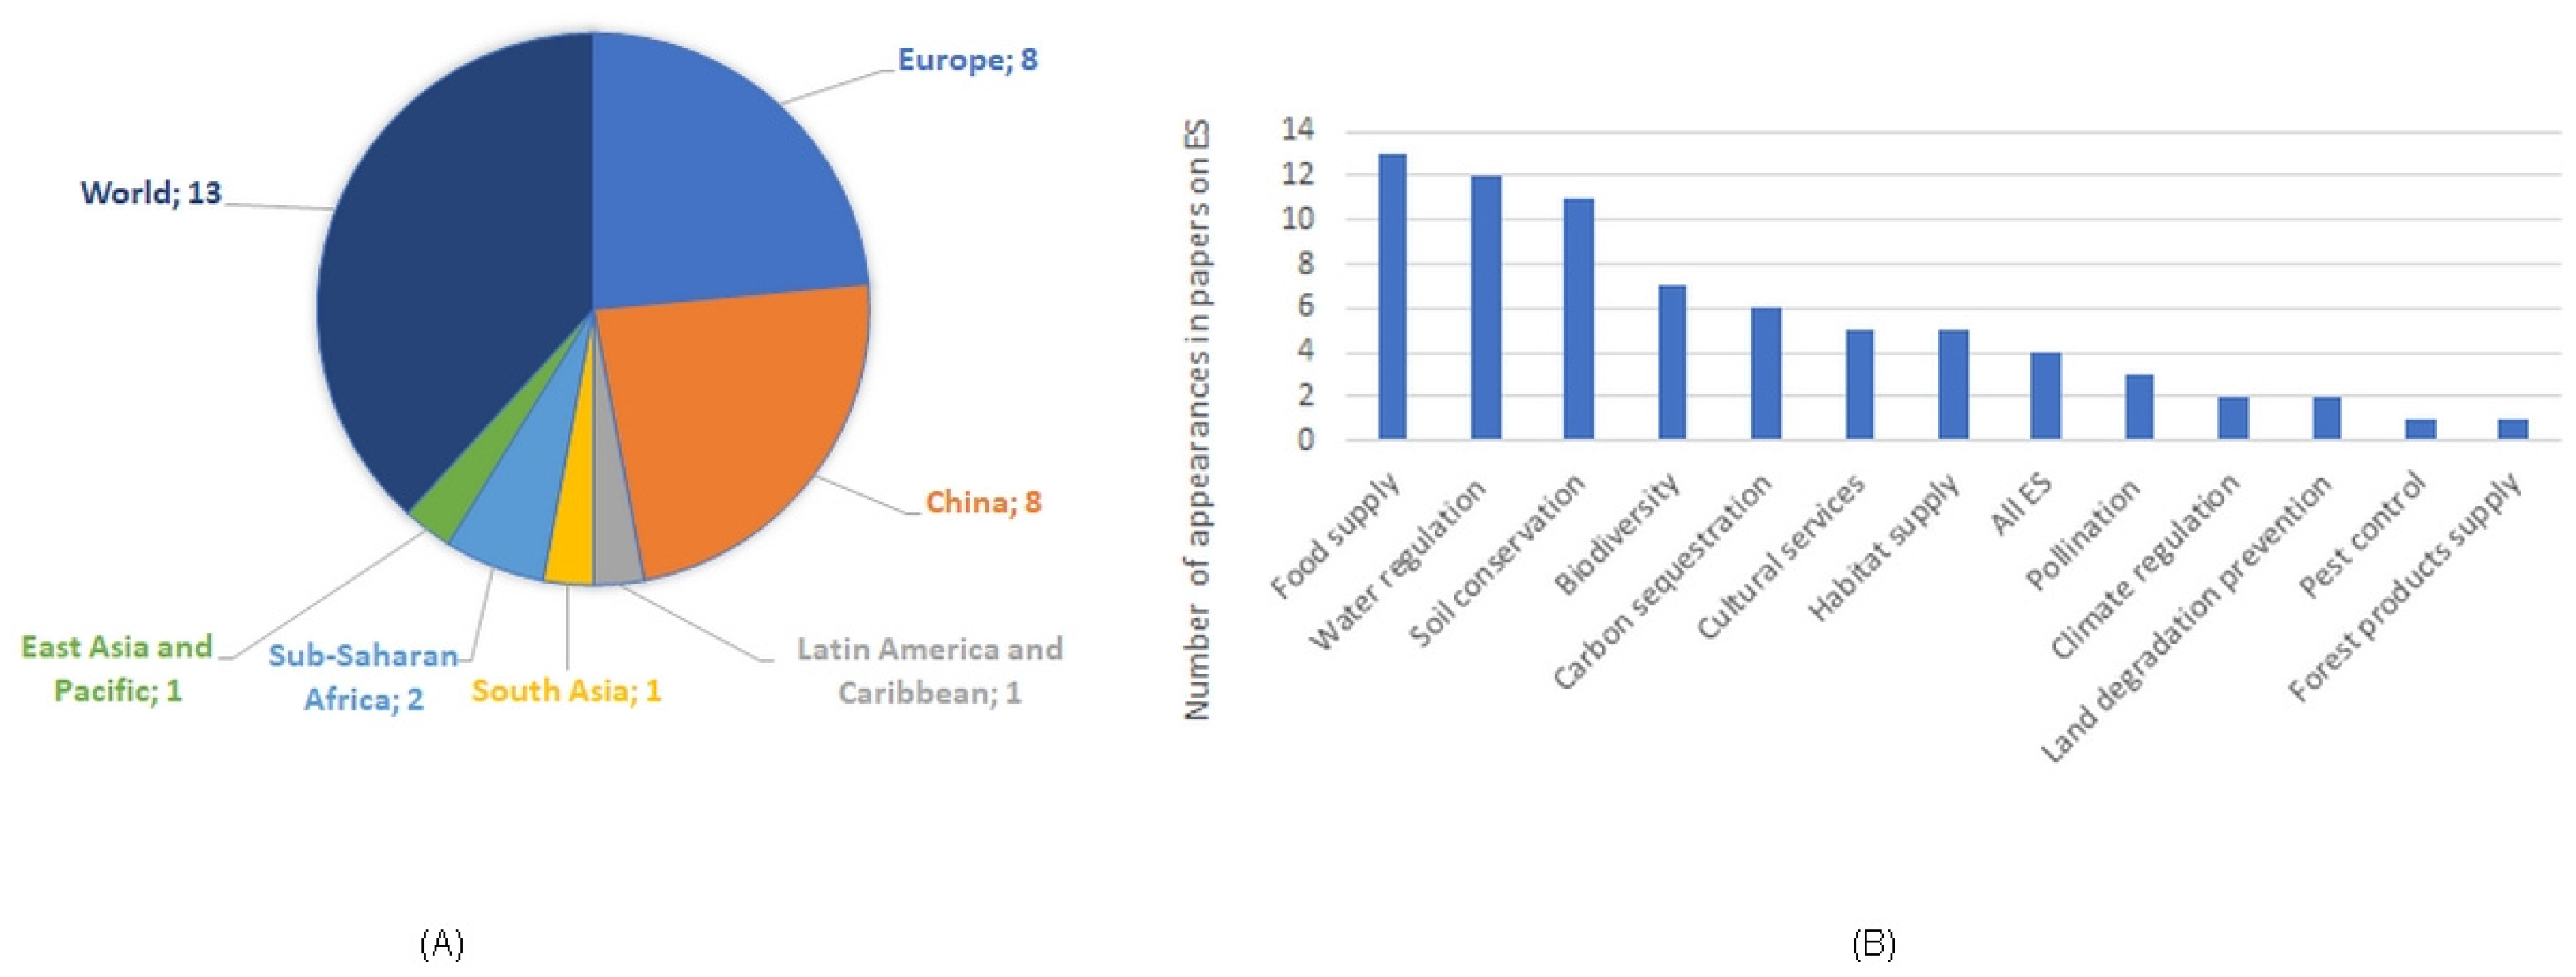
  • Provisioning ecosystem services related to water and food production are most commonly studied in articles on trade-offs between agricultural productivity and ecosystems functions. Although many studies were global in scope, the approach to analyzing and assessing trade-offs appears to vary geographically, with a stronger focus on ecosystem services in Europe and China, including an extensive use of models in China, while a focus on practices to increase yields was most common in Africa. Improved interregional knowledge exchange and collaboration is therefore recommended to advance the analysis of trade-offs between agricultural productivity and ecosystem functions and services.
  • Many tools focus on just one or a bundle of ecosystem services, such as water-related ES, biodiversity and climate regulation, and are designed for different types of land use and ecosystems and are applicable at different scales. Therefore, tools need to be selected, adapted and further developed, based on the landscape and socio-economic context, priority ES and site characteristics.
  • Practical tools for trade-off analysis are primarily found in the grey literature and have been developed and applied by development organizations with support from science. Closer collaboration between practitioners, development organizations, NGOs and scientists is suggested to foster co-development of tools useful to assess trade-offs and for identifying sustainable strategies for closing the yield gap, increasing productivity and for balancing ecosystem services included in the SDG framework.
  • One way forward could be to establish innovation platforms that link different actors and organizations—practitioners, scientists, development organizations and extensionists, as has been exemplified from our research in Burkina Faso. In these settings, testing and combining tools such as ROAM and TESSA to restore parklands and to consider trade-offs between productivity and ecosystem functions could prove fruitful.

Supplementary Materials

The following supporting information can be downloaded at: https://www.mdpi.com/article/10.3390/land12071329/s1, Section S1: Detailed information about the literature search and review. Section S2: References 2nd screening and articles categories (A = the description of a tool, B = a practice, C = an ecosystem function or service, D = application of a model and E = irrelevant articles). Table S1: Main keywords applied to the PICO approach with synonyms and related terms. Table S2: shows the different proximity operator and field investigated according to the databases. Figure S1: Detailed chart flow of each step of the review.

Author Contributions

Conceptualization, J.S., A.T., H.R.B. and M.O.; methodology, J.S., A.T., H.R.B., D.M. and M.O.; software, D.M.; validation, J.S., A.T., H.R.B. and M.O.; formal analysis, J.S., A.T., H.R.B. and M.O.; investigation, J.S., A.T., H.R.B. and M.O.; resources J.S. and M.O.; data curation, D.M.; writing—original draft preparation, J.S., A.T., H.R.B. and M.O.; writing—review and editing, J.S., A.T., H.R.B. and M.O.; visualization, J.S., A.T., H.R.B. and M.O.; project administration, J.S. and M.O.; funding acquisition, M.O. All authors have read and agreed to the published version of the manuscript.

Funding

The study was funded by the AgriFoSe programme (see https://www.slu.se/en/collaboration/international/slu-global/agrifose/ (accessed on 15 March 2022)).

Data Availability Statement

No new data were created or analyzed in this study. Data sharing is not applicable to this article.

Conflicts of Interest

The authors declare no conflict of interest.

References

  1. Fischer, R.A.; Connor, D.J. Issues for cropping and agricultural science in the next 20 years. Field Crops Res. 2018, 222, 121–142. [Google Scholar] [CrossRef]
  2. Bommarco, R.; Vico, G.; Hallin, S. Exploiting ecosystem services in agriculture for increased food security. Glob. Food Sec. 2018, 17, 57–63. [Google Scholar] [CrossRef]
  3. Millennium Ecosystem Assessment. Ecosystems and Human Well-Being: Current State and Trends: Findings of the Conditions and Trends Working Group; Hassan, R., Scholes, R., Ash, N., Eds.; Island Press: Washington, DC, USA, 2005. [Google Scholar]
  4. Rong, L.; Gong, K.; Duan, F.; Li, S.; Zhao, M.; He, J.; Zhou, W.-B.; Yu, Q. Yield gap and resource utilization efficiency of three major food crops in the world—A review. J. Integr. Agric. 2021, 20, 349–362. [Google Scholar] [CrossRef]
  5. Nkonya, E.; Anderson, W.; Kato, E.; Koo, J.; Mirzabaev, A.; von Braun, J.; Meyer, S. Global Cost of Land Degradation; Nkonya, E., Mirzabaev, A., von Braun, J., Eds.; Springer: Berlin/Heidelberg, Germany, 2015. [Google Scholar]
  6. Simelton, E.; Ostwald, M. Multifunctional Land Uses in Africa; Routledge: Oxon, UK, 2020; Available online: www.routledge.com/books/series/ECEFA/ (accessed on 21 October 2021).
  7. Hirwa, H.; Zhang, Q.; Qiao, Y.; Peng, Y.; Leng, P.; Tian, C.; Khasanov, S.; Li, F.; Kayiranga, A.; Muhirwa, F.; et al. Insights on Water and Climate Change in the Greater Horn of Africa: Connecting Virtual Water and Water-Energy-Food-Biodiversity-Health Nexus. Sustainability 2021, 13, 6483. [Google Scholar] [CrossRef]
  8. Subedi, R.; Karki, M.; Panday, D. Food System and Water–Energy–Biodiversity Nexus in Nepal: A Review. Agronomy 2020, 10, 1129. [Google Scholar] [CrossRef]
  9. Van Vuuren, D.P.; Bijl, D.L.; Bogaart, P.; Stehfest, E.; Biemans, H.; Dekker, S.C.; Doelman, J.C.; Gernaat, D.E.; Harmsen, M. Integrated scenarios to support analysis of the food–energy–water nexus. Nat. Sustain. 2019, 2, 1132–1141. [Google Scholar] [CrossRef]
  10. Best, A.; Langsdorf, S.; Duin, L.; Araujo, A. Assessment of Resource Nexus-Related Challenges and Opportunities in the Context of the European Green Deal. Background Report for the EEA Briefing “Applying a ‘Resource nexus’ Lens to Policy: Opportunities for Increasing Coherence”; Coherent Digital, LLC: Berlin, Germany, 2021. [Google Scholar]
  11. OECD. Towards Sustainable Land Use: Aligning Biodiversity, Climate and Food Policies; OECD Publishing: Paris, France, 2020. [Google Scholar]
  12. Pradhan, P.; Costa, L.; Rybski, D.; Lucht, W.; Kropp, J.P. A Systematic Study of Sustainable Development Goal (SDG) Interactions. Earths Future 2017, 5, 1169–1179. [Google Scholar] [CrossRef] [Green Version]
  13. Sentelhas, P.C.; Battisti, R.; Câmara, G.M.S.; Farias, J.R.B.; Hampf, A.C.; Nendel, C. The soybean yield gap in Brazil—Magnitude, causes and possible solutions for sustainable production. J. Agric. Sci. 2015, 153, 1394–1411. [Google Scholar] [CrossRef] [Green Version]
  14. Silva, J.V.; Ramisch, J.J. Whose gap counts? The role of yield gap analysis within a development-oriented agronomy. Exp. Agric. 2019, 55, 311–338. [Google Scholar] [CrossRef] [Green Version]
  15. Shamseer, L.; Moher, D.; Clarke, M.; Ghersi, D.; Liberati, A.; Petticrew, M.; Shekelle, P.; Stewart, L.A.; PRISMA-P Group. Preferred reporting items for systematic review and meta-analysis protocols (prisma-p) 2015, Elaboration and explanation. BMJ 2015, 349, g7647. [Google Scholar] [CrossRef] [Green Version]
  16. Ouzzani, M.; Hammady, H.; Fedorowicz, Z.; Elmagarmid, A. Rayyan—A web and mobile app for systematic reviews. Syst. Rev. 2016, 5, 210. [Google Scholar] [CrossRef] [PubMed] [Green Version]
  17. Tsafnat, G.; Glasziou, P.; Choong, M.K.; Dunn, A.; Galgani, F.; Coiera, E. Systematic review automation technologies. Syst. Rev. 2014, 3, 74. [Google Scholar] [CrossRef] [Green Version]
  18. Bekchanov, M.; Mirzabaev, A. Circular economy of composting in Sri Lanka: Opportunities and challenges for reducing waste related pollution and improving soil health. J. Clean. Prod. 2018, 202, 1107–1119. [Google Scholar] [CrossRef]
  19. Lauriano-Barajas, J.; Vega-Frutis, R. Infectivity and effectivity of commercial and native arbuscular mycorrhizal biofertilizers in seedlings of maize (Zea mays). Bot. Sci. 2018, 96, 395–404. [Google Scholar] [CrossRef] [Green Version]
  20. Shi, W.; Zhao, H.Y.; Chen, Y.; Wang, J.S.; Han, B.; Li, C.P.; Lu, J.Y.; Zhang, L.M. Organic manure rather than phosphorus fertilization primarily determined asymbiotic nitrogen fixation rate and the stability of diazotrophic community in an upland red soil. Agric. Ecosyst. Environ. 2021, 319, 107535. [Google Scholar] [CrossRef]
  21. Stavi, I. Biochar use in forestry and tree-based agro-ecosystems for increasing climate change mitigation and adaptation. Int. J. Sustain. Dev. World Ecol. 2013, 20, 166–181. [Google Scholar] [CrossRef]
  22. Tisserant, A.; Cherubini, F. Potentials, limitations, co-benefits, and trade-offs of biochar applications to soils for climate change mitigation. Land 2019, 8, 179. [Google Scholar] [CrossRef] [Green Version]
  23. Zhang, X.; Fang, Q.; Zhang, T.; Ma, W.; Velthof, G.L.; Hou, Y.; Oenema, O.; Zhang, F. Benefits and trade-offs of replacing synthetic fertilizers by animal manures in crop production in China: A meta-analysis. Glob. Change Biol. 2020, 26, 888–900. [Google Scholar] [CrossRef]
  24. Dixon, J.L.; Stringer, L.C.; Challinor, A.J. Farming system evolution and adaptive capacity: Insights for adaptation support. Resources 2014, 3, 182–214. [Google Scholar] [CrossRef] [Green Version]
  25. Iverson, A.L.; Marín, L.E.; Ennis, K.K.; Gonthier, D.J.; Connor-Barrie, B.T.; Remfert, J.L.; Cardinale, B.J.; Perfecto, I. Do polycultures promote win-wins or trade-offs in agricultural ecosystem services? A meta-analysis. J. Appl. Ecol. 2014, 51, 1593–1602. [Google Scholar] [CrossRef]
  26. Leippert, F.; Darmaun, M.; Bernoux, M.; Mpheshea, M. The Potential of Agroecology to Build Climate-Resilient Livelihoods and Food Systems; Food and Agriculture Organization of the United Nations FAO and Biovision: Rome, Italy, 2020. [Google Scholar]
  27. Nassary, E.K.; Baijukya, F.; Ndakidemi, P.A. Sustainable intensification of grain legumes optimizes food security on smallholder farms in Sub-Saharan Africa-A review. Int. J. Agric. Biol. 2020, 23, 25–41. [Google Scholar]
  28. Rasul, G. Ecosystem services and agricultural land-use practices: A case study of the Chittagong Hill Tracts of Bangladesh. Sustain. Sci. Pract. Policy 2009, 5, 15–27. [Google Scholar] [CrossRef]
  29. Lorenz, K. Organic urban agriculture. Soil Sci. 2015, 180, 146–153. [Google Scholar] [CrossRef] [Green Version]
  30. Sandhu, H.S.; Wratten, S.D.; Cullen, R.; Case, B. The future of farming: The value of ecosystem services in conventional and organic arable land. An experimental approach. Ecol. Econ. 2008, 64, 835–848. [Google Scholar] [CrossRef]
  31. Smith, O.M.; Cohen, A.L.; Rieser, C.J.; Davis, A.G.; Taylor, J.M.; Adesanya, A.W.; Jones, M.S.; Meier, A.R.; Reganold, J.P.; Orpet, R.J.; et al. Organic Farming Provides Reliable Environmental Benefits but Increases Variability in Crop Yields: A Global Meta-Analysis. Front. Sustain. Food Syst. 2019, 3, 82. [Google Scholar] [CrossRef] [Green Version]
  32. An, N.; Fan, M.; Zhang, F.; Christie, P.; Yang, J.; Huang, J.; Guo, S.; Shi, X.; Tang, Q.; Peng, J.; et al. Exploiting co-benefits of increased rice production and reduced greenhouse gas emission through optimized crop and soil management. PLoS ONE 2015, 10, e0140023. [Google Scholar] [CrossRef] [PubMed]
  33. Pauli, N.; Donough, C.; Oberthür, T.; Cock, J.; Verdooren, R.; Rahmadsyah; Abdurrohim, G.; Indrasuara, K.; Lubis, A.; Dolong, T.; et al. Changes in soil quality indicators under oil palm plantations following application of “best management practices” in a four-year field trial. Agric. Ecosyst. Environ. 2014, 195, 98–111. [Google Scholar] [CrossRef]
  34. Piñeiro, V.; Arias, J.; Dürr, J.; Elverdin, P.; Ibáñez, A.M.; Kinengyere, A.; Opazo, C.M.; Owoo, N.; Page, J.R.; Prager, S.D.; et al. A scoping review on incentives for adoption of sustainable agricultural practices and their outcomes. Nat. Sustain. 2020, 3, 809–820. [Google Scholar] [CrossRef]
  35. Kirkegaard, J.A.; Conyers, M.K.; Hunt, J.R.; Kirkby, C.A.; Watt, M.; Rebetzke, G.J. Sense and nonsense in conservation agriculture: Principles, pragmatism and productivity in Australian mixed farming systems. Agric. Ecosyst. Environ. 2014, 187, 133–145. [Google Scholar] [CrossRef]
  36. Ngigi, S.N.; Rockström, J.; Savenije, H.H.G. Assessment of rainwater retention in agricultural land and crop yield increase due to conservation tillage in Ewaso Ng’iro river basin, Kenya. Phys. Chem. Earth 2006, 31, 910–918. [Google Scholar] [CrossRef]
  37. Speratti, A.; Turmel, M.S.; Calegari, A.; Araujo, C.F.; Violic, A.; Wall, P.; Govaerts, B. Conservation agriculture in Latin America. In Conservation Agriculture; Springer International Publishing: Cham, Switzerland, 2015; pp. 391–415. [Google Scholar]
  38. Albert, C.; Galler, C.; Hermes, J.; Neuendorf, F.; Von Haaren, C.; Lovett, A. Applying ecosystem services indicators in landscape planning and management: The ES-in-Planning framework. Ecol. Indic. 2016, 61, 100–113. [Google Scholar] [CrossRef]
  39. Cao, Y.; Li, G.; Tian, Y.; Fang, X.; Li, Y.; Tan, Y. Linking ecosystem services trade-offs, bundles and hotspot identification with cropland management in the coastal Hangzhou Bay area of China. Land Use Policy 2020, 97, 104689. [Google Scholar] [CrossRef]
  40. Di Maggio, R.; Campobello, D.; Tavecchia, G.; Sarà, M. Habitat- and density-dependent demography of a colonial raptor in Mediterranean agro-ecosystems. Biol. Conserv. 2016, 193, 116–123. [Google Scholar] [CrossRef] [Green Version]
  41. Marinaro, S.; Grau, H.R.; Gasparri, N.I.; Kuemmerle, T.; Baumann, M. Differences in production, carbon stocks and biodiversity outcomes of land tenure regimes in the Argentine Dry Chaco. Environ. Res. Lett. 2017, 12, 045003. [Google Scholar] [CrossRef]
  42. D’Ottavio, P.; Francioni, M.; Trozzo, L.; Sedić, E.; Budimir, K.; Avanzolini, P.; Trombetta, M.F.; Porqueddu, C.; Santilocchi, R.; Toderi, M. Trends and approaches in the analysis of ecosystem services provided by grazing systems: A review. Grass Forage Sci. 2017, 73, 15–25. [Google Scholar] [CrossRef]
  43. Hu, Y.; Peng, J.; Liu, Y.; Tian, L. Integrating ecosystem services trade-offs with paddy land-to-dry land decisions: A scenario approach in Erhai Lake Basin, southwest China. Sci. Total Environ. 2018, 625, 849–860. [Google Scholar] [CrossRef]
  44. Luo, Y.; Lü, Y.; Fu, B.; Zhang, Q.; Li, T.; Hu, W.; Comber, A. Half century change of interactions among ecosystem services driven by ecological restoration: Quantification and policy implications at a watershed scale in the Chinese Loess Plateau. Sci. Total Environ. 2019, 651, 2546–2557. [Google Scholar] [CrossRef] [PubMed] [Green Version]
  45. Manik, S.M.N.; Pengilley, G.; Dean, G.; Field, B.; Shabala, S.; Zhou, M. Soil and crop management practices to minimize the impact of waterlogging on crop productivity. Front. Plant Sci. 2019, 10, 140. [Google Scholar] [CrossRef] [Green Version]
  46. Qiu, M.; Van de Voorde, T.; Li, T.; Yuan, C.; Yin, G. Spatiotemporal variation of agroecosystem service trade-offs and its driving factors across different climate zones. Ecol. Indic. 2021, 130, 108154. [Google Scholar] [CrossRef]
  47. Weninger, T.; Scheper, S.; Lackóová, L.; Kitzler, B.; Gartner, K.; King, N.W.; Cornelis, W.M.; Strauss, P.; Michel, K. Ecosystem services of tree windbreaks in rural landscapes—A systematic review. Environ. Res. Lett. 2021, 16, 103002. [Google Scholar] [CrossRef]
  48. Chen, T.; Feng, Z.; Zhao, H.; Wu, K. Identification of ecosystem service bundles and driving factors in Beijing and its surrounding areas. Sci. Total Environ. 2020, 711, 134687. [Google Scholar] [CrossRef]
  49. Coutinho, J.G.d.E.; Garibaldi, L.A.; Viana, B.F. The influence of local and landscape scale on single response traits in bees: A meta-analysis. Agric. Ecosyst. Environ. 2018, 256, 61–73. [Google Scholar] [CrossRef]
  50. Smith, F.P.; Gorddard, R.; House, A.P.N.; McIntyre, S.; Prober, S.M. Biodiversity and agriculture: Production frontiers as a framework for exploring trade-offs and evaluating policy. Environ. Sci. Policy 2012, 23, 85–94. [Google Scholar] [CrossRef]
  51. Gockowski, J.; Tchatat, M.; Jean-Paul, D.; Hietet, G.; Fouda, T. An empirical analysis of the biodiversity and economic returns to cocoa agroforests in southern cameroon. J. Sustain. For. 2010, 29, 638–670. [Google Scholar] [CrossRef]
  52. Lyu, R.; Clarke, K.C.; Zhang, J.; Feng, J.; Jia, X.; Li, J. Spatial correlations among ecosystem services and their socio-ecological driving factors: A case study in the city belt along the Yellow River in Ningxia, China. Appl. Geogr. 2019, 108, 64–73. [Google Scholar] [CrossRef] [Green Version]
  53. Malinga, R. Ecosystem Services in Agricultural Landscapes: A Study on Farming and Farmers in South Africa and Sweden. Ph.D. Thesis, Stockholm University, Stockholm, Sweden, 2016. [Google Scholar]
  54. Tallis, H.; Polasky, S. Mapping and valuing ecosystem services as an approach for conservation and natural-resource management. Ann. N. Y. Acad. Sci. 2009, 1162, 265–283. [Google Scholar] [CrossRef]
  55. Balbi, S.; del Prado, A.; Gallejones, P.; Geevan, C.P.; Pardo, G.; Pérez-Miñana, E.; Manrique, R.; Hernandez-Santiago, C.; Villa, F. Modeling trade-offs among ecosystem services in agricultural production systems. Environ. Model. Softw. 2015, 72, 314–326. [Google Scholar] [CrossRef] [Green Version]
  56. Hou, Y.; Zhao, W.; Liu, Y.; Yang, S.; Hu, X.; Cherubini, F. Relationships of multiple landscape services and their influencing factors on the Qinghai–Tibet Plateau. Landsc. Ecol. 2021, 36, 1987–2005. [Google Scholar] [CrossRef]
  57. Li, P.; Agusdinata, D.B.; Suditha, P.H.; Zhang, Y. Ecosystem services and trade-offs: Implications for land dynamics and sustainable livelihoods in Northern Lombok, Indonesia. Environ. Dev. Sustain. 2021, 23, 4321–4341. [Google Scholar] [CrossRef]
  58. Dai, E.; Yin, L.; Wang, Y.; Ma, L.; Tong, M. Quantitative assessment of the relative impacts of land use and climate change on the key ecosystem services in the Hengduan Mountain Region, China. Sustainability 2020, 12, 4100. [Google Scholar] [CrossRef]
  59. Feng, Q.; Zhao, W.; Hu, X.; Liu, Y.; Daryanto, S.; Cherubini, F. Trading-off ecosystem services for better ecological restoration: A case study in the Loess Plateau of China. J. Clean. Prod. 2020, 257, 120469. [Google Scholar] [CrossRef]
  60. King, E.; Cavender-Bares, J.; Balvanera, P.; Mwampamba, T.H.; Polasky, S. Trade-offs in ecosystem services and varying stakeholder preferences: Evaluating conflicts, obstacles, and opportunities. Ecol. Soc. 2015, 20, 25. [Google Scholar] [CrossRef] [Green Version]
  61. Crossman, N.D.; Burkhard, B.; Nedkov, S.; Willemen, L.; Petz, K.; Palomo, I.; Drakou, E.G.; Martin-Lopez, B.; McPhearson, T.; Boyanova, K.; et al. A blueprint for mapping and modelling ecosystem services. Ecosyst. Serv. 2013, 4, 4–14. [Google Scholar] [CrossRef]
  62. Shepherd, K.D.; Shepherd, G.; Walsh, M.G. Land health surveillance and response: A framework for evidence-informed land management. Agric. Syst. 2015, 132, 93–106. [Google Scholar] [CrossRef]
  63. Kanter, D.R.; Musumba, M.; Wood, S.L.R.; Palm, C.; Antle, J.; Balvanera, P.; Dale, V.H.; Havlik, P.; Kline, K.L.; Scholes, R.J.; et al. Evaluating agricultural trade-offs in the age of sustainable development. Agric. Syst. 2018, 163, 73–88. [Google Scholar] [CrossRef]
  64. Zhen, L.; Routray, J.K. Operational Indicators for Measuring Agricultural Sustainability in Developing Countries. Environ. Manag. 2003, 32, 34–46. [Google Scholar] [CrossRef] [PubMed] [Green Version]
  65. Sheppard, D.J.; Moehrenschlager, A.; Mcpherson, J.M.; Mason, J.J. Ten years of adaptive community-governed conservation: Evaluating biodiversity protection and poverty alleviation in a West African hippopotamus reserve. Environ. Conserv. 2010, 37, 270–282. [Google Scholar] [CrossRef]
  66. Takahashi, T.; Harris, P.; Blackwell, M.S.A.; Cardenas, L.M.; Collins, A.L.; Dungait, J.A.J.; Hawkins, J.; Misselbrook, T.; McAuliffe, G.; McFadzean, J.; et al. Roles of instrumented farm-scale trials in trade-off assessments of pasture-based ruminant production systems. Animal 2018, 12, 1766–1776. [Google Scholar] [CrossRef] [Green Version]
  67. Groot, J.C.J.; Rossing, W.A.J.; Stobbelaar, D.J.; Renting, H.; Van Ittersum, M.K. Supporting discussions on land use: A design instrument that integrates nature conservation, economic performance and landscape quality in agricultural areas. In Changing European Farming Systems for a Better Future: New Visions for Rural Areas; Langeveld, H., Röling, N., Eds.; Wageningen Academic Publishers: Wageningen, The Netherlands, 2006; Available online: https://www.researchgate.net/publication/40114671 (accessed on 21 October 2021).
  68. Trodahl, M.I.; Jackson, B.M.; Deslippe, J.R.; Metherell, A.K. Investigating trade-offs between water quality and agricultural productivity using the Land Utilisation and Capability Indicator (LUCI)–A New Zealand application. Ecosyst. Serv. 2017, 26, 388–399. [Google Scholar] [CrossRef]
  69. Robinson, B.E.; Zheng, H.; Peng, W. Disaggregating livelihood dependence on ecosystem services to inform land management. Ecosyst. Serv. 2019, 36, 100902. [Google Scholar] [CrossRef]
  70. Ng’ang’a, S.K.; Miller, V.; Girvetz, E. Is investment in Climate-Smart-agricultural practices the option for the future? Cost and benefit analysis evidence from Ghana. Heliyon 2021, 7, e06653. [Google Scholar] [CrossRef]
  71. Tenge, A.J.; Okoba, B.O.; Sterk, G. Participatory soil and water conservation planning using a financial analysis tool in the West Usambara highlands of Tanzania. Land Degrad. Dev. 2007, 18, 321–337. [Google Scholar] [CrossRef]
  72. Hajkowicz, S.; Collins, K.; Cattaneo, A. Review of agri-environment indexes and stewardship payments. Environ. Manag. 2009, 43, 221–236. [Google Scholar] [CrossRef]
  73. Kearney, S.P.; Fonte, S.J.; García, E.; Siles, P.; Chan, K.M.A.; Smukler, S.M. Evaluating ecosystem service trade-offs and synergies from slash-and-mulch agroforestry systems in El Salvador. Ecol. Indic. 2019, 105, 264–278. [Google Scholar] [CrossRef]
  74. Scholz, M.; Uzomah, V.C.; Almuktar, S.A.; Radet-Taligot, J. Selecting sustainable drainage structures based on ecosystem service variables estimated by different stakeholder groups. Water 2013, 5, 1741–1759. [Google Scholar] [CrossRef] [Green Version]
  75. FAO. Mainstreaming Ecosystem Services and Biodiversity in Agricultural Production and Management in East Africa: Technical Guidance Document. 2016. Available online: www.fao.org/publications (accessed on 21 October 2021).
  76. Ranganathan, J.; Raudsepp-Hearne, C.; Lucas, N.; Irwin, F.; Zurek, M.; Bennett, K.; Ash, N.; West, P. Ecosystem Services a Guide for Decision Makers the Decision: A Fictional Story about a Community Facing Ecosystem Change Plus; World Resources Institute: Washington, DC, USA, 2008. [Google Scholar]
  77. Sanon, S.; Hein, T.; Douven, W.; Winkler, P. Quantifying ecosystem service trade-offs: The case of an urban floodplain in Vienna, Austria. J. Environ. Manag. 2012, 111, 159–172. [Google Scholar] [CrossRef] [PubMed]
  78. Schuler, M.S.; Cañedo-Argüelles, M.; Hintz, W.D.; Dyack, B.; Birk, S.; Relyea, R.A. Regulations are needed to protect freshwater ecosystems from salinization. Philos. Trans. R. Soc. B Biol. Sci. 2019, 374, 20180019. [Google Scholar] [CrossRef] [Green Version]
  79. Xue, H.; Li, S.; Chang, J. Combining ecosystem service relationships and DPSIR framework to manage multiple ecosystem services. Environ. Monit. Assess. 2015, 187, 117. [Google Scholar] [CrossRef]
  80. Sil, Â.; Rodrigues, A.P.; Carvalho-Santos, C.; Nunes, J.P.; Honrado, J.; Alonso, J.; Marta-Pedroso, C.; Azevedo, J.C. Trade-offs and Synergies between Provisioning and Regulating Ecosystem Services in a Mountain Area in Portugal Affected by Landscape Change. Mt. Res. Dev. 2016, 36, 452–464. [Google Scholar] [CrossRef] [Green Version]
  81. Chennault, C.M. People in Ecosystems/Watershed Integration: Visualizing Ecosystem Services Tradeoffs in Agricultural Landscapes. Ph.D. Thesis, Iowa State University, Ames, IA, USA, 2014. [Google Scholar]
  82. le Roux, B.; van der Laan, M.; Vahrmeijer, T.; Bristow, K.L.; Annandale, J.G. Establishing and testing a catchment water footprint framework to inform sustainable irrigation water use for an aquifer under stress. Sci. Total Environ. 2017, 599–600, 1119–1129. [Google Scholar] [CrossRef] [PubMed]
  83. van der Laan, M.; Eckert, S.; da Silva, M.; Annandale, J. A water footprint approach to guide water resource management in data-scarce regions: A case study for the upper ewaso ng’iro basin, mount kenya. Water 2021, 47, 356–366. [Google Scholar] [CrossRef]
  84. Quinn, J.E.; Brandle, J.R.; Johnson, R.J. A farm-scale biodiversity and ecosystem services assessment tool: The healthy farm index. Int. J. Agric. Sustain. 2013, 11, 176–192. [Google Scholar] [CrossRef] [Green Version]
  85. Rebelo, A.J.; Morris, C.; Meire, P.; Esler, K.J. Ecosystem services provided by South African palmiet wetlands: A case for investment in strategic water source areas. Ecol. Indic. 2019, 101, 71–80. [Google Scholar] [CrossRef]
  86. Kotze, D.C.; Macfarlane, D.M.; Edwards, R.J.; Madikizela, B. Wet-ecoservices version 2, A revised ecosystem services assessment technique, and its application to selected wetland and riparian areas. Water 2020, 46, 679–688. [Google Scholar] [CrossRef]
  87. Hardy, P.Y.; Dray, A.; Cornioley, T.; David, M.; Sabatier, R.; Kernes, E.; Souchère, V. Public policy design: Assessing the potential of new collective Agri-Environmental Schemes in the Marais Poitevin wetland region using a participatory approach. Land Use Policy 2020, 97, 104724. [Google Scholar] [CrossRef]
  88. Castella, J.C.; Lestrelin, G. Exploring the environmental impact of agrarian changes in Southeast Asia through participatory evaluation of ecosystem services. Cah. Agric. 2021, 30, 3. [Google Scholar] [CrossRef]
  89. Girma, R.; Tengberg, A.; Zazu, C. Training Manual International Water Management Institute (IWMI) Participatory Land Use Planning; Stockholm International Water Institute and International Water Management Institute: Addis Ababa, Ethiopia, 2020. [Google Scholar]
  90. Choptiany, J.; Graub, B.; Phillips, S.; Colozza, D.; Dixon, J. Self-Evaluation and Holistic Assessment of Climate Resilience of Farmers and Pastoralists; FAO: Rome, Italy, 2015. [Google Scholar]
  91. FAO. The Self-Evaluation and Holistic Assessment of Climate Resilience for Farmers and Pastoralists (SHARP) Tool and the Enhanced Transparency Framework (ETF); FAO: Rome, Italy, 2021. [Google Scholar]
  92. Neugarten, R.A.; Langhammer, P.F.; Osipova, E.; Bagstad, K.J.; Bhagabati, N.; Butchart, S.H.M.; Dudley, N.; Elliott, V.; Gerber, L.R.; Arrellano, C.G.; et al. Tools for Measuring, Modelling, and Valuing Ecosystem Services Guidance for Key Biodiversity Areas, Natural World Heritage Sites, and Protected Areas; Best Practice Protected Area Guidelines Series No. 28 [Internet]; IUCN: Fontainebleau, France, 2018; Available online: www.iucn.org (accessed on 21 October 2021).
  93. Peh, K.S.-H.; Balmford, A.P.; Bradbury, R.B.; Brown, C.; Butchart, S.H.M.; Hughes, F.M.R.; MacDonald, M.A.; Stattersfield, A.J.; Thomas, D.H.L.; Trevelyan, R.J.; et al. Toolkit for Ecosystem Service SIte-based Assessment (TESSA). Version 2.0 [Internet]. Cambridge, UK. 2017. Available online: http://tessa.tools (accessed on 21 October 2021).
  94. Hanson, C.; Buckingham, K.; Dewitt, S.; Laestadius, L. The Restoration Diagnostic: A Method for Developing Forest Landscape Restoration Strategies by Rapidly Assessing the Status of Key Success Factors; Version 1.0; World Resources Institute: Washington, DC, USA, 2015. [Google Scholar]
  95. Jia, L.; Merten, J.; Burke, G.; Mumford, E.C. Application of Restoration Opportunities Assessment Methodology (ROAM) in Asia Summary of Findings from the First Asia Regional ROAM Learning Exchange; IUCN Asia Regional Office (ARO): Bangkok, Thailand, 2018. [Google Scholar]
  96. Jana, B.; Mandal, R.; Jayasankar, P. Wastewater Management Through Aquaculture; Jana, B.B., Mandal, R.N., Jayasankar, P., Eds.; Springer: Singapore, 2018. [Google Scholar]
  97. Holland, J.E.; Luck, G.W.; Max Finlayson, C. Threats to food production and water quality in the Murray-Darling Basin of Australia. Ecosyst. Serv. 2015, 12, 55–70. [Google Scholar] [CrossRef]
  98. Herrero, M.; Thornton, P.K.; Power, B.; Bogard, J.R.; Remans, R.; Fritz, S.; Gerber, J.S.; Nelson, G.; See, L.; Waha, K.; et al. Farming and the geography of nutrient production for human use: A transdisciplinary analysis. Lancet Planet. Health 2017, 1, e33–e42. [Google Scholar] [CrossRef] [PubMed] [Green Version]
  99. Fanzo, J. The role of farming and rural development as central to our diets. Physiol. Behav. 2018, 193, 291–297. [Google Scholar] [CrossRef]
  100. Dzanku, F.M.; Jirström, M.; Marstorp, H. Yield Gap-Based Poverty Gaps in Rural Sub-Saharan Africa. World Dev. 2015, 67, 336–362. [Google Scholar] [CrossRef]
  101. Cerda, R.; Deheuvels, O.; Calvache, D.; Niehaus, L.; Saenz, Y.; Kent, J.; Vilchez, S.; Villota, A.; Martinez, C.; Somarriba, E. Contribution of cocoa agroforestry systems to family income and domestic consumption: Looking toward intensification. Agrofor. Syst. 2014, 88, 957–981. [Google Scholar] [CrossRef]
  102. Röös, E.; Mie, A.; Wivstad, M.; Salomon, E.; Johansson, B.; Gunnarsson, S.; Wallenbeck, A.; Hoffmann, R.; Nilsson, U.; Sundberg, C.; et al. Risks and opportunities of increasing yields in organic farming. A review. Agron Sustain Dev. 2018, 38, 14. [Google Scholar] [CrossRef] [Green Version]
  103. Brady, M.; Sahrbacher, C.; Kellermann, K.; Happe, K. An agent-based approach to modeling impacts of agricultural policy on land use, biodiversity and ecosystem services. Landsc. Ecol. 2012, 27, 1363–1381. [Google Scholar] [CrossRef]
  104. Johnston, A.S.A.; Sibly, R.M.; Hodson, M.E.; Alvarez, T.; Thorbek, P. Effects of agricultural management practices on earthworm populations and crop yield: Validation and application of a mechanistic modelling approach. J. Appl. Ecol. 2015, 52, 1334–1342. [Google Scholar] [CrossRef] [Green Version]
  105. Alomia-Hinojosa, V.; Groot, J.C.J.; Andersson, J.A.; Speelman, E.N.; McDonald, A.J.; Tittonell, P. Assessing farmer perceptions on livestock intensification and associated trade-offs using fuzzy cognitive maps; a study in mixed farming systems in the mid-hills of Nepal. Syst. Res. Behav. Sci. 2023, 40, 146–158. [Google Scholar] [CrossRef]
  106. Ding, L.; Liao, Y.; Zhu, C.; Zheng, Q.; Wang, K. Multiscale Analysis of the Effects of Landscape Pattern on the Trade-Offs and Synergies of Ecosystem Services in Southern Zhejiang Province, China. Land 2023, 12, 949. [Google Scholar] [CrossRef]
  107. Arnott, J.C.; Neuenfeldt, R.J.; Lemos, M.C. Co-producing science for sustainability: Can funding change knowledge use? Glob. Environ. Change 2020, 60, 101979. [Google Scholar] [CrossRef]
  108. Pan, S.L.; Pee, L.G. Usable, in-use, and useful research: A 3U framework for demonstrating practice impact. Inf. Syst. J. 2020, 30, 403–426. [Google Scholar] [CrossRef]
  109. Cavender-Bares, J.; Polasky, S.; King, E.; Balvanera, P. A sustainability framework for assessing trade-offs in ecosystem services. Ecol. Soc. 2015, 20, 17. [Google Scholar] [CrossRef] [Green Version]
  110. Fraschini, F.; Hunt, A.; Zoboli, R. Decision tools for adaptation to climate change: Portfolio analysis of tea plantation investments in Rwanda. Ecol. Econ. 2022, 200, 107528. [Google Scholar] [CrossRef]
Figure 1. Screening process and the developed categorization matrix used for the analysis.
Land 12 01329 g001
Figure 2. Topics addressed by reviewed articles according to the Rayyan software.
Land 12 01329 g002
Figure 3. Number of articles focusing on agricultural practices by geographic region (n = 37).
Land 12 01329 g003
Figure 4. Number of articles according to practices type and ecosystem service category targeted by the study (n = 37).
Land 12 01329 g004
Figure 5. Articles focusing on ecosystems functions (n = 34): (A) Geographical regions (frequency), (B) Ecosystem services and functions addressed.
Land 12 01329 g005
Figure 6. Assessment of Model-based papers (n = 54). (A) Geographical areas (in frequency), (B) Ecosystem function (%), (C) Agricultural thematic areas (%), (D) Models (%) in which the last three could be represented several times per paper.
Land 12 01329 g006
Figure 7. Practical trade-off tools applicable to different landscape segments and scales.
Land 12 01329 g007
Table 1. Eligibility criteria of the first screening of 952 articles (title + abstract).
Inclusion CriteriaExclusion Criteria
1.Language: articles in English and FrenchArticles not written in English or French
2.Time period: articles published from 1975 until Sept 2021Articles published before 1975
3.Study design: practical on-the-ground studies and tools related to agricultureTheoretical or modelling studies and tools; laboratory studies
4.Non-timber forest products (NTFPs), forest foodWood, timber, pulp
5.BiodiversityGenetic biodiversity
6.Animal production: fish, livestock, farming, aquacultureMarine fisheries
Disclaimer/Publisher’s Note: The statements, opinions and data contained in all publications are solely those of the individual author(s) and contributor(s) and not of MDPI and/or the editor(s). MDPI and/or the editor(s) disclaim responsibility for any injury to people or property resulting from any ideas, methods, instructions or products referred to in the content.

