Abstract
Understanding the spatial distribution pattern and evolution characteristics of the elderly population in urban areas is of great significance for the development of urban planning and the implementation of public management policies in the context of rapid aging. Accurately identifying the spatial distribution and evolution characteristics of the elderly population in a city requires a comprehensive analysis of multiple indicators and large-scale data. Taking Wuhan City as an example, this article measures the spatial distribution characteristics and evolution trend of the elderly population from 2000 to 2020 at the street/township level based on data from the fifth, sixth, and seventh censuses, using methods such as kernel density hotspot detection, spatial clustering analysis, and standard deviation ellipse analysis. The results show that (1) there are significant differences in the aging spatial pattern between the central area and the suburban areas of Wuhan; (2) overall, Wuhan’s aging rate shows a typical “core–periphery” growth mode in space, while the density of the elderly population has significant spatial aggregation characteristics and shows an evolution trend of “centralized concentration, peripheral outliers, axial development, and near-field growth”; (3) the center of gravity of the elderly population remains relatively stable over time.
1. Introduction
With declining birth rates and increasing life expectancy, population aging has become a global trend. Currently, China’s population structure is aging rapidly due to its negative population growth trend [1], and in the foreseeable future, there will be a period of the fastest aging process in the country. “Actively coping with population aging” has become China’s national strategic goal [2,3]. According to the 7th National Population Census, there are 190 million people aged 65 and above, accounting for 13.5% of the total population in China, and the country is about to enter the stage of a moderately aging society [2]. In terms of urban areas, 149 cities in China already have a population of 65 years old and above accounting for more than 14% [4]. From a regional distribution perspective, these 149 cities come from 41 coastal cities in eastern China, accounting for 27.5%; 36 cities in northeastern China, accounting for 24.2%; and 72 cities in central and western China, accounting for 48.3%. Generally speaking, moderately aging cities are concentrated in northeastern China, central China, the Yangtze River Delta, the lower reaches of the Yellow River, and the Chengdu–Chongqing urban agglomeration. Wuhan, located in central China, is one of the 17 cities in China with a permanent resident population of over 10 million. According to the data from the 7th National Population Census, the city’s permanent population was 12.327 million by the end of 2020, with the number of people aged 65 and above reaching 1.456 million, accounting for about 11.81% of the total population, which is comparable to the national aging level. As population aging intensifies, the government has begun to attach great importance to the issue, and it has become an urgent scientific and social issue to develop effective elderly care policies, establish elderly-friendly cities, and create suitable living environments for the elderly [5]. Precisely grasping the spatial distribution pattern and evolution characteristics of the elderly population within cities is a prerequisite for achieving these goals in a rational and efficient manner [6].
There are abundant research results on the spatial distribution of the elderly population, and many scholars have conducted empirical studies on the spatial distribution characteristics of the elderly population in cities or counties [7,8,9,10,11,12]. The research scale is mostly at the macro or meso level [13,14,15,16,17,18], and the types of population data used in the research have tended to be diversified, mainly including population census data [19,20,21,22,23], population grid data [24,25], mobile signaling data [26,27,28], and YiChuxing data [29,30,31,32]. However, each of these data types has its advantages and limitations. For example, population census data have the advantage of a reliable source and high accuracy, but there are also challenges to overcome, such as the large time span (once every ten years) and the need to match with geographic spatial data. Research using population grid data is more common and these data are easy to obtain, but their accuracy is relatively low. In terms of research content, it mainly involves the analysis of spatial form evolution, differences, spatial clustering, social spatial differentiation, and related influencing factors [33,34,35,36,37]. At the methodological level, it mainly relies on some mature methods accumulated by geographers, such as spatial autocorrelation analysis [38,39,40], kernel density detection [41,42], gravity center models of population [6], standard deviation ellipses [43], etc. These methods can identify one basic feature of various specific populations’ spatial distribution, but research that compares and tests different methods to study the spatial distribution characteristics of the same region’s population is relatively rare.
Generally speaking, the analysis methods of the spatial distribution and evolution of urban elderly populations have been relatively mature in existing research, laying a solid foundation for this field. However, there are still some shortcomings: Firstly, there is a lack of large-span, long-time series, and fine-grained population age structure data. In the past, research was often based on population grid data, and their accuracy and precision need to be optimized. Secondly, the analysis dimensions mostly rely on a single index such as aging rate and the density of the elderly population, lacking multi-dimensional and targeted comprehensive analysis. Thirdly, most of the achievements are focused on separately studying urban or rural aging space, but there are few research works that conduct differential analysis of the two at the same scale.
The spatial distribution pattern of the elderly population is a continuous and dynamic process, and the spatial characteristics and formation factors of the elderly population vary widely [9]. To gain a deeper understanding of the evolution and differences in urban and rural aging spaces, this paper uses population structure data collected during the fifth, sixth, and seventh national censuses from 2000 to 2020. Using ArcGIS software combined with geographic spatial data, we achieve spatial visualization processing. Taking the city of Wuhan as the research object, at the intermediate scale of streets/towns, we accurately describe and quantitatively analyze the spatial distribution characteristics and evolutionary trends of the elderly population across the entire city of Wuhan over the past twenty years. To avoid the limitations of using a single indicator, this study comprehensively analyzes and cross-checks the spatial characteristics of the research object using three indicators: aging rate, elderly population density, and elderly population size.
2. Materials and Methods
2.1. Research Subject
The study area covers the entire area of Wuhan City. Wuhan City is an important city in the middle and lower reaches of the Yangtze River Economic Belt, located at 113°41′–115°05′ east longitude and 29°58′–31°22′ north latitude. The total area of the city is 8568 square kilometers, and in 2020, the city had a permanent resident population of 12.326518 million people, ranking 8th out of the 17 cities in China with a permanent resident population of more than 10 million people. The study area consists of six central urban districts and seven suburban districts, each with several streets/towns. Streets/towns are the lowest level of administrative management units in China and are the ideal unit for measuring aging spatial patterns at a micro level. The geographic location and administrative divisions of Wuhan City are shown in Figure 1.
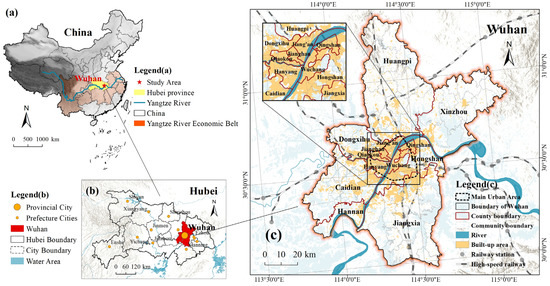
Figure 1.
Wuhan’s geographical location and administrative divisions.
2.2. Data Sources
The population age data used in this article come from the 5th, 6th, and 7th National Population Census data from 2000, 2010, and 2020, as well as the population age structure data of each street/township1 in the Wuhan Statistical Yearbook. We use ArcGIS software for the spatial visualization, integration, and computation of spatial data to generate corresponding aging rates, elderly population density, and elderly population size. Due to the large time span, there have been adjustments to the administrative divisions of Wuhan’s streets between 2000 and 2020. This study takes the street unit range in 2020 as the basis, and the population data are processed accordingly.
2.3. Research Methods
Due to the limitation of using a single indicator to measure the spatial characteristics of elderly populations in urban areas [26,27], this study attempted to use a combination of three indicators: aging rate, elderly population density, and elderly population number, to conduct comprehensive analysis and comparison at both the district and street levels. This approach aimed to accurately identify the spatial distribution patterns and characteristics of elderly populations in Wuhan. Given the large time span of the data, using kernel density to detect hotspots of elderly population density and observe the centroid shift of elderly populations using standard deviation ellipses are effective methods [28,29,30]. To determine whether there are clustering and differentiation characteristics among different spatial units of elderly populations, global Moran’s I and local Moran’s I were used for validation [31,32].
2.3.1. Detection of Aging Spatial Hotspots Based on Kernel Density
Kernel density hotspot detection is a method of using ArcGIS software to obtain the required information from elderly population data and detect the distribution of elderly population hotspots. The algorithm estimates the density around the sample by using the density of points within the unit network and produces a smooth surface. Currently, this method is widely used and mature, so this paper will not elaborate on it. Specific formulas and principles can be found in the relevant literature [33,34].
2.3.2. Analysis of the Aggregation Degree of Elderly Population Based on Global and Local Spatial Autocorrelation
This paper uses spatial autocorrelation analysis to study the spatial correlation of elderly populations in Wuhan. The global spatial autocorrelation is used to measure the spatial clustering status of the elderly population in the city, and the local spatial autocorrelation is used to measure the spatial difference of the elderly population, corresponding to the use of global Moran’s I and local Moran’s I.
(1) The calculation formula of global Moran’s I is as follows:
In this equation includes, is a spatial weight matrix (in this paper, the matrix is established based on the common boundary as the adjacency principle), is the number of spatial units, is the observation value of the ith unit, and is the mean value of all observation values. The range of the global Moran’s index I is [−1,1]. The closer I is to 1, the more significant the spatial clustering phenomenon is in the area; the closer I is to −1, the more significant the spatial dispersion phenomenon is in the area; when I is 0, this indicates that the spatial distribution in the area tends to be random.
(2) The formula for calculating local Moran’s index is as follows:
where and are the standardized values of observation in regions i and j, and is the spatial weight matrix. Based on the local Moran’s index, spatial patterns of the study units can be classified into four types: high–high (H–H) clusters, low–low (L–L) clusters, high–low (H–L) clusters, and low–high (L–H) clusters.
The first quadrant (H–H) represents an area that is already a high value and the surrounding areas are also high values. The second quadrant (L–L) represents an area that is already a low value and the surrounding areas are also low values. The third quadrant (H–L) represents an area that is originally a high value but the surrounding areas are low values. The fourth quadrant (L–H) represents an area that is originally a low value but is surrounded by high values.
2.3.3. Analysis of Spatial Centroid Shift Trend of Elderly Population Based on Standard Deviation Ellipse
Standard deviational ellipse (SDE) is a quantitative analysis of the spatial distribution characteristics of the geographic object studied at the overall level through the measurement of parameters such as center, major axis, minor axis, and azimuth of the ellipse representing the spatial distribution of features. The center represents the relative spatial position of the geographic objects, the azimuth reflects the main trend direction of the object distribution, the major axis represents the dispersion degree of the object in the main trend direction, and the minor axis represents the range of object distribution. The calculation formulas for these parameters are as follows:
Mean center:
Azimuth:
The standard deviation of the -axis and -axis are, respectively:
In the formula, (, ) represents the spatial coordinates of the geographic object; represents its weight; () represents the weighted mean center of each geographic object; is the azimuth of the standard deviation ellipse; , are the coordinate deviations of each geographic object to the weighted mean center; and , represent the standard deviations along the short axis, x-axis, and the long axis, y-axis, respectively.
3. Results
3.1. Spatial Distribution Patterns and Evolution Characteristics of Elderly Population in Wuhan City at the Street Scale
By using population age structure data from the census years of 2000, 2010, and 2020 for the streets/towns, a spatial distribution map of aging in Wuhan City was created. Figure 2 shows the spatial distribution of the proportion of the elderly population in different spatial units and the change trends between 2000 and 2020. According to the United Nations’ classification of aging, the spatial units were divided into four categories. It was found that the proportion of the elderly population in the streets/towns of Wuhan City varies significantly. Aging grew rapidly in the central urban areas and remote suburbs, while the growth rate in the near suburbs was relatively slow. The spatial pattern of aging in Wuhan City shows a typical “core–periphery” growth mode.
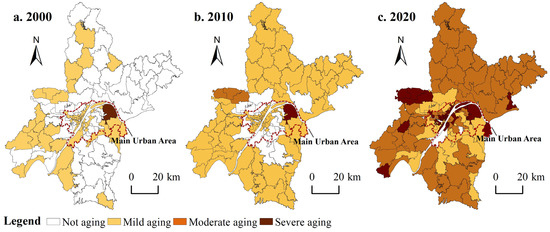
Figure 2.
Spatial distribution map of aging in Wuhan City based on aging rate.
Specifically, in 2000, out of the 156 administrative units in Wuhan City, 78 were not aging, mainly in the remote urban areas. There were 77 units with mild aging scattered in the central urban areas and remote urban areas, and only 1 unit with severe aging in the Ba jifu Street of Qingshan District, located on the edge of the central urban area. In 2010, the number of non-aging units decreased by 48, while 45 mild aging units and 3 moderate aging units were added. The units that underwent these changes were mainly located in the remote urban areas. It is worth noting that at this time, a “young ring” with non-aging units was formed around the central urban area. There was still only one unit with severe aging in the Ba jifu Street of Qingshan District. By 2020, there were only 3 non-aging streets left in the central urban area, 28 streets with mild aging, mainly evolved from the “young ring” in 2010, 69 streets with moderate aging, mainly distributed in remote urban areas, and 56 streets with severe aging, spatially concentrated in the core area of the central urban area and scattered in remote urban areas. In 2020, the aging rate was as high as 98%, and there were a total of 125 streets with severe and moderate aging, accounting for 80%. Specific statistical data can be seen in Table 1.2

Table 1.
Changes in types of population aging in Wuhan’s districts from 2000 to 2020 based on the percentage of population aged 65 and over (PA, %).
The conclusion drawn solely from the aging rate indicator is that the aging population in the remote urban areas of Wuhan City was more severe than that in the central urban areas in 2020. However, is this conclusion correct? We need to introduce other related indicators for further verification.
3.2. The Distribution Trend and Clustering Characteristics of Spatial Elderly Population Density in Various Streets in Wuhan City
3.2.1. Spatial Detection of Hotspots in the Elderly Population
Using the elderly population density index of each street/township unit from 2000 to 2020, we conducted a hotspot analysis of the elderly population using ArcGIS software. We found that the hotspots of aging in Wuhan are mainly located in the main urban area, and large-scale hotspots have not appeared in the edges of the urban area as expected. There is a significant spatial differentiation in the distribution of elderly population density between the main urban area and the edges of the urban area, and the elderly population density of spatial units decreases rapidly from the city center to the periphery.
From 2000 to 2020, the spatial distribution of elderly population density in Wuhan shows an evolutionary trend of “central concentration, peripheral dispersion, axial development, and near-domain growth”. As shown in Figure 3, in 2000, the hotspots of elderly population in Wuhan were mainly concentrated in the Yangtze River areas of the Jiang’an, Jianghan, Qiaokou, Hankou, Wuchang, and Qing Shan districts, which are the five main urban areas in Wuhan. A few hotspots areas appeared in the Hongshan and Dongxihu districts. In 2010, the hotspots expanded outward from the original area, and sporadic hotspots appeared in distant urban areas such as Huangpi, Caidian, and Xinzhou. In 2020, the newly added hotspot areas were not significant compared to 2010, but the original hotspot areas strengthened, and they show a clear clustering trend. It is evident that from 2000 to 2020, the hotspots of elderly population in Wuhan were mainly concentrated in the six main urban areas of the Jiang’an, Jianghan, Qiaokou, Qing Shan, Wuchang, and Hongshan districts. The core areas along the Yangtze River are particularly obvious. Hotspots outside the main urban areas are relatively rare and scattered. From the growth trend, the main growth points are still concentrated around the original hotspot areas. Therefore, the aging phenomenon of the population in the distant urban areas of Wuhan is not more severe than that in the main urban areas. On the contrary, the elderly population density in the distant urban areas has always been at a low level.
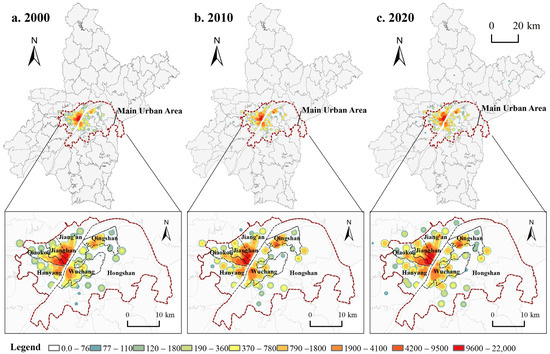
Figure 3.
Wuhan aging hotspot spatial map based on elderly population density.
3.2.2. Spatial Clustering Characteristics of the Elderly Population
Based on the above detection results, it is necessary to examine whether the spatial distribution pattern of the elderly population in Wuhan exhibits clustering characteristics. ArcGIS software was used to perform global and local spatial autocorrelation analysis on the index of elderly population density in each street/township spatial unit of Wuhan.
The results of the global spatial autocorrelation test showed that the Moran’s I values for 2000, 2010, and 2020 were 0.833, 0.745, and 0.706, respectively. All three years passed the significance test at 0.001 (Table 2), indicating that there is spatial correlation among the elderly population density indicators of various spatial units in Wuhan. The value of Moran’s I decreased from 2000 to 2020, indicating a weakening of this spatial clustering characteristic in the past two decades.
Table 2.
Global Moran’s I value of Wuhan based on elderly population density.
The cluster and outlier analysis (Anselin local Moran’s I) function of ArcGIS was used to determine the local spatial clustering of the elderly population in various street/township spatial units, i.e., whether there are “high–high”, “high–low”, “low–high”, or “low–low” clusters. The results are shown in Figure 4, which displays clear and distinct clustering characteristics of the elderly spatial distribution in Wuhan in 2000, 2010, and 2020. Specifically, most of the suburban areas have been identified as “low–low” clusters for aging, whereas the “high–high” clusters are concentrated in the downtown area near the core area along the river and have remained stable over time. The clustering range the north of the river is greater than that in the south. No significant spatial clustering was found in the edge zone of the downtown area.
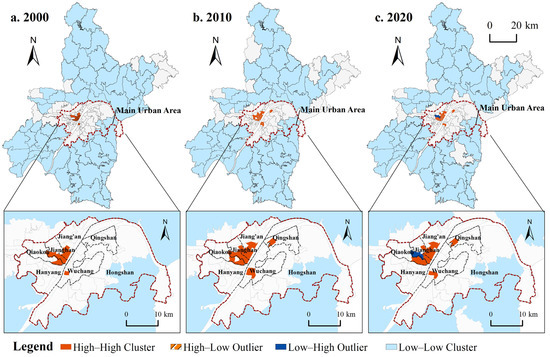
Figure 4.
Spatial LISA (local indicators of spatial association) cluster map of elderly population based on density in Wuhan.
In terms of evolutionary trends, there were nine new “high–high” clustered streets from 2000 to 2010, including Erqi Street in Jiang’an District, Tangjiadun Street, Beihu Street, and Taipei Street in Jianghan District, Hanshuiqiao Street in Qiaokou District, Zhonghua Road Street, Liangdao Street, and Shouyi Road Street in Wuchang District, and Hongweilu Street in Qingshan District, all located within the downtown area. There was no significant change in “low–low” clustered areas and there were no “high–low” or “low–high” clustered areas. From 2010 to 2020, there were changes in the “high–high” clustered streets, that is, Jianghan District lost two “high–high” streets, Beihu Street and Wansongyuan Street, Wuchang District lost two “high–high” streets, Zhonghua Road Street and Liangdao Street, and Qiaokou District added one “high–high” street, Baofeng Street; “low–low” clustered areas showed no significant change, still mainly distributed in the suburbs. Interestingly, Wansongyuan Street in Jianghan District transformed from a “high–high” clustered street to a “low” one.
Based on the above results, we propose another hypothesis: that the elderly population in Wuhan is heavily concentrated in the core area of the downtown area, while although the proportion of the elderly population in suburban areas is relatively high, the overall number of elderly people in these areas is relatively small.
3.3. The Spatial Distribution Pattern and Evolutionary Trend of the Elderly Population Scale across Various Streets in Wuhan City
3.3.1. Measurement of Spatial Center of Gravity of Elderly Population in Wuhan
Based on the number of elderly people in each spatial unit (street/township) in Wuhan, we drew standard deviation ellipse distribution maps for the years 2000, 2010, and 2020. We analyzed the distribution characteristics and evolutionary trends of aging spatial patterns in Wuhan based on the position of the center of gravity of the ellipse and the distribution of its major and minor axes.
As shown in Figure 5, the center of gravity and spatial shape of the standard deviation ellipse for the elderly population in Wuhan remained relatively stable from 2000 to 2020, even though the total number of elderly people increased by 886,600 during this period. As shown in Table 3, the center of gravity remained stable during the 20-year period, and the changes in the major and minor axes of the ellipse were all within a range of 1 km. The azimuth deviation was about 1 degree. The longitude of the center of gravity of the ellipse shifted from 114.314 degrees east in 2010 to 114.323 degrees east in 2020, and the latitude shifted from 30.607 degrees north to 30.618 degrees north. In 2020, the center of gravity of the ellipse shifted further to 114.325 degrees east and 30.614 degrees north. From 2000 to 2020, the center of gravity of the ellipse only shifted slightly towards the northeast and still remained between the two banks of the Yangtze River in the core area of the main urban area.
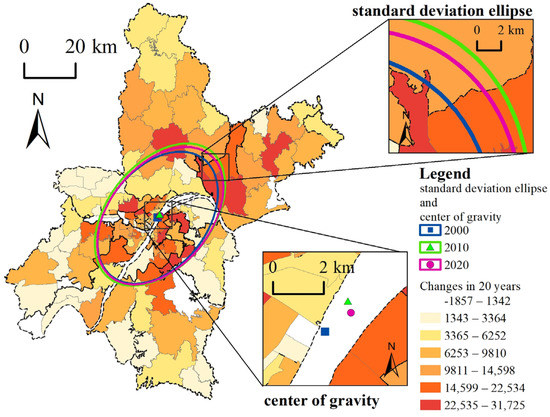
Figure 5.
Standard deviation ellipse of elderly population distribution in Wuhan based on the number of elderly people.
Table 3.
Elliptical parameters of spatial distribution of elderly population in Wuhan from 2000 to 2020.
Analyzing the evolution of the elderly population spatial distribution in Wuhan based on the changes in the coverage of the standard deviation ellipse (Figure 5), it can be seen that from 2000 to 2010, the short axis of the standard deviation ellipse expanded from 19.28 km to 20.20 km, the long axis expanded from 29.08 km to 31.81 km, and the coverage area expanded from 1761 km2 to 2018 km2. The spatial distribution of the elderly population showed a trend of expanding along the northeast–southwest axis, with a stronger trend towards the northeast. From 2010 to 2020, the short axis of the standard deviation ellipse decreased from 20.20 km to 19.69 km, the long axis decreased from 31.81 km to 30.68 km, and the coverage area decreased from 2018 km2 to 1898 km2. The spatial distribution of the elderly population showed a trend of contracting along the northeast–southwest axis. The azimuth of the standard deviation ellipse oscillated between 38.07 degrees and 39.94 degrees, which is consistent with the direction of the Yangtze River in the Wuhan section. This trend indicates that the spatial distribution of the elderly population in Wuhan is roughly consistent with the overall urban spatial development direction of Wuhan, which is along the Yangtze River basin.
The above results confirm the hypothesis proposed in the previous section; a large proportion of the elderly population in Wuhan is concentrated in the core urban area of the main city, while the proportion of the elderly population in the suburbs is relatively high but the total number of elderly people is low. Moreover, this trend has remained relatively stable over time.
3.3.2. The Overall Spatial Distribution and Evolutionary Trend of Population in Wuhan
According to the statistical data (Table 4), the total population of Wuhan City increased by 4.0138 million people from 2000 to 2020. Among them, the population aged 65 and above increased by 0.8866 million people, with a growth rate of 155.7%; the population aged 15 to 64 increased by 3.0365 million people, with a growth rate of 48.8%; the population aged 14 and below increased by 0.0907 million people, with a growth rate of only 6.0%. It can be seen that the elderly population is the fastest growing group. The spatial distribution and evolutionary trends of the population at various age levels are shown in Figure 6.
Table 4.
Population statistics of Wuhan City by age group from 2000 to 2020.
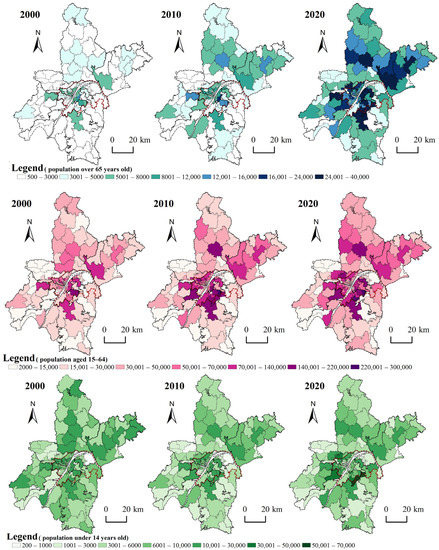
Figure 6.
Spatial distribution and evolution chart of population in various age groups in Wuhan based on population size.
In terms of spatial distribution, there has been a certain scale of growth in the number of elderly people, whether within street management units in the main urban area or town management units in the distant urban area. The spatial development pattern expands along the main axis direction of the Yangtze River, and this phenomenon also reveals the reason why the azimuth of the standard deviation ellipse always hovers between 38.07 degrees and 39.94 degrees. The elderly population in both the distant urban area and the main urban area is increasing, but due to the fact that the unit land area of town management units in the distant urban area is much larger than that of street management units in the main urban area, the elderly population density in the distant urban area is still lower than that in the main urban area. Therefore, the hotspots based on the density of the elderly population are still located within the main urban area.
In addition, the spatial distribution of the population between the ages of 15 and 64 essentially maintained a decreasing distribution pattern from the center to the periphery, and the growth rate was also relatively stable. It is worth noting that the population of teenagers aged 14 and below showed a stable population size and a trend of centripetal aggregation in spatial distribution. In the 20 years from 2000 to 2020, it only increased by 6%, which is in stark contrast to the growth rate of the elderly population of 155.7%. If this trend continues, it will mean that the aging of the population structure in Wuhan will become more severe in the future.
4. Discussion
4.1. Testing the Rationality of the Spatial Distribution Pattern and Evolution Characteristics of Population Aging at the Mesoscale
The above test results indicate that it is feasible to analyze the spatial distribution pattern and evolutionary characteristics of urban population aging by visualizing the elderly population data at the mesoscale. This article analyzes the degree of population aging in urban spaces at the level of streets/townships, which can make up for the lack of spatial visualization of basic census data and is one of the contributions of this study. Streets and townships are the lowest administrative units in China and the smallest spatial units that can obtain accurate data from government channels. Accurate data sources and appropriate data samples are necessary and beneficial for conducting research on urban elderly population spatial distribution. This method is also applicable to research on other specific populations in cities. Visualizing population data in space can more intuitively reveal the spatial distribution and evolutionary characteristics of specific populations in cities. If combined with factors such as population base, economic development, infrastructure, and urban functions, it will be helpful to analyze their influencing factors and mechanisms. For example, in this paper, we found that the overall spatial aging of Wuhan City exhibits a typical “core–periphery” bipolar growth pattern. This is mainly due to the following reasons: (1) the large population base and convenient public service facilities in the core area leave a large number of fixed population living and aging here; (2) the high proportion of the elderly population in the space units in the outer suburbs of the city is mainly caused by population migration, where a large number of young people work outside the city all year round; (3) the reasons for the relatively “young” state of the city’s near suburbs are more complex, but the influence of “differential rent” has always been recognized by the academic community.
Grasping the types and locations of aging spatial patterns at the mesoscale is more intuitive for analyzing the factors that form the spatial distribution pattern of aging in cities [6]. Focusing on individual street spatial units, it can be discovered that Bajifu Street in Qing Shan District has been in a severely aging space and is also the earliest street with aging space in Wuhan (Figure 7). It is located in a chemical industry zone on the edge of the main urban area of Wuhan, and it can be inferred that this street has formed a typical “retirement center.” Therefore, it is believed that aging spaces are more likely to appear around large industrial areas. For example, by observing the LISA cluster map of the density of the elderly population in Wuhan, a “low–high” type street, Wansong Street, was added in 2020 (Figure 8). The density of the elderly population on the surrounding streets of Wansongyuan Street is high, but the density of the elderly population on Wansongyuan Street itself is relatively low. This is because the central area of Wansong Street has large public service facilities such as Zhongshan Park and Union Hospital, which are commonly used by the elderly population. The data show that the density of the elderly population on adjacent streets such as Baofeng Street, Hanshuiqiao Street, Taipei Street, and Xinhua Street increased several times compared to 2010, all exceeding 5000 people per square kilometer. It is worth noting that the density of the elderly population on Wansong Street itself also increased from 1468 people per square kilometer in 2010 to 2328 people per square kilometer. However, due to the large-scale construction land occupied by Zhongshan Park, Union Hospital, and other large facilities, the proportion of residential land in the street is relatively low, resulting in relatively low density units of the elderly population compared to surrounding streets. It can be seen that the layout of large public service facilities in urban areas also has a crucial impact on the spatial distribution pattern of aging populations [44].
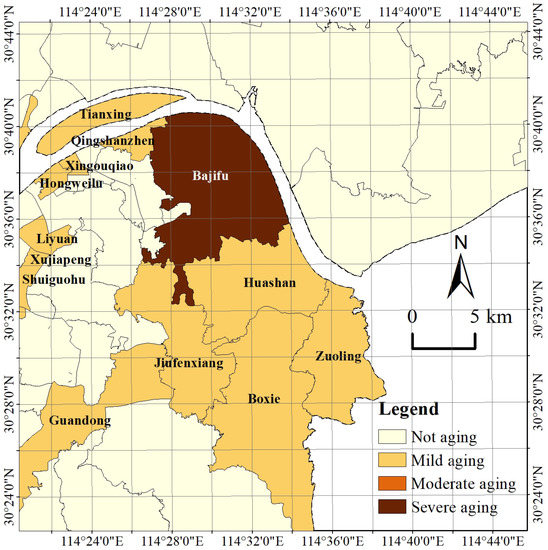
Figure 7.
Diagram of aging space in Bajifu Street and surrounding streets, Qing Shan District, Wuhan City.
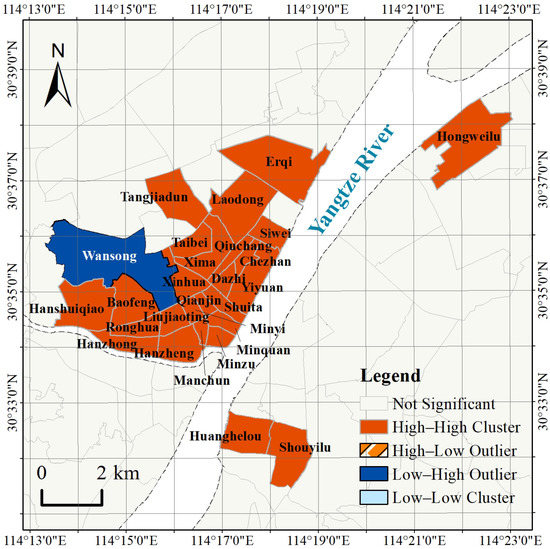
Figure 8.
LISA clustering diagram of the aging population density in Wansong sub-district and surrounding streets, Jianghan District, Wuhan City.
The mesoscale can accurately detect the subtle changes in the urban aging space. We analyzed the evolution of Wuhan’s aging space by observing the variation in the long and short axes of the standard deviation ellipse, which showed an expanding-then-contracting trend along the city’s main axis (the Yangtze River basin) (Figure 5). Although this trend was not very obvious, it was accurately identified. This variation is consistent with the changes in urban and rural development policies in Wuhan over the past two decades. From 2000 to 2010, Wuhan focused on the integrated development of urban and rural areas, during which time the city was in a period of rapid expansion and the elderly population in the outskirts grew rapidly. However, the city’s development policy changed from 2010 to 2020, with a greater emphasis on the renewal of the existing land in the main urban area, and strict control of construction land outside the main urban area. As a result, the overall population growth in the outskirts slowed down, while the main urban area attracted a large number of elderly residents due to its complete urban functions and convenient public services. The characteristics of the evolution of the aging space are closely related to urban development policies. At the same time, these policies also provide a basis for predicting the evolution trend of the aging space over time [45,46].
4.2. The Necessity of Multiple Indicators for Examining the Spatial Patterns of Population Aging
There are limitations in describing the spatial patterns of population aging using a single indicator. If only the aging rate is used as a research indicator, we may mistakenly believe that the population aging phenomenon in the suburban and rural areas of Wuhan is more severe than in the central urban area, as shown in Figure 2. However, when two additional indicators, namely the density and number of older people, are introduced, it is found that this is not the case. In fact, the hotspots of aging are mainly concentrated in the core areas of the central urban area and form a clustered state, while they are scattered in the suburban areas. These sporadically appearing hotspots in the suburban areas will also be categorized as “low–low” cluster areas due to the generally larger size of individual spatial units in the suburban areas. This finding has important implications for the formulation of urban and rural elderly care policies and the layout of public service facilities. The high proportion of elderly people and the small population size in the suburban and rural areas compared with the central urban area confirm that the aging phenomenon in the former areas is caused by the loss of a large number of young people. Therefore, the key to solving the problem of aging in rural areas is to retain the young population by addressing issues such as providing more employment and entrepreneurship opportunities, rather than focusing excessively on the trend of the elderly population. However, the aging indicators of the central urban area of Wuhan are different, with a high proportion of elderly people, a large number of them, and high-density concentration, fully reflecting the dependence of elderly people on urban life. Therefore, it is necessary to focus on the key areas for aging-related research in cities, especially in the central urban areas. The method of using multiple indicators to test the spatial characteristics of population aging is also applicable to the basic research on aging issues in other cities.
5. Conclusions
This study is based on population structure data spanning twenty years, and uses the indicators of aging rate, elderly population density, and elderly population size to comprehensively measure the spatial distribution pattern and evolution characteristics of the elderly population in Wuhan at the meso level. The aging rate indicator in Wuhan exhibits a typical “core–periphery” growth pattern in space; while the spatial distribution of elderly population density differs greatly between the main urban area and distant urban areas, showing the characteristics of “centralized concentration, peripheral scatter, axial development, and near-domain growth”. Based on the spatial center of gravity of the elderly population size, it has remained relatively stable over the past twenty years. On this basis, differences and causes of urban and rural aging spatial patterns are also explored. The research results also demonstrate the necessity of using multiple indicators to measure the spatial pattern of population in large cities and the rationality of observing the spatial evolution characteristics of the population at a meso scale.
The aging of the population is a significant challenge urban development faces in China. Accurately grasping the spatial distribution patterns and evolutionary patterns of the elderly population in large cities has important theoretical and practical implications. Although this article focuses on Wuhan as a case study, research on the aging of the population, the development of elderly policies, and the allocation of urban public service facilities in other large cities in China, especially in the central region and the Yangtze River Economic Belt, can benefit from the findings.
This study is exploratory and there is room for further development in methodology and research scale. For example, the exploration of factors influencing the spatial distribution pattern of the elderly population can be further studied from social, economic, and policy perspectives using geographic detectors. Additionally, using more detailed population age structure data at the community level for analysis can more accurately determine the overall distribution pattern of the elderly population as spatial units of community. However, the data used in this study are only at the street level and cannot reveal the actual spatial distribution characteristics of each community within the street. Future research can explore more refined spatiotemporal data to make more detailed divisions in space and age of the elderly population, and conduct more in-depth and targeted research to enrich the research results in this field.
Author Contributions
Conceptualization, F.L. and J.Z.; methodology, W.W.; software, L.Y.; validation, F.L., J.Z. and W.W.; formal analysis, L.Y.; investigation, F.L.; resources, F.L.; data curation, W.W.; writing—original draft preparation, F.L.; writing—review and editing, W.W.; visualization, L.Y.; supervision, J.Z.; project administration, W.W.; funding acquisition, J.Z. All authors have read and agreed to the published version of the manuscript.
Funding
This research received no external funding.
Data Availability Statement
Not applicable.
Conflicts of Interest
The authors declare no conflict of interest.
Notes
| 1 | “Street/Township” is a shortened term for the management unit of either a Street Office or Township Government. The two are of the same administrative level, but differ in that Street Offices are located within the main urban area of a city, while Township Governments are located in more distant suburban areas. |
| 2 | According to the classification standards of aging by the United Nations, if the proportion of the population aged 65 and over exceeds 7%, this indicates a mildly aging society; if the proportion of population aged 65 and over exceeds 14%, this indicates a moderately aging society; if the proportion of population aged 65 and over exceeds 20%, this indicates a severely aging society. |
References
- Lu, J.; Gu, Y. The Real Connotation, Core Issues and Practical Paths of Optimizing China’s Population Development Strategy. J. Soc. Sci. 2023, 1–12. Available online: http://kns.cnki.net/kcms/detail/21.1012.C.20230601.1328.004.html (accessed on 6 May 2023).
- China’s Medium and Long Term Plan for Actively Responding to Population Aging. Available online: http://www.gov.cn/zhengce/2019-11/21/content_5454347.htm (accessed on 2 March 2023).
- Zhao, Q. Actively addressing the issue of population aging. China Soc. Sci. J. 2023. [Google Scholar] [CrossRef]
- Liu, W. Multi subject protection: Digital enabling smart pension model. J. Shenyang Inst. Eng. 2022, 18, 18–23+35. [Google Scholar] [CrossRef]
- Chen, X.; Song, W.; Jin, Y. Research on the Current Situation, Impact, and Countermeasures of Population Aging Development in Hubei Province: Statistical Analysis Based on the Seventh National Population Census Data. Hubei Soc. Sci. 2022, 423, 59–69. [Google Scholar] [CrossRef]
- Zhou, J. Spatial Distribution Characteristics and Evolution Trend of Urban Aging Population. Urban Plan. 2014, 38, 18–25. [Google Scholar] [CrossRef]
- Yu, J.; Rosenberg, M.W. Aging and the changing urban environment: The relationship between older people and the living environment in post-reform Beijing, China. Urban Geogr. 2020, 41, 162–181. [Google Scholar] [CrossRef]
- Xu, X.; Zhao, Y.; Zhang, X.; Zhang, X. Spatial differentiation and evolution of population aging in Jiangsu Province and its influencing factors. Geogr. Sci. 2017, 37, 1859–1866. [Google Scholar] [CrossRef]
- Yi, C.; Zhang, C.; Wu, S.; Gao, M.; Liang, H. Research on the Spatial Distribution and Changes of the Elderly Population in Beijing from 2000 to 2010. Urban Dev. Res. 2014, 21, 66–71. [Google Scholar] [CrossRef]
- Zhang, K.; Sun, H.; Li, X. Aging Population Spatial Distribution Discrepancy and Impacting Factor. Sustainability 2022, 14, 9528. [Google Scholar] [CrossRef]
- Lewandowska-Gwarda, K.; Antczak, E. Urban Ageing in Europe—Spatiotemporal Analysis of Determinants. ISPRS Int. J. Geo-Inf. 2020, 9, 413. [Google Scholar] [CrossRef]
- Wang, Z.; Hu, C.; Yan, H.; Qiu, L. The spatial-temporal evolution characteristics and spatial guidance strategy of China’s municipal population—Based on the population data of 317 Prefecture-level city for “five popular”, “six popular” and “seven popular”. Planner 2022, 38, 14–20. [Google Scholar] [CrossRef]
- Xie, B.; Zhou, J. A Study on the Spatial Distribution Pattern and Development Trends of Elderly People in Large Cities: Taking Beijing, Shanghai, Guangzhou, and Wuhan as Examples. J. Urban Plan. 2013, 5, 56–62. [Google Scholar] [CrossRef]
- Wang, J.; Shao, Y. A Study on the Spatial Distribution and Evolution of the Elderly Population in Hangzhou. Urban Plan. 2015, 39, 47–51. [Google Scholar] [CrossRef]
- Li, T. The spatial distribution and influencing factors of the aging population in Shanghai. Urban Plannin. 2020, 44, 39–46. [Google Scholar]
- Ren, Y. A Study on the Spatial Aggregation Characteristics and Evolutionary Trends of the Elderly Population in Beijing: An Empirical Study Based on the Data of the Fifth and Sixth Population Censuses. Urban Dev. Res. 2017, 24, 5–8. [Google Scholar] [CrossRef]
- Zheng, Y. Analysis of Spatial Differences in China’s Population Aging Based on Multiscale. Master’s Thesis, Zhejiang University, Hangzhou, China, 2015. [Google Scholar]
- Lin, X.; Wang, D.; Wang, N.; Ren, Y. The spatial distribution pattern characteristics and driving forces of the elderly population in Beijing. Reg. Res. Dev. 2016, 35, 158–164. [Google Scholar]
- Liu, Y.; Huang, Y.; Lai, M.; Gong, H. Research on the Spatial Structure and Evolutionary Trends of Urban Population in Guangzhou. Popul. Dev. 2023, 29, 41–50. [Google Scholar]
- Liang, H. Exploring the Method of Measuring Spatial Differences in Population Age Structure: Analysis Based on the Data of the Fifth and Sixth Population Censuses in Beijing. Popul. Soc. 2018, 34, 32–40. [Google Scholar]
- Zhang, T. Research on the Spatial Distribution and Development Trend Prediction of the Aged Population in Wuhan. Master’s Thesis, Zhongnan University of Economics and Law, Wuhan, China, 2017. [Google Scholar]
- Zhang, C.; Cao, G. Spatial characteristics and influencing factors of population aging in Beijing. Urban Dev. Res. 2007, 2, 56–61. [Google Scholar] [CrossRef]
- Ling, Y.; Kai, Z.; Zhen, F. Exploring Determinants of Population Aging in Northeast China: From a Social Economic Perspective. Int. J. Environ. Res. Public Health. 2019, 16, 4265. [Google Scholar] [CrossRef]
- Shiode, N.; Morita, M.; Shiode, S.; Okunuki, K.I. Urban and rural geography of aging: A local spatial correlation analysis of aging population measures. Urban Geogr. 2014, 35, 608–628. [Google Scholar] [CrossRef]
- Atkins, M.T.; Tonts, M. Exploring Cities through a Population Aging Matrix: A spatial and temporary analysis of older adult population trends in Perth, Australia. Aust. Geogr. 2016, 47, 65–87. [Google Scholar] [CrossRef]
- Wei, S.; Wang, Y.; Xu, C.; Wang, L. Identification of the elderly population recognition based on mobile signaling data. Shandong Transp. Technol. 2022, 2, 131–134+147. [Google Scholar] [CrossRef]
- Jiang, J.; Chen, M.; Zhang, J. Research on the differences and influencing factors of elderly tourists’ activities in Shanghai community parks. Landsc. Des. 2020, 8, 94–109. [Google Scholar] [CrossRef]
- Li, L.; Yang, S.; Zhang, C.; Han, L. Research on the Location of Elderly Care Service Facilities Based on Mobile Phone Signaling Data—Taking Chengdu as an Example. Sichuan Archit. 2020, 40, 4–6. [Google Scholar]
- Wang, Q.; Zhao, H.; Wan, J. Research on the Characteristics of Occupation and Residence in Main Urban Areas of Wuhan Supported by Big data of Yichou. Surv. Mapp. Bull. 2023, 3, 144–149. [Google Scholar] [CrossRef]
- Guan, W.; Wu, Z.; Wu, Z.; Cao, Z.; Liu, X. Spatial and temporal detection of urban population activity and analysis of its influencing factors based on WeChat travel data. Mod. Urban Res. 2021, 2–9. [Google Scholar] [CrossRef]
- Wang, C.; Xu, W.; Ding, Y. Research on the service level of parks and squares in the central urban area of Nanjing based on cycling index. Geogr. Geogr. Inf. Sci. 2021, 37, 53–58. [Google Scholar] [CrossRef]
- Duan, Y.; Liu, Y.; Liu, X.; He, D. Multi center spatial structure analysis based on the Big data of Yixing—Taking the main urban area of Chongqing as an example. Prog. Geogr. Sci. 2019, 38, 1957–1967. [Google Scholar] [CrossRef]
- Xu, Z.; Lin, X.; Luo, C. Research on spatial-temporal evolution and spatial type of population aging in Chongqing. J. Beijing Norm. Univ. (Nat. Sci. Ed.) 2019, 55, 772–779. [Google Scholar] [CrossRef]
- Ma, X.; Zhang, W.; Xue, H.; Li, K. Analysis of the spatial distribution and evolution characteristics of population aging in Gansu Province. Northwest Popul. 2014, 35, 115–121. [Google Scholar] [CrossRef]
- Hu, J.; Zhao, G. Research on the Spatial Distribution Evolution of the Elderly Population in Guangdong Province from 2000 to 2010. Northwest Popul. 2014, 35, 30–35. [Google Scholar] [CrossRef]
- Man, W.; Wang, S.; Yang, H. Exploring the spatial temporal distribution and evolution of population aging and social economic indicators in China. BMC Public Health 2021, 21, 966. [Google Scholar] [CrossRef] [PubMed]
- Yang, H.J. Visualizing spatial divisions in population aging in the Seven Metropolitan Area. Environ. Plan. A Econ. Space 2021, 53. [Google Scholar] [CrossRef]
- Fan, G.; Shao, J. Spatial and temporal evolution of population aging in China in the past 20 years and its driving mechanism. J. Nanyang Norm. Univ. 2021, 20, 1–8+27. [Google Scholar] [CrossRef]
- Zeng, T.; Zhao, Y.; Xu, X. Research on the evolution of spatial pattern of aging population in China and its influencing factors. Geogr. Geogr. Inf. Sci. 2017, 33, 72–79. [Google Scholar] [CrossRef]
- Lin, L.; Ma, F. Spatial distribution and trend of population aging in Guangzhou. Geogr. Res. 2007, 1043–1054. [Google Scholar] [CrossRef]
- Vemulapalli, S.S.; Ulak, M.B.; Ozguven, E.E.; Sando, T.; Horner, M.W.; Abdelrazig, Y.; Moses, R. GIS-based Spatial and Temporal Analysis of Aging-Involved Accidents: A Case Study of Three Counties in Florida. Appl. Spat. Anal. Policy. 2017, 10, 537–563. [Google Scholar] [CrossRef]
- Wu, L.; Huang, Z.; Pan, Z. The spatiality and driving forces of population ageing in China. PLoS ONE 2021, 16, e0243559. [Google Scholar] [CrossRef]
- Hinrichs, T.; Zanda, A.; Fillekes, M.P.; Bereuter, P.; Portegijs, E.; Rantanen, T.; Schmidt-Trucksäss, A.; Zeller, A.W.; Weibel, R. Map-based assessment of older adults’ life space: Validity and reliability. Eur. Rev. Aging Phys. Act. 2020, 17, 21. [Google Scholar] [CrossRef]
- Niu, Q.; Sheng, J.; Liu, X.; Yan, X. The spatial heterogeneity impact of commercial and public service facilities on residents’ relocation in Wuhan. Geogr. Sci. 2023, 43, 860–868. [Google Scholar] [CrossRef]
- Ma, L.; Zhang, Z. Spatial distribution and formation mechanism of the elderly population in Lanzhou City. Hum. Geogr. 2015, 30, 132–137. [Google Scholar] [CrossRef]
- Ning, Y.; Zhao, X.; Li, X.; Shi, D.; Deng, L.; He, T. Research on Demographics of Shanghai Population Development Trend and Countermeasures. Shanghai Urban Plan. 2011, 16–26. [Google Scholar] [CrossRef]


Disclaimer/Publisher’s Note: The statements, opinions and data contained in all publications are solely those of the individual author(s) and contributor(s) and not of MDPI and/or the editor(s). MDPI and/or the editor(s) disclaim responsibility for any injury to people or property resulting from any ideas, methods, instructions or products referred to in the content. |
© 2023 by the authors. Licensee MDPI, Basel, Switzerland. This article is an open access article distributed under the terms and conditions of the Creative Commons Attribution (CC BY) license (https://creativecommons.org/licenses/by/4.0/).