Abstract
The establishment of nature reserves and ecological function areas is crucial for preserving the natural environment and the invaluable services provided by ecosystems. In our study, we conducted a comprehensive analysis using the 2011–2020 Chinese land cover dataset to examine the impact of ecological function areas on regional land use and cover change. This analysis allowed us to quantify and visualize the intensity, aggregation effects, and transformation paths of land cover change while considering China’s ecological function areas. Our findings highlight notable disparities in land cover types between the ecological function area and its surroundings. Within the ecological function area, forest and grassland dominate, constituting 67% of the total land cover. In contrast, outside the ecological function area, there is a greater presence of wasteland, in addition to forest and grassland. Moreover, the abundance of impervious surfaces, which are closely linked to human activities, is significantly higher outside the ecological function area, almost double the amount found inside. By examining specific land cover types, we observed that forests exhibit the least change within the ecological function area, whereas croplands experience the least change outside. Throughout the study period, approximately 8.1% of land cover pixels underwent changes, with some areas displaying a frequency of change reaching up to 2. Interestingly, the number of high-frequency land use and cover change pixels inside the ecological function area is only half of the outside. Notably, a higher percentage of impervious surfaces within the ecological function area (0.13%) were converted into cropland compared to the outside (0.07%). Understanding the dynamics of land cover change within China’s ecological function areas provides valuable insights for effective land resource management and planning. It enables us to make informed decisions to ensure the sustainable development and conservation of these areas.
1. Introduction
Human activities are intricately intertwined with both the alteration of land use and the changes in land cover, exerting a profound influence on ecological and environmental transformations [1,2]. Comprehending and analyzing the patterns and regulations of land use and land cover change not only constitute a central focus in land science research but also emerge as an imperative necessity for achieving sustainable economic and societal development [3,4]. As the social economy, urbanization, and industrialization rapidly progress, human land use practices are undergoing consequential evolution [5,6]. However, the overexploitation and wastage of land resources are prevalent in today’s world, exacerbating conflicts between humans and land and giving rise to severe ecological and environmental issues, such as vegetation destruction [5], soil erosion [7], land desertification, and soil pollution [8]. Numerous studies have demonstrated that land use and cover change play a crucial role in influencing ecological and environmental transformations [9,10,11]. By affecting material energy and biochemical cycles on the Earth’s surface, land use and cover change significantly impact ecosystems [12]. For instance, they can lead to ecological problems such as alterations in water cycles [13,14], biodiversity decline [15], carbon emission increase [16], and habitat fragmentation [17]. Land use and cover change also have implications for global climate change through their influence on the carbon cycle [18]. Since 1850, approximately 35% of CO2 emissions have directly resulted from land use, and addressing the reduction in these carbon sources and sinks remains a substantial challenge for global environmental protection [19]. Furthermore, land use and cover change affect the magnitude of ecosystem service value by influencing changes in ecosystem area, type, and landscape patterns [20,21]. On one hand, land use changes have an impact on the regional ecological environment [22]. On the other hand, they are also influenced by human policies, such as the establishment of ecological function areas. Therefore, it is crucial to investigate the impact of ecological function areas on land use and cover changes and assess the effectiveness of ecological function area development [23,24].
The establishment of nature reserves and ecological function areas assumes a pivotal role in safeguarding the natural environment and preserving the invaluable services provided by ecosystems [25]. Research has demonstrated that nature reserves effectively protect local natural environments through the promotion of biodiversity [26], conservation of soil and water resources [27], and preservation of habitats [28]. However, the efficacy of protected areas is currently under scrutiny. Relevant studies indicate that 50–80% of protected areas worldwide lack effective management, impeding their intended functions [29,30]. A study focusing on nature reserves in the United States reveals that the majority of endangered plant and animal habitats are situated in privately owned, low-elevation territories, posing challenges to existing reserves and other public lands in adequately safeguarding species diversity [15]. The foundation for plant growth and energy cycling within protected areas relies on land resources, and any changes to these resources can significantly impact the surrounding environment [31]. Furthermore, land use and land cover changes in the vicinity of protected areas can also influence their ecological functions and biodiversity [32]. Hence, it is crucial to comprehend and analyze the characteristics of land use and land cover changes both inside and outside protected areas [33]. Currently, research on land use and land cover change has reached a mature stage, progressing from theoretical understanding to practical application and multidisciplinary integration [34,35,36]. Many studies have focused on urban development, national land resource management, ecological environments, and natural resource protection [37,38,39]. However, there is a dearth of research concerning land use and land cover changes within and outside ecological function protection zones, as well as a lack of comparative studies on the types and intensities of these changes. This knowledge gap hampers our exploration of the effectiveness of ecological function areas in conservation efforts.
China has established key ecological function areas such as one protection area that was established to guide regional ecological protection, development, resource utilization, and economic and social planning in 2008. It aimed to achieve coordinated progress in socio-economic and ecological domains [40]. Over a decade has passed since the delineation of these ecological function areas, highlighting the need for research on the effectiveness of conservation efforts within these zones [41,42]. Therefore, exploring the study of land use and land cover change based on ecological function areas serves as the foundation for assessing the effectiveness of conservation measures [43]. In this study, our investigation focuses on land use and land cover changes within and outside ecological function areas, analyzing the characteristics of these changes and specifically examining alterations in land cover types such as forest land, cropland, grassland, and impervious surfaces. It is the first attempt to compare the changes inside and outside ecological function areas based on land use and cover change, which is important for further management and policy decisions for ecological function areas. Ultimately, we summarize the conservation effectiveness of ecological function areas by (1) calculating the frequency of land use and land cover change from 2011 to 2020, (2) analyzing the characteristics of land cover type changes both inside and outside ecological function areas, and (3) examining the impact of ecological function areas on land use and land cover changes.
2. Materials and Methods
2.1. Data Source
The land use data utilized in this paper were extracted from the annual China Land Cover Dataset (CLCD), developed by Wuhan University. The dataset was created by analyzing Landsat images on Google Earth Engine, achieving an overall interpretation accuracy of 80% [44]. For this study, we specifically employed the 2011–2020 Chinese land cover data (available at https://doi.org/10.5281/zenodo.5816591, accessed on 1 February 2023). The land cover classification utilized in the dataset consists of nine categories, namely cropland, forests, grasslands, shrubs, water, impervious surfaces, snow/ice, barren land, and wetlands, and aligns with the classification employed in this study.
2.2. Ecological Function Areas in China
With the worsening of the ecological environment and the increasing conflict between humans and land, there is an urgent need to strengthen environmental protection efforts. In response to this, China has initiated national ecological function assessments and status surveys since the early 21st century and introduced the concept of national ecological function zoning in 2008. The zoning process involves delineating function areas covering a total of 2,336,700 km2, which accounts for 24.34% of China’s total land area [45]. These key ecological function zones are further classified into six distinct groups based on their dominant functions (Figure 1). Ecological function zoning entails dividing a region into areas with varying ecological functions, taking into account regional ecosystem patterns, ecological sensitivity, and the spatial differentiation of ecosystem service functions. For the purpose of this paper, which specifically focuses on land use and land cover change, marine protected areas within the ecological function areas are excluded from our analysis. The boundary data and classification principles of ecological function areas are sourced from the National Ecological Function Area Zoning published by the Chinese environmental protection department. It should be noted that compared with protected areas, ecological function areas pay more attention to the path of land use and cover change.
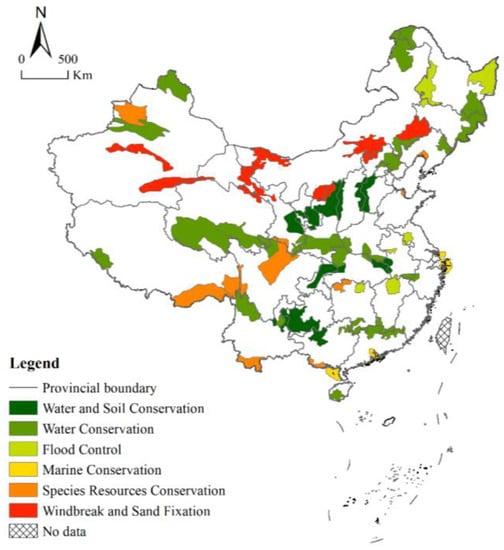
Figure 1.
Distribution of ecological function areas in China.
2.3. Methods
2.3.1. Research Framework
To examine the impact of ecological function zoning on regional land use and cover change, we utilized the 2011–2020 Chinese land cover dataset (30 m) to analyze the spatial and temporal characteristics of such changes within ecological function areas (Figure 2). Our analysis encompassed two main aspects. Firstly, we quantified the extent of land use and cover change by calculating the cumulative rate of change and the frequency of change for each land cover type based on ArcGIS. Secondly, employing a land use transfer matrix, we conducted a comprehensive analysis of land cover type transformations based on pixel scale. Ultimately, we summarized the overall influence of ecological function zoning on land use and cover change.
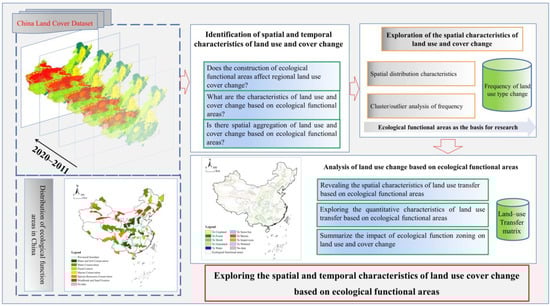
Figure 2.
Research framework.
2.3.2. Quantification of Land Use and Cover Change
The quantification of land use and cover change is essential for understanding the current state and assessing the impact of ecological function areas on these changes. To achieve this objective, we performed the following calculations and assessments:
- Annual Change Rate Calculation: We calculated the annual change rate for each land cover type based on individual pixels. This involved comparing the land cover types between two consecutive time periods and determining the rate of change for each pixel.
- Cumulative Change Rate Calculation: To obtain an overall measure of change, we took the absolute value of each annual change rate and summed them. This resulted in the cumulative change rate, which represents the total extent of change for each land cover type.
- Frequency Assessment of Land Cover Type Changes: We assessed the frequency of land cover type changes by recording occurrences of changes for individual pixels. Whenever land cover type was different between two consecutive time periods, it was considered a single instance of land use and cover change. For example, for pixel A, the land use type is the same in 2000 and 2001 but different in 2001 and 2002, and the land use change frequency is counted as 1. If there was no change in the subsequent period, the land use change frequency in the entire research period is counted as 1. If the land use type was also found to be different in 2010 and 2011, the frequency of change is counted as 2. This allowed us to quantify the frequency of changes for each land cover type. This allowed us to quantify the frequency of changes for each land cover type.
- Examination of Changes within and Outside Ecological Function Areas: We specifically examined the frequency of land cover type changes within and outside the ecological function area from 2011 to 2020. By comparing the rates of change in these two areas, we could analyze the influence of ecological function areas on land cover changes.
By performing these calculations and assessments, we aimed to gain a comprehensive understanding of the extent and frequency of land use and cover changes within and outside ecological function areas and evaluate the impact of these areas on such changes.
2.3.3. Cluster/Outlier Analysis of Land Use and Cover Change
Spatial hotspot analysis is a valuable statistical tool that enables the identification of significant hotspots and coldspots, revealing the spatial clustering patterns of various distributions. In our study, we employed spatial hotspot analysis to identify areas with high frequency of land cover type change (hotspots) and areas with low frequency (coldspots). This analysis allowed us to determine whether regions experiencing frequent land use and cover changes exhibited spatial aggregation. By identifying these hotspot and coldspot areas, we gained insights into the spatial patterns and clustering tendencies of land use and cover change frequency.
2.3.4. Identification of Mutual Land Use and Cover Change Transfer
The identification of land use and cover change is mainly based on the land use transfer matrix, which plays a crucial role in identifying and understanding land use cover changes to obtain the mutual transfer amount of different land use and cover change and then combine the transfer amounts with the spatial location. Specifically, we can analyze the characteristics of land cover type transfers both inside and outside the ecological function area. This analysis enables us to deduce the impact of ecological function areas on land cover. Through this research, we can gain insights into the dynamics of land use and cover changes within and outside the ecological function area and draw conclusions about the influence of establishing ecological function areas on land cover patterns.
3. Results
3.1. Land Use and Cover Change Characteristics Based on Ecological Function Area
We have conducted a comprehensive analysis of the land cover type structure on an annual basis and calculated the average values from 2011 to 2020. The statistical findings of the average land cover types within and outside the ecological function area unveil distinctive differences in their characteristics (Figure 3). Within the ecological function area, forest land and grassland collectively account for approximately 67% of the total area, establishing them as the dominant land cover types. Cropland and barren land closely follow, constituting roughly 30% of the area within the zone. The remaining land types, including shrubs, water, snow and ice, impervious surfaces, and wetlands, comprise approximately 3% of the area within the zone.
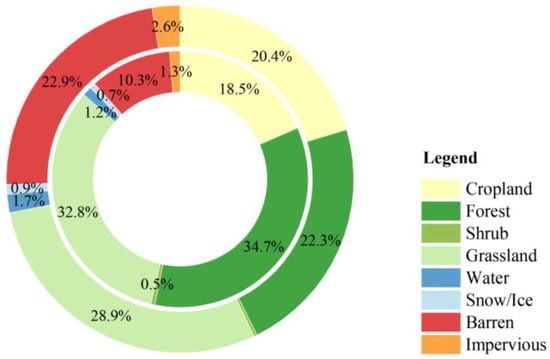
Figure 3.
The average value of land cover types structure from 2011 to 2020 inside and outside the ecological function area (the inner circle indicates the average proportion of land types inside the ecological function area, and the outer circle indicates the average proportion of land types outside the ecological function area). The proportion of wetlands is relatively small, so it is not displayed in the figure.
In contrast, outside the ecological function area, grasslands encompass the largest proportion, representing 28.9% of the overall study area. Barren land, forest land, and cropland exhibit comparable proportions, collectively comprising approximately 65% of the area. The remaining land types account for approximately 5% of the area outside the zone.
The cumulative rate of land use and cover change is determined by aggregating the annual rates of change. Consequently, generating a cumulative change map of land use areas serves as an effective approach to visually depict the intensity of land use and cover change within the study area (Figure 4). The intensity of land use and cover change exhibits variations between the ecological function area and areas outside it.
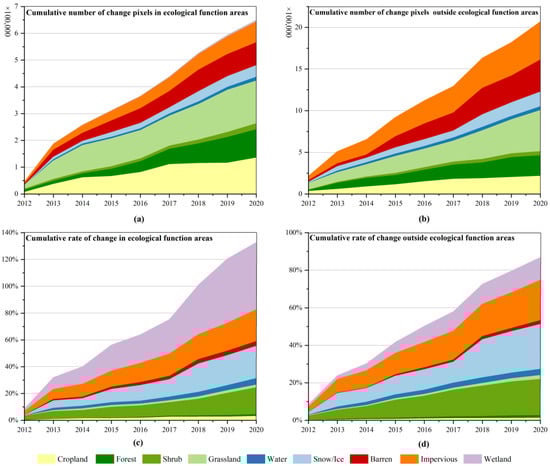
Figure 4.
Cumulative changes of land cover inside and outside the ecological function area. (a,b) Are the cumulative number of change pixels inside and outside ecological function areas, respectively, and (c,d) is the rate of the cumulative change inside and outside ecological function areas, respectively.
Within the ecological function area, the most notable relative cumulative change is observed in wetlands due to the small area, followed by ice, snow, and shrubs. Impervious surfaces show a strong cumulative rate of change with a larger cumulative number of change pixels. Barren land, forest, grassland, and cropland, on the other hand, demonstrate a low cumulative change rate, indicating a relatively stable condition due to their large proportion in the whole land use type.
In contrast, outside the ecological function area, the most substantial relative change is witnessed in ice and snow, followed by impervious surfaces, highlighting the prominent role and influence of human activities on land cover types, and the next are shrubs, wetlands. Barren land, forest, grassland, and cropland also have a low cumulative change rate which is due to a similar reason as the land cover types in the ecological function areas.
3.2. Land Volatility Based on Ecological Function Area
The assessment of land volatility involved calculating the frequency of changes for each pixel (30 m). The frequency of change ranges from 0 to 2. It becomes apparent that the majority of pixels did not undergo a change in land type during the study period, with only 8.1% of the total pixels experiencing changes (Table 1). Among these changed pixels, the highest frequency observed was two times, indicating that these image elements underwent two land cover type changes, demonstrating strong land volatility.

Table 1.
Frequency of land pixel changes based on ecological function areas.
Overall, significant land fluctuations are observed in central, northern, northwestern (excluding desert areas), and northeastern China (Figure 5). Additionally, notable differences exist in the frequency of land use and cover changes based on ecological function areas. Specifically, land use and cover change pixels within the ecological function areas account for 8.5% of the total pixels in those zones, with the majority of changed pixels concentrated in the ecological function areas in central and northeastern China, as well as some southeastern regions. In contrast, land use and cover change pixels outside the ecological function areas only account for 7.9% of the total pixels.
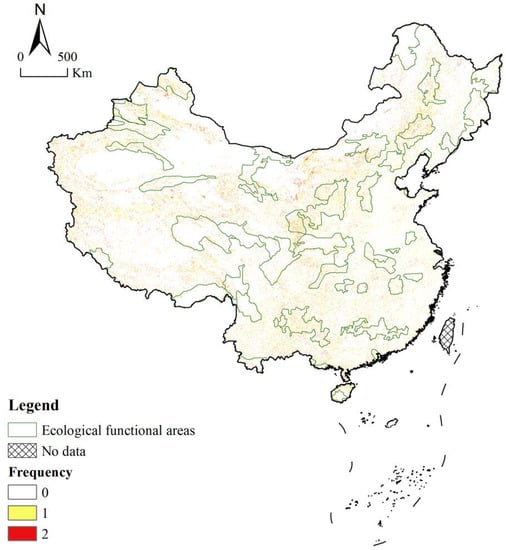
Figure 5.
Frequency of land cover type changes based on ecological function areas. The green line is the boundary of ecological function areas; if the frequency is displayed in the green circle, it indicates that the event occurred in the ecological function areas.
3.3. Cluster/Outlier Analysis of Frequency
The frequency of land cover type change in the study area displays distinct characteristics of spatial aggregation. To further analyze the spatial distribution, coldspot and hotspot analysis was conducted to assess land cover volatility in China (Figure 6). In general, the hotspot areas, with 99% confidence intervals for land use and cover change, are primarily concentrated in the northeastern, southwestern, and central regions of China. Conversely, the coldspot areas, also with 99% confidence intervals, are mainly found in the western and certain northeastern regions of China. Most of the hotspot areas are located outside the ecological function areas, but there are some hotspot areas that demonstrate a high spatial overlap with the ecological function areas. Notably, there is a significant spatial aggregation of land use fluctuations within the ecological function reserves for wind and sand control in the northeast and soil and water conservation in the central and southwest regions. Hotspots and coldspots with 90–95% confidence intervals are distributed around the hotspots and coldspots with 99% confidence intervals, and these areas also exhibit some degree of spatial aggregation, albeit to a lesser extent.
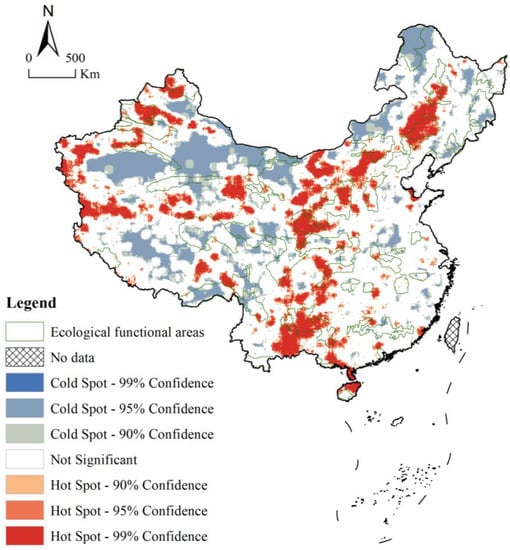
Figure 6.
Analysis of coldspots and hotspots of land cover type change frequency.
3.4. Changes of Land Cover Types Based on Ecological Function Areas
The study area demonstrates diverse inter-conversions among land cover types, accompanied by spatial variations from 2011 to 2020 (Figure 7). Specifically, conversions to forest, shrub, and grassland are predominantly observed in the northeastern, central, and southwestern regions of China. Conversions to barren land are mainly concentrated in the northwestern and Qinghai–Tibet Plateau regions, while conversions to impervious surfaces are primarily found in the eastern regions of China. These spatial patterns align with the observed conditions on the ground. Taking a comprehensive perspective, a noticeable east–west divergence in land cover type changes is evident. In the eastern and southern parts of China, land cover types tend to transition toward forest, grassland, shrub, cropland, and impervious surfaces. In contrast, in the western and northern regions, the predominant transitions occur toward barren land and grassland.
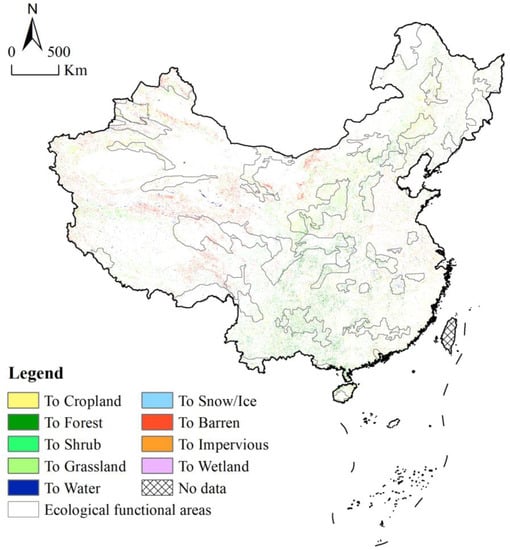
Figure 7.
Transformation distribution of different land cover types based on ecological function areas. Specifically, cropland means that other land use types are converted to cropland, and forest means that other types are converted to forest, and so on.
The area of land cover type change within the ecological function area was 153,200.52 km2, accounting for 7.20% of the total area (Figure 8). Throughout the study period, various inter-conversions were observed among all land cover types. Among them, the largest transformation area within the ecological function area occurred in grassland, accounting for 34.08% of the changes, and it primarily transformed into cropland, barren land, and forest. Within the ecological function area, the area of wetland experienced the most significant increase, with a growth rate of 36.28%. In contrast, outside the ecological function area, the increase in wetland area was only 8.23%, further demonstrating the effectiveness of ecological function area construction in wetland protection. Within the ecological function area, 34.2 km2 of impervious surface was transformed into cropland, representing 0.13% of the total impervious surface area. Comparatively, outside the ecological function area, only 132.39 km2 of impervious surface was transformed into cropland, accounting for just 0.07% of the area outside the zone. Cropland exhibited the highest increase in land area both inside and outside the ecological function area, with respective increments of 47,522.16 km2 and 134,952.84 km2. Within the ecological function area, forest land experienced a higher increase, reaching 29,400.21 km2, while outside the ecological function area, the area of barren land increased by 89,324.55 km2, ranking third in terms of land type expansion.
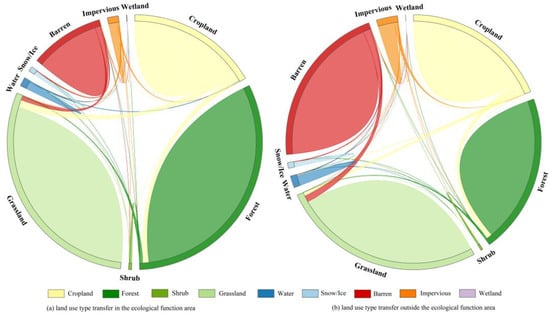
Figure 8.
Land cover transformation types from 2011 to 2020. (a,b) Respectively indicate the land use type transfer within and outside the ecological function area.
4. Discussion and Conclusions
4.1. Discussion
Land use cover change is undeniably influenced by anthropogenic activities, and the magnitude of its changes often correlates with the level of human activity [46]. The investigation of land use and cover change is of paramount importance for land conservation and sustainable land utilization, as it unveils the impact of human activities on the natural environment. The establishment of ecological function areas aims to safeguard and restore global biodiversity, and evaluating their effectiveness and feasibility necessitates an examination of the disparities in land use and cover changes inside and outside these designated zones. Therefore, the principal objective of this study is to generate a comprehensive map illustrating the land use and cover changes in China from 2011 to 2020 and analyze the influence of ecological function areas on such changes. This analysis aims to ensure and enhance the efficacy and reliability of establishing ecological function areas.
Significant disparities exist in the land cover structure between ecological function areas and non-ecological function areas. Within the ecological function area, forest and grassland dominate the land cover types, collectively accounting for 67% of the total coverage. In contrast, outside the ecological function area, barren land is more prevalent alongside forest and grassland. Notably, the presence of impervious surfaces, closely associated with human activities, is significantly higher outside the ecological function area compared to within, with nearly double the amount observed. This divergence can be attributed to the ecological functions fulfilled by the designated ecological function areas. The cumulative land use and cover change rates, as well as the count of changed pixels, obtained by aggregating the annual land use and cover change rates and pixel counts, effectively elucidate the characteristics of land use and cover change both within and outside the ecological function areas. Forest land experiences the least change within the ecological function area, remaining in a highly stable state. Conversely, outside the ecological function area, cropland exhibits the least change, likely due to the implementation of China’s cultivated land protection policy.
Further analysis entailed the calculation of the frequency of land use and cover change at the pixel level, which revealed that only approximately 8.1% of land cover pixels underwent changes during the study period. Certain regions exhibited a frequency of land use and cover change reaching 2, indicating spatial clustering tendencies. The central and western regions of China possess a considerable proportion of grassland and barren land, and these two land types are prone to mutual conversions, leading to frequent fluctuations in land use. In the eastern regions, land use patterns are influenced by farmland protection policies, resulting in a relatively stable quantity of cultivated land. Meanwhile, there is an increasing trend in construction land use instead of extensive fluctuations. The number of high-frequency land use and cover change pixels within the ecological function area was half that of the non-ecological function area, underscoring significant disparities in land use and cover change dynamics.
The research findings reveal noteworthy spatial variations in the transformations between different land cover types. The conversions of pixels to forest land, shrubs, and grassland were predominantly concentrated in the northeast, central, and southwest regions of China. In contrast, conversions to barren land were mainly observed in the northwest and Qinghai–Tibet Plateau region. Furthermore, the transformations into impervious surfaces were predominantly observed in the eastern part of the country, aligning with the anticipated outcomes. The northeast, central, and southwestern regions have emerged as vital areas for ecological function protection in China, serving as crucial barriers. On the other hand, the northwest and Qinghai–Tibet Plateau regions, influenced by local natural and geographical conditions, are susceptible to desertification. The eastern part of the country, being at the forefront of economic development, has witnessed substantial human activities and witnessed significant transformations into impervious surfaces. Taking into consideration the role of ecological function areas, the conversion of grassland areas is the most prominent both inside and outside these designated zones. Within the ecological function area, grassland primarily converts into cropland and forest, while outside the area, it predominantly transforms into barren land and cropland. This can be attributed to the accessibility and comparatively lower restrictions associated with grassland, which plays a dominant role in overall land use and cover change. Conversely, cropland, being a vital protected land type, bears a significant portion of land use and cover change. Over the course of the study period, the largest increase was observed in cropland, with an expansion of 47,522.16 km2 within the ecological function area and 134,952.84 km2 outside it. Moreover, the expansion of impervious surfaces within the ecological function area amounted to 7447.32 km2, while outside the zone, it reached 43,066.26 km2. Notably, within the ecological function area, only 0.13% of impermeable surfaces underwent conversion into cropland, in contrast to a mere 0.07% observed outside the zone. This indicates that China has effectively restricted construction activities within the ecological reserves, thereby reinforcing their preservation.
4.2. Conclusions
Our study further corroborates the influence of establishing ecological function areas on land fluctuations and land use and cover changes, in line with previous research findings [45]. Both land fluctuations and land use and cover changes are fundamentally driven by human activities and naturally exhibit spatial aggregation effects. As a human-driven framework guiding land use, ecological function areas inevitably impact land use and cover changes. Our research confirms that the establishment of ecological function areas effectively reduces the rate and intensity of land use and cover change, diminishes the frequency of such changes, and preserves and ensures ecosystem stability. Additionally, it significantly influences the types of land conversions, promoting a shift toward ecologically function land cover types within the ecological function area while reducing ecologically destructive land cover types.
Furthermore, our study identifies spatial variations in land use and cover change, particularly in the eastern, central, and western regions of China, including variations in the conversion processes. Future studies can expand upon these findings by considering the specific types of different ecological function areas, enabling a more comprehensive examination of land use and cover changes in various regions. This would contribute to further advancements in the research and development of ecological function areas.
4.3. Limitations and Uncertainties
We conducted an examination of land use and cover changes within and outside China’s ecological function areas at the pixel scale to shed light on the role of these ecological function areas in the land use and cover change process. Distinguishing itself from previous research, this paper quantifies and visualizes the overall changes and intensities of land cover in China, as well as the year-by-year intensity of land use and cover change at the pixel level. We analyze the aggregation effect and transfer paths of land use and cover change while incorporating China’s ecological function areas, aiming to explore the differences in intensity and pathways of land use and cover change within and outside these ecological function areas. It is worth noting that the final results of this study may be influenced to some extent by the accuracy of remote sensing image interpretation. However, given the large scale of the study, any minor errors would not significantly impact the overall trends revealed by the research findings. Therefore, the analysis avoids relying on specific numerical changes and instead focuses on highlighting the typical characteristics of land use and cover change.
While the majority of the discussion in this paper is based on theoretical conditions, emphasizing the differences in intensity and land cover conversion between land use and cover changes inside and outside the function areas, it is important to acknowledge the impact mechanisms of natural conditions, economic conditions, and local policies on land use and cover change. These factors play a crucial role in supporting the research conclusions. For instance, the variations in economic development levels and land development maturity between the eastern and western regions of China naturally give rise to different paths and frequencies of land use and cover change. Future research should consider the similarities and differences in land use and cover changes influenced by policies, production methods, economic development levels, natural conditions, and even different types of function areas. This approach will make the research results more realistic, reasonable, and applicable for managing ecological function areas. Although the conditions of this study may not be universally applicable, they hold practical significance in understanding the intensity of land use and cover change in China’s ecological function areas and the factors that differentiate land use and cover changes inside and outside these areas. Therefore, this study is expected to complement existing knowledge and provide recommendations for land use management.
Author Contributions
Conceptualization, Y.R.; methodology, Y.R.; software, Y.W.; validation, H.Z. and Y.R.; formal analysis, Y.W. and Y.R.; investigation, Y.R.; resources, Y.R.; data curation, Y.W.; writing—original draft preparation, Y.W.; writing—review and editing, Y.R.; visualization, Y.R.; supervision, Y.R. and H.Z.; project administration, H.Z.; funding acquisition, Y.R. All authors have read and agreed to the published version of the manuscript.
Funding
This research was funded by the National Natural Science Foundation of China (grant number 42101268) and Fundamental Research Funds for the Central Universities in Sichuan University, 2023.
Data Availability Statement
No new data were created in this study. Data sharing is not applicable to this article.
Acknowledgments
The authors are grateful to the anonymous reviewers for their comments and suggestions that contributed to the further improvement of this paper.
Conflicts of Interest
The authors declare no conflict of interest.
References
- Sterling, S.M.; Ducharne, A.; Polcher, J. The impact of global land-cover change on the terrestrial water cycle. Nat. Clim. Chang. 2013, 3, 385–390. [Google Scholar] [CrossRef]
- Rao, Y.H.; Zhang, J.J.; Wang, K.; Jepsen, M.R. Understanding land use volatility and agglomeration in northern Southeast Asia. J. Environ. Manag. 2021, 278, 111536. [Google Scholar] [CrossRef] [PubMed]
- Dai, L.L.; Zhan, Z.X.; Shu, Y.S.; Rong, X. Land Use Change in the Cross-Boundary Regions of a Metropolitan Area: A Case Study of Tongzhou-Wuqing-Langfang. Land 2022, 11, 153. [Google Scholar] [CrossRef]
- Bai, Y.; Ochuodho, T.O.; Yang, J. Impact of land use and climate change on water-related ecosystem services in Kentucky, USA. Ecol. Indic. 2019, 102, 51–64. [Google Scholar] [CrossRef]
- Ghulam, A. Monitoring Tropical Forest Degradation in Betampona Nature Reserve, Madagascar Using Multisource Remote Sensing Data Fusion. IEEE J. Sel. Top. Appl. Earth Obs. Remote Sens. 2014, 7, 4960–4971. [Google Scholar] [CrossRef]
- Chang, S.Z.; Zhao, J.; Jia, M.M.; Mao, D.H.; Wang, Z.M.; Hou, B.Y. Land Use Change and Hotspot Identification in Harbin-Changchun Urban Agglomeration in China from 1990 to 2020. Isprs Int. J. Geo-Inf. 2023, 12, 80. [Google Scholar] [CrossRef]
- Yu, G.T.; Liu, T.W.; Wang, Q.; Li, T.; Li, X.J.; Song, G.H.; Feng, Y.G. Impact of Land Use/Land Cover Change on Ecological Quality during Urbanization in the Lower Yellow River Basin: A Case Study of Jinan City. Remote Sens. 2022, 14, 6273. [Google Scholar] [CrossRef]
- Smith, P.; House, J.I.; Bustamante, M.; Sobocka, J.; Harper, R.; Pan, G.X.; West, P.C.; Clark, J.M.; Adhya, T.; Rumpel, C.; et al. Global change pressures on soils from land use and management. Glob. Chang. Biol. 2016, 22, 1008–1028. [Google Scholar] [CrossRef]
- Zhang, F.; Kung, H.T.; Johnson, V.C. Assessment of Land-Cover/Land-Use Change and Landscape Patterns in the Two National Nature Reserves of Ebinur Lake Watershed, Xinjiang, China. Sustainability 2017, 9, 724. [Google Scholar] [CrossRef]
- Wang, Y.; Lin, N.F.; Gao, J.X.; Zou, C.X.; Xu, D.L. Impacts of China’s Western Development and Protection Strategy: An Ecosystem Services Perspective of Western China. Divers 2022, 14, 863. [Google Scholar] [CrossRef]
- Qiao, F.W.; Bai, Y.P.; Xie, L.X.; Yang, X.D.; Sun, S.S. Spatio-Temporal Characteristics of Landscape Ecological Risks in the Ecological Functional Zone of the Upper Yellow River, China. Int. J. Environ. Res. Public Health 2021, 18, 12943. [Google Scholar] [CrossRef]
- Alkama, R.; Cescatti, A. Biophysical climate impacts of recent changes in global forest cover. Science 2016, 351, 600–604. [Google Scholar] [CrossRef] [PubMed]
- Peter, A.; Mujuru, M.; Dube, T. An assessment of land cover changes in a protected nature reserve and possible implications on water resources, South Africa. Phys. Chem. Earth 2018, 107, 86–91. [Google Scholar] [CrossRef]
- Jahanishakib, F.; Salmanmahiny, A.; Mirkarimi, S.H.; Poodat, F. Hydrological connectivity assessment of landscape ecological network to mitigate development impacts. J. Environ. Manag. 2021, 296, 113169. [Google Scholar] [CrossRef] [PubMed]
- Scott, J.M.; Davis, F.W.; McGhie, R.G.; Wright, R.G.; Groves, C.; Estes, J. Nature reserves: Do they capture the full range of America’s biological diversity? Ecol. Appl. 2001, 11, 999–1007. [Google Scholar] [CrossRef]
- Scharlemann, J.P.W.; Tanner, E.V.J.; Hiederer, R.; Kapos, V. Global soil carbon: Understanding and managing the largest terrestrial carbon pool. Carbon Manag. 2014, 5, 81–91. [Google Scholar] [CrossRef]
- Yu, H.Y.; Zhang, F.; Kung, H.T.; Johnson, V.C.; Bane, C.S.; Wang, J.; Ren, Y.; Zhang, Y. Analysis of land cover and landscape change patterns in Ebinur Lake Wetland National Nature Reserve, China from 1972 to 2013. Wetl. Ecol. Manag. 2017, 25, 619–637. [Google Scholar] [CrossRef]
- Woodwell, G.M.; Hobbie, J.E.; Houghton, R.A.; Melillo, J.M.; Moore, B.; Peterson, B.J.; Shaver, G.R. Global deforestation-contribution to atmospheric carbon-dioxide. Science 1983, 222, 1081–1086. [Google Scholar] [CrossRef] [PubMed]
- Houghton, R.A.; Nassikas, A.A. Global and regional fluxes of carbon from land use and land cover change 1850-2015. Glob. Biogeochem. Cycles 2017, 31, 456–472. [Google Scholar] [CrossRef]
- Yuan, K.Y.; Li, F.; Yang, H.J.; Wang, Y.M. The Influence of Land Use Change on Ecosystem Service Value in Shangzhou District. Int. J. Environ. Res. Public Health 2019, 16, 1321. [Google Scholar] [CrossRef]
- Tan, L.; Luo, W.; Yang, B.; Huang, M.; Shuai, S.; Cheng, C.X.; Zhou, X.; Li, M.N.; Hu, C.W. Evaluation of landscape ecological risk in key ecological functional zone of South-to-North Water Diversion Project, China. Ecol. Indic. 2023, 147, 109934. [Google Scholar] [CrossRef]
- Danish; Baloch, M.A.; Mahmood, N.; Zhang, J.W. Effect of natural resources, renewable energy and economic development on CO2 emissions in BRICS countries. Sci. Total Environ. 2019, 678, 632–638. [Google Scholar] [CrossRef]
- Ling, G.; Razzaq, A.; Guo, Y.Q.; Fatima, T.; Shahzad, F. Asymmetric and time-varying linkages between carbon emissions, globalization, natural resources and financial development in China. Environ. Dev. Sustain. 2022, 24, 6702–6730. [Google Scholar] [CrossRef] [PubMed]
- He, L.; Shen, J.; Zhang, Y. Ecological vulnerability assessment for ecological conservation and environmental management. J. Environ. Manag. 2018, 206, 1115–1125. [Google Scholar] [CrossRef] [PubMed]
- Zhang, Z.J.; Zhang, Y.J.; Yu, X.; Lei, L.P.; Chen, Y.Q.; Guo, X.D. Evaluating Natural Ecological Land Change in Function-Oriented Planning Regions Using the National Land Use Survey Data from 2009 to 2018 in China. Isprs Int. J. Geo-Inf. 2021, 10, 172. [Google Scholar] [CrossRef]
- Yang, N.; Mo, W.B.; Li, M.H.; Zhang, X.; Chen, M.; Li, F.; Gao, W.C. A Study on the Spatio-Temporal Land-Use Changes and Ecological Response of the Dongting Lake Catchment. Isprs Int. J. Geo-Inf. 2021, 10, 716. [Google Scholar] [CrossRef]
- Zhang, X.Y.; Li, S.S.; Yu, H. Analysis on the ecosystem service protection effect of national nature reserve in Qinghai-Tibetan Plateau from weight perspective. Ecol. Indic. 2022, 142, 109225. [Google Scholar] [CrossRef]
- Wu, H.; Fang, S.M.; Yang, Y.Y.; Cheng, J. Changes in habitat quality of nature reserves in depopulating areas due to anthropogenic pressure: Evidence from Northeast China, 2000–2018. Ecol. Indic. 2022, 138, 108844. [Google Scholar] [CrossRef]
- Leverington, F.; Costa, K.L.; Pavese, H.; Lisle, A.; Hockings, M. A Global Analysis of Protected Area Management Effectiveness. Environ. Manag. 2010, 46, 685–698. [Google Scholar] [CrossRef]
- Laurance, W.F.; Useche, D.C.; Rendeiro, J.; Kalka, M.; Bradshaw, C.J.A.; Sloan, S.P.; Laurance, S.G.; Campbell, M.; Abernethy, K.; Alvarez, P.; et al. Averting biodiversity collapse in tropical forest protected areas. Nature 2012, 489, 290–294. [Google Scholar] [CrossRef]
- LaRoe, J.; Holmes, C.M.; Schad, T. Nightlight Intensity Change Surrounding Nature Reserves: A Case Study in Orbroicher Bruch Nature Reserve, Germany. Remote Sens. 2022, 14, 3876. [Google Scholar] [CrossRef]
- Hansen, A.J.; DeFries, R. Ecological mechanisms linking protected areas to surrounding lands. Ecol. Appl. 2007, 17, 974–988. [Google Scholar] [CrossRef] [PubMed]
- Wan, L.H.; Zhang, Y.W.; Zhang, X.Y.; Qi, S.Q.; Na, X.D. Comparison of land use/land cover change and landscape patterns in Honghe National Nature Reserve and the surrounding Jiansanjiang Region, China. Ecol. Indic. 2015, 51, 205–214. [Google Scholar] [CrossRef]
- Rescia, A.J.; Willaarts, B.A.; Schmitz, M.F.; Aguilera, P.A. Changes in land uses and management in two Nature Reserves in Spain: Evaluating the social-ecological resilience of cultural landscapes. Landsc. Urban Plan. 2010, 98, 26–35. [Google Scholar] [CrossRef]
- Peng, J.; Pan, Y.J.; Liu, Y.X.; Zhao, H.J.; Wang, Y.L. Linking ecological degradation risk to identify ecological security patterns in a rapidly urbanizing landscape. Habitat Int. 2018, 71, 110–124. [Google Scholar] [CrossRef]
- Immerzeel, B.; Vermaat, J.E.; Juutinen, A.; Pouta, E.; Artell, J. Appreciation of Nordic landscapes and how the bioeconomy might change that: Results from a discrete choice experiment. Land Use Policy 2022, 113, 105909. [Google Scholar] [CrossRef]
- Wu, J.; Gong, Y.Z.; Wu, J.J. Spatial distribution of nature reserves in China: Driving forces in the past and conservation challenges in the future. Land Use Policy 2018, 77, 31–42. [Google Scholar] [CrossRef]
- Hagen, E.O.; Hagen, O.; Ibanez-Alamo, J.D.; Petchey, O.L.; Evans, K.L. Impacts of Urban Areas and Their Characteristics on Avian Functional Diversity. Front. Ecol. Evol. 2017, 5, 84. [Google Scholar] [CrossRef]
- Abulizi, A.; Yang, Y.G.; Mamat, Z.; Luo, J.H.; Abdulslam, D.; Xu, Z.L.; Zayiti, A.; Ahat, A.; Halik, W. Land-Use Change and its Effects in Charchan Oasis, Xinjiang, China. Land Degrad. Dev. 2017, 28, 106–115. [Google Scholar] [CrossRef]
- Liu, Y.J.; Zou, X.T.; Chen, J.; Pan, T. Impacts of protected areas establishment on pastoralists’ livelihoods in the Three-River-Source Region on the Qinghai-Tibetan Plateau. Land Use Policy 2022, 115, 10. [Google Scholar] [CrossRef]
- Dai, L.M.; Wang, Y.; Lewis, B.J.; Xu, D.; Zhou, L.; Gu, X.P.; Jiang, L.H. The trend of land-use sustainability around the Changbai Mountain Biosphere Reserve in northeastern China: 1977–2007. Int. J. Sustain. Dev. World Ecol. 2012, 19, 369–377. [Google Scholar] [CrossRef]
- Chang, Y.; Chang, C.; Li, Y.X.; Liu, M.; Lv, J.J.; Hu, Y.M. Predicting Dynamics of the Potential Breeding Habitat of Larus saundersi by MaxEnt Model under Changing Land-Use Conditions in Wetland Nature Reserve of Liaohe Estuary, China. Remote Sens. 2022, 14, 552. [Google Scholar] [CrossRef]
- Borgstrom, S.; Cousins, S.A.O.; Lindborg, R. Outside the boundary-Land use changes in the surroundings of urban nature reserves. Appl. Geogr. 2012, 32, 350–359. [Google Scholar] [CrossRef]
- Yang, J.; Huang, X. The 30 m annual land cover dataset and its dynamics in China from 1990 to 2019. Earth Syst. Sci. Data 2021, 13, 3907–3925. [Google Scholar] [CrossRef]
- Wang, Y.J.; Rao, Y.H.; Zhu, H.B. Revealing the Impact of Protected Areas on Land Cover Volatility in China. Land 2022, 11, 1361. [Google Scholar] [CrossRef]
- Winkler, K.; Fuchs, R.; Rounsevell, M.; Herold, M. Global land use changes are four times greater than previously estimated. Nat. Commun. 2021, 12, 2501. [Google Scholar] [CrossRef]


Disclaimer/Publisher’s Note: The statements, opinions and data contained in all publications are solely those of the individual author(s) and contributor(s) and not of MDPI and/or the editor(s). MDPI and/or the editor(s) disclaim responsibility for any injury to people or property resulting from any ideas, methods, instructions or products referred to in the content. |
© 2023 by the authors. Licensee MDPI, Basel, Switzerland. This article is an open access article distributed under the terms and conditions of the Creative Commons Attribution (CC BY) license (https://creativecommons.org/licenses/by/4.0/).