Abstract
The reproduction suitability of urban birds reflects the health status and service level of urban ecosystems. Therefore, studying the relationship between the nest density of urban birds and environmental factors has certain reference significance for guiding green space management. In this study, 67 green spaces of Liupanshui city in the Wumeng Mountain Area were selected as study sites. Through the statistics of the number of bird’s nests in the plots in 2020, a stepwise regression analysis was conducted on 10 environment-influencing factors. The results show that the nest density of birds in urban green space is not significantly correlated with the plot size, noise, light pollution, vegetation diversity, proportion of paved land, proportion of native plants, or distance from water body, but is significantly correlated with the canopy coverage of arbor, spatial openness, and distance from non-artificial environment to plot. The research identified the environmental factors affecting nest density, and frames a method to compare the density of bird’s nests in urban green space. Based on this, strategies for the construction and management of green space are put forward, so as to provide reference for ecological city construction and alleviate the correlation between the expansion of urban construction land and the deterioration of bird habitats.
1. Introduction
Some investigations have shown that the richness and quantity of birds are gradually decreasing with the acceleration of urbanization [1]. In recent years, with the spread and expansion of cities and the promotion of urban and rural construction, reinforced concrete has occupied former forest land, and cultivated land has swallowed a large amount of native vegetation. Crisscross roads, railways, and rural roads have gradually led to the islanding and fragmentation of the habitat on which wildlife depends, and its diversity and quantity have decreased significantly [2]. The common rabbits, wild boars, elk, and pheasants in the Wumeng Mountain Area in China in the 1980s have now disappeared. Birds, although their number has decreased a lot, are now the most common wild animals [3]. Some omnivorous birds have gradually adapt to the semi-artificial environment and choose to live together with humans in the city and the junctions of urban and rural areas, becoming urban birds. Birds are one of the most disturbed species in the process of urbanization, as they are extremely sensitive to habitat and environmental changes [4,5]. In urban and rural planning, construction, and management, the gradual strengthening of ecological awareness has urged people to start looking for various methods to coexist harmoniously with birds [6]. Birds have become one of the most important indicator species in urban ecosystems [7]. Therefore, creating an urban habitation suitable for the reproduction of birds is bound to become one of the standards to measure the quality of urban ecological construction.
The habitat suitability for bird breeding refers to the degree to which a specific habitat provides suitable conditions and resources for bird species to successfully breed and reproduce [8]. It assesses the suitability of an environment based on various factors such as food availability, nesting sites, vegetation structure, water sources, and other habitat characteristics that directly influence the reproductive success of bird populations. This study takes the spatial factors of green space that may affect bird breeding as its research object according to the breeding habits of urban birds, and analyzes the relationship between the nest density of urban birds and green space spatial elements through field research, aiming to find out the factors that affect nest density in green space, provide a basis for the construction and managements of green space, and promote the rationality of urban land layout, creating a harmonious urban environment for people and birds to alleviate the correlation between the expansion of urban construction land and the deterioration of bird habitats
2. Overview of the Region of Study
The Wumeng Mountain Area is located between longitude 103°10′–103°30′ E and latitude 25°20′–27°45′ N, with an average elevation of about 2500 m, and it is the largest karst continuous belt in the world [9]. The climate, geography, and agricultural natural resources in the Wumeng Mountains differ significantly, with dense forests distributed in 38 counties of the Sichuan, Guizhou, and Yunnan provinces (Figure 1). The total land area is 107,000 square kilometers, and the total population is about 23 million people. Common urban birds in this area mainly include Great Tit (Parus major), Daurian Redstart (Phoenicurus auroreus), Sparrow (Passer montanus), Willow Warbler (Phylloscopus inornatus), Japanese White-Eye (Zosterops japonicus), Shrike (Lanius), White Wagtail (Motacilla alba), Swallow (Hirundo rustica), Crow (Corvus sp.), etc.
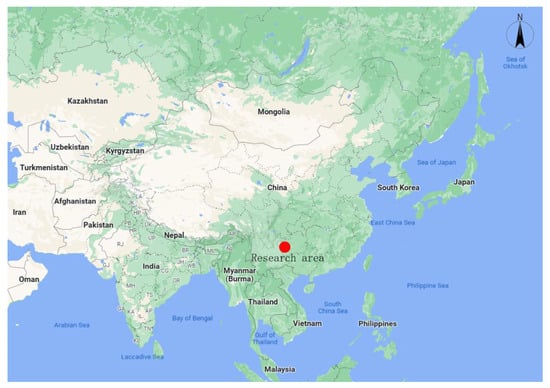
Figure 1.
Location Map of Liupanshui City.
Liupanshui is one of the four major cities in the Wumeng Mountain Area, the urban permanent population is 750,000, and it belongs to the north subtropical plateau mountain monsoon humid climate area, with an altitude of 1760–1820 m. The intersection of the city and the mountains forms a typical ecotone of natural environment and artificial environment due to many peaks and steep mountains which greatly limit the expansion and spread of the city [10], which provides diversified habitats for urban birds [11]. The study area is about 40 square kilometers, it is a typical ribbon city, and is about 13 km long from east to west and only 7 km wide from north to south (Figure 2); the green space rate is 33.77%. Due to the large number of natural mountains on the north and south sides, and the river running through the middle of the city, rich and diverse green spaces have been formed. It is an ideal place to study the perfect integration of city and environment, man and nature.
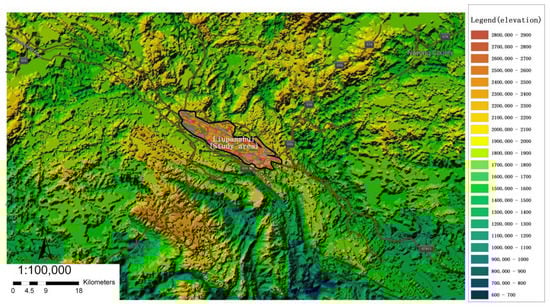
Figure 2.
Schematic diagram of the study area and surrounding terrain.
3. Research Methods
Urban habitat is completely different from natural habitat, with the characteristics of being multi-boundary, high heterogeneity, island or fragmentation, and frequent human interference, which has significantly changed the composition, structure, distribution, reproduction, and nesting mode of Urban Bird Community [12]. The response of bird breeding changes to urbanization is still unclear [13]. From the current research, it can be inferred that factors affecting urban bird breeding may include the building density level [14], building height [15,16], green space size [17], connectivity of green spaces [18], proportion of native plants [19], vegetation diversity [20], noise [21], light pollution [22], water body [23], and vertical structure of habitat [24,25].
This study adopts the above 10 factors as independent variables and the density of bird nests in green spaces as a dependent variable. Combining remote sensing image interpretation methods (Table 1) with field investigation methods, based on the satellite imagery map and the current land layout of Liupanshui in 2020, all green land plots have been taken as samples, that is, the land partially or completely covered by grass, trees, shrubs, or other vegetation in the city, including urban parks and community gardens [26]. Firstly, the research team translated the above 10 factors that affect bird reproduction into easily measurable indicators, then conducted field research from 12 March to 12 May 2020, mainly consisting of the following three steps:

Table 1.
Parametric statistics table of the remote sensing imagery.
- (1)
- Conduct on-site research and measurement on the spatial factors of the plot;
- (2)
- Divide the research team into four groups to search for bird nests in the green space and record them;
- (3)
- Select bird nests for which cameras are easy to install for 24 h observation and recording.
Finally, a database was established and the SPSS17.0 software was used to do a correlation analysis for determining the spatial factors that affect nest density, regression analysis was conducted to determine the impact intensity of each factor, thus establishing a nest-density prediction model with these factors and their weightage. The next year (from 1 March to 1 May 2021), we took 10 greenbelts in the north of Xuanwei City as the research objects and conducted the research in the same way, and then compared the survey results with the predicted result of the model to verify the accuracy of the model.
4. Data Collection and Processing
4.1. Data Collection
- (1)
- Basic data collection
The landsat-8 remote sensing image map with an accuracy of 30 m is obtained through the internet, and the green space is identified and numbered one by one to form 67 research plots scattered in the central urban area of Liupanshui (Figure 3) and 10 verification plots scattered in the central urban area of Xuanwei (Figure 4). The images are processed and put into GIS software for preliminary interpretation.

Figure 3.
Number map of urban green space in Liupanshui City (The numbers in the figure represent the plot number of green space).
Figure 3.
Number map of urban green space in Liupanshui City (The numbers in the figure represent the plot number of green space).


Figure 4.
Number map of verification sites in Xuanwei City (The numbers in the figure represent the plot number of green space).
Figure 4.
Number map of verification sites in Xuanwei City (The numbers in the figure represent the plot number of green space).

- (2)
- Information identification
The location, area, tree coverage, proportion of paved ground, and distance from the surrounding forest land and water bodies are identified through the remote sensing image map as the basic data of the field investigation.
- (3)
- Field survey
According to the steps determined in the research method, the research team use satellite images to number the green spaces in the study area and calculate the area of each plot before March 2021, then research participants are organized to enter the plot to search for bird nests. First, searching for bird nests that are exposed to people’s sight with the naked eye. Second, tracking the parent birds holding dry grass for nesting or food for feeding in mouths, through remote observation, the position of the bird’s nest are discovered when they enter the nest. Then, the location, time, and species of the bird are recorded. After gathering statistics, the following basic data were formed (Table 2):
Table 2.
Statistical table of nest density survey.
4.2. Indicator Conversion
Based on the existing spatial factors used to study green land plots, in order to facilitate on-site measurement and quantification, the study combined the actual situation of the region and transformed the relevant indicators as follows:
- (1)
- Building density level and building height
In order to effectively express the impact of the height and density of buildings surrounding green spaces on the closure and openness of the space, the Spatial Openness (SO) has been adopted to express the openness of the green space [27], that is, the ratio of the height of the building to the distance from the building to the center of the plot multiplied by the ratio of the building length to the site perimeter, and the expression is r = (H/D) × (L/S). D represents the average distance from the center of the plot to the surrounding buildings, H represents the average height of the buildings around the plot, L represents the sum of the lengths of the buildings around the plot, and S represents the perimeter of the plot. The greater the R value, the less open the space, as shown in Figure 5:

Figure 5.
Schematic diagram of space opening calculation.
Figure 5.
Schematic diagram of space opening calculation.

- (2)
- Green space size
The green space size is expressed by subtracting the water area from the total area of the Plot Area (PA). Because the space above the water surface and above the water surface does not have nesting conditions, the water surface area is not included in this study. The scope of the plot is bound by urban roads or buildings, and is expressed in hectares.
- (3)
- Connectivity of green spaces
In landscape ecology, connectivity is the ratio of the total number of nodes between patches to the number of possible nodes, which is applicable to the calculation of connectivity for the entire city or region. There is no relevant basis for calculating the connectivity of a single plot of land. This study takes into account the actual situation of the study area, which is surrounded by large and continuous non-artificial environments such as mountains and forests; therefore, the study adopts the distance from non-artificial environment (DFN) to plot as the measurement indicator for the connectivity of green spaces, which takes the distance between the plot boundary and the boundary of the non-artificial environment, and is expressed in meters. The non-artificial environment refers to continuous farmland, mountains, forests, or wetland with an area of more than one square kilometer.
- (4)
- Proportion of Native Plants (PNP)
Expressed by the proportion of the number of native tree species in the total amount of plants in the plot, the maximum proportion of native plants is 100%, indicating that the plot is a naturally formed forest land.
- (5)
- Vegetation diversity
Due to the fact that the majority of the studied plots are artificially planted green spaces in cities, although there are many plant species in some plots, the number of plants planted may be small or concentrated in a small area, which does not conform to the natural distribution pattern and cannot accurately reflect the breeding environment of birds. Therefore, this study adopts The Shannon Wiener index as a measure of vegetation diversity that quantifies the diversity or evenness of specifications within a community. It is calculated based on the foundation or frequency distribution of different specifications that are present in the community.
The Shannon Wiener index (SW) is quoted to indicate:
where is the number of individuals of all species in the community (within the quadrat), and Pi is the number of the ith species [28].
Due to the large area of the plot, 30 m × 30 m quadrats with concentrated plants are randomly selected in each plot for investigation of the vegetation diversity index of the plot.
- (6)
- Noise (Ni)
The effects of roads on wildlife populations are widespread and well documented. Many studies have shown that bird abundance, occurrence, and species richness are reduced near roads, with the largest reductions where traffic levels are high. Negative correlations have been reported between bird richness/abundance and traffic noise, but the possible causes of road effects are inter-correlated [29]. Therefore, the maximum period of traffic noise in the city (12:00–13:00 Beijing time) is taken as the measurement time, and the Norsonic140 Multifunctional Sound Level meter is used to measure the noise value of the plot at a height of 1.5 m from the ground within 1 m near the Centroid of the plot.
- (7)
- Light Pollution (LP)
Swift(Apus nipalensis) have abnormal response to the artificial illumination range of 5lx–10lx [30]. Therefore, the digital illuminometer CANA-0010 is used to measure all the light source boundaries within the plot at 9 p.m., and the boundary point of 51 Lux is taken as the light source radius to calculate the area of the light source. The area of all light sources with illuminance greater than 51 Lux is summed up, and its proportion in the total area of the plot is taken as the light pollution intensity value of the plot.
- (8)
- The vertical structure of habitat
Habitat structure was found to be the main determinant of nesting height of birds in the urban environment [25]. Due to the location of the study area in a barren alpine region, the ground cover plants are mainly shrubs, and the canopy of arbors is the main factor affecting the habitat. In addition, most of the plots are urban public green spaces, which contain some paved ground for citizens’ activities. Therefore, it is expressed by “canopy coverage of arbor” (CCA) and “proportion of paved ground” (PPG). CCA takes the ratio of the projected area of the canopy layer above 3M high to the plot area, and the maximum canopy coverage of the arbor forest is 100%, indicating that the canopy layer of the arbor completely covers the plot. PPG takes the proportion of paved ground such as squares, roads, building bases, and other impermeable surface as the measurement value. The larger the proportion of paved land, the lower the number and scale of trees in the habitat.
- (9)
- Distance From Water body (DFW)
Distance from water body is expressed by the distance from the nearest river or water body, that is, the distance from the geometric center of the plot to the nearest river and water body (area greater than 100 square meters). If the plot itself contains a water body, the distance is 0 m.
4.3. Data Processing
Based on the 10 relevant indicators proposed in the previous step, the research team first use satellite images for spatial data interpretation and preliminary organization, and then conduct three months of on-site measurement. After summarizing and gathering statistics, the preliminary basic data was obtained (Table 3):
Table 3.
Index table for spatial factors of green space.
5. Results
To unify the standards of the above data, the study carried out descriptive statistical analysis on the PA, PPG, PNP, LP, DFW, SO, DFN, CCA, SW, Ni, and nest density, and it was found that only the nest density, SW, SO, and NI conform to the normal distribution. Therefore, the other seven indicators were standardized by logarithmic transformation to make them conform to normal distribution. Then, the nest density was used as the dependent variable, and the other 10 factors were used as independent variables for correlation analysis and regression analysis. The results are as follows.
5.1. Correlation Analysis among Environmental Factors
The Pearson correlation analysis results show that, among all factors, only PA, SW, and Ni reached significant correlation levels, respectively (Table 4). Therefore, the SW and Ni are excluded in the correlation analysis between nest density and environmental factors.
Table 4.
Results from Pearson correlation analysis.
5.2. Correlation Analysis between Nest Density and Environmental Factors
It can be seen from Table 5 that the correlation between nest density and SO, DFN, and CCA reached a significant level, and the other seven indicators are greater than 0.005, which means that they did not reach a significant level. Therefore, PA, PPG, PNP, LP, and DFW have no impact on nest density, only SO, DFN, and CCA have an impact on nest density and were retained for the subsequent regression analysis.
Table 5.
Results from multiple linear regression analysis.
5.3. Stepwise Regression Analysis Results
In order to calculate the degree of impact of PA, SW, and Ni on nest density, the study adopted stepwise regression analysis to calculate it, and the results are as follows.
As shown in Table 6, nest density was significantly associated with SO, DFN, and CCA. The highest VIF value was 1.097, which is less than 5. Therefore,
Nest Density = 1.436 − 0.775(SO) − 0.609(logDFN) + 0.687(logCCA)
Table 6.
Results from stepwise regression analysis.
From this equation, it can be seen that the density of bird nests in green spaces is negatively correlated with the spatial openness and distance from non-artificial environments, while it is positively correlated with the canopy coverage of arbor. That is, the more open the space and the closer it is to the non-artificial environment, the larger the canopy coverage of the arbor and the higher the density of birds’ nestd. Among them, the weightage of spatial openness is the highest, followed by canopy coverage of arbor, and the distance from non-artificial environments is the smallest.
5.4. Model Validation
The SO, DFN, and CCA values of 10 verification sites in Xuanwei City were, respectively, substituted into the equation to obtain the predicted value of bird’s nest density of each site. Compared with the actual data (Table 7), the predicted value of nest density has a small gap from the field survey data. Therefore, the final regression equation can predict the breeding conditions of birds in mountain cities to a certain extent.
Table 7.
Comparison table of prediction and survey results of nest density for green space in Xuanwei.
5.5. The Impact of Mountain and Urban Development Intensity on Nest Density of Bird
During the on-site investigation, the research team found that seemed to be more prone to discovering bird nests in green spaces close to the mountain. Therefore, the study divided the research area into three levels based on the distance from the mountain, which were less than 100 m, between 100 and 1000 m, and greater than 1000 m. The green space area and bird nests in each level were summarized and added together. Finally, the average density of bird nests was calculated using the ratio of the number of bird nests to the total area (Table 8). The results show that the average density of bird nests was indeed the highest within the 100 m range closest to the mountain (0.73), while the lowest was in the area over 1000 m away from the three bodies (0.28). At the same time, the study overlaid the location map of green spaces with the land development intensity map of Liupanshui (Figure 6), and found that most of the plots closer to the mountain are in areas with lower land development intensity, indicating that the suburbs of cities with lower development intensity are more suitable for bird breeding.
Table 8.
Statistical table of average density of bird nests in different areas with different distances from mountains.

Figure 6.
Schematic diagram of the relationship between green space location and land development intensity (The numbers in the figure represent the plot number of green space).
Figure 6.
Schematic diagram of the relationship between green space location and land development intensity (The numbers in the figure represent the plot number of green space).

6. Discussion
6.1. Discussion
Findings show that green space size (PA), proportion of native plants (PNP), proportion of paved ground (PPG), vegetation diversity (SW), noise density (Ni), light pollution (LP), and distance from water body (DFW) are significant factors which affect bird richness [31,32,33,34,35,36]. Generally, the nest density of urban birds should also be influenced by these factors, but the results of this study show that these factors are not significantly related to the nest density of urban birds. Based on the analysis of the on-site investigation results, the possible reasons are as follows:
(1) As for the space openness (SO), canopy coverage of arbor (CCA), and distance from non-artificial environment (DFN): In 2015, the research results by Claudia and Christian suggested a loss of species richness and functional diversity, with an increasing sealed area of the surrounding urban landscape matrix [37], and this is consistent with the impact of spatial openness (SO) on bird nest density adopted in this study. Huang’s research results, in 2014, indicated that the height and heterogeneity of tree crowns supplement the habitat of birds and increase bird species’ richness [38]. This is also a strong support for the positive correlation between the canopy coverage of arbor (CCA) and nest density in the plot. According to the research results of Kang et al, habitat connectivity is positively correlated with the richness of bird species [39], which is consistent with the correlation between the distance from non-artificial environment and nest density found in this study.
(2) About green space size (PA): There are relevant studies indicating that the species richness of birds increased with the size of green spaces, but in the field investigations it was found that, although some green spaces have a small area, their canopy coverage of arbor and space openness was relatively high, or they were relatively close to forests and agricultural land, so their nest density was still high, such as plots 3, 19, and 48. Although some plots have a large area, their canopy coverage of arbor is low or far from forests and agricultural land, resulting in a low nest density, such as plots 10, 27, and 36. The reason for this may be that a nest site close to the mountain forest is more conducive to providing food for young birds and entering the mountain forest in time when encountering danger. All in all, the characteristics of mountainous cities that are belt-shaped, small (less than 40 square kilometers), and closely connected to non-artificial environments may mask the effect of plot size on nest density.
In addition, according to the research by De Groot et al., the larger the area of green space, the more habitat types it provides and the more bird species it attracts [40]. However, in alpine and cold mountainous cities, the landscape types and plant species are relatively few, and the bird species are also relatively fixed, so the number of bird species has not changed correspondingly with the size of the plot. As a result, the nest density did not increase with the increase in the plot size.
(3) About proportion of native plants (PNP) and vegetation diversity (SW): Related studies have shown that native plants and diverse vegetation provided significantly more caterpillars and caterpillar species, thus creating conditions for bird species richness, diversity, and biomass [41,42]. However, the results of this study show that vegetation diversity and the proportion of native plants have little impact on nest density, which may also be related to the characteristics of mountain cities. In the field survey, it was found that some agricultural land and mountains extend into the city or tight junctions around the city, and these crops and native plants in mountains can provide food sources for urban birds; even if birds choose to nest on introduced trees with dense foliage, they can still obtain food quickly from native plants. Therefore, the proportion of native plants and vegetation diversity in small mountainous cities has little impact on the density of bird nests.
(4) About proportion of paved ground (PPG): From Table 3, it can be seen that the paved ground ratio of most plots is below 30%, with only plots 36 and 62 having a paved ground ratio of 46%. However, bird nests have still been found in these two plots. On the one hand, the plots have a 16% and 54% canopy coverage of arbor ratio, respectively, which provides conditions for bird nesting. At the same time, in on-site investigations, it was found that some urban birds tend to nest on artificial buildings, which means that even if the impermeable area is large, as long as there is sufficient arbor and artificial buildings to provide a nesting environment for birds, they can still reproduce normally. This is consistent with Korányi’s findings in 2021 that increasing levels of urbanization and the percentage of impervious surfaces around green space had no impact on the species richness, functional traits, or community composition of birds [43].
(5) About noise density (Ni) and light pollution (LP): Although many studies have shown that traffic noise and light pollution can have an impact on the lives of birds, Summers’ research results in 2011 showed that traffic noise is not the main cause of the negative correlation between bird species richness/diversity and proximity to roads, but rather the mortality rate caused by traffic [28]. Ciach et al. also found that artificial light acted positively on the density of birds and their inter-seasonal stability due to the fact that artificial light sources can prolong the foraging time of birds [22]. The field survey also found that some bird nests are built on streetlamp poles or trees under heavily lit streetlamps, while others are built on noisy roadside trees and some nests are even less than one meter away from the sidewalk. In fact, by monitoring the breeding process with cameras installed near birds’ nests, it was found that birds engage in nesting activities during the day. Subsequently, they return the nest every morning to lay eggs, and only return to the nest at night to hatch after laying their last egg. At this time, even if birds sences interference from light or noise at night, they will not easily give up hatching. This could be due to urban birds have made adaptive changes to the urban environment; most urban birds (such as Daurian Redstart, Great Tit, White Wagtail, Swallow, and Sparrow) tend to nest in an artificial environment which can help birds drive away their natural enemies, such as eagles and snakes. Therefore, the impact of noise and light pollution on nest density is not significant.
(6) About distance from water body (DFW): The impact of water bodies on birds is unquestionable, but existing research mainly focuses on the impact on bird diversity and water bird richness, and there is still a lack of relevant research on the impact on the number and reproductive activities of urban birds. Birds usually need water for two main reasons, that is, for drinking and bathing, and water sources are closely related to the survival of birds [44]. However, the water bodies involved in this study refer to large lakes, wetlands, or rivers with an area greater than 100 square meters that are easily identified in on-site research and are not the only source of water for birds. In addition to these large water bodies, urban birds can obtain water from some paddles, ponds, fountains, gutters, and containers on building roofs. By monitoring the breeding process of Daurian Redstarts (Phoenicurus auroreus), Great Tits (Parus major), and White Wagtail (Motacilla alba) with cameras installed near the birds’ nests, it was found that the parent birds never fed the young birds with water, and the water intake of the young birds mainly depended on the water contained in insects and food itself. Therefore, from the perspective of breeding activities and the survival of urban birds, it is reasonable that their nest density is not related to the distance from a water body.
6.2. Limitation
(1) The correlation between environmental factors and nest density is not equivalent to a causal relationship, so the model established by this study cannot be directly used to predict nest density, but can only be used to compare nest density in different green spaces.
(2) This study is based on observation data from the same breeding season and city to establish a model. The climate, sunshine, and other environmental conditions in the study area are completely the same. Therefore, for different years and cities, the nest density prediction results will vary with natural disasters as well as temperature, rainfall, hail, and local climate, but will not affect the horizontal comparison of nest density between plots in the same year.
(3) The research area is in the high-altitude mountainous areas of southern China, with an average annual temperature of 12–22 degrees Celsius, a maximum temperature of 30 degrees Celsius, and a minimum temperature of −3 degrees Celsius. Common urban birds mainly include Daurian Redstart (Phoenicurus auroreus), Great tit (Parus major), Sparrow (Passer montanus), White Wagtail (Motacilla alba), Swallow (Hirundo rustica). For warmer, low-altitude areas (such as Southeast Asian cities with more crows and pigeons), this model may not be applicable due to different bird living habits.
(4) The research area is a mountainous city. Due to the high investment in infrastructure and limited construction land in mountainous areas, the total urban area is not large (within 100 square kilometers), and the area of green space is also small (within 20 hectares). For large cities in plain areas, the distance between green spaces and non-artificial environments may exceed 10 km, and the calculated value of nest density may be negative. Therefore, this model is not suitable for large cities in plain areas.
7. Conclusions
In this study, the relevant data of 67 study sites are used to establish the model, and the indicators of 10 verification sites are brought into the model to predict the nest density. Finally, the model is compared with actual observed values to verify its accuracy. According to the results of stepwise regression analysis, the effects of SO, DFN, and CCA on the nest density of urban birds reached a significant level: the nest density of birds decreased with the increase in SO and DFN and increased with the increase in CCA. That is, the more open the green space is, the closer it is to the non-artificial environment, the higher the canopy coverage of trees, and the greater the density of bird nests. In the construction and design practice of ecological cities, based on these research results, the following five suggestions are proposed:
- (1)
- In the optimization design of urban space, the openness of green spaces can be increased by reducing the number and height of buildings surrounding them, thereby creating a suitable breeding environment for birds;
- (2)
- In the layout of urban construction land, green space can be arranged as much as possible at the edge of the city, or connected to natural mountains, forests, and water bodies without separation, reducing the distance between green space and non-artificial environment, and creating a suitable breeding environment for birds;
- (3)
- In the design of green spaces, it is possible to increase the canopy coverage by planting tall trees, thereby creating a suitable breeding environment for birds, especially for small green spaces that are not close to natural mountains and forests;
- (4)
- In the architectural design, since the study found that the nest density of urban birds is not sensitive to artificial interference such as noise and light pollution, bird boxes or caves can be set on artificial buildings in green space or residential areas to provide breeding environments for birds;
- (5)
- In the maintenance of green spaces, as most urban birds rely on trees and shrubs to build their nests, it is recommended to avoid pruning trees or spraying insecticides during bird breeding periods, in order to avoid bird nests being destroyed and young bird casualties.
Author Contributions
Conceptualization, S.S.; Methodology, S.S.; Investigation, X.Z.; Resources, X.Z.; Data curation, X.Z.; Writing—original draft, X.Z.; Writing—review & editing, T.M.; Supervision, T.M. All authors have read and agreed to the published version of the manuscript.
Funding
This research was funded by Department of Education of Guizhou Province grant number [qjh KY [2020] 115] And The APC was funded by the growth project of young scientific and technological talents of Department of Education of Guizhou Province in 2020.
Data Availability Statement
The data presented in this study are openly available in FigShare at 10.6084/m9.figshare, reference number 23710353.
Conflicts of Interest
The authors declare no conflict of interest.
References
- Ortega-Álvarez, R.; MacGregor-Fors, I. Living in the big city: Effects of urban land-use on bird community structure, diversity, and composition. Landsc. Urban Plan. 2009, 90, 189–195. [Google Scholar] [CrossRef]
- Xu, Z.; Yuan, L.; Hu, H.J.; Lu, Q.Y.; Liu, J.C. Design for improving bird diversity in parks based on species drop analysis—Taking Hunan Changde Luowan Wetland Park as an example. J. Ecol. 2019, 39, 6981–6989. [Google Scholar]
- Shwartz, A.; Turbé, A.; Simon, L.; Julliard, R. Enhancing urban biodiversity and its influence on city-dwellers: An experiment. Biol. Conserv. 2014, 171, 82–90. [Google Scholar] [CrossRef]
- Zhang, Z.; Huang, G.L. Research progress of urban ornithology in China. J. Ecol. 2018, 38, 3357–3367. [Google Scholar]
- Sulaiman, S.; Mohamad, N.H.N.; Idilfitri, S. Contribution of Vegetation in Urban Parks as Habitat for Selective Bird Community. Procedia-Soc. Behav. Sci. 2013, 85, 267–281. [Google Scholar] [CrossRef]
- Jiang, G. Research on Urban Wetland Park Planning and landscape construction based on the harmony between man and bird. Fujian Agric. For. Univ. 2012, 5, 48–55. [Google Scholar]
- Sun, Q.; Zhang, A.W. Impact of climate warming on the distribution of birds in China. J. Zool. 2000, 6, 45–48. [Google Scholar]
- Doligez, B.; Boulinier, T.; Fath, D. Habitat Selection and Habitat Suitability Preferences. Encycl. Ecol. 2008, 5, 1810–1830. [Google Scholar] [CrossRef]
- Wan, J. Research progress on land degradation and ecological reconstruction in karst areas of Guizhou Province. Prog. Geosci. 2003, 3, 447–453. [Google Scholar]
- Yin, X.; Li, J.H.; Fu, X.J.; Liu, J.M.; Xiang, D.L. Study on spatial structure of construction land in Wumeng Mountain Area Based on fractal theory. Jiangsu Agric. Sci. 2018, 46, 286–291. [Google Scholar]
- Meng, Q. Research on Urban Ecological Corridor Based on Biodiversity Conservation. Master’s Thesis, Beijing Forestry University, Beijing, China, 2016. [Google Scholar]
- Chen, S.; Ding, P.; Zheng, G.M.; Zhu, G.Y. Research prospect of urban bird community ecology. Zool. Res. 2000, 21, 165–169. [Google Scholar]
- Prowse, T.A.; Collard, S.J.; Blackwood, A.; O’Connor, P.J.; Delean, S.; Barnes, M.; Cassey, P.; Possingham, H.P. Prescribed burning impacts avian diversity and disadvantages woodland-specialist birds unless long-unburnt habitat is retained. Biol. Conserv. 2017, 215, 268–276. [Google Scholar] [CrossRef]
- Jadczyk, P.; Drzeniecka-Osiadacz, A. Feeding strategy of wintering rooks Corvus frugilegus L. in urban habitats. Pol. J. Ecol. 2013, 61, 587–596. [Google Scholar]
- Sushinsky, J.R.; Rhodes, J.R.; Possingham, H.P.; Gill, T.K.; Fuller, R.A. How should we grow cities to minimize their biodiversity impacts? Glob. Chang. Biol. 2013, 19, 401–410. [Google Scholar] [CrossRef] [PubMed]
- Germaine, S.S.; Rosenstock, S.S.; Schweinsburg, R.E.; Richardson, W.S. Relationships among breeding birds, habitat, and res-idential development in greater Tucson, Arizona. Ecol. Appl. 1998, 8, 680–691. [Google Scholar] [CrossRef]
- Sandström, U.; Angelstam, P.; Mikusiński, G. Ecological diversity of birds in relation to the structure of urban green space. Landsc. Urban Plan. 2006, 77, 39–53. [Google Scholar] [CrossRef]
- Qiu, L.; Tao, T.T.; Han, S.R.; Yang, W.Y.; Luan, X.L.; Qiu, Y.N.; Liu, M.S.; Xu, C. Impact of landscape fragmentation on species richness on macro ecological scale. J. Ecol. 2017, 22, 224–232. [Google Scholar]
- Zhou, D.Q.; Chu, L.M. How would size, age, human disturbance, and vegetation structure affect bird communities of urban parks in different seasons. J. Ornithol. 2012, 153, 1101–1112. [Google Scholar] [CrossRef]
- Yang, G.; Wang, Y.; Xu, J.; Ding, Y.Z.; Wu, S.Y.; Tang, H.; Li, H.; Wang, X.; Ma, B.; Wang, Z. Impact of habitat types of urban parks on bird communities. J. Ecol. 2015, 35, 4186–4195. [Google Scholar]
- McDonald, R.I.; Marcotullio, P.J.; Güneralp, B. Urbanization and global trends in biodiversity and ecosystem services. In Urbanization, Biodiversity and Ecosystem Services: Challenges and Opportunities; Elmqvist, T., Fragkias, M., Eds.; Springer: Cham, Switzerland; Dordrecht, The Netherlands, 2013; pp. 31–52. [Google Scholar]
- Ciach, M.; Fröhlich, A. Habitat type, food resources, noise and light pollution explain the species composition, abundance and stability of a winter bird assemblage in an urban environment. Urban Ecosyst. 2017, 20, 547–559. [Google Scholar] [CrossRef]
- Janaranjani, M.; Varunprasath, K.; Priya, R.L.; Sutharsan, L.; Lakeshmanaswamy, M. Status of Wetlands in the Coimbatore District, Tamilnadu, India. Asian J. Environ. Ecol. 2017, 4, 1–12. [Google Scholar] [CrossRef]
- Palomino, D.; Carrascal, L.M. Urban influence on birds at a regional scale: A case study with the avifauna of northern Madrid province. Landsc. Urban Plan. 2006, 77, 276–290. [Google Scholar] [CrossRef]
- Savard, J.-P.L.; Falls, J.B. Influence of habitat structure on the nesting height of birds in urban areas. Can. J. Zool. 1981, 59, 924–932. [Google Scholar] [CrossRef]
- Marselle, M.R.; Stadler, J.; Korn HIrvine, K.N.; Bonn, A. Biodiversity and Health in the Face of Climate Change; Springer: Cham, Switzerland, 2019; pp. 1–2. [Google Scholar]
- Fisher-Gewirtzman, D.; A Wagner, I. Spatial Openness as a Practical Metric for Evaluating Built-up Environments. Environ. Plan. B Plan. Des. 2003, 30, 37–49. [Google Scholar] [CrossRef]
- Whittaker, R.H. Evolution and measurement of species diversity. Taxon 1972, 21, 213–251. [Google Scholar] [CrossRef]
- Summers, P.D.; Cunnington, G.M.; Fahrig, L. Are the negative effects of roads on breeding birds caused by traffic noise? J. Appl. Ecol. 2011, 48, 1527–1534. [Google Scholar] [CrossRef]
- Ma, J.; Liu, B.; Liu, G.; Wang, H. Case study on the effect of artificial light on the behavior of migratory songbirds. J. Light. Eng. 2010, 3, 8–12. [Google Scholar]
- Urle, J.B.; Yang, Y.F. Corroborating Structural/ Spatial Treatments A Brook Trout Habitat Suitability Index Case Study. Landsc. Archit. 2011, 4, 35. [Google Scholar]
- Wisdom, M.J.; Bright, L.R.; Carey, C.G.; Hines, W.W.; Pedersen, R.J.; Smithey, D.A.; Thomas, J.W.; Witmer, G.W. A Model to Evaluate Elk Habitat in Western Oregon; US Department of Agriculture & Forest Service: Washington, DC, USA, 1986; p. 35. [Google Scholar]
- Melles, S.; Glenn, S.M.; Martin, K. Urban Bird Diversity and Landscape Complexity: Species-environment Associations Along a Multiscale Habitat Gradient. Conserv. Ecol. 2003, 7, 1–22. [Google Scholar] [CrossRef]
- McKinney, R.A.; Raposa, K.B.; Cournoyer, R.M. Wetlands as habitat in urbanizing landscapes: Patterns of bird abundance and occupancy. Landsc. Urban Plan. 2011, 100, 144–152. [Google Scholar] [CrossRef]
- Lerman, S.B.; Nislow, K.H.; Nowak, D.J.; DeStefano, S.; King, D.I.; Jones-Farrand, D.T. Using urban forest assessment tools to model bird habitat potential. Landsc. Urban Plan. 2014, 122, 29–40. [Google Scholar] [CrossRef]
- Huang, Y.; Zhao, Y.; Li, S.; von Gadow, K. The Effects of habitat area, vegetation structure and insect richness on breeding bird populations in Beijing urban parks. Urban For. Urban Green. 2015, 14, 1027–1039. [Google Scholar] [CrossRef]
- Schütz, C.; Schulze, C.H. Functional diversity of urban bird communities: Effects of landscape composition, green space area and vegetation cover. Ecol. Evol. 2015, 5, 5230–5239. [Google Scholar] [CrossRef]
- Huang, Q.; Swatantran, A.; Dubayah, R.; Goetz, S.J. The Influence of Vegetation Height Heterogeneity on Forest and Woodland Bird Species Richness across the United States. PLoS ONE 2014, 9, e103236. [Google Scholar] [CrossRef] [PubMed]
- Kang, W.; Minor, E.; Park, C.-R.; Lee, D. Effects of habitat structure, human disturbance, and habitat connectivity on urban forest bird communities. Urban Ecosyst. 2015, 18, 857–870. [Google Scholar] [CrossRef]
- De Groot, M.; Flajšman, K.; Mihelič, T.; Vilhar, U.; Simončič, P.; Verlič, A. Green space area and type affect bird communities in a South-eastern European city. Urban For. Urban Green. 2021, 63, 127212. [Google Scholar] [CrossRef]
- Burghardt, K.T.; Tallamy, D.W.; Shriver, W.G. Impact of Native Plants on Bird and Butterfly Biodiversity in Suburban Landscapes. Conserv. Biol. 2009, 23, 219–224. [Google Scholar] [CrossRef]
- Narango, D.L.; Tallamy, D.W.; Marra, P.P. Native plants improve breeding and foraging habitat for an insectivorous bird. Biol. Conserv. 2017, 213, 42–50. [Google Scholar] [CrossRef]
- Korányi, D.; Gallé, R.; Donkó, B.; Chamberlain, D.E.; Batáry, P. Urbanization does not affect green space bird species richness in a mid-sized city. Urban Ecosyst. 2020, 24, 789–800. [Google Scholar] [CrossRef]
- Tryjanowski, P.; Jankowiak, Ł.; Czechowski, P.; Dulisz, B.; Golawski, A.; Grzywaczewski, G.; Indykiewicz, P.; Kwieciński, Z.; Mitrus, C.; Nowakowski, J.J.; et al. Summer water sources for temperate birds: Use, importance, and threats. Eur. Zool. J. 2022, 89, 913–926. [Google Scholar] [CrossRef]


Disclaimer/Publisher’s Note: The statements, opinions and data contained in all publications are solely those of the individual author(s) and contributor(s) and not of MDPI and/or the editor(s). MDPI and/or the editor(s) disclaim responsibility for any injury to people or property resulting from any ideas, methods, instructions or products referred to in the content. |
© 2023 by the authors. Licensee MDPI, Basel, Switzerland. This article is an open access article distributed under the terms and conditions of the Creative Commons Attribution (CC BY) license (https://creativecommons.org/licenses/by/4.0/).