Article

Searching for Balance between Hill Country Pastoral Farming and Nature

by
John R. Dymond
1,*,
Adam J. Daigneault
2,
Olivia R. Burge
3,
Chris C. Tanner
4,
Fiona E. Carswell
3,
Suzie Greenhalgh
5,
Anne-Gaelle E. Ausseil
6,
Norman W. H. Mason
7 and
Beverley R. Clarkson
7
1
Manaaki Whenua—Landcare Research, Palmerston North 4472, New Zealand
2
School of Forest Resources, University of Maine, Orono, ME 04469, USA
3
Manaaki Whenua—Landcare Research, Lincoln 7608, New Zealand
4
National Institute of Water and Atmospheric Research, Hamilton 3216, New Zealand
5
Manaaki Whenua—Landcare Research, Auckland 1072, New Zealand
6
Manaaki Whenua—Landcare Research, Wellington 6011, New Zealand
7
Manaaki Whenua—Landcare Research, Hamilton 3216, New Zealand
*
Author to whom correspondence should be addressed.
Land 2023, 12(8), 1482; https://doi.org/10.3390/land12081482
Submission received: 7 June 2023 / Revised: 21 July 2023 / Accepted: 24 July 2023 / Published: 26 July 2023
(This article belongs to the Section Land, Biodiversity, and Human Wellbeing)

Abstract

:
Much land has been cleared of indigenous forest for pastoral agriculture worldwide. In New Zealand, the clearance of indigenous forest on hill country has resulted in high food production, but waterways have become turbid, with high nutrient and E. coli concentrations. A range of on-farm mitigations are available, but it is unclear how they should be applied catchment-wide. We have developed a catchment-scale model that integrates economics with ecosystem services to find a better balance between agriculture and nature. In the upper Wairua catchment, Northland, if three actions are prioritised—(1) keeping stock out of streams, (2) constructing flood retention bunds in first-order catchments, and (3) planting trees on highly erodible land—then sediment loads, E. coli levels, and flooding are significantly reduced. Implementing these actions would cost approximately 10% of catchment net revenue, so it is feasible with a combination of regulation and subsidy. Many catchments in New Zealand are primarily pastoral agriculture, as in other countries (in North and South America, Australasia, and the United Kingdom), and would benefit from the analysis presented here to guide development along sustainable pathways. While pastoral agriculture typically stresses waterways, with increased sedimentation and freshwater contaminants, much can be done to mitigate these effects with improved farm and riparian management.

1. Introduction

Natural ecosystems in New Zealand occupy approximately 40% of the landmass [1], much of which is mountainous and steep and so not suitable for agriculture. Most of the remaining land is either in pastoral agriculture or production forestry. Cropping land and horticultural land is primarily on the lowlands near towns and cities. While a good balance exists between natural and managed ecosystems for maintaining a full range of ecosystem services nationally [2], most cities are distant from natural ecosystems. The upper Wairua catchment, which is near Whangarei city, is a typical managed ecosystem (for agriculture) where the original indigenous forest has been cleared and wetlands drained for pastoral agriculture and some production forestry [3]. Wood, food, and fibre production is high, but this has put pressure on the environment: waterways are turbid from increased soil erosion [4]; levels of nitrogen (N), phosphorus (P), and Escherichia coli in rivers are high [5,6]; greenhouse gas (GHG) emissions from agriculture are high [7]; natural forest habitat and wetland habitat for fish are minimal [8,9]; and the flooding of the floodplain is increasing with climate change. Consequently, the Living Water partnership [10] between Fonterra, a large dairy company, and the Department of Conservation is searching for solutions to improve this apparent imbalance between nature (i.e., natural ecosystems and their ecosystem services) and agriculture in the upper Wairua catchment, as a case study.
A range of mitigations have been used to improve the provision of ecosystem services, especially regulating services. To reduce sedimentation of waterways, soil conservation trees have been planted in areas prone to soil erosion [11]. To reduce nutrients in rivers, nutrient budgeting has been applied on farms to minimise N and P leaching [12,13]. To reduce E. coli levels in rivers, waterways have been fenced (typically with 5–7 horizontal strands of wire with vertical standards ~3 m apart) to prevent stock access [14,15], and storage effluent ponds have been constructed on dairy farms [14,16]. To reduce GHG emissions, land prone to soil erosion has been afforested [17]. To improve fish habitat, trees have been planted in riparian margins, or pasture has been allowed to revert to forest, for the shading of water and the reduction of bank erosion [15]. To improve natural forest habitat, forest remnants have been fenced and pest control implemented [18]. To improve flood control, wetlands have been incorporated into flood control programs [9].
While these mitigations are helpful at farm scale, it is not clear how they should be applied optimally at the catchment scale to achieve catchment-level goals, particularly when multiple ecosystem services are being considered and there are a wide range of objectives. At the catchment scale, it is difficult to implement integrated biophysical and economic models, as they are complex [19,20] and require much data. Nevertheless, there has been some progress at the national and regional scales to assess the impacts of agri-environmental policy on multiple environmental outcomes. Pattanayak et al. [21] analysed the water quality co-effects of agricultural GHG mitigation in the United States, finding substantial variation across regions and catchments. Daigneault et al. [22] developed an economic land use model to assess the national climate and water policy in New Zealand. Bateman et al. [23] conducted a national economic and ecosystem assessment for the United Kingdom, showing the significance of land-use change on several ecosystem services. These economic analyses are uncommon, as most research focusses on a single pollutant or ecosystem service [24] and omits the economic implications of ‘optimal’ solutions [25,26].
Here, we develop a catchment-scale model that integrates economics with ecosystem services, and that can determine land use/mitigation configurations to maximise net catchment revenue, subject to environmental constraints. This is achieved by using statistical summaries of the effect of land use/mitigation in biophysical models and by using the economic data of farm types defined by land type and land-use type. We use the model to determine whether a better balance between agriculture and nature may be achieved whereby both regulating ecosystem services and net catchment revenues are maintained.

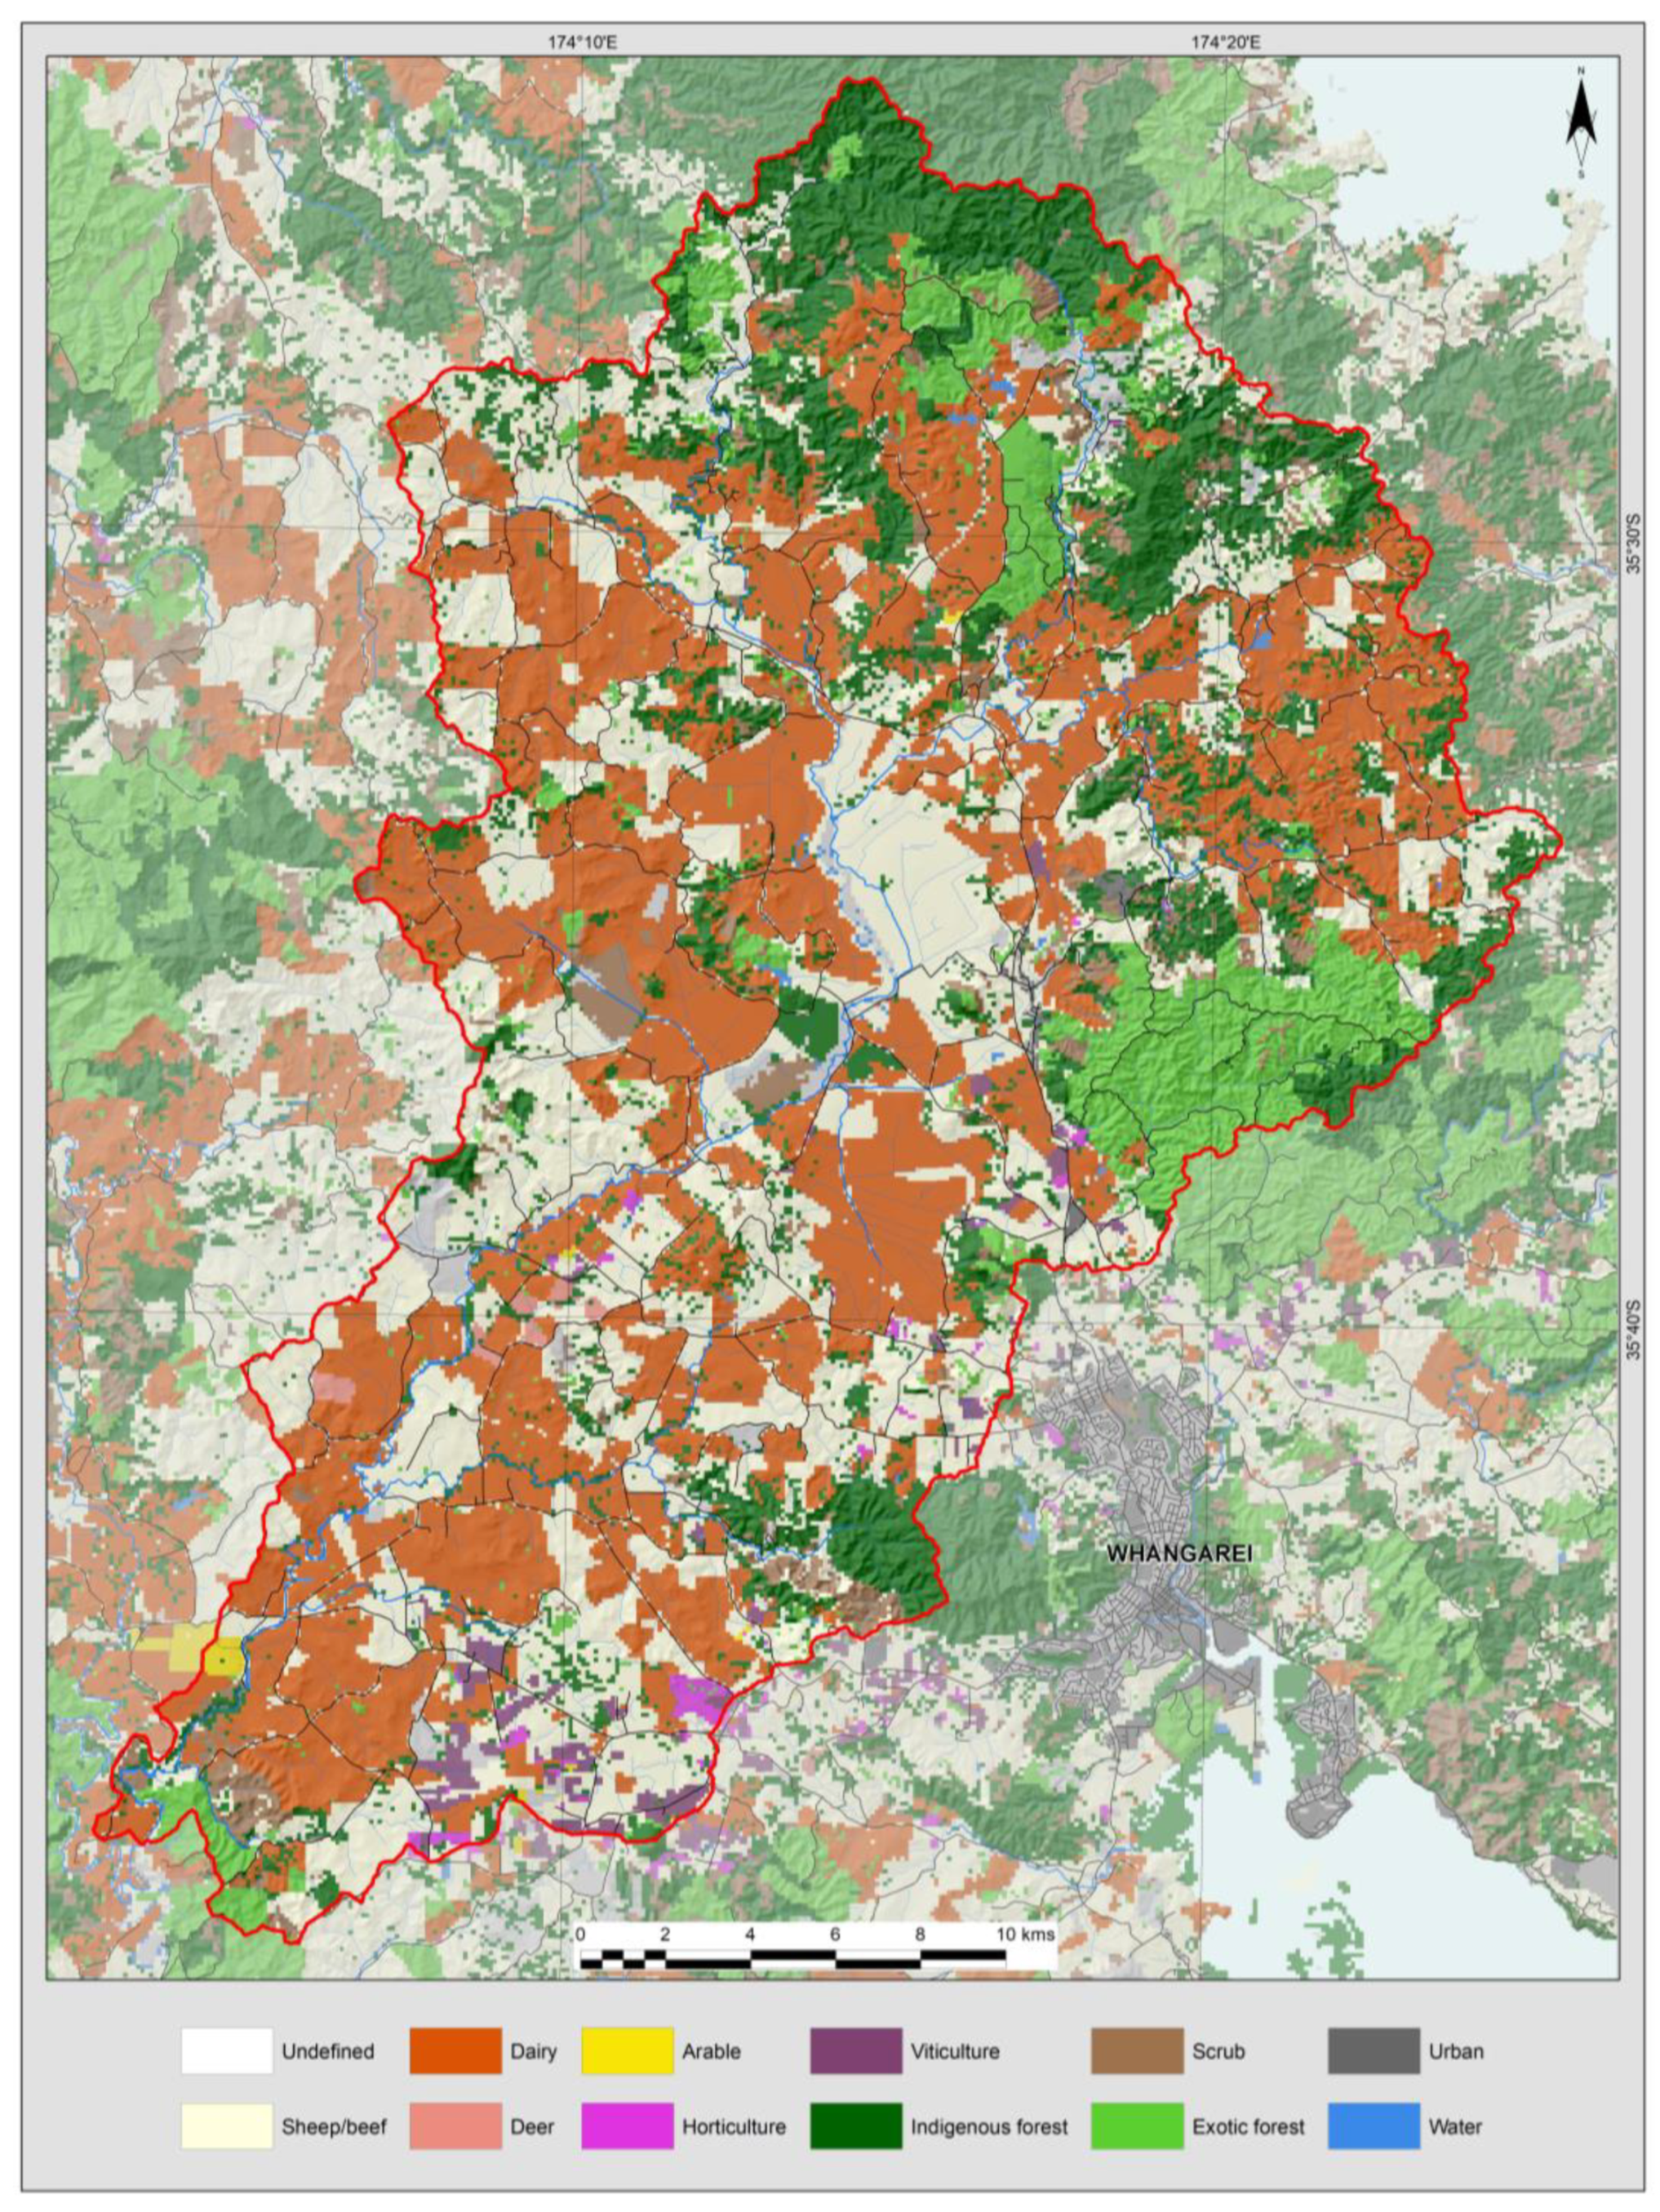
2. Upper Wairua Catchment

The upper Wairua catchment (75,000 ha) comprises moderately steep hill country (>20 degrees) surrounding a wide flood plain. The geology is primarily sedimentary rock, susceptible to gully and earthflow erosion when soft. Land cover in the catchment (Figure 1) has been substantially modified from its natural state in the early 1800s. Most indigenous forest has been cleared (6% remains) and most lowland swamps have been drained (1% remain). Current land use is dominated by intensive pastoral agriculture, dairy, and sheep and beef farming, with some production forestry. Two small wetlands remain on the floodplains and some remnants of indigenous forest (dominated by Podocarpus totara) remain on the surrounding hills. The floodplain supports two nationally threatened plant species, Hebe aff. Bishopiana, a ‘nationally critical’ shrub, and Pittosporum obcordatum (heart-leaved kohuhu), a small tree species in ‘national decline’ [27]. Threatened and at-risk bird and fish species are also present in the floodplain, including the Australasian bittern (Botaurus poiciloptilus), black mudfish (Neochanna diversus), and long-fin eel (Anguilla dieffenbachia) [27]. In 1968, a major flood management scheme was constructed: river channels were straightened, and drains, control banks, and seven pockets for spilled floodwater (which is pumped back to the Wairua River after the flood peak) were constructed. The pumps prevent the loss of pasture in the flood pockets for a 3.5-year return period flood, but they kill fish and eels when operating. Shrinking peat soils on the floodplain, due to drainage, are lowering floodplain levels and exacerbating impacts of flooding, along with climate change.

3. Stakeholder Group

A stakeholder group, comprising farmers, conservationists, recreationalists, policy makers, local iwi, environmental regulators, water engineers, and others, identified both important ecosystem services and a range of catchment-scale mitigation scenarios for assessment. The services included food and fibre, erosion control, water-flow regulation, clean water provision, climate regulation, and natural habitat provision. We have used indicators for these services as given by [28], referring to them as environmental outputs. As the model can be used to determine land use/mitigation configurations to maximise net catchment revenue, we determined the optimal mix of mitigations to achieve a range of catchment level outcomes. Both the optimal mixes and the scenarios were used to identify realistic solutions for the upper Wairua catchment. These were fed back to the stakeholder group for consideration.

4. Methods

4.1. Economic Land Use Model

Economic analysis was conducted using the New Zealand Forest and Agriculture Regional Model (NZFARM), a partial equilibrium economic model of land use operating at the catchment scale [15]. The model finds the land use configuration that maximises net revenue subject to environmental constraints. Economic impacts are estimated as a cost to landowners to implement mitigation options relative to their current management practices. Environmental impacts are measured as changes in sediment load, freshwater contaminants, volume of flood water, and GHG emissions. NZFARM accounts for a variety of land use, enterprise, and land management options. The data required to parameterise each land use, enterprise, and land management combination include financial and budget data (e.g., inputs, costs, and prices), production data, and environmental outputs.
In the model, total economic returns from the upper Wairau catchment, calculated as annual net farm revenue ( π ), are measured as:
π = r , s , l , e , m P A r , s , l , e , m + Y r , s , l , e , m X r , s , l , e , m ω r , s , l , e , m l i v e + ω r , s , l , e , m v c + ω r , s , l , e , m f c + τ γ i , r , s , l , e e n v
where P is the product output price, A is the agricultural product output quantity, Y is other gross income earned by landowners (e.g., grazing fees), X is the area of specific farm-activity, ω l i v e , ω v c , and ω f c are the respective livestock, variable, and fixed input costs, τ is an environmental tax (if applicable), and γ e n v is an environmental output coefficient. Summing the revenue and costs of production across all sub-catchments (r), soil types (s), land covers (l), enterprises (e), and land management options (m) yields the total net revenue for the geographical area of concern.
The model estimates environmental outputs ( E i ) from more than a dozen different land uses. Per hectare values are specified via the parameter γ e n v , which, as with economic returns, can vary by sub-catchment, soil type, land cover, and enterprise. Summing over the area of all land use activities yields the aggregate environmental output from land-based activities for the catchment:
r , s , l , e γ i , r , s , l , e e n v X r , s , l , e = E i
In this analysis, we consider applying a range of land-based mitigation practices and/or emissions reduction targets. To describe these environmental impacts, Equation (2) is amended to:
r , s , l , e , m γ i , r , s , l , e , m X r , s , l , e Z r , s , l , e + ψ i , r , s , l , e e n v Z r , s , l , e = E i
where Z is the area of the land with GHG mitigation practices. The parameter γ specifies the environmental impacts of land use after accounting for the mitigation, while ψ e n v describes the impact of the practices on the environmental factors. In this paper, we assume that γ  ≤  γ e n v , as mitigation practices reduce total environmental outputs by (a) reducing impacts per unit of land use and (b) through their own biophysical processes that reduce emissions. The environmental impact after implementing mitigation practices, E i , is equal to or smaller than the impact without these practices, E i , so that the mitigation achieved by implementing a specified set of mitigation practices is E i E i . As Z represents the area that implements on-farm mitigation, which is typically at an increased cost relative to the industry standard practices, it also has a negative effect on the net economic returns estimated in Equation (1).

4.2. Land Use and Net Farm Revenue

Baseline land use is the land use as at 2011 (Figure 1). Key land uses are sheep and beef (41%), dairy (38%), plantation forestry (9%), and native bush (6%). Farm budgets, given as earnings before interest and taxes, form the foundation of the baseline net revenues earned by landowners [29]. These figures assume that landowners do not incur mitigation costs, such as fencing streams or constructing wetlands. The national-level figures were verified with agricultural consultants and enterprise experts [15]. Although dairy makes up less than half the proportion of land use, it produces 72% of farm net revenue in the catchment, followed by horticulture and arable (11%), forestry (8%), and sheep and beef farming (8%). Net farm revenue figures are used to estimate the opportunity costs of taking land out of production. Pasture-based mitigation assumes an increase in capital and maintenance expenses but no opportunity costs for production losses.

4.3. Sediment Loads

Sediment loads for each farm are estimated from the SedNetNZ model [30]. The land-use contribution to sediment is estimated for both hill/landmass and streambank erosion. SedNetNZ estimates that the total load in the catchment is 156,000 tonnes of sediment per year. About 65% of this is estimated to come from hill and landmass erosion, while the remainder is from streambank erosion. Most sediment comes from dairy (44%), followed closely by sheep and beef (40%). About 15% of sediment comes from pine plantations and native bush, which are generally located on less productive areas with steeper slopes relative to the rest of the catchment. Conversion of forestry to agriculture increases soil erosion by a factor of 5 to 10, depending on whether it was productive plantation with occasional clear-felling or was permanent [31,32].

4.4. Escherichia coli Loads

Escherichia coli loads (peta E. coli/yr) from each farm are estimated from the CLUES model [33], which divides source terms into urban, pastoral land uses, other rural, and point sources. The sources are modified for rainfall and soil drainage, and decay occurs in both streams and lakes. The product of farm area with E. coli yield (peta E. coli/ha/yr) from CLUES gives an E. coli load from the farm. Estimates of the baseline showed that 99% of the total E. coli load in the upper Wairua river came from dairy (70%) and sheep and beef (29%) farms.

4.5. Nutrient Losses

Nutrient (i.e., N and P) loads (kg/yr) from farms are estimated using the OVERSEER (v6.0) nutrient budgeting tool [34], which gives losses (kg/ha/yr) as functions of stocking rate, fertiliser input, soil type, and climate. Nitrogen (N) and P losses for other land uses are derived from research reports [35,36]. Dairy farms in the upper Wairua catchment lose 25 kgN/ha/yr on average and contribute 57% of total N load in the catchment, while sheep and beef contribute 37%. Dairy farms contribute 43% of total P load, while sheep and beef contribute 44%.

4.6. Greenhouse Gas Emissions

Greenhouse gas emissions for the upper Wairua catchment were estimated using the Ministry for the Environment’s GHG inventory accounting methods [37], where agricultural emissions from livestock are estimated, and emissions from land use/land cover change are estimated (sequestration in permanent forests is assumed to be zero on average). Dairy averages approximately 7 tonnes of carbon dioxide equivalent per annum (CO2-e/ha/yr) and contributes 67% of total gross GHG emissions in the catchment, followed by sheep and beef (31%). Forest carbon sequestration reduces net emissions to about 70% of gross emissions, with 12 tCO2-e/ha/yr (on average) coming from plantation forests.

4.7. Floodwater

The seven flood pockets of the Hikurangi drainage scheme can store 10 million m3 of water. Retention bunds and upland wetlands will reduce the volume of water spilled into the pockets by retaining and delaying floodwater. A retention bund in a typical first order sub-catchment will hold back 1250 m3 of water from a flood. A constructed upland wetland will hold back 250 m3. Given that there are 2000 first-order sub-catchments in the upper Wairua catchment, there is the potential for 2.5 million m3 of water to be held back from the design flood of 10 million m3 by retention bunds. This equates to a 25% reduction in the design flood.

4.8. Mitigation Costs and Effectiveness

The model includes several mitigation options to reduce sediment and other freshwater contaminants in the catchment. Of these, the wetland and retention bund options also influence flooding. Many of the mitigation options also influence net GHG emissions. The mitigation costs and relative effectiveness are estimated as a percentage change from the no-mitigation baseline. Costs are broken down by the initial capital and implementation costs, as well as the opportunity costs from taking land out of production. The mitigations for nutrient loss and effluent management are packaged in bundles [38,39], as described in Table 1. The mitigations in these bundles include fertiliser management, effluent management, denitrification, and access/stream crossing infrastructure [40]. Costs can accrue at different times and magnitudes, so they are annualised to be directly comparable to baseline costs. Initial capital and periodic maintenance costs are annualised over 25 years using a discount rate of 8%. Opportunity costs are assumed to accrue on a yearly basis and so are directly subtracted from the base net farm revenue figures.

4.9. Scenario Analysis

We use the integrated catchment model to estimate the environmental outputs and net revenues of a baseline, or business as usual, scenario and 21 mitigation scenarios. The mitigation scenarios include practice-based approaches such as fencing streams for stock exclusion, as well as outcome-based approaches that focus on identifying the least-cost combination of practices that could be implemented to reduce erosion to a catchment-wide sedimentation target of 20%, 40%, or 60% below baseline. Table 1 shows the scenarios run in the model and gives a brief description of each.

5. Results

The modelled scenarios (Table 1) comprise a baseline (essentially current land use, but without fencing of streams) and various combinations of flood retention bunds, constructed upland wetlands, soil conservation plans, afforestation, fencing of streams for stock exclusion, riparian buffers, and nutrient mitigation bundles. The scenarios are grouped into those which focus on flood control, land-based soil erosion control, fencing of streams, and sediment mitigations, nutrient mitigations, and target-based sediment reduction. Table 2 shows the net revenue and environmental outputs for the baseline in the upper Wairua catchment by land use. Table 3 shows the net revenue and environmental outputs for all scenarios.
Constructing flood retention bunds in all first-order sub-catchments reduces the volume of water spilled in the design flood by 25%, which is a significant reduction of flooding impact. The associated cost is a moderate NZD 688 K/yr. In contrast, constructing upland wetlands in all the first-order sub-catchments only reduces the volume of water in the design flood by 5% and the associated cost is high at NZD 2714 K/yr. However, both retention bunds and upland wetlands also reduce sediment loads significantly, by 31% and 34%, respectively, and they also reduce E. coli loads significantly, by 30% and 55%, respectively. Therefore, for a moderate cost to the catchment, flood retention bunds can significantly reduce flooding impact, E. coli, and sediment loads.
Applying soil conservation plans on pastoral farms achieves moderate reductions in sediment loads from the upper Wairua catchment. Even when applying plans on all sheep and beef properties, at a moderate cost of NZD 990 K/yr, there is only a 25% reduction in sediment load from the catchment. The prioritised plans on 20% of the farms is a more cost-effective solution with a cost of only NZD 370 K/yr, and produces a similar sediment load reduction, at 18%. The afforestation of all hill farms is almost cost neutral at NZD 40 K/yr and reduces sediment load by 28%, while afforestation of all farms is very costly at NZD 29 M/yr and reduces the sediment load by 80%. Except for afforestation everywhere, these scenarios for mitigating land-based soil erosion are not achieving the desirable (by the stakeholder group) reductions of 50% or more, so they would need to be combined with other mitigations, such as the flood retention bunds.
Fencing all streams reduces the E. coli load significantly by 60%, reduces sediment load by 20%, and P loss by 19%. However, these reductions come at a cost of NZD 4608 K/yr, which would reduce net catchment revenue by 10%. Passive riparian buffers, where the buffer is 5 m wide with naturally regenerated vegetation, is more effective at reducing sediment load by 45% and P load by 31% but at a much greater cost of NZD 6792 K/yr. The current fencing, which excludes stock from most streams on dairy farms, has already reduced E. coli loads from baseline by 36% and has come at a cost of NZD 1789 K/yr.
The medium mitigation bundle for nutrient and effluent management reduces the E. coli load significantly by 50% and the N and P loss moderately by 34% and 36%, respectively. However, these reductions come at a cost of NZD 5958 K/yr, which would incur a reduction in the net catchment revenue of 12%. The low mitigation bundle is a little less expensive at NZD 4164 K/yr and maintains a 50% reduction in the E. coli load, but only reduces the N and P loss by 21% and 22%, respectively. The high mitigation bundle reduces the N and P loss by 53% and 43%, respectively, but is very costly at NZD 24 M/yr and is unlikely to be implemented. All the mitigation bundles reduce net GHG emissions by a small percentage (−7% to −13%).
Combining several mitigation options such as farm plans, fencing, and bunds results in a broad range of environmental impacts in the catchment, depending on how much management change is implemented. The combination of bunds in all first order sub-catchments, farm plans for all farms, and riparian buffers reduces sediment load by 56%, E. coli load by 60%, and reduces the volume of water spilled in the design flood by 25%. The reduction of the N and P losses are significant at 27% and 31%, respectively; however, the cost is high at NZD 10,530 K/yr. A more likely combination is bunds in all first order sub-catchments, targeted plans for 20% of farms, and fencing of all streams, which also reduces the sediment load by 56% and the E. coli load by 60%. The reduction of the N and P losses are less significant at 12% and 16%, respectively. This combination is more likely because the cost is much less at NZD 4164 K/yr, which is equivalent to a reduction of 9% of the net catchment revenue. There is effectively no change in the net GHG emissions.
Three scenarios were run to maximise the net revenue subject to sediment reduction targets of 20%, 40%, and 60%. The 60% sediment reduction scenario achieves the reduction at a cost of only NZD 1129 K/yr, which is cost-effective when compared with the NZD 4164 K/yr cost for the 56% reduction achieved by the all bunds and fencing, and the worst 20% farm plans scenario. The mix of mitigations required to achieve the 60% sediment reduction is 26% of the bunds, 22% of the stream fencing, and 27% of the farm plans. While the cost of the 60% sediment reduction scenario is low, it does not achieve a significant reduction in volume of water spilled in design flood, at only 6%, and the 5% reduction in N loss is also small.

6. Discussion

We have indeed found a better balance between agriculture and regulating ecosystem services than that currently in the upper Wairua catchment. The all bunds and fencing, and farm plans on the worst 20% farms achieves significant reductions in water spilled in design flood, sediment load, and stream E. coli, at a moderate cost equivalent to a 9% reduction in net catchment revenue. There are three priority actions for achieving this balance: (1) keeping stock out of streams to prevent direct egestion into waterways; (2) construction of flood retention bunds for reducing flood water, sediment load, and nutrient loss; and (3) tree planting on highly erodible land. Catchment-wide implementation of these actions would cost 9% of the catchment net revenue and is feasible with a combination of regulation and subsidies.
A cost of 9% of catchment net revenue is unlikely to be willingly borne by the farmers in the upper Wairua catchment. However, a mixture of subsidies and payment for ecosystem services [41] could bring that figure down to a more palatable 5%. Soil conservation farm plans are currently subsidised by 50% with a combination of regional and central government subsidies. Likewise, the fencing of streams, which is now required by regulation [42], is also subsidised by 50% from regional and central government subsidies. Nutrient budgeting is not currently required in regulations but could be encouraged through funding subsidies. Payments for ecosystem services would be needed by upland farmers constructing upland wetlands from lowland farmers who receive the benefit of reduced flooding on the floodplain.
The NZFARM model has integrated economics and environment data at the farm and catchment scale. For the upper Wairua catchment, it brought together knowledge from a multi-disciplinary team, comprising economics, hydrology, freshwater science, geomorphology, plant ecology, landscape ecology, and agricultural science, and has enabled interdisciplinary analysis. While the upper Wairua catchment is complex in its interactions, such as landscape evolution (the sinking of the peat soils) and legacy effects of soil erosion mixed with climate change, with NZFARM it has been possible to focus on the direct drivers for ecosystem services and to identify practical and economic solutions for current problems.
NZFARM can produce farm-scale to catchment-scale estimates for a wide range of land uses. The model was designed to provide insight on the relative impacts and trade-offs across a range of policy scenarios (e.g., practice verses outcome-based targets), rather than solely modelling the absolute impacts of a single policy scenario. Key to this is the ability to handle the interaction between land use and net revenue—by finding the land use configuration that maximises net revenue. While the model does include more than a dozen mitigation practices that can be implemented on several land uses, data on cost and the effectiveness of practices are averages and may not match precisely farm specific data. The parameterisation of the model relies on biophysical and economic data from several different sources, and caution must be taken to ensure that inputs are consistent across the various modules. We therefore suggest that the estimates from this analysis should be used in conjunction with other decision support tools and stakeholder input to ensure a robust approach to managing environmental objectives for catchments.
While a better balance between nature and agriculture is possible in the upper Wairua catchment, the specifics of that balance are not what the Living Water partnership expected or hoped for. For example, it was thought that more natural ecosystems in the hill country would provide significant flood control for the lowlands. However, hydrological modelling of floods, using the Watyield model [3] showed no difference in the mean annual flood between indigenous forest and pasture, due to the increase of rainfall interception in forest being approximately balanced by an increase in the soil moisture deficit under pasture. It is a farm management or agricultural engineering approach that provides the necessary increase in flood control. Similarly, upland wetlands were shown to have little impact on flood control, as there was not enough unused volume in the wetlands to store flood water.
The modelling in the upper Wairua catchment focussed on issues highlighted by the stakeholder group as being important: agricultural productivity, soil erosion, sedimentation of waterways, freshwater contaminants, flooding, and GHG emissions. While these issues comprise a broader range than just the agricultural productivity and freshwater contaminants considered by [25], we have identified other issues and activities that would enhance ecosystems and associated services. Fencing of the many indigenous forest remnants and implementing pest control would increase the diversity of shrubs and trees and could proceed independently of selective logging of high value Podocarpus totara, which is a potential source of secondary income for farmers and jobs to the local community. Biocontrol of weeds, such as Tradescantia, would also increase the diversity of plants in the few remaining natural wetlands. The prevention of fish passage through the pumps during floods would also reduce fish mortality. Setting aside strips of farmland for beetle banks [43] would provide extra habitat and food for birds and would reduce the spread of airborne weed seeds to riparian margins.
In this paper, we have used the word ‘nature’ to mean natural ecosystems and their ecosystem services. This is not to say that agricultural ecosystems are bereft of natural processes—the natural world in agricultural soils has vast biodiversity [44]. It is just that there is a sharp contrast in New Zealand between agricultural and natural ecosystems: natural ecosystems commonly have tall temperate rainforest providing habitat for birds and wild animals, and agricultural ecosystems commonly have low pasture cover providing habitat for domesticated animals. The New Zealand mindset is to place a high passive value on ‘natural’ ecosystems through option, existence, and bequest values [45]. In other more populated countries with a longer history of agriculture, such as those in Europe, few natural ecosystems remain. Consequently, agricultural landscapes are those considered natural and requiring protection from inappropriate use or loss [46].
The modelling approach has found an improved balance between nature and pastoral agriculture through a consideration of important ecosystem services. Given that the cost is relatively low, as a proportion of net catchment income, this improved balance may be achieved practically, and could be met with a combination of subsidies and payments for ecosystem services. Many catchments in New Zealand are primarily pastoral agriculture, as in other countries (in North and South America, Australasia, and United Kingdom), and would benefit from the analysis presented here to guide development along sustainable pathways [47,48,49,50]. While pastoral agriculture in hill country typically stresses waterways, with increased sedimentation and freshwater contaminants, much can be done to mitigate these effects with improved farm and riparian management, such as soil conservation farm plans, fencing, and nutrient budgeting.

7. Conclusions

A catchment-scale model that integrates economics and important ecosystem services may be used to find a better balance between agriculture and nature, whereby both regulating ecosystem services and catchment net revenues are maintained. Our model shows that for the upper Wairua catchment, in New Zealand, if all streams were fenced, soil conservation farm plans were implemented on 20% of the worst farms (for soil erosion), and for flood retention bunds constructed in first-order sub-catchments, sediment load would be reduced by 56%, E. coli levels would be reduced by 60%, the volume of floodwater in design flood would be reduced by 25%, and nitrogen and phosphorus loads would be reduced by 12% and 16%, respectively—all at a cost of 9% of the net catchment revenue. This land management scenario represents a better balance between agriculture and nature and could be practically achieved with a combination of subsidies and payments for ecosystem services. The modelling approach could be readily applied to other catchments to determine optimal balances between nature and agriculture.

Author Contributions

Conceptualization, J.R.D., A.J.D. and F.E.C.; methodology, J.R.D., A.J.D., C.C.T., S.G., A.-G.E.A., N.W.H.M. and B.R.C.; software, A.J.D. and A.-G.E.A.; formal analysis, J.R.D., A.J.D. and A.-G.E.A.; resources, F.E.C. and J.R.D.; data curation, A.J.D. and A.-G.E.A.; writing—original draft preparation, J.R.D. and O.R.B.; writing—review and editing, J.R.D.; project administration, F.E.C.; funding acquisition, F.E.C. All authors have read and agreed to the published version of the manuscript.

Funding

This research was funded jointly by the New Zealand Ministry of Business, Innovation and Employment (MBIE) Endeavour Fund and the Living Waters partnership.

Data Availability Statement

Data available on reasonable request.

Conflicts of Interest

The authors declare no conflict of interest.

References

  1. Walker, S.; Price, R.; Rutledge, D.; Stephens, R.T.T.; Lee, W.G. Recent loss of indigenous cover in New Zealand. N. Z. J. Ecol. 2006, 30, 169–177. [Google Scholar]
  2. Dymond, J.; Ausseil, A.-G.E.; Peltzer, D.A.; Herzig, A. Conditions and trends of ecosystem services in New Zealand—A synopsis. Solutions 2015, 6, 38–45. [Google Scholar]
  3. Dymond, J.R.; Ausseil, A.G.E.; Ekanayake, J.C.; Kirschbaum, M.U.F. Tradeoffs between soil, water, and carbon—A national scale analysis from New Zealand. J. Environ. Manag. 2012, 95, 124–131. [Google Scholar] [CrossRef] [PubMed]
  4. Davies-Colley, R.J. River water quality in New Zealand: An introduction and overview. In Ecosystem Services in New Zealand—Conditions and Trends; Dymond, J.R., Ed.; Manaaki Whenua Press: Lincoln, New Zealand, 2013; pp. 432–447. [Google Scholar]
  5. Parfitt, R.L.; Baisden, W.T.; Schipper, L.A.; Mackay, A.D. Nitrogen inputs and outputs for New Zealand at national and regional scales: Past, present and future scenarios. J. R. Soc. N. Z. 2008, 38, 71–87. [Google Scholar] [CrossRef]
  6. McDowell, R.W.; Hedley, M.J.; Pletnyakov, P.; Rissmann, C.; Catto, W.; Patrick, W. Why are median phosphorus concentrations improving in New Zealand streams and rivers? J. R. Soc. N. Z. 2019, 49, 143–170. [Google Scholar] [CrossRef]
  7. Ausseil, A.G.; Kirschbaum, M.U.F.; Andrew, R.M.; McNeill, S.J.; Dymond, J.R.; Carswell, F.E.; Mason, N.W.H. Climate regulation in New Zealand: Contribution of natural and managed ecosystems. In Ecosystem Services in New Zealand—Conditions and Trends; Dymond, J.R., Ed.; Manaaki Whenua Press: Lincoln, New Zealand, 2013; pp. 386–399. [Google Scholar]
  8. Dymond, J.R.; Ausseil, A.G.; Kirschbaum, M.U.F.; Carswell, F.E.; Mason, N.W.H. Opportunities for restoring indigenous forest in New Zealand. J. R. Soc. N. Z. 2013, 43, 141–153. [Google Scholar] [CrossRef] [Green Version]
  9. Clarkson, B.R.; Ausseil, A.-G.E.; Gerbeaux, P. Wetland ecosystem services. In Ecosystem Services in New Zealand—Conditions and Trends; Dymond, J.R., Ed.; Manaaki Whenua Press: Lincoln, New Zealand, 2013; pp. 192–202. [Google Scholar]
  10. Living Water. Dairy and Freshwater Thriving Together. Available online: https://www.livingwater.net.nz/ (accessed on 25 July 2023).
  11. Basher, L.R. Erosion processes and their control in New Zealand. In Ecosystem Services in New Zealand: Conditions and Trends; Dymond, J.R., Ed.; Manaaki Whenua Press: Lincoln, New Zealand, 2013; pp. 363–374. [Google Scholar]
  12. Monaghan, R.M.; Hedley, M.J.; Di, H.J.; McDowell, R.W.; Cameron, K.C.; Ledgard, S.F. Nutrient management in New Zealand pastures—Recent developments and future issues. N. Z. J. Agric. Res. 2007, 50, 181–201. [Google Scholar] [CrossRef] [Green Version]
  13. Lyttle, I. The role of nutrient budgeting in farm and environmental management. In Farm Environmental Planning—Science, Policy and Practice; Currie, L.D., Christensen, C.L., Eds.; Fertilizer and Lime Research Centre, Massey University: Palmerston North, New Zealand, 2018; pp. 1–7. [Google Scholar]
  14. Collins, R.; McLeod, M.; Hedley, M.; Donnison, A.; Close, M.; Hanly, J.; Horne, D.; Ross, C.; Davies-Colley, R.; Bagshaw, C.; et al. Best management practices to mitigate faecal contamination by livestock of New Zealand waters. N. Z. J. Agric. Res. 2007, 50, 267–278. [Google Scholar] [CrossRef]
  15. Daigneault, A.J.; Eppink, F.V.; Lee, W.G. A national riparian restoration programme in New Zealand: Is it value for money? J. Environ. Manag. 2017, 187, 166–177. [Google Scholar] [CrossRef]
  16. Dymond, J.R.; Serezat, D.; Ausseil, A.G.E.; Muirhead, R.W. Mapping of Escherichia coli Sources Connected to Waterways in the Ruamahanga Catchment, New Zealand. Environ. Sci. Technol. 2016, 50, 1897–1905. [Google Scholar] [CrossRef]
  17. Barry, L.E.; Yao, R.T.; Harrison, D.R.; Paragahawewa, U.H.; Pannell, D.J. Enhancing ecosystem services through afforestation: How policy can help. Land Use Policy 2014, 39, 135–145. [Google Scholar] [CrossRef]
  18. Allen, R.B.; Bellingham, P.J.; Holdaway, R.J.; Wiser, S.K. New Zealand’s indigenous forests and shrublands. In Ecosystem Services in New Zealand—Conditions and Trends; Dymond, J.R., Ed.; Manaaki Whenua Press: Lincoln, New Zealand, 2013; pp. 34–48. [Google Scholar]
  19. Kragt, M.E.; Newham, L.T.H.; Bennett, J.; Jakeman, A.J. An integrated approach to linking economic valuation and catchment modelling. Environ. Model. Softw. 2011, 26, 92–102. [Google Scholar] [CrossRef]
  20. Jakeman, A.J.; Letcher, R.A. Integrated assessment and modelling: Features, principles and examples for catchment management. Environ. Model. Softw. 2003, 18, 491–501. [Google Scholar] [CrossRef]
  21. Pattanayak, S.K.; McCarl, B.A.; Sommer, A.J.; Murray, B.C.; Bondelid, T.; Gillig, D.; DeAngelo, B. Water quality co-effects of greenhouse gas mitigation in U.S. agriculture. Clim. Chang. 2005, 71, 341–372. [Google Scholar] [CrossRef]
  22. Daigneault, A.; Greenhalgh, S.; Samarasinghe, O. Economic impacts of multiple agro-environmental policies on New Zealand land use. Environ. Resour. Econ. 2018, 69, 763–785. [Google Scholar] [CrossRef]
  23. Bateman, I.J.; Harwood, A.R.; Abson, D.J.; Andrews, B.; Crowe, A.; Dugdale, S.; Fezzi, C.; Foden, J.; Hadley, D.; Haines-Young, R.; et al. Economic analysis for the UK National Ecosystem Assessment: Synthesis and scenario valuation of changes in ecosystem services. Environ. Resour. Econ. 2014, 57, 273–297. [Google Scholar] [CrossRef]
  24. Heckelei, T.; Britz, W.; Zhang, Y. Positive mathematical programming approaches—Recent developments in literature and applied modelling. Bio-Based Appl. Econ. 2012, 1, 109–124. [Google Scholar]
  25. Trodahl, M.I.; Jackson, B.M.; Deslippe, J.R.; Metherell, A.K. Investigating trade-offs between water quality and agricultural productivity using the Land Utilisation and Capability Indicator (LUCI)–A New Zealand application. Ecosyst. Serv. 2017, 26, 388–399. [Google Scholar] [CrossRef]
  26. Kelly, R.A.; Jakeman, A.J.; Barreteau, O.; Borsuk, M.E.; ElSawah, S.; Hamilton, S.H.; Henriksen, H.J.; Kuikka, S.; Maier, H.R.; Rizzoli, A.E.; et al. Selecting among five common modelling approaches for integrated environmental assessment and management. Environ. Model. Softw. 2013, 47, 159–181. [Google Scholar] [CrossRef]
  27. Department of Conservation. New Zealand Threat Classification System. Available online: https://nztcs.org.nz/ (accessed on 25 July 2023).
  28. Ausseil, A.G.E.; Dymond, J.R.; Kirschbaum, M.U.F.; Andrew, R.M.; Parfitt, R.L. Assessment of multiple ecosystem services in New Zealand at the catchment scale. Environ. Model. Softw. 2013, 43, 37–48. [Google Scholar] [CrossRef]
  29. Askin, D.; Askin, V. Financial Budget Manual 2012/13; Lincoln University Press: Lincoln, New Zealand, 2012. [Google Scholar]
  30. Dymond, J.R.; Herzig, A.; Basher, L.; Betts, H.D.; Marden, M.; Phillips, C.J.; Ausseil, A.G.E.; Palmer, D.J.; Clark, M.; Roygard, J. Development of a New Zealand SedNet model for assessment of catchment-wide soil-conservation works. Geomorphology 2016, 257, 85–93. [Google Scholar] [CrossRef]
  31. Dymond, J.R.; Betts, H.D.; Schierlitz, C.S. An erosion model for evaluating regional land-use scenarios. Environ. Model. Softw. 2010, 25, 289–298. [Google Scholar] [CrossRef]
  32. Yao, R.T.; Harrison, D.R.; Velarde, S.J.; Barry, L.E. Validation and enhancement of a spatial economic tool for assessing ecosystem services provided by planted forests. For. Policy Econ. 2016, 72, 122–131. [Google Scholar] [CrossRef]
  33. Elliott, A.H.; Semadeni-Davies, A.F.; Shankar, U.; Zeldis, J.R.; Wheeler, D.M.; Plew, D.R.; Rys, G.J.; Harris, S.R. A national-scale GIS-based system for modelling impacts of land use on water quality. Environ. Model. Softw. 2016, 86, 131–144. [Google Scholar] [CrossRef]
  34. Overseer Scientific Model. Available online: https://www.overseer.org.nz/our-model (accessed on 25 July 2023).
  35. Parfitt, R.L.; Percival, H.J.; Dahlgren, R.A.; Hill, L.F. Soil and solution chemistry under pasture and radiata pine in New Zealand. Plant Soil 1997, 191, 279–290. [Google Scholar] [CrossRef]
  36. Lilburne, L.; Webb, T.; Ford, R.; Bidwell, V. Estimating Nitrate-Nitrogen Leaching Rates under Rural Land Uses in Canterbury: Environment Canterbury Report No. R10/127; Environment Canterbury: Christchurch, New Zealand, 2010. [Google Scholar]
  37. Ministry for the Environment. New Zealand’s Greenhouse Gas Inventory 1990–2015; Publication number: ME 1309; Ministry for the Environment: Wellington, New Zealand, 2015. [Google Scholar]
  38. Vibart, R.; Vogeler, I.; Dennis, S.; Kaye-Blake, W.; Monaghan, R.; Burggraaf, V.; Beautrais, J.; Mackay, A. A regional assessment of the cost and effectiveness of mitigation measures for reducing nutrient losses to water and greenhouse gas emissions to air from pastoral farms. J. Environ. Manag. 2015, 156, 276–289. [Google Scholar] [CrossRef]
  39. Daigneault, A.; Greenhalgh, S.; Samarasinghe, O. Equitably slicing the pie: Water policy and allocation. Ecol. Econ. 2017, 131, 449–459. [Google Scholar] [CrossRef]
  40. Matheson, L.; Djanibekov, U. Recommended Mitigation Bundles for Cost Analysis of Mitigation of Sediment and Other Freshwater Contaminants in the Rangitāiki and Kaituna-Pongakawa-Waitahanui Water Management Areas; Prepared for the Bay of Plenty Regional Council: Whakatane, New Zealand, 2018. [Google Scholar]
  41. Robertson, G.P.; Gross, K.L.; Hamilton, S.K.; Landis, D.A.; Schmidt, T.M.; Snapp, S.S.; Swinton, S.M. Farming for ecosystem services: An ecological approach to production agriculture. Bioscience 2014, 64, 404–415. [Google Scholar] [CrossRef]
  42. Northland Regional Council. Keeping Stock out of Waterways. Available online: https://www.nrc.govt.nz/environment/farm-management/keeping-stock-out-of-waterways/ (accessed on 25 July 2023).
  43. Fountain, E.D.; Wratten, S.D. A narrative of agriculture and biodiversity loss. In Ecosystem Services in New Zealand—Conditions and Trends; Dymond, J.R., Ed.; Manaaki Whenua Press: Lincoln, New Zealand, 2013; pp. 115–120. [Google Scholar]
  44. Aislabie, J.; Julie, R. Deslippe Soil microbes and their contribution to ecosystem services. In Ecosystem Services in New Zealand—Conditions and Trends; Dymond, J.R., Ed.; Manaaki Whenua Press: Lincoln, New Zealand, 2018; pp. 143–161. [Google Scholar]
  45. Patterson, M.G.; Cole, A.O. “Total economic value” of New Zealand’s Land-based ecosystems and their services. In Ecosystem Services in New Zealand—Conditions and Trends; Dymond, J.R., Ed.; Manaaki Whenua Press: Lincoln, New Zealand, 2013; pp. 496–510. [Google Scholar]
  46. Meeus, J.H.A.; Wijermans, M.P.; Vroom, M.J. Agricultural landscapes in Europe and their transformation. Landsc. Urban Plan. 1990, 18, 289–352. [Google Scholar] [CrossRef]
  47. Bernués, A.; Alfnes, F.; Clemetsen, M.; Eik, L.O.; Faccioni, G.; Ramanzin, M.; Ripoll-Bosch, R.; Rodríguez-Ortega, T.; Sturaro, E. Exploring social preferences for ecosystem services of multifunctional agriculture across policy scenarios. Ecosyst. Serv. 2019, 39, 101002. [Google Scholar] [CrossRef]
  48. Tittonell, P.; Hara, S.M.; Álvarez, V.E.; Aramayo, V.M.; Bruzzone, O.A.; Easdale, M.H.; Enriquez, A.S.; Laborda, L.; Trinco, F.D.; Villagra, S.E.; et al. Ecosystem services and disservices associated with pastoral systems from Patagonia, Argentina—A review. Cah. Agric. 2021, 30, 43. [Google Scholar] [CrossRef]
  49. Uddin, M.E.; Kebreab, E. Review: Impact of Food and Climate Change on Pastoral Industries. Front. Sustain. Food Syst. 2020, 4, 1–13. [Google Scholar] [CrossRef]
  50. Yang, H.J.; Gou, X.H.; Yin, D.C.; Du, M.M.; Liu, L.Y.; Wang, K. Research on the coordinated development of ecosystem services and well-being in agricultural and pastoral areas. J. Environ. Manag. 2022, 304, 114300. [Google Scholar] [CrossRef] [PubMed]
Figure 1. Land use in the upper Wairua catchment.
Land 12 01482 g001
Table 1. Description of model scenarios run for the upper Wairua catchment.
Scenario NameDescription
BaselineNo explicit on-farm mitigation options implemented. Establishes the level of economic and environmental outputs (including ecosystem services) against which all other scenarios are measured.
Designed Flood Control
Flood retention bunds—AllFlood retention bund constructed in each of the 2000 level-1 sub-catchments in the upper Wairua.
Wetlands—AllWetland constructed/restored in each of the 2000 level-1 sub-catchments in the upper Wairua.
Sacrificial pocketEntire Otonga pocket converted into sacrificial area for flood control at a total land cost of NZD 10 million.
Farm Plan Development and Afforestation for Land-Based Erosion Control
Min soil conservation planA total of 10% of all farms have soil conservation plan implemented for erosion control.
Worst 20% soil conservation planWorst 20% of sheep and beef farms (based on total erosion) implement farm plan for optimal erosion control.
All soil conservation planAll sheep and beef farms in catchment implement farm plan for optimal erosion control.
Afforestation—All hill farmsAll upland (hill) pastoral farms converted to pine plantations. Represents upper bound of potential reductions in the upper catchment.
Afforestation—All farmsAll farms in the catchment converted to pine plantations. Represents upper bound of potential reductions in the entire catchment.
Fencing Streams
Current FencingA total of 75% of all dairy and 25% of all other pastoral farm streams along ‘permanent’ waterways are fenced.
Fence all streamsAll pastoral streams along permanent waterways in the catchment are fenced.
Passive riparian buffers—AllAll pastoral streams along permanent waterways in the catchment are fenced 5 m out with passively (naturally) regenerated riparian buffers.
Active riparian buffers—AllAll pastoral streams along permanent waterways in the catchment are fenced 5 m out with actively planted riparian buffers.
Mitigation Combination: Sediment Focused
Current fencing and farm plan comboA total of 10% of all farms have a plan implemented for erosion control; 75% of all dairy and 25% of all other pastoral farm streams along ‘permanent’ waterways are fenced.
Bunds, farm plans, and riparian planting—AllAll eligible land implements bunds, farm plans, and active riparian planting are along permanent streams. Likely to be the upper bound of mitigation potential.
All bunds and fencing; worst 20% farm planAll land in catchment construct bunds; all pastoral farms fence permanent waterways; worst 20% of sheep and beef farms (based on total erosion) implement farm plan for optimal erosion control.
Mitigation Combination: Nutrient Focused
Low mitigation bundleAll farms implement relatively cost-effective measures with minimal complexity to farm systems and management, including bund construction.
Medium mitigation bundleInclude low bundle, but also implement mitigation that is somewhat costlier, although requires limited capital or systems change.
High mitigation bundleInclude low and medium bundle, but also implement management options with large capital costs.
Outcome-Based: Sediment Reduction Targets
Sediment reduction 20%Catchment-wide 20% annual reduction in total sediment.
Sediment reduction 40%Catchment-wide 40% annual reduction in total sediment.
Sediment reduction 60%Catchment-wide 60% annual reduction in total sediment.
Table 2. Baseline annual farm earnings and environmental outputs by land use.
Land UseArea (ha)Net Revenue (NZD)Soil Erosion (t)Stream E. coli (peta)N Leach (t)P Loss (t)Net GHG (tCO2e)
Dairy27,91434,357,00068,900126.469125.4190,600
Sheep and beef29,8394,033,00054,60052.344822.787,500
Other pastoral236240,0004000.810.1200
Arable and horticulture10285,309,00013000.1160.21200
Forestry65384,038,00013,3000.3131.3−79,500
Lifestyle2515200033000.0311.65900
Native bush4475400010,6000.250.4−2600
Other1180100029000.100.00
Total73,72547,984,000155,700180.0120551.7203,300
Table 3. Estimated net revenue and environmental outputs of model scenarios.
Scenario
% Change from No Mitigation Baseline
Total Annual Cost (NZD)Net Revenue (NZD)Total Erosion (kt)Stream E. coli (peta)N Leach (t)P Loss (t)Net GHG (ktCO2e)Water Spilled Design Flood (Million m3)
BaselineNZD 0NZD 48.0155.7180.01,20551.7203.310.0
Flood retention bunds—AllNZD 688,000−1%−31%−30%0%−14%0%−25%
Wetlands—AllNZD 2,714,000−6%−34%−55%−10%−42%0%−5%
Sacrificial pocketNZD 928,000−2%−1%−1%−2%−3%−3%−17%
Min soil conservation planNZD 171,0000%−4%0%0%−2%−1%0%
Worst 20% soil conservation planNZD 376,000−1%−18%0%0%−4%−1%0%
All S&B soil conservation planNZD 993,000−2%−25%0%0%−9%−3%0%
Afforestation—All hill farmsNZD 41,0000%−28%−28%−25%−40%−43%0%
Afforestation—All farmsNZD 29,637,000−62%−80%−98%−92%−88%−139%0%
Current fencingNZD 1,789,000−4%−11%−36%−8%−10%−4%0%
Fence all streamsNZD 4,608,000−10%−20%−60%−12%−19%−7%0%
Passive riparian buffers—AllNZD 6,792,000−14%−45%−60%−27%−31%−3%0%
Active riparian buffers—AllNZD 8,241,000−17%−45%−60%−27%−31%−6%0%
Current fencing and farm plan comboNZD 1,154,000−2%−18%−36%−8%−8%0%0%
Bunds, farm plans, riparian planting—AllNZD 10,530,000−22%−56%−60%−27%−31%−8%−25%
All bunds and fencing; worst 20% farm planNZD 4,164,000−9%−56%−60%−12%−16%−1%−25%
Low mitigation bundle NZD 4,681,000−10%−46%−50%−21%−22%−8%−20%
Medium mitigation bundleNZD 5,958,000−12%−46%−50%−34%−36%−7%−20%
High mitigation bundleNZD 23,622,000−49%−46%−50%−53%−43%−13%−20%
Sediment reduction 20%NZD 82,0000%−20%−6%−1%−2%0%−2%
Sediment reduction 40%NZD 375,000−1%−40%−16%−2%−7%−1%−5%
Sediment reduction 60%NZD 1,129,000−2%−60%−29%−5%−14%−2%−6%
Disclaimer/Publisher’s Note: The statements, opinions and data contained in all publications are solely those of the individual author(s) and contributor(s) and not of MDPI and/or the editor(s). MDPI and/or the editor(s) disclaim responsibility for any injury to people or property resulting from any ideas, methods, instructions or products referred to in the content.

