Abstract
Soil organic carbon is very important to increase crop yield. Understanding the composition changes and migration characteristics of SOC under different irrigation conditions in arid oasis areas is of great significance for the sustainable development of agro-ecosystem and the estimation of carbon balance of farmland ecosystem in arid areas. In this paper, classical statistics and geostatistics were used to study the leaching characteristics and migration laws of soil organic carbon under different irrigation conditions in Minqin Oasis, and the leaching amount and loss process and mechanism of SOC under different irrigation conditions were quantified. The research results showed that: (1) Irrigation increased the average 0–100 cm SOC content. After irrigation, SOC content decreased first and then increased with the increase in soil depth, with the maximum value of 8.56 g/kg and the minimum value of 1.82 g/kg. Compared with that before irrigation, SOC content in 0–30 cm surface layer was in leaching state, SOC content in 30–70 cm surface layer was accumulated, and SOC content in 70–100 cm surface layer had no obvious change. (2) Water was an important factor affecting soil carbon. The greater the irrigation amount, the higher the carbon leaching rate and the greater the migration amount. The SOC content in 0–30 cm soil layer was most significantly affected by irrigation, and the migration amount of SOC gradually decreased with the increase in soil depth. The maximum leaching rate of SOC was 36.8%, the minimum leaching rate was 13.5%, and its average leaching rate was 23.4%. (3) Due to the influence of soil infiltration rate under water, SOC content in different irrigation periods showed that the greatest SOC occurred in the 0–70 cm layer, and SOC content in soil was basically the same as that in non-irrigated areas on the fifth day after irrigation. (4) Precipitation, plastic film mulching, soil physical and chemical properties and other environmental factors were important factors affecting the migration and change in SOC content.
1. Introduction
Soil organic carbon (SOC) is the most important and active carbon pool in the terrestrial ecosystem of the earth, and it is also an important material basis of soil fertility and basic soil fertility, which plays an important role in increasing crop yield and slowing down greenhouse gas emissions [1]. It is estimated that the storage of organic carbon in the surface soil (SOC) is about 2000 PgC, accounting for two-thirds of the terrestrial carbon pool [2], among them, the carbon stored in farmland accounts for 8–10% of the soil carbon pool, which plays an important role in the terrestrial carbon cycle [3]. Soil carbon leaching has a significant effect on improving the estimation of carbon balance of terrestrial ecosystem, and it is the basis of evaluating the transfer of carbon between inland water and aquifer water through soil [4]. It is estimated that about 7 g m−2 a−1 in terrestrial ecosystem migrates with precipitation and irrigation per year, resulting in a large loss of SOC, causing the change in soil carbon transmission in the process of carbon cycle, and promoting the imbalance of carbon cycle system in landscape unit inland ecosystem [5]. Therefore, the influence of irrigation on the leaching and accumulation of carbon in the process of water circulation is an important direction for seeking carbon lost sinks at present and in the future [6].
Irrigation is one of the fundamental measures to ensure agricultural production in arid areas. As an important measure of agricultural production activities, irrigation is an important driving factor for SOC change [7,8]. In recent years, many scholars at home and abroad have carried out relevant research on the migration of soil organic carbon under irrigation and obtained different research results. Some scholars believe that irrigation is the most potential management measure for carbon sequestration [9]. Irrigation can increase the input and output of soil carbon and the storage of soil carbon [10], especially in the surface soil of arid areas [11,12]. For example, Ref. [13] studied in arid areas of the United States, showing that the SOC content in irrigated areas is significantly higher than that in non-irrigated fields. Some scholars have studied in semi-arid subtropical areas of India, showing that irrigation can increase SOC content in the surface layer (0–15 cm) of rice and wheat [14]. A survey of Iran showed that SOC content increased significantly after desert was transformed into irrigated farmland [15]. Ref. [16] studied the SOC content changes of three types under multiple irrigation time series in Xinjiang Oasis. The results showed that the SOC content in the topsoil increased rapidly in the initial years of irrigation cultivation, and tended to be flat in the later period. Irrigation not only leads to the soil erosion, but also accompanied by a large amount of soil organic carbon and nutrient migration, which has a great impact on the ecological environment [17,18]. Some scholars found that the SOC decreased before and after leaching, and the deeper the soil layer, the more difficult it was to leach [19]. The total organic carbon in different irrigation treatments decreased with the deepening of soil layer, and the change was mainly concentrated in 0–50 cm soil layer [20]. However, due to irrigation water quality, irrigation years and methods, soil properties and climate characteristics, migration characteristics of SOC under different irrigation conditions have obvious regional characteristics.
Diversion irrigation by canals is widespread in arid and semi-arid areas of northwest China [21]. Minqin Oasis is an area with the earliest development of irrigation agriculture, the largest population density, the most prominent contradiction between water supply and demand and the most serious ecological and environmental problems in the inland river basin of northwest China [22], which seriously affects the sustainable development of oasis. Soil organic carbon, as an important index to evaluate soil fertility, is an effective means to increase crop yield in arid and semi-arid irrigation areas. Understanding composition changes and migration characteristics of SOC under irrigation conditions in desert oasis areas is very important for the stability of agro-ecosystem [20,23,24]. Based on this, this paper took Minqin Oasis in Shiyang River Basin as the research area, and took oasis farmland as an example, studied the leaching characteristics and migration laws of soil organic carbon under different irrigation conditions, and discussed the process and mechanism of organic carbon loss under irrigation. The research helps to evaluate the changes in soil carbon pool in artificial oasis in arid areas, and can enhance the understanding of the impact of human activities on carbon sources and sinks in arid areas, which is of great significance for understanding the carbon transmission in the process of agricultural irrigation water cycle in arid areas.
2. Study Area
Minqin Oasis lies between 38°05′–39°06′ N and 102°02′–103°02′ E, covering an area of about 16,000 square kilometers. Minqin Oasis is located on the north side of the east section of Hexi Corridor in Gansu Province and the lower reaches of Shiyang River at the east end of Hexi Corridor. It is surrounded by Badain Jaran and Tengger deserts in the east, west and north, and adjoins Wuwei Basin in the south (Figure 1). Minqin Oasis belongs to a typical continental desert climate, which is characterized by drought and little rain all year round, strong solar radiation, abundant sunshine, large temperature difference between day and night and strong evaporation. Minqin Oasis is one of the extreme arid areas in China with an average annual precipitation of 115 mm and an average annual temperature of 8.2 °C. The main types of soil in oasis are grey brown desert soil, aeolian sandy soil, saline soil, and oasis irrigation and silting soil, among them, oasis cultivated soil is mainly irrigation and silting soil evolved under long-term cultivation, irrigation and fertilization. There are typical desert vegetation landscapes in Minqin Oasis, in which Nitraria tangutorum, Reaumuria soongorica and Artemisia selengensis are the main natural vegetation, Haloxylon ammodendron, Elaeagnus angustifolia and Tamarix chinensis are the main artificial vegetation, and wheat, corn and other food crops are mainly planted in the oasis. Shiyang River is the only external surface runoff in Minqin Oasis, but in recent years, due to the change in atmospheric environment and the influence of human activities in the upper and middle reaches, the runoff change rate of Shiyang River in Minqin is larger.
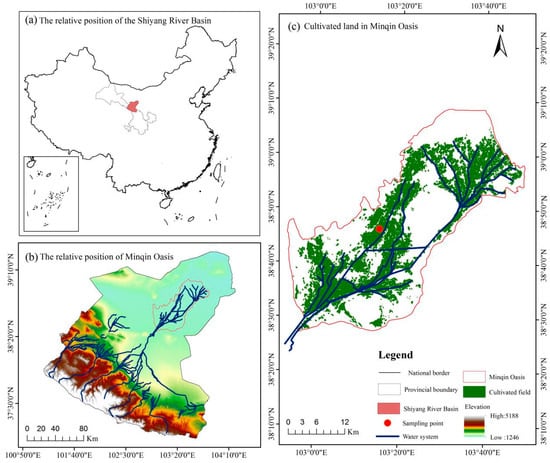
Figure 1.
Study area and observation system. (a) The relative position of the Shiyang River Basin, (b) The relative position of Minqin Oasis, (c) Cultivated land in Minqin Oasis.
3. Data and Methods
3.1. Collection and Analysis of Soil Samples
On the basis of comprehensive consideration of the spatial pattern of topography and land use, a sample plot was selected in Beidan Village (38°79′ N,103°23′ E) in the middle of Minqin Oasis from April 2018 to October 2019. We used a hand-held auger with a diameter of 6.9 cm to collect fresh soil samples from a 1 m soil layer in the sample plot. The samples were collected in 0–5 cm, 5–10 cm, 10–20 cm, 20–30 cm, 30–40 cm, 40–50 cm, 50–60 cm, 60–70 cm, 70–80 cm, 80–90 cm and 90–100 cm soil layers. During the sampling process, every time we took soil samples, we cleaned the upper soil to prevent the upper soil from falling and other factors affecting the collection of the lower soil. The sampling plan was made dense, before and after irrigation, sampled once before irrigation, and sampled continuously for five days after irrigation. The sample bottles were filled with collected soil samples, we accurately located the sampling points by GPS, and recorded the altitude and soil water content at the same time. The average temperature in the ground was 14.25 °C and precipitation was mainly concentrated from June to September. The soil texture within 1 m in the sample plot was mainly loam and sandy loam (Table 1). The crops were mainly corn, the irrigation was mainly well water or canal water, and the irrigation method was flood irrigation. In the sampling period, there were six irrigation events, all of which were well water irrigation, and the irrigation amount was monitored by the intelligent water distributor terminal of HZQP-DIC card. The film coverage rate in the sample plot was between 80% and 85%.

Table 1.
Physical and chemical properties of sample soil.
3.2. Analysis of Soil Data
3.2.1. Data of Organic Carbon Content
In the laboratory, soil samples were air-dried and gravel and roots were removed by using a 2 mm sieve, and SOC concentration was determined by wet oxidation with dichromate. In the study, all soil profiles were divided into five levels: 0–20 cm, 20–40 cm, 40–60, 60–80 and 80–100 cm. The ANOVA method in SPSS22 software (IBM SPSS Inc., Chicago, IL, USA) was used for data analysis. The calculation formula is:
where, C2: Concentration of ferrous sulfate standard solution: V1: Consumption of ferrous sulfate volume.
where, C: Organic carbon content g/kg; V0: Volume of ferrous sulfate consumed by two blanks; V: Volume of ferrous sulfate consumed by each sample; M: Sample quality.
3.2.2. Data of Soil Water Content
Soil water content (SWC): The wet weight (M1) of soil was measured on site every time when collecting soil samples, and then put into an aluminum box and brought back to the laboratory to be dried at 105 °C for 24 h, and the dry weight (M2) was weighed, and the mass of the aluminum box was (M0), thus calculating the soil water content. The calculation formula is:
3.2.3. Data of Soil Bulk Density
Measurement of soil bulk density (SBD): It was measured once a month from April to the end of October, 2018, and the soil was taken from 0~10 cm, 10~20 cm and 20~30 cm by ring knife method. The volume of the ring knife was V and the weight (G) of wet soil in the ring knife on site was measured, brought back to the laboratory and dried at 105 °C for 24 h, then soil water content (W) was measured and soil bulk density was calculated. The calculation formula is:
3.2.4. Data of Soil Particle Size
The measurement of soil particle size used Mastersizer 2000 laser particle size analyzer (by volume fraction) produced by Malvern Company, Great Malvern, UK to measure the particle size of 0–100 cm soil layer, and the measuring range of the instrument was 0.01–3500 μm. Soil particle size was classified according to the American soil particle size classification standard. Clay (<2 μm), silt (2–50 μm) and sand (50–1000 μm) [25]. GRADISTAT particle size processing software was used for data processing.
3.2.5. Meteorological Data
The meteorological data used in this paper (Table 2) came from the automatic meteorological recorder set up at the sampling point of Northwest Normal University and China Meteorological Data Network (http://cdc.cma.gov.cn, accessed on 29 June 2023), and the main data obtained were temperature (MAT) and precipitation (AP).
Table 2.
Monthly precipitation and average temperature in the study area.
4. Result Analysis
4.1. Comparison of Soil Organic Carbon before and after Irrigation
Comparing the SOC content of soil before and after six irrigation events, it was found that irrigation increased the average SOC content of 0–100 cm soil layer in the sample plot (Figure 2). Before irrigation, the SOC content tend to be consistent with the increase in soil depth, that is, the SOC content at 0–30 cm decreased gradually with the increase in soil depth, and its minimum value was 3.25 g/kg. The SOC content below 30 cm had an M-shaped change pattern of “first increasing, then decreasing, then increasing and then decreasing”, with the maximum value of 8.75 g/kg and the minimum value of 1.25 g/kg. The SOC content at 0–5 cm surface layer was the highest, and its average value was more than 5 g/kg. After irrigation leaching, the organic carbon in each soil layer decreased first and then increased with the increase in soil depth, which mainly showed that SOC content in 0–30 cm surface layer decreased significantly compared with that before irrigation, and SOC content in 30–70 cm surface layer increased compared with that before irrigation, but SOC content in 70–100 cm bottom soil had no significant change.
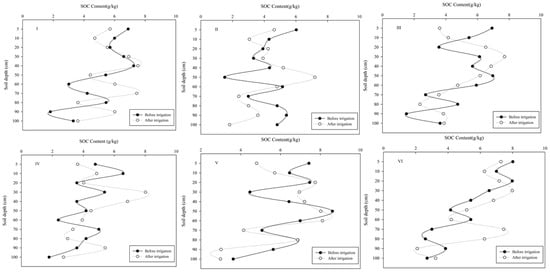
Figure 2.
The change characteristics of SOC content before and after irrigation. I–VI represents six irrigation events.
4.2. Migration Amount of SOC under Different Irrigation Conditions
As shown in Figure 3, there were significant differences in migration amount of SOC at different depths under the same irrigation condition, and the migration amount of organic carbon in each soil profile gradually decreased with the increase in soil depth. There was a significant positive correlation between migration amount of SOC and irrigation amount in 0–30 cm of surface soil and 30–70 cm of middle soil (p < 0.001, r = 0.98), that is, the carbon leaching rate under high irrigation amount was higher than that under low irrigation amount, but there was no significant correlation between migration amount of SOC and irrigation amount in 70–100 cm of bottom soil (p < 0.5, r = 0.12). Migration amount of SOC at 0–30 cm of surface soil was significantly higher than that at 30–70 cm of middle layer and 70–100 cm of bottom layer, which indicated that SOC was in leaching state after irrigation at 0–30 cm of surface soil, and carbon lost from surface layer was trapped by the soil layer at 30–70 cm, which made carbon deposit at 30–100 cm, so the SOC content of the soil layer at 30–70 cm after irrigation was significantly higher than that of surface soil.
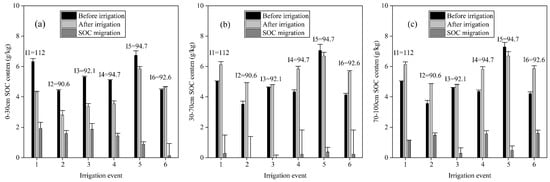
Figure 3.
Changes of migration amount of SOC under different irrigation conditions. (a) represents the SOC content be-fore and after irrigation and the amount of SOC migration in 0–30 cm soil, (b) represents the SOC content be-fore and after irrigation and the amount of SOC migration in 30–70 cm soil, (c) represents the SOC content before and after irrigation and the amount of SOC migration in 70–100 cm soil.
Under the same irrigation condition, the migration amount of SOC of surface layer (0–30 cm) was the largest, and the migration flux increased with the increase in irrigation water, with an average of 1.27 g/kg. The migration amount of organic carbon in 30–70 cm was significantly lower than that in 0–30 cm surface layer, and the average migration amount of SOC was 0.91 g/kg, and that in 70–100 cm soil layer was 0.37 g/kg. Under I1 irrigation condition with large irrigation amount, the migration flux of organic carbon was large, the interception effect of soil on organic carbon was relatively small, and organic carbon migrated downward and caused leaching loss. Under the conditions of I3, I4 and I5 irrigation, the organic carbon was leached at 0–30 cm, and accumulated at 30–100 cm. Under I2 and I6 irrigation conditions, organic carbon in 0–30 cm and 70–100 cm was in leaching state, while in the middle soil 30–70 cm was in accumulation state. This indicated that low irrigation amount had less effect on soil organic carbon leaching, while middle irrigation amount could intercept the organic carbon in the upper layer and high irrigation amount had a greater effect on soil carbon leaching.
There were significant differences in the migration amount of SOC under the same depth and different irrigation amounts. Among them, the 0–30 cm surface layer soil was most affected by irrigation, and the leaching rate increased with the increase in irrigation amount. Under six different irrigation conditions, the total migration amount of SOC content at 0–100 cm was 1.98 g/kg, 1.58 g/kg, 1.86 g/kg, 1.46 g/kg, 0.90 g/kg and 0.15 g/kg, respectively. The maximum leaching rate of SOC was 36.8%, the minimum leaching rate was 13.5%, and its average leaching rate was 23.4%. The migration amount of SOC in the middle soil 30–70 cm under six different irrigation conditions was negative, which was −0.15, −1.13, −1.40, −0.22, −1.54, 0.40 and −1.55, respectively, which indicated that the organic carbon lost in the upper layer is trapped in this layer, resulting in the accumulation of organic carbon. Among them, except for the fifth irrigation, the SOC content in the sample plots was in a leaching state, and the SOC content in the other five irrigation plots was in a cumulative state. The highest cumulative rate appeared at I3, and the cumulative rate was 95.28%, indicating that moderate irrigation was helpful to the accumulation of organic carbon in the middle soil. In addition, in arid ecosystems, precipitation can reduce soil water stress [26], increase soil nutrients, increase biomass of vegetation types, and thus promote an increase in SOC storage.
4.3. Migration Law of Soil Organic Carbon during Irrigation Period
In order to further discuss the change in SOC content in different soil layers after irrigation, six irrigations with different irrigation amounts were monitored for five consecutive days (I1 = 112 mm, I2 = 90.6 mm, I3 = 92.1 mm, I4 = 94.7 mm, I5 = 94.7 mm, I6 = 92.6 mm) (Figure 4). The results showed that SOC content changed with time in six different irrigation periods, that is, SOC content in 10–40 cm and 40–70 cm was significantly higher than that in other soil layers in the first four days after irrigation, SOC in 0–10 cm surface layer migrated downward with irrigation infiltration and accumulated in middle soil, while SOC in bottom soil was less affected by irrigation water. On the fifth day after irrigation, the change law of SOC content in soil was basically the same as that before irrigation.
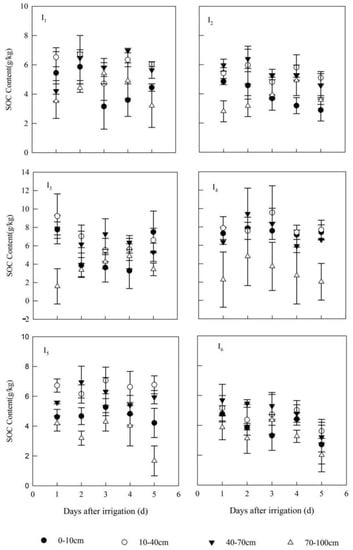
Figure 4.
Change characteristics and migration law of SOC during irrigation period. I1–I6 represents six irrigation events.
Due to the different irrigation amount of water, SOC content changed differently in different irrigation leaching cycles. In I1 irrigation period, the SOC content fluctuated and increased in the first two days, and the peak value of SOC content appeared on the second day, then fluctuated and decreased to slightly increase on the fourth day, but it was smaller than the SOC content on the second day. Under the conditions of I2, I4 and I5 irrigation, the change law of SOC content tend to be consistent. The highest SOC content appeared in the soil layer 40–70 cm on the second day after irrigation, and then showed a decreasing trend. The SOC content of each soil layer changed in the order of 3d > 2d > 1d > 4d > 5d with irrigation time. On the fifth day after irrigation, the soil layer showed a decreasing trend with the increase in soil depth. In I2 irrigation period, the maximum migration amount of soil SOC occurred at 10–40 cm of soil layer on the fourth day after irrigation, and the maximum migration amount was 2.61 g/kg. In I4 irrigation period, the maximum migration amount of SOC occurred at 40–70 cm of soil layer on the second day after irrigation, and the maximum migration amount was 1.86 g/kg. The maximum migration amount under I5 irrigation mainly occurred at 10–40 cm soil layer on the fifth day after irrigation, and the migration amount was 2.64 g/kg.
Under the conditions of I3 and I6 irrigation, the highest SOC content appeared on the first day after irrigation and at the 10–40 cm soil layer, and the SOC content of each soil layer first increased and then decreased in the first four days after irrigation. Among them, the change law of SOC content with time after irrigation was 1d > 3d > 2d > 4d > 5d. The highest SOC content appeared at 10–40 cm in the first two days after irrigation, and at 40–70 cm in the third and fourth days after irrigation. During the whole irrigation period, the migration of SOC mainly occurred on the first day after irrigation, from 10–40 cm to 40–70 cm, with the maximum migration amount of 4.34 g/kg.
5. Discussion
5.1. Influence of Irrigation Amount on Soil Organic Carbon Migration
According to the leaching results of 0–100 cm soil layer, the organic carbon in 0–30 cm soil layer decreased under different irrigation amounts, but increased significantly at 30–70 cm. On the one hand, because the surface soil is greatly influenced by human factors, the cultivated measures make the surface soil relatively loose to a certain extent, enhance the permeability of soil, and facilitate the downward migration of organic carbon. However, with the deepening of the soil layer, the soil microbial community is gradually single, which is not conducive to the decomposition of soil organic matter [27]. Moreover, the soil below the surface layer is less affected by management measures, and the organic carbon in the deep soil is gradually held by mineral clay to form carbon with complex structure [28], so the carbon storage capacity is strengthened and organic carbon is difficult to leach [29]. At the same time, cultivating will destroy the continuity of soil pores in the cultivated layer and between the cultivated layer and the lower layer [30], and produce a compact layer at the bottom of the cultivated layer [31], which is beneficial to the interception of organic carbon. With the deepening of soil layer, the hydrodynamic force gradually decreases, and the migration ability of organic carbon also gradually weakens, which leads to the accumulation of organic carbon.
Under the condition of six times irrigation, the migration amount of organic carbon showed a trend of increasing at first and then decreasing in the whole leaching cycle, indicating that soluble organic carbon was leached out first after irrigation. The main reason is that at the beginning of irrigation, a large amount of irrigation water changed the soil aggregate structure, which led to a large amount of organic carbon leaching in the soil with low aggregate degree, resulting in the high migration of organic carbon in the surface soil. At this time, the migration amount of organic carbon was correlated with soil physical and chemical properties (p < 0.5), but not with irrigation amount. With the time of irrigation, the migration amount of organic carbon gradually decreased, mainly because the soil was exposed to water for a long time, the soil water became saturated, the water-stable aggregates increased [32,33], the organic carbon that could be leached by the soil became less and less, and the migration amount of organic carbon became stable.
5.2. Influence of Precipitation on Organic Carbon Migration in Soil Profile in Irrigation Area
It can be seen from Figure 5 that SOC content had significant differences under different precipitation conditions, and the greater the precipitation (p < 0.001), the higher the SOC content. Precipitation leaching affects the vertical distribution of soil organic carbon content and increases the downward transport capacity of organic carbon [34]. Under the condition of no precipitation in irrigation area, due to the lack of rainwater leaching, organic matter is difficult to infiltrate, which makes organic matter accumulate in the soil surface layer (0–10 cm), and SOC content fluctuates and decreases with the increase in profile depth. The main reason is that drought reduces the ability of carbon in soil to migrate down with the flow of soil, which is not conducive to the deep accumulation of organic carbon. After precipitation, SOC content in irrigation area showed a changing trend of first decreasing, then rapidly increasing and then decreasing. That is, after precipitation, SOC content in 0–20 cm soil layer decreased rapidly, and SOC content in 30–40 cm soil layer increased rapidly, and then showed a fluctuating downward trend, mainly because precipitation could reduce soil water stress [34]. Especially in semi-arid and arid areas, crop survival and growth are affected by water stress. Precipitation can increase crop yield, crop productivity and residue input [35], thus increasing storage of SOC. It was also found that the SOC content of the lower soil in the irrigated area decreased by 18.43% (70–100 cm) when there was no precipitation, which was faster than that after normal precipitation (8.75%), which indicated that the lack of rain-drenched soil, the decline of soil moisture content will increase the proportion of soil unprotected organic carbon, make the stability of soil organic carbon decline, and is not conducive to the accumulation of soil organic carbon [36], further indicating the drought can promote the accumulation of organic carbon in the surface soil, but it is not conducive to the deep storage of soil organic carbon.
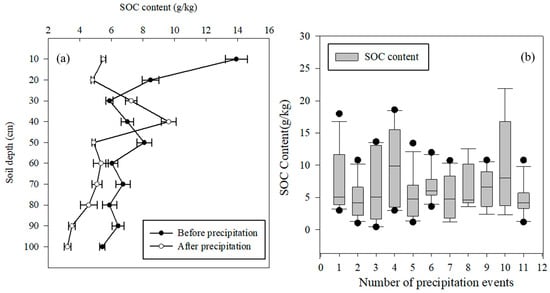
Figure 5.
Influence of precipitation change on SOC migration in soil profile. (a) represents the changes in SOC content before and after precipitation, (b) represents the SOC content under different precipitation events.
Water is the limiting factor of plant production in arid areas, because a small increase in water can significantly stimulate biological productivity and contribute to SOC accumulation [37]. The results of this study showed that SOC in irrigation area increased significantly with the increase in precipitation. According to the correlation analysis between SOC and local hydrothermal conditions during sampling period (Figure 6), SOC distribution was positively correlated with precipitation, and the relationship between SOC and AP decreased with the increase in soil depth. At the same time, higher precipitation and soil moisture will affect SOC sequestration mainly through higher soil acidity and lower basic saturation, thus reducing the decomposition rate of litter.
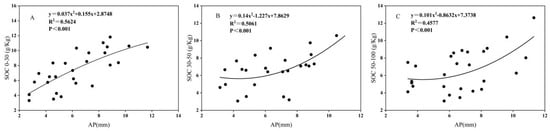
Figure 6.
Influence of precipitation on soil organic carbon. (A) The relationship between SOC and AP in 0–30 cm soil, (B) The relationship between SOC and AP in 30–50 cm soil, (C) The relationship between SOC and AP in 50–100 cm soil.
5.3. Influence of Plastic Film Mulching on Soil Organic Carbon Migration in Irrigation Area
According to the comparison of SOC content between corn fields with and without plastic film mulching in irrigated areas (Figure 7), plastic film mulching reduced the average SOC content of soil in 0–100 cm. Specifically, plastic film mulching increased the average SOC content of soil in 10–40 cm and 40–70 cm soil layers by 27.23% and 16.62% respectively, but decreased SOC content in 0–10 cm and 70–100 cm surface layers by 10.07% and 45.37%, respectively. On the one hand, the low SOC content of surface soil in plastic film mulching area is due to the loss of surface soil and nutrients in non-plastic film mulching area, which promotes the downward migration of SOC content in surface soil. On the other hand, the effect of plastic film mulching on soil heat preservation and water conservation is conducive to the improvement of soil physical and chemical properties, promotes the mineralization of soil organic nutrients, accelerates microbial activities, and thus promotes the microbial degradation of soil organic carbon.
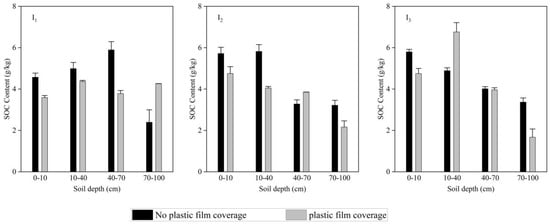
Figure 7.
Changes in SOC content with and without plastic film. I1–I3 represents three irrigation events.
However, SOC content in plastic film mulching area was generally higher than that in non-plastic film mulching area at 40–70 cm, which was mainly due to the slow migration of organic carbon in the bottom soil due to the stability of microbial metabolites and humus under plastic film mulching [38,39]. Irrigation in areas without plastic film mulching increases soil moisture, keeps a certain soil humidity, increases soil temperature, prevents soil hardening caused by irrigation directly acting on soil, makes soil loose, provides a stable place for microorganisms, makes good use of soil nutrients and improves microbial activity to decompose more organic matters in the bottom layer of soil [40].
5.4. Influence of Different Soil Physical and Chemical Properties on SOC Content
In this study, it was observed that the increase in SOC was positively correlated with the accumulation of silt and clay content, but negatively correlated with sand content (Figure 8). Fine-grained soil with proper clay and silt content can inhibit SOC decomposition by stabilizing the soil, and increase the residence time of C to reduce C leaching, thus enhancing the physical and hydrological protection of SOC [41,42]. In addition, the increase in clay and silt content can promote the formation of aggregates, which plays an important role in increasing SOC content, that is, it can reduce wind erosion by improving soil quality and water holding capacity, thus stimulating the increase in plant productivity and promoting the input of SOC [43]. Ref. [37] think that silt content is the key factor affecting organic carbon content. It can resist microbial decomposition and reduce the risk of mineralization by adsorbing organic carbon to form a stable organic-inorganic complex, so it has strong carbon fixation ability, which is also the reason why silt content in soil is less but carbon content is higher. There was a significant negative correlation between sand and SOC, which was mainly due to the weak protective effect of sand on soil organic carbon, which made it easy to lose organic carbon. Soil bulk density can reflect soil compactness, soil texture and organic matter status. In this paper, there was a significant negative correlation between SOC and soil bulk density, which led to the improvement of soil compactness and bulk density, thus increasing SOC content.
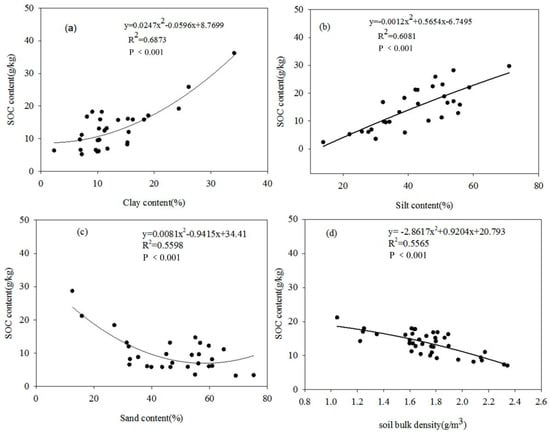
Figure 8.
Correlation between soil particle size, soil bulk density and SOC. (a) The relationship between SOC content and Clay content, (b) The relationship between SOC content and Silt content, (c) The relationship between SOC content and Sand content, (d) The relationship between SOC content and Soil bulk density.
6. Conclusions
In this study, the leaching characteristics and migration laws of soil organic carbon under different irrigation conditions were systematically investigated in Minqin Oasis, and the leaching amount of SOC under different irrigation amounts was quantified, and the process and mechanism of organic carbon loss under water erosion were discussed. The information resulting from the conducted experiment was that: (1) Irrigation increased the average SOC content at 0–100 cm, and the SOC leaching migration was larger at 0–10 cm. After irrigation, SOC migrated to deep soil, the accumulation depth of SOC increases with the increase in irrigation amount, and the greater the irrigation amount, the higher the carbon leaching rate. (2) After irrigation leaching, the organic carbon in each soil layer decreased first and then increased with the change in soil depth, which mainly showed that SOC content in 0–30 cm surface layer was in a leaching state compared with that before irrigation, SOC content in 30–70 cm surface layer was in a cumulative state, and SOC content in 70–100 cm surface layer had no obvious change. (3) Under the same irrigation condition, the migration amount of SOC at different depths gradually decreased with the increase in soil depth. In different irrigation periods, SOC content showed the same change law with time, that is, SOC content in 0–70 cm soil layer was significantly higher than other soil layers in the first four days after irrigation, and SOC content in soil was basically the same as that before irrigation on the fifth day after irrigation. (4) In addition, precipitation, plastic film mulching, soil physical and chemical properties and other environmental factors were important factors to promote SOC content migration and change. Environmental factors had the most significant effect on SOC migration in the surface layer of 0–30 cm. Therefore, the accumulation of long-term measured data should be paid attention to in future research, and the influence of irrigation on SOC of different depth soil layers and the quantification of irrigation influence mechanism should be made clear. At the same time, the relationship among the influencing mechanisms should be deeply understood, and the contribution weight of soil change factors to SOC under the influence of irrigation should be determined.
Author Contributions
W.Z. and Q.W.: Writing—Original draft preparation. W.Z.: Writing—Reviewing and Editing. Q.W.: Data curation. L.Z.: Methodology. S.L.: Visualization. X.L.: Investigation. G.Z.: Supervision. D.Q.: Software. All authors have read and agreed to the published version of the manuscript.
Funding
This research was financially supported by the National Natural Science Foundation of China (41971036, 41867030), Key Natural Science Foundation of Gansu Province (23JRRA698), Key Research and Development Program of Gansu Province (22YF7NA122), Cultivation Program of Major Key Projects of Northwest Normal University.
Data Availability Statement
All data and models generated or used during the study appear in the submitted article.
Acknowledgments
The authors thank their Northwest Normal University and the State Key Laboratory of Cryospheric Science, Northwest Institute of Eco-Environment and Resources, Chinese Academy of Sciences colleagues for their help in fieldwork and laboratory analysis.
Conflicts of Interest
The authors declare no conflict of interest.
References
- Liu, X.; He, B.; Yi, X.; Zhang, L.; Han, F. The soil water dynamics and hydraulic processes of crops with plastic film mulching in terraced dryland fields on the Loess Plateau. Environ. Earth Sci. 2016, 75, 809. [Google Scholar] [CrossRef]
- Yang, S.; Sheng, D.; Adamowski, J.; Gong, Y.; Zhang, J.; Cao, J. Effect of Land Use Change on Soil Carbon Storage over the Last 40 Years in the Shi Yang River Basin, China. Land 2018, 7, 11. [Google Scholar] [CrossRef]
- Bordovsky, D.G.; Choudhary, M.; Gerard, C.J. Effect of Tillage, Cropping, and Residue Management on Soil Properties in the Texas Rolling Plains. Soil Sci. 1999, 164, 331–340. [Google Scholar] [CrossRef]
- Heimann, M.; Reichstein, M. Terrestrial ecosystem carbon dynamics and climate feedbacks. Nature 2008, 451, 289–292. [Google Scholar] [CrossRef] [PubMed]
- Trost, B.; Prochnow, A.; Drastig, K.; Meyer-Aurich, A.; Ellmer, F.; Baumecker, M. Irrigation, soil organic carbon and N2O emissions. A review. Agron. Sustain. Dev. 2013, 33, 733–749. [Google Scholar] [CrossRef]
- Hossain, M.Z.; Bolan, N.; Sarkar, B. Role of cultural and nutrient management practices in carbon sequestration in agricultural soil. Adv. Agron. 2020, 166, 131–196. [Google Scholar] [CrossRef]
- Schulze, E.D.; Luyssaert, S.; Ciais, P.; Freibauer, A.; Janssens, I.A.; Soussana, J.F.; Smith, P.; Grace, J.; Levin, I.; Thiruchittampalam, B.; et al. Importance of methane and nitrous oxide for Europe’s terrestrial greenhouse-gas balance. Nat. Geosci. 2010, 2, 842–850. [Google Scholar] [CrossRef]
- Morugán-Coronado, A.; García-Orenes, F.; Mataix-Solera, J.; Arcenegui, V.; Mataix-Beneyto, J. Short-term effects of treated wastewater irrigation on Mediterranean calcareous soil. Soil Tillage Res. 2011, 112, 18–26. [Google Scholar] [CrossRef]
- Adhikari, K.; Hartemink, A.E. Soil organic carbon increases under intensive agriculture in the Central Sands, Wisconsin, USA. Geoderma Reg. 2017, 10, 115–125. [Google Scholar] [CrossRef]
- Li, Z.-G.; Tian, C.-Y.; Zhang, R.-H.; Mohamed, I.; Liu, Y.; Zhang, G.-S.; Pan, J.-F.; Chen, F. Plastic mulching with drip irrigation increases soil carbon stocks of natrargid soils in arid areas of northwestern China. Catena 2015, 133, 179–185. [Google Scholar] [CrossRef]
- Muñoz-Rojas, M.; Abd-Elmabod, S.K.; Zavala, L.M.; De la Rosa, D.; Jordán, A. Climate change impacts on soil organic carbon stocks of Mediterranean agricultural areas: A case study in Northern Egypt. Agric. Ecosyst. Environ. 2017, 238, 142–152. [Google Scholar] [CrossRef]
- Li, C.; Feng, H.; Luo, S.; Wang, N.; Luo, X.; Dong, Q. Effects of ridge with plastic mulch-furrow irrigation on soil salt and nitrate nitrogen transport characteristics in arid areas. J. Soil Water Conserv. 2019, 33, 268–275. [Google Scholar]
- Denef, K.; Stewart, C.E.; Brenner, J.; Paustian, K. Does long-term center-pivot irrigation increase soil carbon stocks in semi-arid agro-ecosystems? Geoderma 2008, 145, 121–129. [Google Scholar] [CrossRef]
- Masto, R.E.; Chhonkar, P.K.; Singh, D.; Patra, A.K. Changes in soil quality indicators under long-term sewage irrigation in a sub-tropical environment. Environ. Geol. 2009, 56, 1237–1243. [Google Scholar] [CrossRef]
- Fallahzade, J.; Hajabbasi, M.A. The effects of irrigation and cultivation on the quality of desert soil in central Iran. Land Degrad. Dev. 2012, 23, 53–61. [Google Scholar] [CrossRef]
- Tang, G.M.; Xu, W.L.; Sheng, J.D.; Liang, Z.; Zhou, B.; Zhu, M. Changes of soil organic carbon and soil particle size organic carbon with different reclamation years in oasis farmland in Xinjiang. J. Soil Sci. 2010, 47, 279–285. [Google Scholar]
- Jueschke, E.; Marschner, B.; Tarchitzky, J.; Chen, Y. Effects of treated wastewater irrigation on the dissolved and soil organic carbon in Israeli soils. Water Sci. Technol. 2008, 57, 727–733. [Google Scholar] [CrossRef]
- Stergiadi, M.; Marcel, V.D.P.; de Nijs, T.C.M.; Bierkens, M.F.P. Effects of climate change and land management on soil organic carbon dynamics and carbon leaching in northwestern europe. Biogeosciences 2016, 13, 519–1536. [Google Scholar] [CrossRef]
- Trost, B.; Ellmer, F.; Baumecker, M.; Meyer-Aurich, A.; Prochnow, A.; Drastig, K. Effects of irrigation and nitrogen fertilizer on yield, carbon inputs from above ground harvest residues and soil organic carbon contents of a sandy soil in Germany. Soil Use Manag. 2014, 30, 209–218. [Google Scholar] [CrossRef]
- Dong, L.; Zhang, H.; Wang, L.; Yu, D.; Yang, F.; Shi, X.; Saleem, H.; Akhtar, M.S. Irrigation with sediment-laden river water affects the soil texture and composition of organic matter fractions in arid and semi-arid areas of Northwest China. Geoderma 2018, 328, 10–19. [Google Scholar] [CrossRef]
- Carlson, E.A.; Cooper, D.J.; Merritt, D.M.; Kondratieff, B.C.; Reagan, M. Waskom Irrigation canals are newly created streams of semi-arid agricultural regions. Sci. Total Environ. 2018, 646, 770–781. [Google Scholar] [CrossRef]
- Tana, Q.; Atsushi, T.; Tsugiyuki, M.; Tao, W. Analysis of the spatial variation of soil salinity and its causal factors in china’s minqin oasis. Math. Probl. Eng. 2017, 2017, 9745264. [Google Scholar]
- Li, X.; He, M.; Duan, Z.; Xiao, H.; Jia, X. Recovery of topsoil physicochemical properties in revegetated sites in the sand-burial ecosystems of the Tengger Desert, northern China. Geomorphology 2007, 88, 254–265. [Google Scholar] [CrossRef]
- Tarchouna, L.G.; Merdy, P.; Raynaud, M.; Pfeifer, H.-R.; Lucas, Y. Effects of long-term irrigation with treated wastewater. Part I: Evolution of soil physico-chemical properties. Appl. Geochem. 2010, 25, 1703–1710. [Google Scholar] [CrossRef]
- Wang, Z.; Cui, X.; Meng, Z.; Dang, X.; Wang, J. Soil Particle Size Distributions of Different Management Styles Under Complex Wind and Water Erosion in Xilin River Basin. Soils 2018, 50, 819–825. [Google Scholar]
- Chen, C.-P.; Juang, K.-W.; Cheng, C.-H.; Pai, C.-W. Effects of adjacent land-use types on the distribution of soil organic carbon stocks in the montane area of central Taiwan. Bot. Stud. 2016, 57, 32. [Google Scholar] [CrossRef]
- Wei, K.L.; Wang, C.H. Effects of different organic fertilizers on the growth of the tea plants and the chemical properties of soils. Taiwan. J. Agric. Chem. Food Sci. 2011, 49, 205–219. [Google Scholar]
- Russo, D. Numerical analysis of the nonsteady transport of interacting solutes through unsaturated soil: 2. layered systems. Water Resour. Res. 2010, 24, 285–290. [Google Scholar] [CrossRef]
- Shang, F.; Ren, S.; Yang, P.; Li, C.; Ma, N. Effects of Different Fertilizer and Irrigation Water Types, and Dissolved Organic Matter on Soil C and N Mineralization in Crop Rotation Farmland. Water Air Soil Pollut. 2015, 226, 396. [Google Scholar] [CrossRef]
- Azooz, R.H.; Arshad, M.A.; Franzluebbers, A.J. Pore size distribution and hydraulic conductivity affected by tillage in northwestern canada. Soil Sci. Soc. Am. J. 1996, 60, 1197–1201. [Google Scholar] [CrossRef]
- Sobotková, M.; Snehota, M.; Budínová, E.; Tesar, M. Isothermal and non-isothermal infiltration and deuterium transport: A case study in a soil column from a headwater catchment. J. Hydrol. Hydroamech. 2017, 65, 234–243. [Google Scholar] [CrossRef][Green Version]
- Six, J.; Ogle, S.M.; Breidt, F.J.; Conant, R.T.; Mosier, A.R.; Paustian, K. The potential to mitigate global warming with no-tillage management is only realized when practised in the long term. Glob. Chang. Biol. 2004, 10, 155–160. [Google Scholar] [CrossRef]
- Olin, S.; Lindeskog, M.; Pugh, T.A.M.; Schurgers, G.; Wårlind, D.; Mishurov, M.; Zaehle, S.; Stocker, B.D.; Smith, B.; Arneth, A. Soil carbon management in large-scale Earth system modelling: Implications for crop yields and nitrogen leaching. Earth Syst. Dyn. 2015, 6, 745–768. [Google Scholar] [CrossRef]
- Chen, X.; Liu, J.; Drng, Q.; Chu, G.; Zhou, G.; Zhang, D. Effects of precipitation intensity on soil organic carbon fractions and their distribution under subtropical forests of South China. Chin. J. Appl. Ecol. 2010, 21, 1210–1216. [Google Scholar]
- Van Oost, K.; Quine, T.A.; Govers, G.; De Gryze, S.; Six, J.; Harden, J.W.; Ritchie, J.C.; McCarty, G.W.; Heckrath, G.; Kosmas, C.; et al. The Impact of Agricultural Soil Erosion on the Global Carbon Cycle. Science 2007, 318, 626–629. [Google Scholar] [CrossRef]
- Singh, S.; Jagadamma, S.; Shekoofa, A.; Mayes, M. The influence of moisture content variation on microbial mineralization of soil organic carbon. In Proceedings of the American Society of Agronomy-Crop Science Society of America-Soil Science Society of America Annual Meetings, San Antonio, TX, USA, 10–13 November 2019. [Google Scholar]
- Callesen, I.; Liski, J.; Raulund-Rasmussen, K.; Olsson, M.T.; Tau-Strand, L.; Vesterdal, L.; Westman, C.J. Soil carbon stores in Nordic well-drained forest soils-relationships with climate and texture class. Glob. Chang. Biol. 2003, 9, 358–370. [Google Scholar] [CrossRef]
- Weintraub, M.N.; Scott-Denton, L.E.; Schmidt, S.K.; Monson, R.K. The effects of tree rhizodeposition on soil exoenzyme activity, dissolved organic carbon, and nutrient availability in a subalpine forest ecosystem. Oecologia 2007, 154, 327–338. [Google Scholar] [CrossRef]
- Qin, Y.; Xin, Z.; Yu, X.; Xiao, Y.; Manuel, R. Influence of vegetation restoration on topsoil organic carbon in a small catchment of the loess hilly region, China. PLoS ONE 2014, 9, e94489. [Google Scholar] [CrossRef]
- Masse, D.; Cambier, C.; Brauman, A.; Sall, S.; Assigbetse, K.; Chotte, J.-L. MIOR: An individual-based model for simulating the spatial patterns of soil organic matter microbial decomposition. Eur. J. Soil Sci. 2010, 58, 1127–1135. [Google Scholar] [CrossRef][Green Version]
- Wynn, J.G.; Bird, M.I.; Vellen, L.; Grand-Clement, E.; Carter, J.; Berry, S.L. Continental-scale measurement of the soil organic carbon pool with climatic, edaphic, and biotic controls. Glob. Biogeochem. Cycles 2006, 20, 1–9. [Google Scholar] [CrossRef]
- Davidson, E.A.; Janssens, I.A. Temperature sensitivity of soil carbon decomposition and feedbacks to climate change. Nature 2006, 440, 165–173. [Google Scholar] [CrossRef] [PubMed]
- Su, Y.Z.; Wang, X.F.; Yang, R.; Lee, J. Effects of sandy desertified land rehabilitation on soil carbon sequestration and aggregation in an arid region in China. J. Environ. Manag. 2010, 91, 2109–2116. [Google Scholar] [CrossRef] [PubMed]


Disclaimer/Publisher’s Note: The statements, opinions and data contained in all publications are solely those of the individual author(s) and contributor(s) and not of MDPI and/or the editor(s). MDPI and/or the editor(s) disclaim responsibility for any injury to people or property resulting from any ideas, methods, instructions or products referred to in the content. |
© 2023 by the authors. Licensee MDPI, Basel, Switzerland. This article is an open access article distributed under the terms and conditions of the Creative Commons Attribution (CC BY) license (https://creativecommons.org/licenses/by/4.0/).