Abstract
Understanding and long-term assessment of the efficacy of soil and water conservation (SWC) techniques is essential for sustainable watershed management. There have been few studies measuring the long-term impact of SWC on soil erosion at the catchment scale due to a lack of historical data. This research aims to measure and analyze the impact of SWC interventions on sediment yield using the Soil and Water Assessment Tool (SWAT) in the Wadi Rmel watershed between 2000 and 2020. The study approach has simultaneously three main aspects: (i) long-term and temporally dynamic, (ii) large-scale landscape distribution, and (iii) empirical evidence of impacts induced by terracing measures. Historical data on SWC in 2000, 2005, 2010, 2015, and 2020 were used for running the model. The monthly calibration (2001–2014) using the SUFI2 algorithm was implemented with 22 input parameters and displayed a good model performance, with a Nash–Sutcliffe efficiency (NSE) of 0.61 for daily runoff and a coefficient of determination (R2) of 0.66. A satisfactory result was obtained for the monthly validation process (2015–2020) with NSE value equal to 0.83 and R2 value of 0.85. The result showed the increase in terracing areas led to a cumulative decrease in watershed sediment yield in long-term, i.e., the reduced erosion per one hectare of the expanded terracing area after 10–20 years were about 9–33 times higher than those in the first 5 years. This finding suggests that maximal benefits of SWC should be expected in the long-term, i.e., beyond a decade. Additionally, the study revealed variations in sediment yield contribution among sub-basins, with the southwestern region being the degradation hotspot areas (having erosion exceeding tolerable thresholds) needing prioritization for erosion controls. These findings enable stakeholders to plan effective management in semi-arid wheat-based agricultural areas with scarce data.
1. Introduction
The arid and semi-arid regions bordering the Mediterranean Sea in Northern Africa suffer from a severe water deficit. Severe future water stress was forecasted for the semi-arid northeast of Tunisia, an area already characterized by scarce water resources [1]. In Tunisia, water issues were always associated with soil issues. This natural connection is mainly due to environmental factors, including rugged terrain, irregular rainfall, and cultural practices [2,3].
Soil erosion, which causes siltation of water bodies and soil degradation, is a worldwide phenomenon that is strongly accelerated by the degradation of agricultural land, which generates a higher average of runoff compared to the un-degraded land. To address these issues, Tunisian institutions began implementing soil and water conservation (SWC) measures in 1990 [4] to reduce surface runoff, improve groundwater recharge and limit soil loss.
These techniques are also useful for enhancing crop productivity, mitigating land degradation, and restoring degraded land. Depending on land morphology and on planned land uses, different SWC structures are implemented through specific appropriate designs [5]. In northeast areas of Tunisia, these structures are widely used, so it is important to understand their actual hydrological impacts. Monitoring and modeling land degradation and hydrological processes can help implement conservation techniques properly [6]. Hydrological models have been applied extensively around the world for the last three decades [7,8,9,10]. The aim of these tools is to determine the primary drivers of hydrological systems and to model hydrological processes, such as sediment production and runoff. The final goal is to improve the decision maker’s knowledge and support decisions on hydrological management in catchment areas. Numerous models are available to simulate long-term patterns of hydrological processes at the watershed level. Several commonly used hydrological models are: Hydrological Simulation Program Fortran [11], Systeme Hydrologique Européen [12], MIKE SHE [13], SHETRAN [14], Soil and Water Assessment Tool [15,16,17], Topographic Model [18], and MOHID Land [19].
The SWAT model is a semi-distributed watershed-scale continuous-time model [20]. Its SWAT-Calibration and Uncertainty Programs component (SWAT-CUP) is one of the most important tools used for parameter sensitivity analysis. Several authors have used the SWAT model in the semi-arid Tunisian context. It was used to assess the impact of climate change on water resource management [21], to quantify runoff and sediment transport [22,23], to study the interrelations between water quality and agriculture [24], and to assess the impact of SWC structures on watershed hydrology and soil erosion [25,26,27,28,29].
Although several studies demonstrated the benefits of soil and water conservation (SWC) in reducing water-driven soil erosion in semi-arid environments, so far there has been a lack of long-term, yet quantitative assessment of SWC’s impacts on soil loss at watershed scale. In Ethiopia, a meta-analysis showed that using soil and stone bunds, terracing, and integrated measures could result in a reduction of 50–74% soil loss [30,31]. Such structural measures combined with agronomic and vegetative practices could further contribute significantly to the restoration of degraded soils [32]. In East Africa, terrace cultivation, which has been widely adopted, has shown remarkable benefits in terms of reducing soil erosion, conserving water, and preserving nutrients at the watershed level [33]. Contour ridge practices in West Africa have proven effective in minimizing runoff and erosion while simultaneously enhancing infiltration and soil water storage [34]. Under semi-arid conditions in Italy, conservation farming practices such as cover crops demonstrated a strong reduction of soil erosion (up to 80% compared to conventional tillage practices) [35]. SWC practices have been proven to reduce significantly sediment yield on hillslopes in semi-arid regions in China, including periods of extreme precipitation [36,37]. However, most of the published studies measured current or medium-term impacts rather than long-term impacts, i.e., the assessment periods beyond a decade. Meta-analyses of SWC impact assessments have not found studies providing consistent time series of quantitative evidence of the effects of SWC on erosion over a long-term period and at watershed scale [30]. Several on-farm or station-based studies reported the historical impact of SWC measures, but at plot level [34,35]. Plot-based assessments of SWC impacts, even with long-term monitored data, are often limited in supporting the estimation of environmental externalities or off-site impacts of SWC measures. There has also been a growing number of model-based SWC impact assessments at the watershed scale, but rather calculating erosion average for a short-term period than quantifying inter-periodically erosion against historical dynamics of land use and land management over usual periods in watershed management planning (e.g., about two decades and beyond) [31,36,37].
The research aims to evaluate the long-term effects of soil and water conservation (SWC) interventions on sediment yield within the Wadi Rmel watershed. This watershed serves as a suitable case study due to its representative semi-arid climate and its significant vulnerability to water erosion. The assessment period is two decades which coincides with the usual watershed planning period, thereby having a strong temporal coverage to support related policies. By employing the SWAT model, this research sought to analyze the effectiveness of SWC measures in mitigating sediment yield and addressing the environmental concerns associated with water erosion in the region. The Wadi Rmel watershed provides an excellent opportunity to study and understand the implications of SWC interventions in combating this profound environmental problem.
More specifically, the main focus of this paper is to establish an effective parameterization method for assessing the effects of soil and water conservation (SWC) measures. Additionally, the study aims to identify the sub-catchments within the studied watershed that are most susceptible to sediment production compared to tolerable rates ò erosion. The findings from this research are expected to provide valuable information to support decision-making processes related to the preservation and protection of soil and water resources in the region.
2. Materials and Methods
2.1. Study Area
The studied area is the watershed of Wadi Rmel, located in Northeastern Tunisia between 36°15′ and 36°35′ latitudes North, and between 10°05′ and 10°25′ longitudes East. The watershed covers an area of about 675 km2, mainly included in the governorate of Zaghouan (Figure 1). The climate is classified as semi-arid with hot summers and mild winters. It is characterized by very high variability in annual and inter-annual rainfall. The annual average rainfall ranged between 350 and 600 mm [38]. Rainfall mostly occurs during winter season. The annual average temperature is around 18.5 °C.
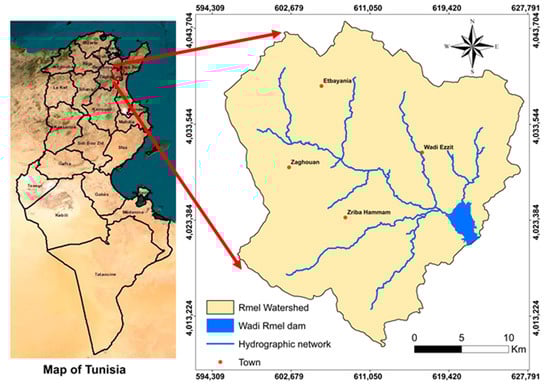
Figure 1.
Location of the study area.
The watershed is characterized by a central part with flat morphology, while the northwest and southeast are characterized by mountains. Jebel Zaghouan, with an altitude of 1293 m, is the highest point in the study area. The geological formations date from the Jurassic period.
Low and very low slope classes, less than 15%, are found in the center and downstream, while steep slope classes, greater than 15%, are present in the northeast and southwest. Previous studies showed that the central part of the Wadi Rmel watershed is formed mainly by alluvial Quaternary deposits. The southwestern zones are characterized by red deposits (Villafranchiens lacustrine) and the northeastern portion is dominated by Pliocene conglomerates and grey clays. According to the soil studies conducted in the study area since the 1960s [39] and later summarized by the Agricultural Map of Tunisia, more than ten soil types are represented, showing a significant variability.
Wheat-based agriculture is the major land use type in the watershed. The wheat area occupied about 63% of the agricultural land. The remaining agricultural uses are olive plantations and pasture which share 26% and 11% of agricultural land, respectively. There is extensive livestock grazing which is frequently unsustainably managed causing the depletion of vegetation cover, the overexploitation of natural resources, and the acceleration of soil erosion.
2.2. Input Data Sets
The SWAT model operates on daily time steps to produce daily, monthly, and annual results [16]. It is embedded in a Geographic Information System (GIS) environment to create various hydrologic response units (HRUs), which represent homogeneous combinations of topographic, land use and soil properties. In addition to data on land slope, soil type and land use, the model requires a number of basin-specific inputs, including daily meteorological and hydrological data. The following datasets were generated to run the model in the study area:
2.2.1. Digital Elevation Model (DEM): Topographic Data
Digital elevation model (DEM) is one of the most important input data of SWAT model and it is a crucial source of information for GIS hydrological modeling. The ArcSWAT tool component has an automatic process that allows us to define sub-catchment boundaries, stream networks, and slope factors based on the DEM. Indeed, the DEM is used to define all the topographic attributes of the catchment like area, slope and slope length, channel slope, channel length, channel width, and channel depth. The DEM plays also a crucial role to understand the flow behavior and pattern. For this study, the 30 m spatial resolution ASTER GDEM was downloaded from the USGS Earth Explorer website and was used as input dataset. Using ArcSWAT, the study area has been divided into 27 sub-basins.
2.2.2. Land Use/Land Cover (LULC) Data
In SWAT, the land use/land cover is one of the most determinant input datasets [40] that is required when creating the HRUs. LANDSAT satellite imageries were acquired for the month of May in the years 2000, 2005, 2010, 2015, and 2020. These images which have spatial resolution of 30 m, were downloaded from the USGS Earth Explorer website. Images were classified (supervised classification) to generate a land use/land cover map for the study area, validated through ground-truth surveys. The validation process was carried out by a Kappa index and the overall accuracy (%) (Table 1).

Table 1.
Land use classification accuracy.
Overall, the Wadi Rmel watershed has shown significant LULC changes between 2000 and 2020, based on a comparison of LULC information (Table 2). In the last twenty years, LULC areas’ statistics have been evolving quickly. Olive orchards and pasture classes registered the most significant land use change. In fact, the analysis indicates an important decline in rangelands from 7768 ha to 4172 ha between 2000 and 2020, a change of about (−46%). Moreover, percentages of areas occupied by forest and garigue were decreasing in the last two decades. From 2000 to 2020, area of olives was increasing from 9559 ha to 14,249 ha, from 14% to 21%. Notably, there was an increase in urban areas in this period, between 739 ha to 1294 ha (Table 2). As a consequence, many parts of forests were cleared for timber production and converted into agricultural land. Meanwhile, some rangelands and grassland zones were converted into urban areas.
Table 2.
Historical land use land cover dynamics in the Wadi Rmel watershed.
2.2.3. Soil Type and Characteristics
Soil data have major influence on catchment hydrology and play an important role in modeling. In fact, it helps to identify the most vulnerable areas to soil erosion. In this study, the different soil classes were defined based on digitized Tunisian soil map with scale of 1/50,000. Investigation of this map shows that study area was dominated by two soil types which are Rendzines and Sols bruns calcaires. Indeed, pedological data on this map were reported by numerous researchers, namely [39,41]. Moreover, more specific soil details about the Wadi Rmel watershed were reported by [42].
2.2.4. Climatic Data
The SWAT 2012 model requires daily meteorological data including precipitation, temperature, relative humidity, solar energy, and wind speed. In order to have a complete series of climatic data between 2000 and 2020 the following sources were used: (i) data recorded at four rain gauges stations which are Zaghouan station, Rmel station, Mograne CSA SM station, and Zriba PV station and (ii) the National Centers for Environmental Prediction (NCEP), and (iii) data generated by the weather generator tool of the SWAT model that contributed to fill missing data for certain periods of time in the simulation periods. Daily flow data recorded in Wadi Rmel dam station from 2000 to 2020 were used for calibration and validation.
2.2.5. Soil and Water Conservation (SWC) management
Most agricultural areas of the Wadi Rmel watershed were treated with soil and water conservation (SWC) measures for the last two decades to intercept, store, and promote runoff water infiltration and reduce soil erosion and other forms of soil degradation [3], toward enhancing rural land rehabilitation and sustainable watershed development. Hillslope terraces, i.e., most dominant SWC measure, were surveyed and mapped. In 2020, the areas with terraces measured were estimated to be around 27% of the overall watershed using satellite image analysis and ground truth surveys. The terraces measure primarily enclose spring wheat crop fields and some olive orchards. In this paper, a diachronic analysis was conducted of the areas treated with terraces and hill lakes measured between 2000 and 2020. Few of the surfaces have been treated with gabions, which are installed on eroded areas to rehabilitate the soil and promote the growth of natural vegetation. Based on satellite image analyses and field investigations, we mapped areas with terraces established for following years: 2000, 2005, 2010, 2015, and 2020. This information was used to assess the SWC impacts on sediment yield changes over time.
2.3. Model Setup and Configuration
Catchment delineation into sub-basins was the first step along the SWAT simulation flow using [43]. SWAT uses ArcGIS Spatial Analyst functions to perform watershed and drainage network delineation [44] based on the DEM. After the catchment delineation process, 646 hydrological response units (HRUs) were created based on unique combinations of three spatial data sets (slope, land use, and soil type), and by fixing a threshold value of 10% for each of the cited data [17]. Then, all the required climatic variables were prepared in a suitable format and fed to the model [45]. Finally, a monthly simulation period was set from 2000 to 2020 with a one-year warm-up period.
2.4. Model Calibration and Validation
The SUFI-2 algorithm was also used for model calibration and validation [46]. Sensitivity analysis and calibration are two linked steps to obtain a successful set-up of SWAT model [47,48]. In fact, the first aim of SWAT-CUP is to select the best combination of relevant parameter values after model sensitivity analysis in order to give a good fit between the observed data and simulated values during the calibration and validation periods. Model calibration with sensitivity analysis was conducted for the 2001–2014 period, and the model was validated for the last 6 years (2015–2020) using the calibrated model.
2.4.1. Sensitivity Analysis
Sensitivity analysis is an important step to identify SWAT input parameters that contribute the most to model output variance [49]. This step was performed using the (SUFI2) algorithm. To evaluate every parameter sensitivity, two values have to be considered: t-stat and p-value [47]. T-stat parameter was used to measure sensitivity. The larger the absolute values, the more sensitive they are. The p-value was used to determine the significance of the sensitivity. The most sensitive parameter is fixed when the absolute value of t-stat is the highest and the value of p-value is the smallest [46]. In this case, 22 parameters were chosen for sensitivity analysis adopting the lower and upper limits of every parameter and physical properties as defined by [17].
After 500 iterations, the parameters’ sensitivity analysis results were obtained. For the HRUs (hydrologic response units) affected by SWC techniques, the surface runoff characteristics were simulated using curve number (CN) adjustment. In fact, CN was controlled by various factors influencing soil stability. The support practice factor (USLE_P) was quantified based on SWAT documentation [16,50] and on previous SWC studies conducted in Tunisia [51,52]. During the calibration process, this value was adjusted according to each slope class. In addition, to upgrade the modeling performance, the soil erodibility factor values (USLE_K) were adjusted based on the ranges determined by Hermassi et al. [52]. In order to evaluate the sediment yield pattern, various information sources were used such as bathymetric measurements and the evaluation of erosion impacts cited in local literature and studies [28,52].
The sensitivity analysis was executed for monthly steps over 21 years from 2000 to 2020 and the first year was used as a warm-up period for the model to initialize unknown variables.
2.4.2. Evaluation of the Model Performance
The evaluation of hydrologic models is highly dependent on sensitivity analysis and the calibration of the model parameters [47]. A successful application of hydrologic model is assessed via the match between simulated and observed data. The SWAT-CUP software (SWAT Calibration and Uncertainty Procedures) was used for automated model calibration [46] based on SUFI-2 (Sequential Uncertainty Fitting 2) algorithm [53] which has been widely utilized for watershed hydrology calibration [54]. The SUFI-2 program accounts for various sources of parameter and conceptual model uncertainty and for input data uncertainty [55].
Four model performance indicators given by SUFI-2 algorithm were used for the evaluation of the model. For both calibration and validation process, the goodness of fit between the measured and simulated results was evaluated by the Nash–Sutcliffe efficiency (NSE), the coefficient of determination (R2), percent bias (PBIAS), and the ratio of the root mean squared error to the standard deviation of measured data (RSR). The Nash–Sutcliffe efficiency (NSE) was used as a major objective function; the perfect agreement between predicted and observed data results is reached when NSE is near or equal to 1.
2.5. Model Application for Scenario Simulation
Assessing the impact of SWC techniques on sediment yield of a watershed is very important for water and soil resources management. Four periods were identified in this study to explore the impacts of SWC change. Therefore, the calibrated and validated model with various SWC management inputs was utilized to reveal the effects of SWC surface area changes on soil erosion at watershed scale. While keeping the remaining model parameters from the calibrated model and other SWAT inputs unchanged, the model was run with each of the four SWC maps.
3. Results
3.1. Model Calibration and Validation
The sensitivity analysis of the chosen input parameters was conducted by the SWAT-CUP model with a global sensitivity option. Based on the output statistical ranking 22 parameters were classified as sensitive. The assessment of all parameters’ sensitivity was based on p-value and t-test. Six parameters with absolute t-stat values higher or equal to 2 and p-value less than 0.05 were ranked as the most sensitive (Table 3). The curve number (CN), the soil available water content parameter (SOL_AWC), the soil erodibility factor (USLE_K), and the support practice factor (USLE_P) were the most sensitive parameters.
Table 3.
List of 6 most sensitive model parameters with their relative sensitivity.
Calibration and validation were used to evaluate the effects of SWC area change. The calibrated parameters were used in model validation to simulate stream flow. The 2001–2014 period was used for calibration and the 2015–2020 for validation. The effectiveness of calibrated and validated parameters was investigated using two methods: graphical comparison and statistical indices [56]. To examine the similarity of stream flows in the watershed during the calibration and validation periods, graphical comparisons were conducted between observed and simulated stream flow on a monthly step for both calibration and validation processes (Figure 2 and Figure 3).
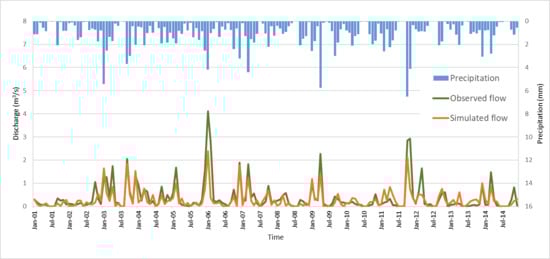
Figure 2.
Comparison of measured and predicted monthly stream flow during the calibration period (2001–2014) for the Wadi Rmel watershed.
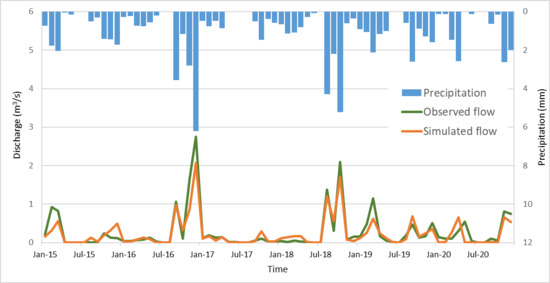
Figure 3.
Comparison of measured and predicted monthly stream flow during the validation period (2015–2020) for the Wadi Rmel watershed.
The results showed a good agreement between the simulated and observed values both in the calibration and validation processes. The model seemed to underestimate the mean monthly stream flow and overestimate the flow values during base (low) flow months (July).
For model performance evaluation, a range of statistics indicators for calibration and validation processes with flow data were used. The used parameters were NSE, R2, RSR, and PBIAS (Table 4).
Table 4.
Summary of statistics for calibration, and validation processes with flow data in the Wadi Rmel watershed.
During calibration, the values of the performance indicators were 0.61 for NSE, 0.66 for R2, 0.32 for RSR, and 8% for PBIAS. During the validation period, the data presented a satisfactory correlation, with NSE equal to 0.83, whereas R2 was 0.85, RSR was 0.21, and PBIAS was 6.6%. Thus, the statistical indices indicated a good agreement (fit) between the measured and simulated streamflow for both calibration and validation periods.
The calibration and validation of the SWAT model were conducted using daily flow data from the Wadi Rmel dam station. However, the focus of the study was to examine the impact of SWC measures on soil erosion using both flow calibration/validation and bathymetric data. In fact, one bathymetric measurement value was obtained in the Wadi Rmel watershed in 2011. The observed annual average value was equal to 5.25 tons/ha/year, during the period between 2000 and 2011. In the same period, the simulated mean annual value of the sediment deposition by the SWAT model was 5.43 tons/ha/year. Thus, the simulated sediment yield was very similar to the observed one. The simulated value was higher than the observed by about 3.4%, which corresponded to a very good coefficient of efficiency (0.96).
3.2. Long-Term Impact of SWC Change on Watershed Erosion Process
The surface area of SWC measure implementation (SWC-treated area) in the Wadi Rmel watershed progressively increased in time during the 2000–2020 period (Figure 4). The total increase was 3108 ha between 2000 and 2020 (Table 5).
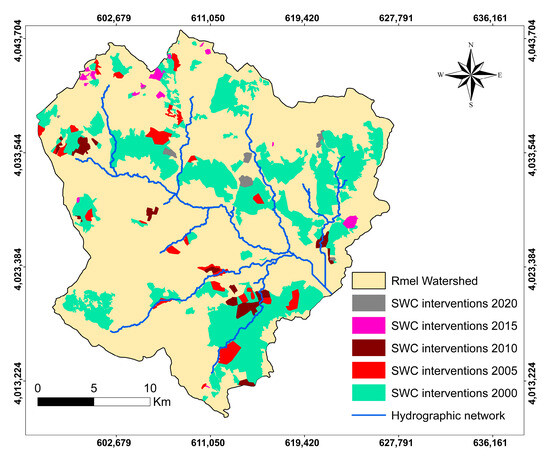
Figure 4.
Evolution of areas with SWC (terraces) in Wadi Rmel Watershed for the 2000–2020 period.
Table 5.
Area of terraces during the studied period.
The most remarkable change (+11%) was observed between 2000 and 2005. During the period between 2005 and 2010, augmentation of about 6% of SWC-treated areas was detected. During the following decade, a further increase of around 2% every 5 years was observed (Table 5).
During the same period (2001–2020) the annual mean rainfall was about 400 mm, with the highest annual average precipitation values corresponding to the highest sediment yield peaks (Figure 5).
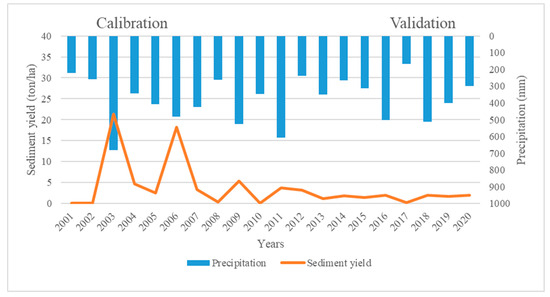
Figure 5.
Precipitation and sediment yield during the period 2001–2020.
The highest annual sediment yields were 21 t/ha and 18 t/ha obtained in 2003 and 2006, respectively. These averages resulted from high percentage values of the runoff coefficient, 33 and 40% for 2003 and 2006, respectively (Figure 5 and Figure 6). In fact, this period is characterized by a lower SWC-treated area. Between 2006 and 2020, the runoff coefficient decreased and remained consistently below 10%, although the annual rainfall was above the mean annual rate (Figure 5 and Figure 6). This result could be explained by the efficiency of the newly implemented SWC works.
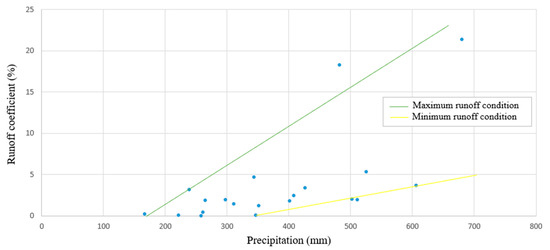
Figure 6.
Runoff coefficient between 2001 and 2020.
The increase in the SWC-treated area between 2000 and 2010 (Figure 4) corresponded to a significant decrease in the sediment yield in the catchment, during a period marked by stable mean annual rainfall amounts. Indeed, the annual sediment yield decreased from 286,869 tons/year for the period 2000–2005 to 131,594 tons/year for the period 2005–2010. This represents a decrease of approximately 54% in sediment yield during that period.
For the periods 2005–2010 and 2010–2015, the average annual rainfall was around 382 mm and 390 mm, respectively. Between 2010 and 2015, the sediment yield rate in the study area continued to decrease, although at a slower rate, from 3.7 in 2011 to 1.4 in 2015. This decrease can be attributed to the implementation of soil and water conservation (SWC) measures over an area of 400 hectares (Figure 4). Thus, SWC interventions seemed to be beneficial in protecting soil and water resources within the various slope classes in the study area. During 2015–2020, a period marked by no significant changes in SWC-treated areas, there was an increase in sediment yield from 77,993 tons/year in 2010–2015 to 162 486 tons/year in 2015–2020 (Figure 4). This increase seemed to be associated with the increase in the average annual rainfall. In fact, the high average sediment yield could be caused by a one-day event with particularly high amounts of precipitation and consequently with very high sediment yield.
The scatter diagram of the watershed’s sediment yield (SY) against the area of terraces over the 2005–2020 period clearly shows a long-term impact of the terracing measure on the reduction of soil erosion, with a strong determination coefficient (R2 = 0.75 and 0.91 for linear and quadratic relationships, respectively) (Figure 7). Furthermore, the concave decreasing pattern of SY along elapsed period and increased terracing area demonstrates cumulative impacts. In the 2005–2010 period, on average the increase of one hectare of terraces led to a reduction of sediment yield at only 0.03 t/ha/year, while in the later periods, the erosion reduction rates were 0.85 t/ha/year (period 2010–2015) and 0.23 t/ha/year (period 2015–2020).
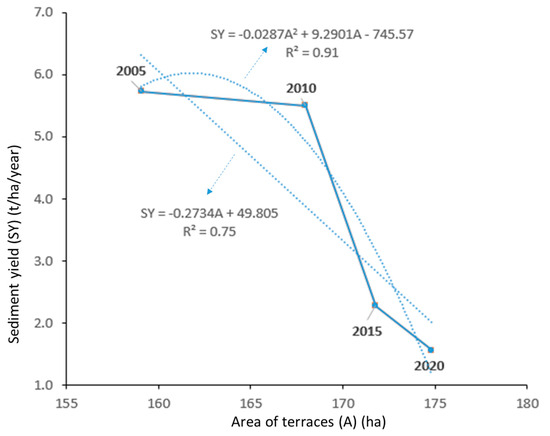
Figure 7.
Watershed’s average sediment yield (SY) versus the area of terraces (A) over the 2005–2020 period.
On the other hand, field visits in 2020 showed that a huge number of SWC structures were deteriorated by machines, animals, or climatic conditions. In fact, machines such as tractors or heavy equipment can damage SWC structures if they are not operated properly. Similarly, if a machine is used to remove vegetation from a slope protected by terraces, the terraces can become destabilized and fail. Animals can also damage SWC structures. If they are allowed to graze on terraces, they can erode the soil and cause the structures to fail. In addition, burrowing animals can create holes in the structures, making them weaker and more susceptible to erosion.
Heavy rain or wind can also cause SWC structures to deteriorate. Heavy rain can cause soil erosion and wash away the structures, while strong winds can topple walls or uproot trees, causing damage to terraces.
To prevent the deterioration of SWC structures, it is important to maintain them regularly and avoid activities that can damage them. This includes properly maintaining machinery, controlling grazing activities, and planting vegetation to stabilize the soil. In addition, designing SWC structures to withstand the specific climatic conditions of a given area can help to minimize the risk of deterioration due to natural events. All those factors make the study area a favorable environment for erosion. In summary, the overall changes in annual sediment yield between 2000 and 2020 were mainly explained by the change in SWC-treated areas and rainfall patterns.
In this case, between 2000 and 2020, the percentage of SWC-treated areas and the sediment yield are changing in opposite directions, with sediment yield decreasing despite an increase in treated areas. In fact, the implementation of SWC measures contributes to the infiltration basins and the permeable pavements that can reduce the amount of surface runoff and sediment yield.
Overall, the relationship between treated areas and sediment yield is complex and depends on many factors such as careful planning, design, and implementation of SWC measures that can help to promote sustainable land use practices.
In spite of all the external factors mentioned above that led to the deterioration of the terraces, the annual average of sediments decreased in a remarkable way during the last period, from more than 20 t/ha in 2003 to less than 5 t/ha in 2020. This change in sediment yield was positively correlated with a moderate elevation of the treated areas during the same period. In fact, the impact is sensitive to the increase in the treated surface, especially if interventions are concentrated on treating the most sensitive slopes with appropriate SWC measures.
By identifying and prioritizing the slopes that are most susceptible to erosion and degradation, and applying appropriate SWC measures to those areas, the effectiveness of the measures can be maximized. This targeted approach allows for more efficient use of resources, including labor, time, and materials.
3.3. Identification and Prioritization of Critical Areas
During the studied period, soil erosion was characterized by spatio-temporal variation within the watershed. SWAT model results were used to categorize and map the erosion severity at the catchment level. In addition, the model allowed identifying and prioritizing critical sub-catchments. Among the 27 delineated sub-catchments, the 2 numbered 17 and 26, located in the southwestern part of the watershed, were classified in the high soil loss class, with a simulated average soil loss higher than 10 t/ha/year (Figure 7). These sub-catchments represented 13% of the total watershed surface area but contributed to about 60% of the amount of sediment loss. The high erosion rates in these locations were due to the absence of SWC measures. On the other hand, these high soil loss rates could be explained by the dominance of cereal cropping (wheat) and by soils very vulnerable to erosion. In fact, the Wadi Rmel watershed was characterized by mainly sandy soil which is typically very vulnerable to erosion because it allows water to move through them more quickly, resulting in increased runoff and soil erosion. Moreover, the diachronic study of SWC occurrence showed that this part of the watershed was not treated during the last two decades. The sub-basin 15 showed instead a tolerable soil erosion rate, 7 t/ha/year (Figure 8). This rate was explained by the absence of SWC measures and the presence of poor vegetation cover.
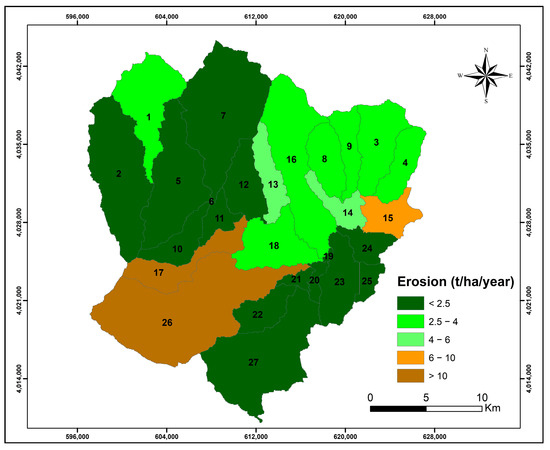
Figure 8.
Spatial distribution of sediment source areas in the Wadi Rmel watershed.
In addition, this zone had been disturbed due to human activities such as land clearing and deforestation which make it also highly vulnerable to erosion. The removal of vegetation cover and the disruption of soil structure over time will expose this zone to water erosion.
The sub-catchments 6, 11, 10, and 5 were located in the plain zone of the catchment and had the lowest sediment transport (Figure 7). These sub-watersheds were treated with SWC techniques before 2000 and were subsequently correctly managed by the farmers. In fact, within these sub-basins, SWC measures are properly designed, constructed, and maintained over time.
To summarize, the 27 sub-basins did not contribute in the same way to the average sediment yields. A remarkable spatial variability of soil erosion was observed that was used for identifying and prioritizing critical areas in the catchment in view of helping the decision makers to plan more targeted SWC interventions and to more efficiently conserve soil and water resources.
4. Discussions
Globally, the implementation of soil and water conservation measures has achieved substantial ecological benefits, leading to the positive development of regional ecosystem services. As science, technology, and society continue to progress, there is an increasing focus on the integrated management model of vulnerable watersheds, addressing natural phenomena such as soil erosion. In this study, the SWAT model was applied in a large-scale watershed, with an area of 675 km², to assess the long-term impact of SWC measures on soil erosion over the last two decades (2000–2020). Three following questions are discussed in this section in comparison with previous related studies.
4.1. What Are New Aspects of This Study in Research Approaches of Published Work on Impacts of SWC on Soil Erosion in Relevant to Support SWC Planning at Watershed Scale?
The SWC measure focused on in this study is terracing, which belongs to the group of structural SWC measures that often leads to substantial changes in slope profile and is of long duration or permanent [57]. Despite having a long history of the consideration of terraces in SWC impact assessment, the wide-ranging effects of terraced landscapes regarding patterns of spatial and temporal distributions of soil erosion are poorly understood [58]. To be relevant to support sustainable watershed management, evaluation of the effects of terraces on soil erosion should consider concurrently:
- (i)
- Long-term and temporally dynamic;
- (ii)
- Large-scale landscape distribution;
- (iii)
- Empirical evidence of impacts induced by terraced landscape.
This study was designed to simultaneously address these aspects that are hardly found in the current state of the literature. The discussion on the necessity of these aspects and the contextualization of the study in the current state of research are as follows.
To support sustainable watershed management planning, SWC impact assessment needs to be long-term due to at least two reasons. (i) As SWC implementation in a watershed often progresses in association with the time horizon of land use planning, thus at best the assessment period should cover one cycle of land use planning, such as 15–20 years. (ii) Given strong environmental flows in the watershed context, off-site effects of terracing are inherently substantial and often occur in the long term. Moreover, because SWC implementation in practice progresses from year to year rather than at once, temporally dynamic patterns of SWC effects on soil erosion need to be understood and quantified. Unfortunately, this long-term and temporally dynamic aspect is hardly to find in current literature. A recent review of impacts of land restoration measures, including terraces, across 24 Ethiopian agro-ecological zones did not report clearly the temporal aspect [30]. The most recent global review for the impacts of terraced landscape on soil erosion examined the reduction of sediments caused by different types of terraces in different climate conditions but did not specify the sediment reduction calculated to what temporal extent [59]. Closely looking at the literature considered by these two reviews, we found that most of the cases either did not report the temporal aspect explicitly or are with short-term perspective through uses of data input on SWC and land use collected for a short period (2–4 years). So far, we have not yet found any published work on assessing the impacts of terraced landscapes on soil erosion with a long-term and temporally dynamic aspect like the presented study.
Whole watershed consideration favors the aspect of large-scale landscape distribution in the impact assessment of SWC on soil erosion. The aspect is presented in the spatially distributed inputs (e.g., maps of land use and implemented SWC measures) and outputs (e.g., map of soil erosion or unit of soil erosion responses). Large-scale spatially distributed studies on the impacts of terraced landscapes on watershed sediment yield like the presented study are still only a few, compared to the plot-based and farm-based studies. Deng et al. [60] selected 17 terrace impact assessment studies for their global review, and it turns out only 2 studies were spatially distributed. Many RUSLE-based soil erosion modeling studies are spatially explicit (e.g., [31,32,37]), but so far these assessments have been limited to the evaluation of soil erosion change in general rather than being responsive to concrete SWC measures for quantifying SWC-induced impacts.
Empirical evidence for the impacts of SWC is usually a straightforward and effective way to inform stakeholders in watershed management and planning rather than scenario-based assessment. Different from scenario-based impact assessments that compare soil erosion outputs between the base case (status-quo) and hypothetically planning cases to draw an impact of SWC change on soil erosion (e.g., [31,32,37,61]), our study examines the causal relationship between historical sediment yield and change in the terracing area to discover the temporally dynamic impact. Our method helped discover the temporal cumulative impacts that are useful for long-term watershed planning (see Figure 7).
4.2. What Are Contributions of the Presented Findings to the Research Field and Watershed Management Planning?
While overall reduction of soil erosion caused by increased terracing areas found by the presented study falls into the common range of other studies, either near the study site [61] or in other semi-arid regions, e.g., [30,31,32,37], our findings have important features that have hardly found in the current literature. Those features are (i) explicitly defining temporal extent to be based on counting erosion reduction induced by SWC, and (ii) depiction of how the erosion reduction behaves during a long-term period. The earlier suggests that statements of impact quantities have to be with a specific temporal window since impact quantities for 5 years are much different from those for 10 or 20 years. The latter, as the result shown in Figure 7, implies that assessment of SWC impact on watershed’s sediment yield necessarily covers a long-term period of 15–20 years or even beyond, so that it can capture a strong reduction of sediment yield induced by terraced landscape occurred in later sub-periods (e.g., in 10–20 years) (Figure 7).
The distribution of sediment sources against sub-catchments, i.e., aggregated hydrological response units, provides hotspot zones for prioritization of SWC investments for more effective reduction of sediment yield in the watershed. In Tunisian semi-arid regions, the tolerable soil loss rate is about 2.5, 5, and 10 t/ ha/year for thin, average, and thicker soils, respectively [57]. In the Wadi Rmel watershed, our findings showed that sub-catchments 15, 17, and 26 have soil loss exceeding the tolerable erosion rate for average soil thickness, thus should be the zones to be focused in promoting SWC measures (Figure 8). This feature of the presented findings is not impossible with a plot- or farm-based SWC impact assessment, or possible but is not often shown in many spatially explicit RUSLE-based studies.
4.3. What Are Technical Aspects Less Controlled in the Study and How These Limitations Should Be Improved in Follow-Up or Elsewhere Studies?
The input maps of terraced landscapes in this study may include particular sub-categories of terrace measures and each concrete terrace type can have specific effects on soil erosion [60]. More detailed mappings of terraced landscapes may affect the SWAT-based assessment results. Therefore, mapping terrace types and testing the SWAT-based results in sediment yield in response to the inclusion of terrace types in the model inputs would be a useful follow-up study. In addition to terraces, other SWC measures should be included in the input SWC maps.
Another technical limitation of the study is the limited availability of updated bathymetry information in the most recent years. More bathymetry surveys for the current time would improve the validation test of the calibrated model.
5. Conclusions
The study is an ex-post assessment of the impact of SWC measures on soil erosion having simultaneously three main aspects: (i) long-term and temporally dynamic, (ii) large-scale landscape distribution, and (iii) empirical evidence of impacts induced by terracing measures. The long-term assessment in this way is relevant to support sustainable watershed management and planning as it provides more adequate scientific evidence (compared to precedent available knowledge) that can inform decision-makers in adaptive management and planning cycles to arrive at cost-effective and socially accepted SWC planning options. As the study used a well-known watershed model (i.e., SWAT), the results are reproducible, and the used approach can be re-applied in other SWC impact assessment studies.
This study applied SWAT—a common and well-known watershed model—in the Wadi Rmel catchment to assess the long-term impact of SWC management on soil erosion between 2000 and 2020. The model calibration and validation using historical data expressed a strong model performance. For monthly simulation, the statistical values of NSE, R2, RSR, and PBIAS were established to be 0.61, 0.66, 0.32, and 8%, respectively, for the calibration process. Similarly, during the validation process, the statistical indices were calculated and NSE was 0.83, R2 was 0.85, RSR was 0.21 and PBIAS was 6.6%. Many empirical values for parameterizing the SWAT model in this study can be used in other watersheds in the larger agro-ecological regions for saving input resources.
A comparison of four periods (2000–2005, 2005–2010, 2010–2015, and 2015–2020) revealed that the managed area with terrace increases caused an accumulative decrease in the sediment yield on the watershed between 2000 and 2020. High determination coefficients of the increasing terracing area to the sediment yield response demonstrate a significant impact of terrace measures on watershed soil erosion. The concave decreasing pattern of sediment yield along elapsed time and increased terraced area express cumulative impacts in the long term. This finding suggests that maximal benefits of SWC should be expected in the long term, i.e., beyond a decade. Short- or medium-term assessment (e.g., shorter 10 years) would have missed the consideration of this expected long-term impact.
6. Recommendations
For follow-up studies within the current research scope of this study, either in the same study areas or elsewhere, particular technical improvements should be performed. Firstly, it is important to invest in updated and comprehensive data collection efforts, including more recent bathymetry measurements and other relevant parameters. Secondly, the inclusion of detailed terrace types and other SWC measures in the input SWC maps is highly recommended. These will improve not only the accuracy and reliability but also the comprehensiveness of impact assessments, which will support policymakers to make informed decisions based on up-to-date information.
For follow-up studies moving beyond the current research scope of this study, besides soil erosion, it is suggested to consider more areas of SWC-induced impacts and qualities of implemented SWC measures as suggested by [59,60]. Other impact areas can be crop and pastoral productivity, water quality, and biodiversity. The direction of impacts can also be negative depending on the qualities of the implemented SWC measures, e.g., improperly designed or abandoned terraces may cause deterioration of top soils, disruption of natural water flows, and other unexpected effects. There are too few studies quantifying the impacts of SWC such as terraces regarding the above aspects [60].
The study scope is recommended to expand to include socio-economic aspects in the impact assessment. Economic impact assessments are often with cost–benefit analysis for particular SWC measures and comparatively among different SWC measures, such as the works of [58,62], and consider trade-offs among different impact areas, upstream and downstream [63]. Moreover, it is crucial to facilitate multi-stakeholder collaboration among government agencies, local communities, researchers, and non-governmental organizations. Encouragement of dialogue, knowledge exchange, and participation ensure that SWC interventions should be contextually appropriate and socially accepted. Indeed, engaging stakeholders in the planning, implementation, and evaluation stages will enhance the effectiveness and sustainability of SWC measures. These socio-economic considerations will enable policymakers to make well-informed decisions that align with both environmental sustainability and socio-economic development goals.
Author Contributions
Conceptualization, F.J., T.H., M.M., C.Z. and Q.B.L.; Methodology, F.J., T.H., C.Z. and Q.B.L.; Validation, F.J., T.H., C.Z. and Q.B.L.; Formal analysis, F.J., T.H., M.M., C.Z. and Q.B.L.; Investigation, F.J.; Resources, T.H. and M.M.; Data curation, F.J.; Writing—original draft, F.J.; Writing—review & editing, T.H., M.M., C.Z. and Q.B.L.; Visualization, F.J., T.H. and Q.B.L.; Supervision, T.H., M.M. and Q.B.L.; Project administration, T.H. and Q.B.L.; Funding acquisition, T.H. and Q.B.L. All authors have read and agreed to the published version of the manuscript.
Funding
This research was funded by LANDSUPPORT project (grant agreement number 774234) and the APC was funded by the CGIAR Research Program on Grain Legumes and Dry Cereals (GLDC).
Data Availability Statement
The data cannot be shared because they are in priority of INRGREF.
Acknowledgments
The authors wish to thank the support of the European Union’s Horizon 2020 research and innovation program under the LANDSUPPORT project (grant agreement number 774234), and the CGIAR Research Program on Grain Legumes and Dry Cereals (GLDC).
Conflicts of Interest
The authors declare no conflict of interest.
References
- Maddocks, A.; Young, R.S.; Reig, P. Ranking the World’s Most Water Stressed Countries in 2040; World Resources Institute: Washington, DC, USA, 2015. [Google Scholar]
- Roose, E. Introduction à la Gestion Conservatoire de L’eau, de la Biomasse et de la Fertilite des Sols (GCES); Bulletin Pedologique de la FAO 70; FAO: Rome, Italy, 1994. [Google Scholar]
- Cherif, B.; Mizouri, M.; Khaldi, R. Guide de Conservation des Eaux et du Sol; Projet PNUD/FAO, TUN/86/020; PNUD/FAO: Tunis, Tunisia, 1995; 274p. [Google Scholar]
- Ministry of Agriculure. Elaboration de la Stratégie de Conservation des Eaux et des Sols de la Tunisie; Technical Report; Ministry of Agriculure: Tunis, Tunisia, 2017; p. 202.
- Keesstra, S.D.; Bouma, J.; Wallinga, J.; Tittonell, P.; Smith, P.; Cerdà, A.; Montanarella, L.; Quinton, J.N.; Pachepsky, Y.; Van der Putten, W.H.; et al. The significance of soils and soil science towards realization of the United Nations Sustainable Development Goals. Soil 2016, 2, 111–128. [Google Scholar] [CrossRef]
- Taguas, E.; Ayuso, J.; Pérez, R.; Giráldez, J.; Gómez, J. Intra and inter-annual variability of runoff and sediment yield of an olive micro-catchment with soil protection by natural ground cover in Southern Spain. Geoderma 2013, 206, 49–62. [Google Scholar] [CrossRef]
- Lakshmi, V.; Alsdorf, D.; Anderson, M.; Nianmaria, S.; Cosh, M.; Entin, J.; Huffman, G.J.; Kustas, W.; Van Oevelen, P.; Painter, T.H.; et al. Remote Sensing of the Terrestrial Water Cycle; Geophysical monograph 206; American Geophysical Union and John Wiley & Sons: Hoboken, NJ, USA, 2015; p. 556. [Google Scholar]
- Sivakumar, B. Nonlinear dynamics and chaos. In Handbook of Applied Hydrology; Singh, V.P., Ed.; Graw-Hill Education: New York, NY, USA, 2017; Chapter 29; pp. 29-1–29-11. [Google Scholar]
- Duan, Q.; Gupta, H.V.; Sorooshian, S.; Rousseau, A.N.; Turcotte, R. Calibration of Watershed Models; AGU: Washington, DC, USA, 2003; p. 345. [Google Scholar]
- Sorooshian, S.; Hsu, K.L.; Coppola, E.; Tomasseti, B.; Verdecchia, M.; Visconti, G. Hydrological Modeling and the Water Cycle: Coupling the Atmospheric and Hydrologic Models; Springer: Dordrecht, The Netherlands, 2018; p. 291. [Google Scholar]
- Johanson, R.C.; Imhoff, J.D.; Davis, H.H., Jr. User’s Manual for Hydrological Simulation Program—Fortran (HSPF); Environmental Research Laboratory, U.S. Environmental Protection Agency: Athens, GA, USA, 1980; EPA-600/9-80-015. [Google Scholar]
- Abbott, M.; Bathurst, J.; Cunge, J.; Connell, P.; Rasmussen, J. An introduction to the European Hydrological System—Système Hydrologique Européen, SHE. J. Hydrol. 1986, 87, 45–77. [Google Scholar] [CrossRef]
- Refsgaard, J.C. Terminology, modeling protocol and classification of hydrological model codes. In Distributed Hydrological Modelling; Abbott, M.B., Refsgaard, J.C., Eds.; Kluwer Academic: Dordrecht, The Netherlands, 1996; pp. 17–39. [Google Scholar]
- Bathurst, J.; Cooley, K. Use of the SHE hydrological modelling system to investigate basin response to snowmelt at Reynolds Creek, Idaho. J. Hydrol. 1996, 175, 181–211. [Google Scholar] [CrossRef]
- Arnold, J.G.; Allen, P.M.; Bernhardt, G. A comprehensive surface-groundwater flow model. J. Hydrol. 1993, 142, 47–69. [Google Scholar] [CrossRef]
- Arnold, J.G.; Srinivasan, R.; Muttiah, R.S.; Williams, J.R. Large-area hydrologic modeling and assessment: Part I. Model development. J. Am. Water Resour. 1998, 34, 73–89. [Google Scholar] [CrossRef]
- Arnold, J.G.; Moriasi, D.N.; Gassman, P.W.; Abbaspour, K.C.; White, M.J.; Srinivasan, R.; Santhi, C.; Harmel, R.D.; Griensven, A.; Van-Liew, M.W.; et al. SWAT: Model use, calibration, and validation. Am. Soc. Agric. Biol. Eng. 2012, 55, 1491–1508. [Google Scholar]
- Ambroise, B.; Beven, K.; Freer, J. Toward a Generalization of the TOPMODEL Concepts: Topographic Indices of Hydrological Similarity. Water Resour. Res. 1996, 32, 2135–2145. [Google Scholar] [CrossRef]
- Braunschweig, F.; Leitao, P.; Fernandes, L.; Pina, P.; Neves, R. The object-oriented design of the integrated water modelling system MOHID. Dev. Water Sci. 2004, 55, 1079–1090. [Google Scholar] [CrossRef]
- Gassman, P.W.; Reyes, M.R.; Green, C.H.; Arnold, J.G. The Soil and Water Assessment Tool: Historical Development, Applications, and Future Research Directions. Trans. ASABE 2007, 50, 1211–1250. [Google Scholar] [CrossRef]
- Sellami, H.; Benabdallah, S.; La Jeunesse, I.; Vanclooster, M. Climate models and hydrological parameter uncertainties in climate change impacts on monthly runoff and daily flow duration curve of a Mediterranean catchment. Hydrol. Sci. J. 2015, 61, 1415–1429. [Google Scholar] [CrossRef]
- Bouraoui, F.; Benabdallah, S.; Jrad, A.; Bidoglio, G. Application of the SWAT model on the Medjerda river basin (Tunisia). Phys. Chem. Earth Parts A/B/C 2005, 30, 497–507. [Google Scholar] [CrossRef]
- Mosbahi, M.; Benabdallah, S.; Boussema, M.R. Assessment of soil erosion risk using SWAT model. Arab. J. Geosci. 2012, 6, 4011–4019. [Google Scholar] [CrossRef]
- Aouissi, J.; Benabdallah, S.; Lili Chabaâne, Z.; Cudennec, C. Assessing the hydrological impacts of agricultural changes upstream of the Tunisian World Heritage sea-connected Ichkeul Lake. Proc. Int. Assoc. Hydrol. Sci. 2015, 365, 61–65. [Google Scholar] [CrossRef]
- Ouessar, M.; Sghaier, M.; Mahdhi, N.; Abdelli, F.; De Graaff, J.; Chaieb, H.; Yahyaoui, H.; Gabriels, D. An integrated approach for impact assessment of water harvesting techniques in dry areas: The case of oued OumZessar watershed (Tunisia). Environ. Monit. Assess. 2004, 99, 127–140. [Google Scholar] [CrossRef] [PubMed]
- Ouessar, M.; Bruggeman, A.; Abdelli, F.; Mohtar, R.H.; Gabriels, D.; Cornelis, W.M. Modelling water-harvesting systems in the arid south of Tunisia using SWAT. Hydrol. Earth Syst. Sci. 2009, 13, 2003–2021. [Google Scholar] [CrossRef]
- Abouabdillah, A. Hydrological Modeling in a Data Poor Mediterranean Catchment (Merguellil-Tunisia). Ph.D. Thesis, Tuscia University of Viterbo, Viterbo, Italy, 2009. [Google Scholar]
- Ben Khelifa, W.; Strohmeier, S.; Benabdallah, S.; Habaieb, H. Evaluation of bench terracing model parameters transferability for runoff and sediment yield on catchment modelling. J. Afr. Earth Sci. 2021, 178, 104177. [Google Scholar] [CrossRef]
- Melaku, N.D.; Renschler, C.S.; Holzmann, H.; Zucca, C.; Strohmeier, S.; Ziadat, F.; Bayu, W.; Klik, A. Prediction of soil and water conservation structure impacts on runoff and erosion processes using SWAT model in the northern Ethiopian highlands. J. Soils Sediments 2018, 18, 1743–1755. [Google Scholar] [CrossRef]
- Abera, W.; Tamene, L.; Tibebe, D.; Adimassu, Z.; Kassa, H.; Hailu, H.; Mekonnen, K.; Desta, G.; Sommer, R.; Verchot, L. Characterizing and evaluating the impacts of national land restoration initiatives on ecosystem services in Ethiopia. Land Degrad. Dev. 2020, 31, 37–52. [Google Scholar] [CrossRef]
- Yaekob, T.; Tamene, L.; Solomon, G.; Gebrehiwot, S.; Demissie, S.S.; Adimassu, Z.; Woldearegay, K.; Mekonnen, k.; Amede, T.; Abera, W.; et al. Assessing the impacts of different land uses and soil and water conservation interventions on runoff and sediment yield at different scales in the central highlands of Ethiopia. Renew. Agric. Food Syst. 2020, 37, S73–S87. [Google Scholar] [CrossRef]
- Kassawmar, T.; Gessesse, G.D.; Zeleke, G.; Subhatu, A. Assessing the soil erosion control efficiency of land management practices implemented through free community labor mobilization in Ethiopia. Int. Soil Water Conserv. Res. 2018, 6, 87–98. [Google Scholar] [CrossRef]
- Gachene, C.K.K.; Nyawade, S.O.; Karanja, N.N. Soil and Water Conservation: An Overview. In Encyclopedia of the UN Sustainable Development Goals; Filho, W.L., Azul, A.M., Brandli, L., Özuyar, P.G., Wall, T., Eds.; Springer Nature: Cham, Switzerland, 2020; pp. 810–823. ISBN 9783319956749. [Google Scholar]
- Nafi, E. Interactive Tillage & Crop Residue Management Effects on Soil Properties, Crop Nutrient Uptake & Yield in Different Weathered Soils of West Africa; Universität Bonn: Bonn, Germany, 2020. [Google Scholar]
- Novara, A.; Cerda, A.; Barone, E.; Gristina, L. Cover crop management and water conservation in vineyard and olive orchards. Soil Tillage Res. 2021, 208, 104896. [Google Scholar] [CrossRef]
- Chen, X.; Liang, Z.; Zhang, Z.; Zhang, L. Effects of Soil and Water Conservation Measures on Runoff and Sediment Yield in Red Soil Slope Farmland under Natural Rainfall. Sustainability 2020, 12, 3417. [Google Scholar] [CrossRef]
- Jia, H.; Wang, X.; Sun, W.; Mu, X.; Gao, P.; Zhao, G.; Li, Z. Estimation of Soil Erosion and Evaluation of Soil and Water Conservation Benefit in Terraces under Extreme Precipitation. Water 2022, 14, 1675. [Google Scholar] [CrossRef]
- Attia, R.; Agrebaoui, S.; Dridi, B.; Al Ali, Y.; Andrieux, P.; Pepin, Y.; Touma, J.; Zante, P. Les États de Surface et Leur Caractérisation Hydrodynamique par Simulation de Pluie Dans le Bassin Versant d’el Gouazine; Publication Interne-Mission IRD de Tunis: Tunis, Tunisia, 2004; 57p. [Google Scholar]
- Ben Ayed, A. Etude pédologique de 1′URD de Zaghouan. Ministère de l’Agriculture et des Ressources Hydraulique-Tunis 1966.
- Singh, J.; Knapp, H.; Demissie, M. Hydrologic Modeling of the Iroquois River Watershed Using HSPF and SWAT; ISWS CR 2004–08; Illionois State Water Survey: Champaign, IL, USA, 2004. [Google Scholar]
- Mansouri, T. Modélisation Spatialisée des Écoulements et du Transport Solide des Bassins Versants des Lacs Collinaires de la Dorsale Tunisienne et du Cap Bon. Ph.D. Thesis, University of Tunis El Manar, Tunis, Tunisia, 2001. [Google Scholar]
- Attia, R.; Hamrouni, H.; Agrebaoui, S.; Dridi, B. Caractérisation et Évaluation de L’érosion Hydrique Bassin Versant de Sbaihia (Zaghouan); Direction des Ressources en Sols, Ministère de l’Agriculture et des Ressources Hydraulique: Tunis, Tunisia, 2004. [Google Scholar]
- Neitsch, S.L.; Arnold, J.G.; Kiniry, J.R.; Williams, J.R. Soil and Water Assessment Tool Theoretical Documentation Version 2009; Grassland, Soil and Water Research Laboratory, Agricultural Research Service and Blackland Research Center, Texas Agricultural Experiment Station: College Station, TX, USA, 2011. [Google Scholar]
- Neitsch, S.; Arnold, J.G.; Kiniry, J.R.; Srinivasan, R.; Williams, J. Soil and Water Assessment Tool: Theoretical Documentation: Version 2005; Texas Water Resources Institute: College Station, TX, USA, 2005; 494p. [Google Scholar]
- Winchell, M.; Srinivasan, R.; Di Luzio, M. ArcSWAT Interface for SWAT2005—User’s Guide; Texas Water Resources Institute: College Station, TX, USA, 2007. [Google Scholar]
- Abbaspour, K.C.; Yang, J.; Maximov, I.; Siber, R.; Bogner, K.; Mieleitner, J.; Zobrist, J.; Srinivasan, R. Modelling hydrology and water quality in the pre-alpine/alpine Thur watershed using SWAT. J. Hydrol. 2007, 333, 413–430. [Google Scholar] [CrossRef]
- Abbaspour, K. SWAT Calibration and Uncertainty Program (SWAT-CUP); User Manual; Eawag, Swiss Federal Institute of Aquatic Science and Technology: Dübendorf, Switzerland, 2015. [Google Scholar]
- Kouchi, D.H.; Esmaili, K.; Faridhosseini, A.; Sanaeinejad, S.H.; Khalili, D.; Abbaspour, K.C. Sensitivity of Calibrated Parameters and Water Resource Estimates on Different Objective Functions and Optimization Algorithms. Water 2017, 9, 384. [Google Scholar] [CrossRef]
- Baker, T.J.; Miller, S.N. Using the Soil and Water Assessment Tool (SWAT) to assess land use impact on water resources in an East African watershed. J. Hydrol. 2013, 486, 100–111. [Google Scholar] [CrossRef]
- Waidler, D.; White, M.J.; Steglich, E.M.; Wang, S.; Williams, J.; Jones, C.A.; Srinivasan, R. Conservation Practice Modeling Guide for SWAT and APEX; Texas Water Resources Institute Technical Report No.399; Texas Water Resources Institute: College Station, TX, USA, 2011; p. 71. [Google Scholar]
- Zante, P.; Collinet, J. Cartographie des Risques Érosifs sur le Bassin Versant de la Retenue Collinaire Elhnach (Dorsale Tunisienne); Direction de la Conservation des Eaux et des Sols: Tunis, Tunisia; Institut de Recherche pour le Développement: Tunis, Tunisia, 2001. [Google Scholar]
- Hermassi, T.; Cherif, M.A.; Habaieb, H. Etude du transport solide au niveau du bassin versant de Merguellil, Tunisie centrale: Cas des bassins versants d’Ettiour et de Rajela. Houille Blanche 2014, 100, 88–96. [Google Scholar] [CrossRef]
- Abbaspour, K.C. SWAT-CUP-2012. SWAT Calibration and Uncertainty Program—A User Manual; Swiss Federal Institute of Aquatic Science and Technology: Dübendorf, Switzerland, 2012. [Google Scholar]
- Yang, J.; Abbaspour, K.C.; Reichert, P.; Yang, H. Comparing uncertainty analysis techniques for a SWAT application to the Chaohe Basin in China. J. Hydrol. 2008, 358, 1–23. [Google Scholar] [CrossRef]
- Gupta, H.V.; Kling, H.; Yilmaz, K.K.; Martinez, G.F. Decomposition of the mean squared error and NSE performance criteria: Implications for improving hydrological modelling. J. Hydrol. 2009, 377, 80–91. [Google Scholar] [CrossRef]
- Moriasi, D.N.; Gitau, M.W.; Pai, N.; Daggupati, N. Hydrologic and water quality models: Performance measures and evaluation criteria. Am. Soc. Agric. Biol. Eng. 2015, 58, 1763–1785. [Google Scholar]
- Jebari, S.; Berndtsson, R.; Bahri, A.; Boufaroua, M. Spatial soil loss risk and reservoir siltation in semi-arid Tunisia. Hydrol. Sci. J. 2010, 55, 121–137. [Google Scholar] [CrossRef]
- Balana, B.B.; Muys, B.; Haregeweyn, N.; Descheemaeker, K.; Deckers, J.; Poesen, J.; Nyssen, J.; Mathijs, E. Cost-benefit analysis of soil and water conservation measure: The case of exclosures in Northern Ethiopia. For. Policy Econ. 2012, 15, 27–36. [Google Scholar] [CrossRef]
- WOCAT (World Overview of Conservation Approaches and Technologies). Questionnaire on Sustainable Land Management (SLM) Technologies; WOCAT, CDE (Centre for Development and Environment): Bern, Switzerland, 2019. [Google Scholar]
- Deng, C.; Zhang, G.; Liu, Y.; Nie, X.; Li, Z.; Liu, J.; Zhu, D. Advantages and disadvantages of terracing: A comprehensive review. Int. Soil Water Conserv. Res. 2021, 9, 344–359. [Google Scholar] [CrossRef]
- Ben Khelifa, W.; Hermassi, T.; Strohmeier, S.; Zucca, C.; Ziadat, F.; Boufaroua, M.; Habaieb, H. Parameterization of the Effect of Bench Terraces on Runoff and Sediment Yield by Swat Modeling in a Small Semi-arid Watershed in Northern Tunisia. Land Degrad. Dev. 2017, 28, 1568–1578. [Google Scholar] [CrossRef]
- Posthumus, H.; Graaff, J. Cost-Benefit Analysis of bench terraces, a case study in Peru. Land Degrad. Dev. 2005, 16, 1–11. [Google Scholar]
- Birnholz, C.; Paul, B.; Sommer, R.; Nijbroek, R. Modeling Soil Erosion Impacts and Trade-Offs of Sustainable Land Management Practices in the Upper Tana Region of the Central Highlands in Kenya. In Enhancing Agricultural Research and Precision Management for Subsistence Farming by Integrating System Models with Experiments; Timlin, D.J., Anapalli, S.S., Eds.; American Society of Agronomy: Madison, WI, USA, 2022; pp. 6–28. [Google Scholar]


Disclaimer/Publisher’s Note: The statements, opinions and data contained in all publications are solely those of the individual author(s) and contributor(s) and not of MDPI and/or the editor(s). MDPI and/or the editor(s) disclaim responsibility for any injury to people or property resulting from any ideas, methods, instructions or products referred to in the content. |
© 2023 by the authors. Licensee MDPI, Basel, Switzerland. This article is an open access article distributed under the terms and conditions of the Creative Commons Attribution (CC BY) license (https://creativecommons.org/licenses/by/4.0/).