Abstract
In the context of rapid urbanization, inefficient, disorderly, and low-density urban sprawl often leads to resource waste and ecological damage. Over the decades, many studies on the measurement, analysis, and governance of urban sprawl have emerged. However, existing approaches lack in-depth research on distinguishing effective expansion from inefficient sprawl. Given the limit of land use resources and the demand for urban development, an accurate and reasonable method for urban sprawl measurement is needed. This study proposes an urban sprawl identification method based on a mechanical equilibrium model to analyze the spatial distribution and spatiotemporal evolution characteristics of inefficient sprawl, using the Yangtze River Delta’s (YRD) urban agglomeration as an example. The study found the following: (1) The inefficient sprawl in the YRD was 5219, 1189, and 980 km2 in the three five-year periods between 2005 and 2020. (2) From 2005 to 2020, the inefficient sprawl in the YRD was, on the whole, a weakening trend, but Shanghai and Zhoushan showed an accelerating trend of inefficient sprawl. (3) The proposed method is applicable to most urban development patterns and provides implications for urban sprawl control in mega-urban agglomeration areas, such as the YRD.
1. Introduction
Accompanied by urbanization and industrialization for decades, urban sprawl, which is defined as an inefficient, disorderly, and low-density development mode (i.e., negative urban expansion), has emerged and developed rapidly [1]. Urban agglomeration is an aggregate of cities within certain geographic areas, which often vary in size, function, and characteristics [2]. Diverse elements, such as population, capital, and technology, are gathered in urban agglomeration areas, leading to a solid economic aggregation and radiation capacity [3]. Urban agglomeration has become an important development focus of countries and regions worldwide and is one of the main drivers of regional socioeconomic growth. For example, urban agglomeration in the New York Bay area, the Tokyo Bay area, and the London metropolitan area have been great drivers of globalization. In China, urban agglomeration in the Yangtze River Delta (YRD) region, Beijing–Tianjin–Hebei region, and Guangdong–Hong Kong–Macao Greater Bay area have also become essential carriers of China’s economy, industry, and technological innovation [4].
Despite the importance of urban agglomeration for regional development, the rapid expansion of urban space has also occupied a large amount of rural and ecological space, adding pressure to the eco-environment. In the process of urban expansion, inefficient and disorderly land construction, which is known as “urban sprawl”, has emerged for reasons such as resource mismatching, the imbalance between supply and demand, and competition among local governments [5,6]. Urban sprawl has worsened the human–land relationship, leading to negative results such as damage to biodiversity, the destruction of wetland resources, reduction of arable land resources, increased carbon emissions, and fragmentation of land use, which seriously affect the sustainable development of cities [7,8]. Therefore, measuring the spatial and temporal characteristics of urban sprawl in urban agglomeration and analyzing governance strategies are globally important issues.
To summarize the methods of urban sprawl measurement in previous studies, the metrics have expanded from one dimension to multiple dimensions, and the methods have been improved from qualitative to quantitative methods. However, existing studies lack in-depth consideration for distinguishing efficient expansion from inefficient sprawl. Especially for urban clusters, the large number and types of cities in the region require a certain amount of land space to ensure the needs of regional construction and development, which puts demands on the efficient use of land. Although some studies have considered the relationship between land use, population, and industry [9,10], they have not clearly proposed a quantitative measurement to distinguish between effective expansion and inefficient sprawl. The development of cities involves the spatial expansion of construction land. With limited land resources, urban construction must balance the relationship between land exploitation, socioeconomic development, and ecological environmental protection. Land exploitation refers to the way and purpose for which land is utilized in different times and spaces, including construction land and agricultural land. Socioeconomic development refers to changes and developments in demographic, economic, and social activities over time. Ecological and environmental protection, on the other hand, prioritizes the protection of ecological safety and maximizes the benefits of ecosystem services in the process of land use in order to achieve the dual goals of socioeconomic development and ecological environmental protection. It is necessary to formulate a sustainable land use policy and combine it with socioeconomic development so as to realize a win-win situation for both the ecological environment and the socioeconomy. Therefore, whether urban expansion is effective or not must be distinguished.
To address the research gap, this study distinguishes inefficient urban sprawl from efficient urban expansion on the basis of multiple dimensions, including socioeconomic development, urban spatial expansion, and urban function improvement. Socioeconomic development refers to urban population growth and economic development; urban spatial expansion indicates the expansion of construction land in the city, which is the material spatial condition for urban expansion discriminations; and urban function improvement refers to the improvement of infrastructure and the development of functional areas, reflecting whether the urban development can meet the living needs of residents. A synchronized and coordinated relationship between the three dimensions indicates effective development; otherwise, urban sprawl occurs, especially when the urban space expands faster than socioeconomic development and urban function improvement. A mechanical equilibrium model is applied to measure this relationship. The mechanical equilibrium model is a tool which was first used in physics to analyze the coordination relationships between various subsystems and is now being extended to urban research fields, such as tradeoff–synergy analysis of land use functions [11] and coordination analysis of production–life–ecology functions [12]. In this study, the model is applicable because identifying urban sprawl by judging the development of the three dimensions is necessary. To test and evaluate the model, this study first conducts a pre-experiment, and then the proposed method is extended to the YRD to analyze the spatial distribution and spatiotemporal evolution of urban sprawl. The Conclusions section of this study proposes strategies for managing urban sprawl in the YRD region.
Figure 1 shows the structural organization of this study.
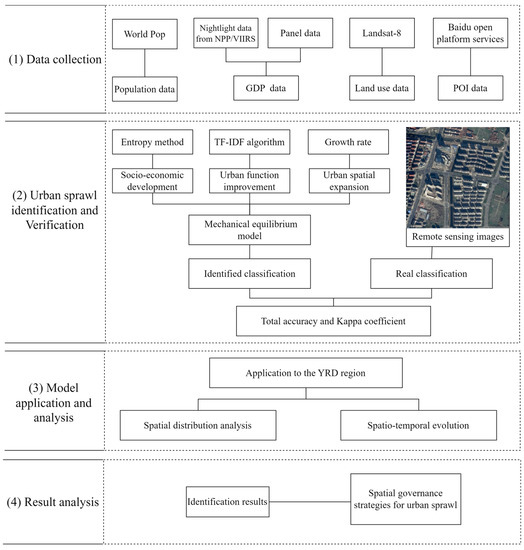
Figure 1.
The flow chart.
2. Literature Review
2.1. Measurement of Urban Sprawl in Previous Studies
Urban sprawl is a spatially inefficient, disorderly, and chaotic development pattern. Therefore, studies have often measured the extent of urban sprawl by adopting indicators that reflect this spatial disorder in different dimensions. Common subdimensions include area, density, shape, and topological relationships. As shown in Table 1, this study classifies the indicators of urban sprawl in terms of land, function, and economy and evaluates them in terms of four aspects: area, density, shape, and topological relationship.

Table 1.
Main urban sprawl measurements and indicated characteristics.
Studies on the measurement of urban sprawl have been conducted, including single indicator descriptions, comprehensive evaluations, and entropy models. However, urban sprawl is an inefficient, low-density, and disorderly development pattern, indicating the incompatibility between socioeconomic development, urban spatial expansion, and urban function improvement. Moreover, the existing measurement methods fail to measure the balance of the indicators. In this study, the mechanical equilibrium model was selected to measure the indicators.
Despite the rich discussion of urban sprawl models, the following two essential aspects have been insufficiently studied: (1) Limitations to urban functions in urban construction make it difficult to meet the daily needs of residents, often causing social inequity. Therefore, the dimension of urban function must be included in the measurement framework [3]. (2) The relationship between the different dimensions is rarely considered. Thus, the difference between sprawl and expansion is not distinguished in consideration of the needs of development and the necessity of conservation [25].
2.2. Spatial Planning and Urban Sprawl Control
Given that urbanization is ongoing, especially in developing countries, facing the common task of ecological civilization construction and discussing how to realize urban sprawl control through strategies such as spatial planning are critical. Planners and administrators must consider problems in accordance with the actual situation in their region. This study categorizes developed and developing countries and explores the spatial governance strategies of urban sprawl in terms of four aspects: land use policy, market economy strategy, industrial structure adjustment, and administrative division management (Table 2).
Table 2.
Examples of spatial governance strategies for urban sprawl.
Despite numerous studies on urban sprawl governance strategies, the existing studies still have two shortcomings: (1) The current consideration is the relatively single dimension, whereas urban expansion is a complex process, and its spatial governance should also consider the coordination of the interests of multiple parties. (2) Most studies were conducted in the direction of land policy and market economic regulation for strategy enhancement, but only a few of them mentioned the strategy of urban function enhancement.
These examples show that urban sprawl is a global phenomenon but is rooted in its specific form at the local level. Urban planning policies must consider urban sprawl in a local context. This study proposes correspondingly different spatial governance strategies by combining several perspectives with the local context of the study area.
3. Study Area and Data Processing
3.1. Study Area
The YRD region (27.20° N–35.33° N, 114.90° E–123.17° E), located on the eastern coastline of China, is a fast-growing urbanized and highly integrated area in China (Figure 2). The YRD region occupies approximately 3.7% of China’s whole territory, accounts for 16% of the entire country’s population, and generated nearly 24% of the national GDP in 2021.
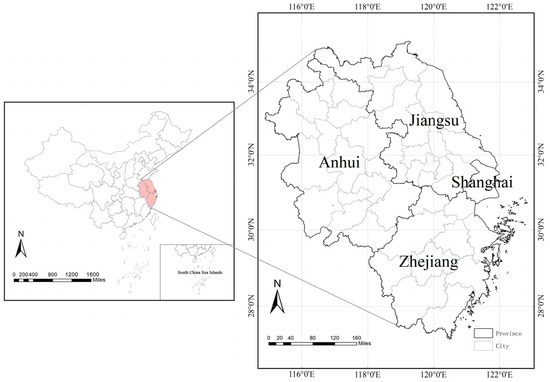
Figure 2.
Study area: YRD region in China and the spatial scope of the YRD region.
As shown in Figure 3, the total area of urban construction land in the YRD region was 10,906 km2 in 2005, 18,171 km2 in 2010, 20,294 km2 in 2015, and 21,855 km2 in 2020. The change in urban construction land in the YRD region was considerable. This study selected the YRD region as a case study area mainly for the following reasons. First, the YRD is a typical mega-urban agglomeration with considerable urban expansion, where construction land expanded by 10,949 km2 from 2005 to 2020. Second, the rapid expansion of cities squeezes the regional ecological environment space and brings ecological threats to the YRD, which is one of the regions with the largest ecological footprint, the most complex ecological environment problems, and the most fragile ecological sensitivity in China [39,40]. Third, as one of the main socioeconomic drivers of China, the sustainable development of the YRD is crucial. Thus, urban expansion must be reasonably assessed, its spatial and temporal evolution characteristics must be analyzed, and scientific and effective spatial control strategies must be proposed.
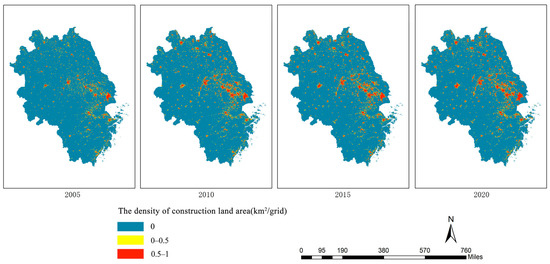
Figure 3.
Urban construction land in the YRD region from 2005 to 2020.
3.2. Data Source and Processing
This study was conducted at a 1 km scale. The indicators were based on multiple sources of data from 2005, 2010, 2015, and 2020 and included the following: population, GDP, point of interest (POI), and construction land. All indicators were processed in the same spatial coordinate system and normalized to between 0 and 1. Table 3 shows the processing method of the collected data.
Table 3.
Selected factors to identify inefficient urban sprawl sites.
4. Methodologies
4.1. Urban Sprawl Identification Based on the Mechanical Equilibrium Model
This study proposes a quantitative measurement of urban sprawl based on a mechanical equilibrium model. The model uses three vector forces in the right angle coordinate system to characterize the state of the three subsystems and evaluates the overall characteristics of the system on the basis of the combined vector forces and the quadrant in which they are located. Before applying this model, the three dimensions must be estimated.
Socioeconomic development has been studied in the past using a range of indicators such as population, GDP, industrial structure, school enrollment, and number of hospital beds per capita. However, GDP and population are the two main indicators, which is why we chose them to estimate socioeconomic development. Undesirable socioeconomic levels, such as a high population concentration or low economic levels, can lead to ecosystems that are under enormous pressure from resource depletion and environmental pollution. Urban spatial expansion refers to the expansion of urban physical space (i.e., the increase in the area of urban construction land in land use types). The rapid growth of urban construction land inevitably leads to a reduction in the area of ecological land, such as grasslands and waters, which squeezes the ecological space and destroys the ecosystem. Urban function improvement can evaluate the degree of infrastructure improvement, the quality of life of citizens, and the degree of social equity in the urban development process. Inadequate urban functionality may lead to social instability, resulting in unequal distribution of resources and lagging environmental protection measures, thus exacerbating ecological problems in cities.
All three dimensions are directly and importantly linked to the urban ecological environment. More importantly, in the process of dynamic urban development, these three dimensions need to be developed in synchronization and with mutual constraints in order to achieve effective and benign urban expansion.
- (1)
- Socioeconomic development
The quantification of socioeconomic development is usually characterized by the average annual growth of GDP and population [42]. This study combines the population growth and GDP growth to quantify socioeconomic development as follows:
where and represent the population and GDP in the year i, and T is the study period of urban expansion. This study uses the entropy method to determine the weights of the population growth and economic growth, which are calculated as follows:
where n is the sample size, m is the number of indicators, and is the random variable. The final estimation of socioeconomic development is
- (2)
- Urban spatial expansion
The quantitative estimation of urban space expansion is the average annual growth of urban construction land. The calculation is as follows:
where A is the area of construction land in the year i.
- (3)
- Urban function improvement
The urban functional development is calculated on the basis of the integrated identification and quantification of the term frequency–inverse document frequency (TF–IDF) algorithm and POI density. The TF–IDF algorithm is a common weighting technique used in machine learning for information retrieval and data mining and can be used to evaluate the importance of a single word in a document set. POI data are a kind of data describing the spatial and attribute information of geographic entities, consisting of 16 functional types, such as food service, shopping service, scientific, educational, and cultural service, and residential service. Many current studies based on POI data assign weights to these functional types in a simplistic manner, which may lead to functional areas being incorrectly identified [43,44]. In this study, the TF–IDF algorithm is used to abstract POI data into words, calculate the weight of each POI type from the local and global levels, and identify mixed or single functional areas by using the frequency density. The calculation formula is as follows:
where represents the total number of grids in the current study area, represents the number of grids containing the ith class of POI in the current study area, is the j-th grid, and represents the weight of the ith class of POI. is the percentage of the ith class of POI in the jth grid, denotes the number of times that the ith class POI appears in the jth grid, and is the total number of POIs in the jth grid. is the weighted value of the ith class of POI in the jth grid. is the frequency density of the ith class of POI. When the value of any type of POI present in a grid is greater than or equal to 50%, then this grid is identified as a monofunctional area. On the contrary, when the values of all types of POIs in a grid are less than 50%, then this grid is identified as a mixed functional area.
Whether the functions in the region are mixed or individual does not represent the current level of urban functional development of the region; the density of POI distribution is equally important. The POI density is calculated as follows:
where is the POI density of the jth grid and is the area of the grid (km2). In this study, a sufficient number of typical low- and high-POI density sample point grids was selected through field research, and the POI density was calculated separately. The average value of the POI density of all sample points (30 points/km2) was finally used as the classification standard. By combining the degree of functional mixing and functional density, the final functional identification results can be obtained as follows:
The neighborhood assignment method (Figure 4) was used to quantify the level of functional development of the city. In this study, low-density single-function areas were considered the worst case of an urban function, and high-density mixed-function areas were considered the best case of an urban function. Thus, the identification results were assigned as one, two, three, and four in order. No data area was assigned as zero. Based on the agglomeration of urban functional areas, the urban function level of the grid depends on the urban function level of the eight adjacent grids, which is calculated as follows:
where represents the urban function level of the ith grid adjacent to the current grid ( = 1,2,3,4) and is the level of urban function in year i.
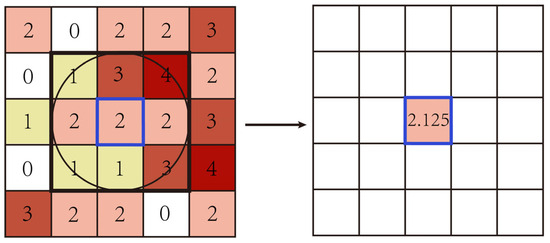
Figure 4.
Neighborhood assignment method.
- (4)
- Urban sprawl measurement based on the mechanical equilibrium model
In the mechanical equilibrium model for identifying urban sprawl, socioeconomic development, urban spatial expansion, and urban function improvement are abstracted as vector forces OA, OB, and OC in three directions in a Cartesian coordinate system (Figure 5). The angle between any two of these three forces is 2π/3. To facilitate the calculation and explanation of the results, the X axis is used as the starting axis, the direction of calculation is the same as the positive direction of the X axis, and the directions of OA, OB, and OC are set to π/2, 7π/6, and 11π/6, respectively. The combined vector force is represented using the polar coordinates (F, θ), where F is the polar diameter and θ is the polar angle. F and θ denote the degree of unevenness and the dominant factor of urban expansion. When F = 0, urban expansion is in an ideal state (i.e., the rate of socioeconomic and urban function development is consistent with the rate of urban spatial expansion, which indicates that this urban expansion is efficient). On the contrary, when the combined forces are shifted (F ≠ 0), the magnitude of the F value reflects the degree of imbalance between socioeconomic development, urban spatial expansion, and urban function improvement. The larger the value of F, the higher the degree of imbalance. The combined vector force perspective θ represents the relationship between the three subsystems in the urban expansion process. Given that this study is focused on urban expansion areas, urban spatial expansion (OC) greater than zero is a prerequisite for the calculation, and areas with OC values less than or equal to zero are excluded.
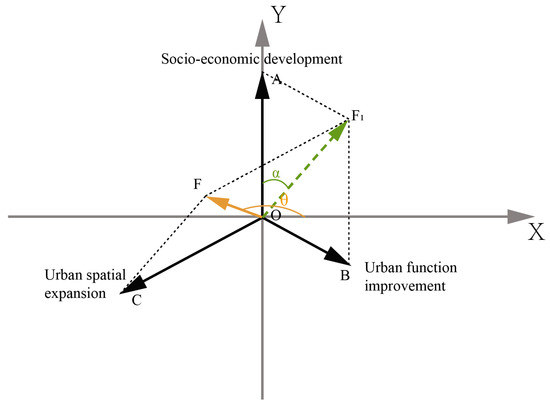
Figure 5.
Urban sprawl measurement based on the mechanical equilibrium model.
In the calculation of the mechanical equilibrium model, the combined vector force F1 of OA and OB is calculated first, and then the combined force F of F1 and OC is calculated in the same way. The calculation formula is as follows:
where , , and .
A small value for F denotes a balance between the three dimensions and is defined as efficient urban expansion; otherwise, when an imbalance is found between the three dimensions, especially when is greater than and , inefficient urban sprawl is identified.
4.2. Verification of the Identification
To ensure the applicability of the model, we first applied the model to a component city of the YRD for pre-experimentation. The selected city was Nantong, which is a prefecture city of Jiangsu Province. After the pre-experiment in Nantong and the main experiment in the YRD region, we selected enough sample points and used the total classification accuracy and the kappa coefficient to verify the identification results of the model. By manually observing Google Earth multiperiod satellite maps, the open space ratio, greenery ratio, and building clutter were used to verify whether areas were inefficient urban sprawl sites. The kappa coefficient is calculated by the following formula:
where K is the kappa coefficient, is the total classification accuracy, t represents the sum of the number of correctly identified samples in each type, and n represents the total number of samples, while represents the number of observed samples in type i and represents the number of correctly predicted samples in type i.
5. Analyses and Results
5.1. Identification Results of the Pre-Experiment in Nantong
To verify the rationality of the proposed model, the urban sprawl of Nantong from 2015 to 2020 was measured as the sample for the pre-experiment. Through the calculation, this study obtained several urban expansion patterns in Nantong (Figure 6). Through the natural breakpoint method, urban expansion patterns were classified into two main categories: equilibrium expansion (0 < F ≤ 0.397, the blue area in Figure 6) and disequilibrium expansion (0.397 < F ≤ 1, the green and orange areas in Figure 6). Disequilibrium expansion was further classified into types with different magnitudes and angles of the combined vector forces: II (socioeconomically dominated expansion), III (urban construction land-dominated expansion), IV (urban function-dominated expansion), V (socioeconomic and urban function coordinated expansion), VI (socioeconomic and urban land use coordinated expansion), and VII (urban function and construction land coordinated expansion). Among these seven urban expansion patterns, we identified urban construction land-led development (III) as inefficient urban sprawl. In this expansion mode, socioeconomic construction and urban function construction considerably lag behind urban land construction, which is manifested by a low local population inflow, lack of supporting facilities, many unused wastelands, and poor ecological landscape and thus is inefficient urban sprawl. Therefore, when 0.397 < F ≤ 1 and −π < θ < −2π/3, the grid is identified as an inefficient urban sprawl area, and the other six cases were considered effective urban expansion in this study.
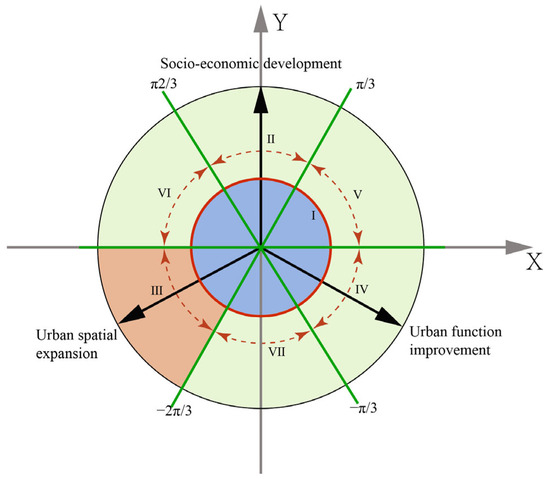
Figure 6.
Comprehensive measurement of urban expansion patterns.
With reference to Google Earth’s multiperiod satellite maps and actual survey data, the seven types of urban expansion patterns and corresponding remote sensing images that show the changes from 2015 to 2020 are displayed in Table 4.
Table 4.
Urban expansion patterns.
Among these seven types, the cases where 0.397 < F ≤ 1 were identified as equilibrium expansion. When the combined force was greater than 0.397 and the angle was between −2π/3 and π, such cases were identified as disequilibrium but effective expansion, where the speed of socioeconomic development or urban function improvement is faster than urban spatial expansion. The remaining case was identified as inefficient urban sprawl. Figure 7 shows the urban expansion pattern of Nantong from 2015 to 2020. The urban expansion area accounted for 10.7%, of which 98.8% was an effective expansion area, and the remaining 1.2% was an urban sprawl area. This result indicates that Nantong had an overall high level of urbanization and efficient use of urban construction space from 2015 to 2020. The total classification accuracy and kappa coefficient were used for verification. The identification results based on the mechanical balance model had a total classification accuracy of 0.84 and a kappa coefficient of 0.67, indicating that this model has high identification accuracy.
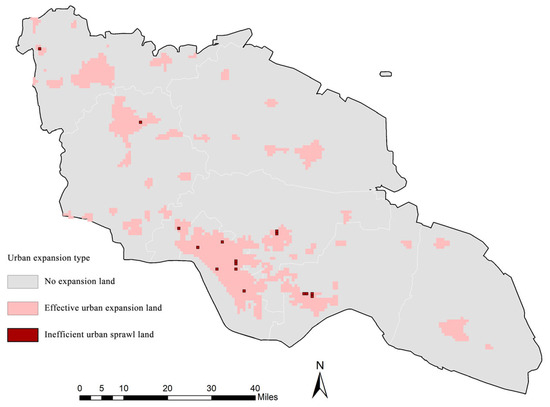
Figure 7.
Spatial distribution of urban expansion in Nantong City from 2015 to 2020.
5.2. Urban Sprawl of the YRD Region from 2005 to 2020
After demonstrating the applicability of the proposed model in the pre-experiment, the model was applied to analyze urban sprawl in the YRD region at multiple scales from 2005 to 2020 (Figure 8). The identification results at the 1 km scale had three classifications, including inefficient urban sprawl land, effective urban expansion land, and no expansion land. From 2005 to 2010, Jiangsu had substantial inefficient sprawl land and dense distribution, whereas Anhui had substantial inefficient sprawl land, but the distribution was relatively fragmented. Shanghai and Zhejiang are largely effective sprawl sites with little inefficient sprawl. During the period from 2010 to 2015, Jiangsu and Shanghai had high urban expansion efficiency, because Jiangsu’s urban expansion efficiency greatly improved. However, inefficient sprawl sites increased considerably in Zhejiang, and inefficient sprawl deteriorated further and became more concentrated in Anhui. Between 2015 and 2020, densely distributed inefficient sprawl sites appeared in Shanghai. The efficiency of urban expansion in Jiangsu remained at a high level, with only a little inefficient sprawl occurring. In Anhui and Zhejiang, inefficient sprawl was considerably reduced and scattered at the edges of urban sprawl patches.
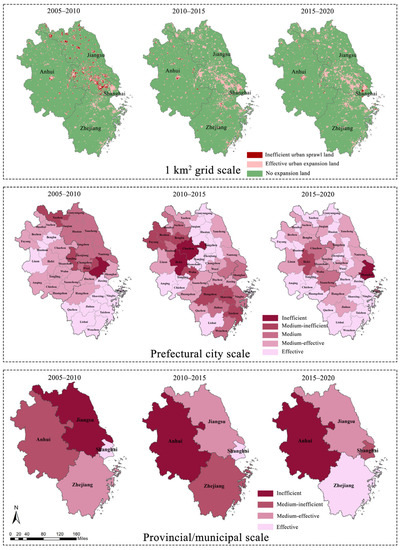
Figure 8.
Identification of multi-scale urban sprawl in the YRD region from 2000 to 2020.
The results can be studied further at the prefectural city scale and the provincial or municipal scale. From 2005 to 2020, inefficient urban sprawl land in Jiangsu showed a trend of reduction, from 4562 km2 in 2005–2010 down to 191 km2 in 2015–2020. Between 2005 and 2010, almost every municipality in Jiangsu Province experienced rapid urbanization and had a large amount of land for urban development, which was accompanied by an extremely large amount of low-efficiency urban sprawl land. Suzhou, Wuxi, and Changzhou in southern Jiangsu, with a high socioeconomic level, were developing rapidly, and the inefficient urban areas spread up to 995, 420, and 220 km2, respectively. After 2010, with the improvement of supporting infrastructure, population inflow, economic growth, and optimization policies of municipalities, the efficiency of urban development in Jiangsu Province was remarkably improved, and inefficient urban sprawl sites were drastically reduced. In contrast to Jiangsu, the area of inefficient urban sprawl in Shanghai showed a considerable upward trend, growing from 27 km2 in 2005–2010 to 284 km2 in 2015–2020. With the rapid growth of Shanghai’s economy, industries originally located in the city center gradually moved out to the suburbs. This large-scale industrial outward migration has accelerated Shanghai’s urbanization while also making inefficient urban sprawl happen more frequently. Inefficient urban sprawl in Zhejiang has experienced a process of growth followed by reduction. Between 2010 and 2015, Hangzhou, the provincial capital of Zhejiang Province, and coastal cities such as Ningbo and Wenzhou experienced rapid economic development and high demand for urban expansion. Therefore, inefficient urban sprawl in Zhejiang’s land during 2010–2015 was distributed in these two types of areas, totaling 336 km2. In 2005–2010 and 2015–2020, the area of inefficient urban sprawl land in Zhejiang Province was relatively small (i.e., 76 km2 and 113 km2, respectively). Among the three provinces in the YRD region, Anhui is the least developed socioeconomically, with a total population of 61.04 million in 2020 (compared with 84.77 million in Jiangsu and 64.68 million in Zhejiang) and a GDP of CNY 3.81 trillion (compared with CNY 10.28 trillion in Jiangsu and CNY 6.47 trillion in Zhejiang). Inefficient urban sprawl in Anhui was concentrated in the provincial capital of Hefei and its surroundings from 2005 to 2010, with a total area of 554 km2. Between 2010 and 2015, such a situation spread to the whole province, with a total area of 640 km2. Between 2015 and 2020, inefficient urban sprawl decreased, but it still reached 392 km2. The efficiency of urban expansion in Anhui has stayed at a low level. Areas that are socioeconomically backward and have high urbanization demands are relatively more likely to suffer from inefficient urban sprawl, which also curbs regional development [2].
5.3. Spatial Evolution of Inefficient Urban Sprawl in the YRD Region
In this study, kernel density analysis and spatial hotspot analysis were used to examine further the spatial association patterns and distribution characteristics of urban sprawl in the YRD region (Figure 9). Kernel density analysis measures the spatial density differences and local clustering characteristics of urban sprawl point-like elements. A search radius of 2.5 km and image element size of 500 m × 500 m were set, and the kernel density maps of urban sprawl in three expansion stages from 2005 to 2020 were generated. Between 2005 and 2010, a large-scale urban sprawl agglomeration center consisting of cities in southern Jiangsu, such as Suzhou, Wuxi, and Chang, emerged. During this period, urban sprawl densities were high throughout Jiangsu and low in the rest of the YRD region, except for Hefei, the capital city of Anhui. Between 2010 and 2015, Anhui, Zhejiang, and Shanghai showed high-density urban sprawl cores with scattered multipoint distribution, whereas the inefficient sprawl density in Jiangsu became lower. Between 2015 and 2020, Shanghai and southern Anhui had the highest urban sprawl densities, whereas the rest of the regions had lower densities. We then performed hotspot analysis on urban sprawl sites in the YRD region to explore the spatial clustering characteristics of sprawl intensity. The analysis results were all hot spots and no cold spots, indicating that the sprawl intensity in the YRD region is characterized by high-value clustering. Compared with the kernel density map, the high-value clustering characteristics of the YRD region had a global positive correlation with the density distribution characteristics. The YRD region always maintained the spatial pattern characteristics of high-intensity and high-density inefficient urban sprawl between 2005 and 2020.
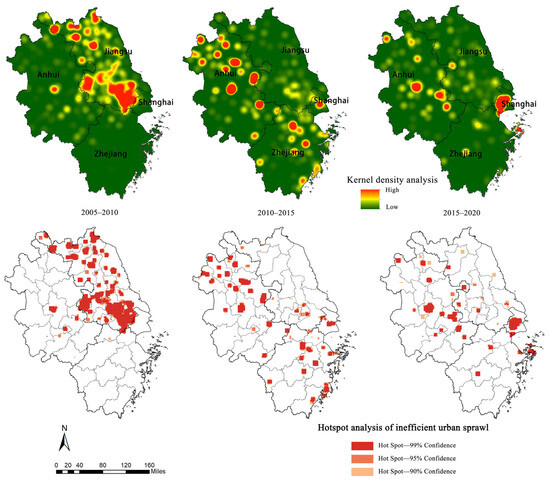
Figure 9.
Dynamic characteristics of the spatiotemporal evolution of urban sprawl in the YRD region from 2005 to 2020.
6. Discussion
6.1. Comparison with the Results of Existing Studies
Several studies [45,46] have been conducted on urban expansion of the YRD region, and they obtained two major findings: (1) The YRD region had a peak period of rapid sprawl between 2005 and 2010, after which the expansion rate began to decline. (2) The rapid urban sprawl in the YRD region first clustered around the southern Jiangsu cities, such as Suzhou, Wuxi, and Changzhou, and Shanghai and then shifted to the outer ring of the Zhejiang and Anhui regions. The results of this study are consistent with the first finding, and some differences with the second finding were found.
In contrast to existing studies, this study did not consider urban sprawl only from a single dimension of urban construction land but utilized a mechanical equilibrium model that integrated the three dimensions of socioeconomic development, urban spatial expansion, and urban function improvement. Therefore, the first difference between the results of this study and previous studies is that the rapid urban sprawl areas were first distributed in a multi-centered form throughout Jiangsu and were not concentrated only in the southern part of Jiangsu. The reason for this is that some of the northern areas of Jiangsu had a slower rate of urban land expansion compared with southern Jiangsu, but during the expansion process, socioeconomic and urban infrastructure development is lacking, which is also identified for urban sprawl areas. The second difference is that after the rapid urban sprawl to the outer circles of Zhejiang and Anhui (after 2015), the urban sprawl in Zhejiang started to weaken instead of having continuous high-speed urban sprawl because after 2015, although the growth rate of urban construction land in the Zhejiang region was still fast, the rate of socioeconomic and urban function development could match it, and the model of this study did not identify the region as urban sprawl. The above two differences reflect the better accuracy and sensitivity of the proposed model in this study.
6.2. Implications for Urban Sprawl Control in the YRD Region
Precise identification of inefficient sprawl and targeted management strategies are necessary for the coordinated development of urban agglomeration. On the basis of the identified urban expansion areas in the YRD region and their spatial and temporal evolution characteristics, we classified the types of urban expansion and management in the YRD region as follows:
- (1)
- Inefficient urban sprawl continuous growth areas
Shanghai and Anhui Province were dominant. Shanghai has a developed socioeconomy, a continuous concentration of population and industry, and relatively large pressure for urban development and construction. Future development focuses on tapping the potential of stock construction land, improving the efficiency of new construction land, cross-administrative enclave construction and function sharing, etc. Anhui Province is less socioeconomically developed and still has much urbanization potential at this stage. Land use will continue to evolve for a period in the future, and new construction land will be the main focus, with attention to functional zoning, adherence to the ecological protection red line, and arable land protection in the development process. For continuous growth areas, on the one hand, fast-growing urban sprawl can be curbed through an efficient transportation system that promotes the development and strategic densification of mixed-use nodes and corridors linked to public transportation. On the other hand, a more scientific, precise, and rigid delineation of urban development boundaries, with comprehensive consideration of such issues as growth pressure, financial strength, land tenure, capacity of management, capacity of infrastructure, and future supply, can promote rational urban development and reduce the occurrence of inefficient sprawl.
- (2)
- Inefficient urban sprawl weakening areas
Such areas were mainly in Jiangsu Province. According to the analysis results, the trend of urban expansion in Jiangsu Province continues to slow down, and attention must be paid to monitoring and controlling the urban expansion in local areas. The socioeconomic development and high urbanization rate in southern Jiangsu Province have limited space for urban construction land expansion. In the future, attention should be paid to the additional ecological and environmental pressure of industrial and population gathering, such as resource consumption and environmental pollution. The central and northern regions of Jiangsu Province are facing the relative pressure of socioeconomic development and urbanization. Thus, they still have a certain phenomenon of urban expansion occurring. The results of the kernel density and hotspot analysis also indicate this, and attention should be paid to the efficient use of land in the future. For the continuously weakening zone, the goal should be to achieve a sustainable and compact urban development pattern in the future. It is necessary to promote urban renewal and regeneration, which can improve the efficiency of existing urban land use. At the same time, urban infrastructure needs to be strengthened to improve the coverage and quality of urban transportation and public service facilities. Diversified housing and shared community building should be encouraged to relieve population pressure in limited urban spaces. Strengthening government regulation and management of ecological environment and cultural heritage protection is also very important to emphasize.
- (3)
- Inefficient urban sprawl monitoring area
Such areas were mainly in Zhejiang Province. The phenomenon of urban expansion in Zhejiang Province is relatively weak. First, it is socioeconomically developed, and urbanization pressure is not high. In addition, Zhejiang Province has more mountains, and the expansion of urban construction land is relatively limited by the topography. For monitoring areas, such areas should establish a dynamic monitoring and management mechanism while balancing the relationship between development and ecological protection. In the process of urban development, it is important to emphasize the degree of synergy between “population-land” as well as “economy-land” to promote high-quality urban development. On this basis, it is possible that innovative modes of urban development, such as green infrastructure development and new tourism development, can be explored by utilizing natural landscape conditions.
6.3. Applicability and Improvement of the Proposed Model
- (1)
- Applicability of the proposed model
The proposed mechanical equilibrium model was developed on the basis of the socioeconomic, urban functional, and urban spatial dimensions, where urban expansion is the most important dimension. The model is applicable when urban expansion is evident, which fits the cases in most developing countries. For developed countries, urban expansion may not be as evident as in developing countries, but urban sprawl is always there [36]. Given that the model method and data of this study were calculated at the spatial grid scale, it has excellent sensitivity to data changes. Therefore, this model can be applied to the cases of both developing and developed countries as long as urban expansion occurs.
In terms of different urban development patterns, urban sprawl in this study was identified on the basis of the premise of the occurrence of urban land expansion. Under this premise, only when urban land expanded faster than socioeconomic development and urban function was urban sprawl identified. Otherwise, the application of this model should be conducted with care. For example, rust zones are defined as an area that flourished in the past due to industrial development and then declined due to deindustrialization, population loss, and economic depression [47]. When the urban rust zones are consolidated, if land use is adjusted and construction land is increased, then the model can be applied. If the spatial expansion of construction land does not bring reciprocal socioeconomic and functional benefits, then land use consolidation is inefficient. In summary, this model is sensitive and applicable in urban development patterns when urban land expansion exists. However, for some areas of urban shrinking, this model is not detectable because cities that have expanded in such areas are usually demolished, rehabilitated, renewed, or adjusted more slowly and always remain as built-up land in space without a growth trend. Simultaneously, the socioeconomic and urban functions are gradually degraded, which is hardly reflected by the mechanical equilibrium model.
- (2)
- Priorities of the proposed model in future studies
The proposed model mainly identifies urban sprawl from three dimensions, including socioeconomic development, urban spatial expansion, and urban function improvement. Some other dimensions, such as public facilities, transportation, and industries [48,49], were excluded from this study. The three dimensions were chosen for two reasons. First, we conducted the pre-experiment, and the results showed good performance in identifying urban sprawl with the proposed model based on the three selected dimensions. Second, whether certain dimensions and indicators can measure urban sprawl remains controversial. In some studies, some indicators are the basis for measuring urban sprawl, yet in other studies, they are the drivers of urban sprawl [50,51]. In future research, we will compare and combine different dimensions and indicators to form a model for measuring urban expansion and evaluate the performance of the model through model identification accuracy to select more appropriate dimensions and indicators.
Another part of this model that could be improved is the refined analysis of the identification results. The model originally subdivided urban sprawl into seven categories, and this study only focused on the urban space expansion-dominated patterns, whereas the other six categories were all considered effective expansion types. However, the driving factors and influencing mechanisms of these six types of expansion patterns have differences. We will explore the similarities and differences of the various identification results in depth separately in the future.
7. Conclusions
This study endeavored to establish a three-dimensional model for discerning urban sprawl, utilizing the mechanical equilibrium model by using the YRD region as an example. The findings demonstrate a proficient analysis of the urban sprawl areas in the YRD region, thereby facilitating targeted strategies for spatial control of urban sprawl.
The urban sprawl measurement model constructed in this study takes into account the interrelationships among the three dimensions of socioeconomic development, urban spatial expansion, and urban function improvement. Particularly in densely populated areas where urban sprawl is pronounced, the identification of such sprawl should not only focus on land use changes but also consider the necessary space required for urban development. This entails a thorough assessment of the congruence between land use changes and the corresponding social, economic, and urban service functions. As urbanization progresses into the mid-to-late stages, the magnitude of land use changes tends to diminish, emphasizing the significance of harmonizing multidimensional factors during urban development. In this context, the proposed model exhibited good precision and sensitivity.
Under different socioeconomic backgrounds, the development goals of cities may vary, such as focusing on economic construction, population control, ecological environmental objectives, or pursuing comprehensive and coordinated development. In distinct developmental scenarios, the definition of effective urban development indicators and dimensions differs, with certain dimensions potentially carrying higher weights. In such cases, the mechanical equilibrium model remains applicable, as the resultant equilibrium forces can reflect the integrated relationships among various dimensions, and the tilt angle is employed to analyze the dominant dimensions.
In summary, the mechanical equilibrium model proposed in this study, based on the dimensions of socioeconomic development, urban spatial expansion, and urban function improvement, is a model designed to identify urban sprawl by comprehensively considering multiple dimensions of urban development. This model can effectively and accurately identify urban sprawl on a large scale, exhibiting high precision and sensitivity and thus providing valuable decision support for urban sprawl control.
Author Contributions
Data curation, formal analysis, investigation, methodology, software, validation, visualization, and writing—original draft, Y.J.; investigation and writing—original draft, Y.Z.; conceptualization, funding acquisition, methodology, project administration, resources, supervision, and writing—review and editing, Y.T. All authors have read and agreed to the published version of the manuscript.
Funding
This study was supported by the National Natural Science Foundation of China (Grant 41901203) and Collaborative Innovation Center for New Urbanization and Social Governance.
Data Availability Statement
No new data were created or analyzed in this study. Data sharing is not applicable to this article.
Conflicts of Interest
The authors declare no conflict of interest.
References
- Jarah, S.; Zhou, B.; Abdullah, R.; Lu, Y.; Yu, W. Urbanization and Urban Sprawl Issues in City Structure: A Case of the Sulaymaniah Iraqi Kurdistan Region. Sustainability 2019, 11, 485. [Google Scholar] [CrossRef]
- Fang, C.; Yu, D. Urban agglomeration: An evolving concept of an emerging phenomenon. Landsc. Urban Plan. 2017, 162, 126–136. [Google Scholar] [CrossRef]
- Tian, Y.; Mao, Q. The effect of regional integration on urban sprawl in urban agglomeration areas: A case study of the Yangtze River Delta, China. Habitat Int. 2022, 130, 102695. [Google Scholar] [CrossRef]
- Tian, Y. Mutualistic Pattern of Intra-Urban Agglomeration and Impact Analysis: A Case Study of 11 Urban Agglomerations of Mainland China. ISPRS Int. J. Geo-Inf. 2020, 9, 565. [Google Scholar] [CrossRef]
- Wang, J.; Ma, H.; Jiang, M.; Zang, J. Urban Sprawl, Land Resource Mismatch and Agglomeration Economy. Explor. Econ. Issues 2021, 10, 62–73. [Google Scholar]
- Zhang, J.; Lou, C.; Xiu, C. Spatial Patterns of Local Government Competition–An Empirical Analysis of the Spread of Urban Agglomerations in the Yangtze River Delta. Urban. Reg. Dev. 2020, 5, 85–93. [Google Scholar]
- Hu, K.; Lin, M.; Lin, T.; Ye, H.; Zhang, G.; Sui, J.; Chen, T.; Yao, X.; Lu, X. Spatial Identification and Quantitative Assessment of Urban Sprawl and Ecological Conservation Conflicts in Rapid Urbanization. Acta Ecol. Sin. 2022, 42, 462–473. [Google Scholar]
- Sarkodie, S.A.; Owusu, P.A.; Leirvik, T. Global effect of urban sprawl, industrialization, trade and economic development on carbon dioxide emissions. Environ. Res. Lett. 2020, 15, 034049. [Google Scholar] [CrossRef]
- Song, X.; Feng, Q.; Xia, F.; Li, X.; Scheffran, J. Impacts of changing urban land-use structure on sustainable city growth in China: A population-density dynamics perspective. Habitat Int. 2021, 107, 102296. [Google Scholar] [CrossRef]
- Noor, M.N.; Rosni, N.A.; Hashim, M.; Abdullah, A. Developing land use geospatial indices (LUGI) for sprawl measurement in alpha cities: Case study of Kuala Lumpur, Malaysia. Cities 2018, 82, 127–140. [Google Scholar] [CrossRef]
- Zhang, Y.; Long, H.; Tu, S.; Ge, D.; Ma, L.; Wang, L. Spatial identification of land use functions and their tradeoffs/synergies in China: Implications for sustainable land management. Ecol. Indic. 2019, 107, 105550. [Google Scholar] [CrossRef]
- Kang, Q.; Guo, Q.; Ding, Y.; Zhang, Y. Analysis of the synergy/trade-off relationship of the “three living” functions in Shanxi Province. J. Nat. Resour. 2021, 36, 1195–1207. [Google Scholar]
- Rusk, D. Cities without Suburbs; Woodrow Wilson Center Press: Washington, DC, USA, 1993. [Google Scholar]
- Fei-Xue, L.I.; Man-Chun, L.I.; Yong-Xue, L.I.; Jian, L.I.N.; Zhen-Jie, C.H.N. Urban growth in Nanjing since 1949. J. Nat. Resour. 2007, 22, 524–535. [Google Scholar]
- Hortas-Rico, M. Urban sprawl and municipal budgets in Spain: A dynamic panel data analysis. Pap. Reg. Sci. 2014, 93, 843–864. [Google Scholar] [CrossRef]
- Lopez, R.; Hynes, H.P. Sprawl in the 1990s Measurement, Distribution, and Trends. Urban Aff. Rev. 2003, 38, 325–355. [Google Scholar] [CrossRef]
- Sahana, M.; Hong, H.; Sajjad, H. Analyzing urban spatial patterns and trend of urban growth using urban sprawl matrix: A study on Kolkata urban agglomeration, India. Sci. Total Env. 2018, 628–629, 1557–1566. [Google Scholar] [CrossRef]
- Abdullahi, S.; Pradhan, B.; Mojaddadi, H. City Compactness: Assessing the Influence of the Growth of Residential Land Use. J. Urban Technol. 2017, 25, 21–46. [Google Scholar] [CrossRef]
- Das Chatterjee, N.; Chatterjee, S.; Khan, A. Spatial modeling of urban sprawl around Greater Bhubaneswar city, India. Model. Earth Syst. Environ. 2015, 2, 1–21. [Google Scholar] [CrossRef]
- Lin, M.; Chen, Y.; Shi, Y.; Jiang, J.; Wang, L. Analysis on the difference of construction land expansion among the inner districts of big city and its cause- A case study of Changsha city. Econ. Geogr. 2006, 5, 836–841+845. [Google Scholar]
- Taiwo, O.J. Modelling the spatiotemporal patterns of urban sprawl in Ibadan metropolis between 1984 and 2013 in Nigeria. Model. Earth Syst. Environ. 2021, 8, 121–140. [Google Scholar] [CrossRef]
- Tsai, Y.-H. Quantifying Urban Form: Compactness versus ‘Sprawl’. Urban Study 2005, 42, 141–161. [Google Scholar] [CrossRef]
- Fallah, B.N.; Partridge, M.D.; Olfert, M.R. Urban sprawl and productivity: Evidence from US metropolitan areas. Pap. Reg. Sci. 2011, 90, 451–472. [Google Scholar] [CrossRef]
- Kowalczyk, C.; Kil, J.; Kurowska, K. Dynamics of development of the largest cities–Evidence from Poland. Cities 2019, 89, 26–34. [Google Scholar] [CrossRef]
- Bhatta, B. Analysis of Urban Growth and Sprawl from Remote Sensing Data; Springer Science & Business Media: Berlin/Heidelberg, Germany, 2010. [Google Scholar]
- Xie, X.; Kang, H.; Behnisch, M.; Baildon, M.; Krüger, T. To What Extent Can the Green Belts Prevent Urban Sprawl?—A Comparative Study of Frankfurt am Main, London and Seoul. Sustainability 2020, 12, 679. [Google Scholar] [CrossRef]
- Wang, J.; Lin, Y.; Glendinning, A.; Xu, Y. Land-use changes and land policies evolution in China’s urbanization processes. Land Use Policy 2018, 75, 375–387. [Google Scholar] [CrossRef]
- Qian, J.; Peng, Y.; Luo, C.; Wu, C.; Du, Q. Urban Land Expansion and Sustainable Land Use Policy in Shenzhen: A Case Study of China’s Rapid Urbanization. Sustainability 2016, 8, 16. [Google Scholar] [CrossRef]
- Lum, S.K.; Sim, L.L.; Malone-Lee, L.C. Market-led policy measures for urban redevelopment in Singapore. Land Use Policy 2004, 21, 1–19. [Google Scholar] [CrossRef]
- Nuissl, H.; Schroeter-Schlaack, C. On the economic approach to the containment of land consumption. Environ. Sci. Policy 2009, 12, 270–280. [Google Scholar] [CrossRef]
- Leong, C.K. Special economic zones and growth in China and India: An empirical investigation. Int. Econ. Econ. Policy 2013, 10, 549–567. [Google Scholar] [CrossRef]
- Kort, M.; Klijn, E.H. Public–private partnerships in urban regeneration projects: Organizational form or managerial capacity? Public Adm. Rev. 2011, 71, 618–626. [Google Scholar] [CrossRef]
- Ćetković, S.; Buzogány, A.J.C.P. Varieties of capitalism and clean energy transitions in the European Union: When renewable energy hits different economic logics. Clim. Policy 2016, 16, 642–657. [Google Scholar] [CrossRef]
- Chang, C.-T.; Lee, H.-C. Taiwan’s renewable energy strategy and energy-intensive industrial policy. Renew. Sustain. Energy Rev. 2016, 64, 456–465. [Google Scholar] [CrossRef]
- Keuffer, N. Local Self-Government and the Choice for Local Governance Arrangements in Nine Swiss Municipal Tasks. In The Future of Local Self-Government: European Trends in Autonomy, Innovations and Central-Local Relations; Bergström, T., Franzke, J., Kuhlmann, S., Wayenberg, E., Eds.; Springer International Publishing: Cham, Switzerland, 2021; pp. 67–81. [Google Scholar]
- Fertner, C.; Jørgensen, G.; Sick Nielsen, T.A.; Bernhard Nilsson, K.S. Urban sprawl and growth management–Drivers, impacts and responses in selected European and US cities. Future Cities Environ. 2016, 2, 9. [Google Scholar] [CrossRef]
- Cartier, C. A political economy of rank: The territorial administrative hierarchy and leadership mobility in urban China. J. Contemp. China 2016, 25, 529–546. [Google Scholar] [CrossRef]
- Yang, Y.; Zhang, L.; Ye, Y.; Wang, Z. Curbing Sprawl with Development-limiting Boundaries in Urban China: A Review of Literature. J. Plan. Lit. 2019, 35, 25–40. [Google Scholar] [CrossRef]
- Zhang, D.; Wang, X.; Qu, L.; Li, S.; Lin, Y.; Yao, R.; Zhou, X.; Li, J. Land use/cover predictions incorporating ecological security for the Yangtze River Delta region, China. Ecol. Indic. 2020, 119, 106841. [Google Scholar] [CrossRef]
- Lin, M.; Lin, T.; Sun, C.; Jones, L.; Sui, J.; Zhao, Y.; Liu, J.; Xing, L.; Ye, H.; Zhang, G.; et al. Using the Eco-Erosion Index to assess regional ecological stress due to urbanization–A case study in the Yangtze River Delta urban agglomeration. Ecol. Indic. 2020, 111, 106028. [Google Scholar] [CrossRef]
- Liu, H.; Jiang, D.; Yang, X.; Luo, C. Spatialization Approach to 1 km Grid GDP Supported by Remote Sensing. J. Geo-Inf. Sci. 2005, 7, 120–123. [Google Scholar]
- Xia, C.; Li, Y.; Zeng, C.; Zhang, B.; Zheng, L.; Chen, Y.; Shao, J. Transformation of sloping land use in the Three Gorges reservoir area and its socio-economic-ecological impact. J. Ecol. 2023, 43, 2688–2702. [Google Scholar]
- Dou, W.; Wang, C.; Xue, M.; Wang, Z. Research on the Identification and Evaluation of Urban Land Use Functions Based on POI Data–Taking the five districts in Jinan as an example. World Reg. Stud. 2020, 29, 804–813. [Google Scholar]
- Huang, H.; Long, J.; Wu, N.; Wei, E. Delineation and Identification of Urban Functional Areas Based on POI Big Data–A Case Study of Nanning City Central District. Sci. Technol. Inf. 2021, 19, 1–5. [Google Scholar]
- Yu, Z.; Chen, L.; Li, L.; Zhang, T.; Yuan, L.; Liu, R.; Wang, Z.; Zang, J.; Shi, S. Spatiotemporal Characterization of the Urban Expansion Patterns in the Yangtze River Delta Region. Remote Sens. 2021, 13, 4484. [Google Scholar] [CrossRef]
- Qiao, W.; Huang, X. Spatial and Temporal Patterns of Urban Land Expansion in the YRD Urban Agglomeration and Analysis of the Driving Forces. Econ. Geogr. 2021, 11, 1262. [Google Scholar]
- Xie, L.; Yang, Z.; Cai, J.; Cheng, Z.; Wen, T.; Song, T. Harbin: A rust belt city revival from its strategic position. Cities 2016, 58, 26–38. [Google Scholar] [CrossRef]
- Tong, L.; Hu, S.; Frazier, A.E. Hierarchically measuring urban expansion in fast urbanizing regions using multi-dimensional metrics: A case of Wuhan metropolis, China. Habitat Int. 2019, 94, 102070. [Google Scholar] [CrossRef]
- Rijal, S.; Rimal, B.; Stork, N.; Sharma, H.P. Quantifying the drivers of urban expansion in Nepal. Environ. Monit. Assess. 2020, 192, 633. [Google Scholar] [CrossRef]
- Maity, B.; Mallick, S.K.; Rudra, S. Integration of urban expansion with hybrid road transport network development within Haldia Municipality, West Bengal. Egypt. J. Remote Sens. Space Sci. 2021, 24, 471–483. [Google Scholar] [CrossRef]
- Nasar-u-Minallah, M.; Zia, S.; Rahman, A.-U.; Riaz, O. Spatio-Temporal Analysis of Urban Expansion and Future Growth Patterns of Lahore, Pakistan. Geogr. Environ. Sustain. 2021, 14, 41–53. [Google Scholar] [CrossRef]


Disclaimer/Publisher’s Note: The statements, opinions and data contained in all publications are solely those of the individual author(s) and contributor(s) and not of MDPI and/or the editor(s). MDPI and/or the editor(s) disclaim responsibility for any injury to people or property resulting from any ideas, methods, instructions or products referred to in the content. |
© 2023 by the authors. Licensee MDPI, Basel, Switzerland. This article is an open access article distributed under the terms and conditions of the Creative Commons Attribution (CC BY) license (https://creativecommons.org/licenses/by/4.0/).