Abstract
Intensive land use assessment is a key research topic in urban land use, and most of the existing studies focus on macro-level assessment. There is a lack of research on the micro-level assessment of intensive urban land use, especially at the parcel level. The objective of this research is to propose a method for the parcel-based evaluation of urban commercial land intensification. The study uses a multidimensional evaluation framework and index system, comprehensive evaluation, and spatially exploratory analysis of urban commercial intensive land use based on “building intensity, use efficiency, compatibility, and diversity”. The study finds that (1) the average value of intensive use of urban commercial land is 13.01, the standard deviation is 5.11, and the median value is 13, which generally indicate a medium level. (2) The degree of intensive use of commercial land has obvious characteristics of a high, medium, and low level. The study shows that when evaluating the degree of land use intensification at the parcel level, it is also necessary to consider the influence of the compatibility and diversity of external land use. The research results can provide a basis for spatial planning and the optimal design of urban land resources to improve urban vitality.
1. Introduction
Intensive urban land use is an important strategy to ensure sustainable urban development and is an important component of the United Nations Sustainable Development Goals (SDGs) [1,2,3]. As one of the non-renewable resources, land in urban centers is under increasing pressure in terms of area, transport, and landscape. Only with a higher level of intensive land use is it possible to fulfill its core service function [4]. Therefore, urban centers place the greatest demands on high-density land use. However, during urban development, extensive land use patterns have led to urban sprawl [5]. With the acceleration of industrialization and urbanization, the contradiction between urban expansion and land use has intensified, leading to smart growth [6,7,8], compact development [9,10], infill development [11,12], multifunction intensive land use [13], and other ideas for sustainable development and modern urban planning [14,15,16,17]. Intensive urban land use is considered a key initiative to curb urban sprawl and promote sustainable urban development [18]. In addition, the extent of intensive urban land use has a significant impact on urban vitality [19]. The issue of intensive urban land use has gained increasing attention among scholars and practitioners [20].
Commercial land is the building land with the highest land price, the most obvious gain of extreme difference, and the most significant regional difference, and its intensive use has a great impact on the overall land use of the city [21]. As the population concentrates in cities, irrational land use regulations and planning lead to urban sprawl. Within cities, problems such as idleness and the inefficient use of commercial space are particularly prevalent. This has not only led to ineffective investment in urban public facilities and increased the burden on urban businesses [22]; the loss of urban vitality has also led to the great waste of natural resources and seriously affected the sustainable development of cities [23]. Thus, it is crucial to consider how to improve the level of the intensive use of urban commercial land scientifically and efficiently [24,25].
The evaluation of the intensive use of commercial areas is the basis of improving land use planning and optimizing the design of commercial areas. In recent years, some scholars have proposed diversified use characterized by three-dimensional and four-dimensional spatial use to achieve the intensification of spatial use, which has introduced new elements into the meaning of intensive urban land use [26]. From an assessment scale perspective, such assessment generally includes macro assessment (comprehensive assessment of national, regional, or urban land use intensification) [24,27,28,29,30], mid-range assessment (assessment of actual land use classification or thematic assessment) [31,32,33], and micro assessment (assessment of commercial land) [34,35]. The evaluation of land use intensification mainly consists of the evaluation of the current situation, policy discussion, and analysis of the factors influencing urban land use. At the macro level, studies have focused on the analysis and evaluation of urban land use policies, such as the feasibility analysis of urban intensification policies in England [36] and the evaluation of the compactness of urban development in the UK [37]. Other studies focus on examining land use intensification in a particular city or region, such as Singapore’s Jurong Island [38], Tehran, Iran [39], Hamburg, Germany [40], Washtenaw, Michigan, USA [41], Gangnam, Seoul [42], and Hong Kong, China [26]. It is clear that research at the macro and meso levels has been very productive. Only a few studies have examined the evaluation of land use intensification from the micro perspective [34]. The studies on land use intensification at specific sites have analyzed horizontal and vertical forms regarding the input and output statuses of each floor to obtain a comprehensive overall picture of intensification [39]. It can be seen that there is still a lack of research evaluating the intensive use of urban land at the microscopic level. In particular, a systematic evaluation system based on the evaluation of intensive urban land use at the parcel level has not yet been developed and applied in practice.
The issue of the intensification of land use in cities is a central topic in urban research and management [43,44,45]. In recent years, commercial land use has gradually become the focus in evaluating land-intensive uses in cities [21]. However, most of the existing studies have focused on the evaluation of land use intensification at the city level. Because the characteristics of the sparing and intensive use of different spatial scales and different types of land can vary greatly, a single land use policy cannot be used to promote the intensive use of urban land [25,46]. The results of existing studies cannot be used to guide the behavior of specific parcel-based urban commercial land use at the micro level or city level [47]. Rather, the study of intensive commercial land use at the parcel level seeks to analyze and evaluate the use of each individual parcel. This can not only provide fundamental data for the design of urban business districts but also insights for the preparation of spatial planning as well as the optimization of the arrangement of urban land resources to increase urban vitality [19,48,49]. In addition, studies have found significant externalities of commercial land use [50]. The mixed use of different types of commercial land can have both positive and negative effects on urban vitality. When evaluating intensive commercial land use, it is important to consider not only the extent of per capita use but also the externalities of commercial land use. However, the impacts of the externalities of commercial land use have not been considered in previous assessment frameworks.
As one of the “1 + 7” cities in the Shanghai metropolitan area (Shanghai, Wuxi, Suzhou, Nantong, Ningbo, Jiaxing, Huzhou, Zhoushan) in the regional development pattern of the Yangtze River Delta, the city of Wuxi has a thriving industry and vibrant economy, accounting for 5.0 percent of the land area and 4.7 percent of the population, with a total economic output of 1.27 percent of the country. After Shanghai, Suzhou, Nanjing, and Hangzhou, Wuxi is the fifth city in the Yangtze River Delta with an economic output of over one trillion dollars. Wuxi has a high proportion of commercial land in the city center, and the use of commercial land has a significant impact on the intensive land use in the city. In addition, Wuxi has long faced resource scarcity, high-intensity land development, and a low ecological capacity [51]. Therefore, a scientific evaluation of the extent of intensive urban commercial land use in Wuxi can support the optimization of the urban construction land structure and the promotion of the new development of land with low utility value. It also serves as a reference for other highly urbanized areas to conduct parcel-based assessments of intensive commercial land use.
The objective of this research is to propose a method for the parcel-based evaluation of urban commercial land intensification. The result of this evaluation can provide the government and planners with a scientific basis for the optimal allocation and management of urban commercial land. Compared with previous studies, the contribution of this work lies in the following aspects: (1) the systematic discussion of the meaning and evaluation dimensions of the intensive use of urban commercial land; (2) the construction of a multi-dimensional evaluation framework and indicator system for the intensive use of urban commercial land based on construction intensity–use efficiency–sustainability–diversity.
2. Conceptual Framework and Methodology
2.1. Parcel-Based Index System for Evaluation of the Intensification of Urban Commercial Areas
In contemporary theories of urban planning, early urban planning concepts mainly emphasize function and the pursuit of an ideal urban condition [46]. With the rapid development of global urbanization and the use of a large amount of open space, the intensive use of urban land has become more important [52,53]. Planners promote the intensification of urban land use through zoning and measures such as use control. However, because urban land use functions are composite, it is not possible to increase the degree of intensive land use by simply increasing inputs [54]. The impact of urban land use externalities has been highlighted by planning scholars [50]. Commercial land use is particularly obvious. The agglomeration of commercial land uses can lead to complementary commercial functions, thereby increasing urban vitality. In contrast, the mutual exclusion of commercial forms can lead to the inefficient use of commercial land [55]. Academia has not yet developed a unified understanding of the economical and intensive uses of commercial land. This has also led to a lack of precise guidelines in planning practice to promote the intensive use of commercial land.
Based on the basic characteristics of agricultural land, the law of diminishing returns of land shows that the input and output of land do not always have a positive relationship, and, for parcels in different spatial locations in cities, the degree of intensive use does not increase with the increase in the input of productive resources [43]. For a parcel of land, there are many factors that characterize intensive use, such as the comprehensive floor area ratio, the building density, the occupancy rate of commercial properties, the degree of functional compatibility between the use of the land and surrounding parcels, and the diversity of commercial uses. As one of the forms of building land, commercial land plays an important role in the social and economic development of cities [21]. The intensive use of commercial land is an organic integration that considers the intensity of building use in the physical dimension, the input–output efficiency in the economic dimension, and the diversity and compatibility of commercial land use in terms of types of commercial activity [4]. Therefore, this study considers the factors affecting the effectiveness of the intensive use of urban commercial land from multiple dimensions and constructs a multidimensional evaluation framework and index system for the intensive use of urban commercial land based on “construction intensity, utilization benefits, compatibility, diversity” (Figure 1).
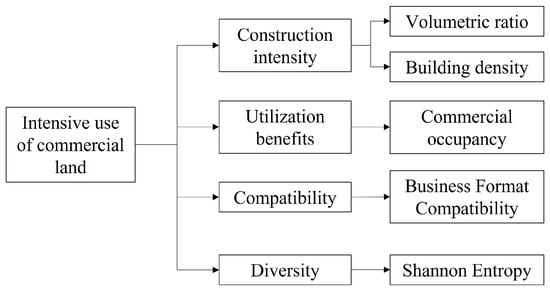
Figure 1.
Evaluation framework.
2.1.1. Construction Intensity
For each type of land use within its possible intensity of use threshold, the optimal intensity of land use increases with the average productivity of society and the level of urban development, which means that the difference in land use intensity criteria reflects the difference in the level of intensive land use [35]. In essence, the floor area ratio of large functional buildings represents the degree of spatial concentration of urban functions and indicates the dominant development direction of urban functions in a city center [56]. Based on the results of existing studies, the combined floor area ratio and building density are chosen to characterize the building intensity of an individual commercial area.
denotes the combined floor area ratio, represents the total building area within the commercial land parcel, represents the parcel size of the land, denotes the building density, and represents the area of the building footprint within the parcel of commercial land.
2.1.2. Utilization Efficiency
Utilization efficiency can reflect the degree of land use intensification, and the higher the utilization efficiency per unit area, the higher the degree of land use intensification [26]. Therefore, the land use efficiency of individual commercial sites is also an important component of land use intensification. For commercial land, the degree of land use efficiency is characterized in various ways [21]. It is true that most studies have used the land output per unit area as a measure of the degree of intensive use of commercial land. However, due to the great differences in the degree of development and industrial structures, it is not possible to directly measure the degree of intensive use of commercial land in different cities using the economic output per unit area. For different cities, the degree of intensive land use of different properties can be objectively read by whether the property is vacant or not [46]. For this reason, this study chooses the occupancy rate of commercial properties as an indicator of the efficiency of commercial land use to objectively assess the degree of intensive use of commercial space.
The occupancy rate (RR) represents the occupancy rate of commercial real estate, which is mainly determined by field study statistics. represents the area of leased commercial properties, and represents the total area of commercial properties.
2.1.3. Compatibility
Most of the existing assessments of land use intensification focus on the indicators of input–output aspects of land use. These assessments cannot effectively show the interdependent influence relationships between different land uses. Land use is characterized by significant externalities, and each commercial enterprise has a significant influence on the choice of business type of adjacent commercial land [57]. For this reason, compatibility among land parcels must be considered when assessing the effectiveness of land use intensification at the micro level, particularly on a parcel-by-parcel basis [4]. This study mainly considers the characteristics of externality arising from the process of commercial land use and constructs indices to evaluate the compatibility of commercial land use by relying on the measure of compatibility of mixed land use [50].
The commercial land use compatibility index (COM) is expressed as the ratio between the actual compatibility value and its theoretical maximum value among parcels in the area of influence.
where is the compatibility relationship between parcels i and j; n is the number of parcels within the influence of parcel I, and 1 is the maximum score value of parcel incompatibility.
2.1.4. Diversity
The diversity index is mainly borrowed from the landscape index measure in landscape ecology, which is based on information theory and used to measure the complexity of the structural composition of a system [58]. For urban commercial land use, complex land use is a common form of land use. In order to accurately represent the degree of parcel-based intensification of commercial land use, the degree of diversity of commercial land use must be included in the evaluation index system. There are many measures of diversity, generally based on measures from landscape ecology, such as the richness index, the Shannon entropy index, the Simpson index, etc. From the perspective of commercial land use characteristics, this diversity index should, on the one hand, reflect the richness characteristics of the land use or functional types and, on the other hand, consider the area attributes of land use, i.e., reflect the unit characteristics among the different types [4]. With this in mind, we choose the Shannon entropy index as the measure because it can effectively account for both richness and uniformity characteristics, and thus better meets the requirements in characterizing land use diversity in commercial land use.
Thus, the indicators of commercial land use diversity based on the Shannon entropy index are as follows.
where is the total number of land use or function types; is the probability of occurrence of type i (usually estimated as the proportion of the number of raster or image elements of this type). For a given n, the DIV indicator reaches its maximum value () when the proportion of the area for each type of land use or function is the same (i.e., the uniformity is maximum, ).
2.1.5. Comprehensive Evaluation
After establishing the measurement index system for conservation and utilization, it is necessary to standardize these indicators because the value ranges and units of each indicator are not uniform. In this study, the index values are standardized to the interval [0, 1] using the extreme difference standardization method [59].
After the standardization process is completed, these individual indicators must be aggregated into a comprehensive index, and, in this process, the appropriate distribution of weights is an important component. In previous studies, there are usually two methods used to determine the weights: the subjective assignment method and the objective assignment method. The former is highly subjective and the results obtained are easily influenced by the level of knowledge of decision makers, while the latter is a horizontal comparison between indicators and cannot reflect the degree of importance of different indicator dimensions [21]. Considering the respective advantages and disadvantages of these two types of methods, the authors opt for a combination of both, namely expert judgment and gray correlation, to determine the weights. This can compensate for the shortcomings of the above subjective and objective methods by fully utilizing the subjective information of the experts’ empirical judgment results, while using mathematical models to objectively calculate the indicator weights [4]. The individual calculation steps are as follows.
- (1)
- Judgement of weights by experts based on experience. There are m experts who make empirical judgements on the weights of n indicators at the same time, thus forming the empirical judgement data column for the indicator weights.
- (2)
- Determine the reference sequence. The largest weight value from X is selected as the “common” reference weight value, thus forming the reference data column .
- (3)
- Find the distance between each indicator series and the reference data column .
- (4)
- Find the weights of each indicator and perform the normalization operation.where denotes the reference weight value of the th indicator in the reference series, denotes the empirical judgment of the th expert on the weight of the kth indicator, denotes the distance between the ith indicator series and the reference series, is the weight value of the th indicator, and is the normalized indicator weight value.
After the above process, the weight values of each individual indicator can be obtained. Afterwards, the individual indicators are weighted and summed according to the following formula to obtain a comprehensive indicator value for the intensive use of urban commercial land based on the parcel.
where , , , , and are the individual indicators for the evaluation of intensive urban commercial land use; , , , , and are the weights of each individual indicator, respectively; and refers to the integrated indicator value of intensive urban commercial land use based on the land parcel.
2.2. Exploratory Spatial Data Analysis (ESDA)
The ESDA method [60] is used to analyze the spatial agglomeration effect of commercial land intensification created by the spatial distribution characteristics of commercial land use behavior and the spatial spillover effects of the degree of commercial land intensification. The global spatial autocorrelation uses the global Moran’s I index to test whether spatial dependence is positive in the distribution of spatial elements. Moran’s I is defined as follows:
where and are the observed values in parcel i and j, respectively; is the mean of the observed values in the parcels; refers to the binary spatial weight matrix, and n is the total number of observed spatial units. For this analysis, the radius used for clustering is 3355 m, which is produced by the ArcGIS software platform.
Local Indicator of Spatial Association (LISA) reflects the extent to which commercial land parcels differ from or are consistent with their neighboring spatial units in terms of intensive use. The LISA model is expressed as follows:
where and are the normalized forms of and . A positive indicates significant local clusters, where the similarity value in the local space tends to agglomerate (high–high or low–low clusters). A negative indicates significant local spatial outliers, where the similar value of the local space presents a discrete distribution (high–low or low–high clusters).
2.3. Study Area
The city of Wuxi is located in the southeastern part of Jiangsu Province and belongs to the corridor between the rivers and lakes of the Yangtze River Delta. The geographical coordinates of the city are longitude 119°33′~120°38′ east and latitude 31°07′~32°02′ north. To the east is Suzhou, 128 km from Shanghai; to the south and southwest is the border with Zhejiang Province and Anhui Province; to the west is Changzhou, 183 km from Nanjing; to the north is the Yangtze River; on the other side of the river is the city of Jingjiang, which belongs to Taizhou City. The total area of the city is 4627.47 square kilometers. The study area is located in the central urban area of Wuxi, including Liangxi District, Huishan District (Yanqiao Street and Chang’an Street), Xishan District (Dongting Street and Dongdongtang City), Xinwu District (Jiangxi Street, Wangzhuang Street, and Meicun City), and Binhu District (Haili Street, Liyuan Street, Lihu Street, Rongxiang Street, and Taihu Street), with an area of 368.24 km2 (Figure 2).
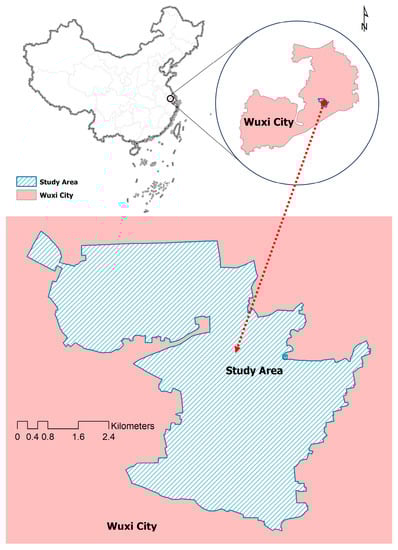
Figure 2.
Study area.
2.4. Data Collection and Processing
Commercial land data were extracted from the Wuxi municipal cadastral database to reflect the data available at the time of the assessment (including the area of buildings, number of floors, etc.). The map was overlaid with the current land use map in China’s 2000 national geodetic coordinate system and checked for flatness. The basic data needed to evaluate the intensive use of commercial land, such as building intensity, use efficiency, compatibility, and diversity, were collected through visits to the Wuxi Development and Reform Commission, the Bureau of Industry and Information Technology, the Bureau of Natural Resources, and other departments, as well as through field research.
3. Results
3.1. Statistical Information on Commercial Land Parcels
The study area is divided into 1664 commercial sites, with a total area of 18.12 km2, which represents 8.91% of the perimeter of the study area (Table 1). In terms of number, Liangxi District is the most numerous, and in terms of area, Liangxi District and Xinwu District occupy the first two positions, indicating that the commercial sites in the old city are more mature and established but relatively small and fragmented in area, while the commercial areas in the new district are contiguous and larger in area, so that the site area is also larger (Figure 3).

Table 1.
Summary of commercial land use statistics.
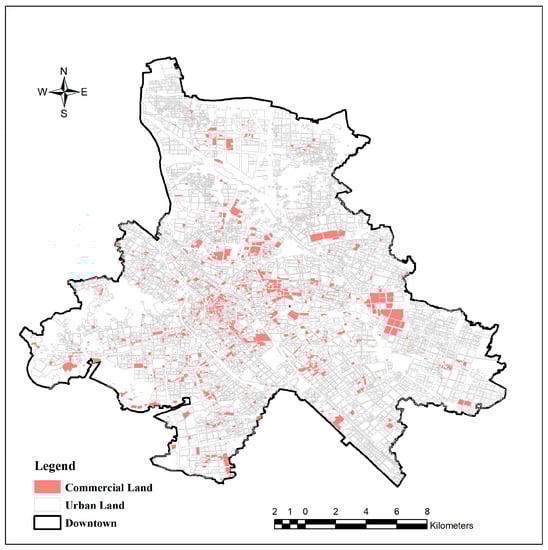
Figure 3.
Commercial land distribution map.
3.2. Evaluation Findings
3.2.1. Construction Intensity
The average plot ratio is 1.97 (Table 2). In terms of spatial distribution, the plot ratios show a gradient from the city center to the outskirts. The plot ratio of commercial land in the city center essentially reaches 5.0 or more, while the plot ratio of commercial land in the distant suburbs remains below 1.5 (Figure 4a). Moreover, the plot size and plot ratio show a significant negative correlation as far as the plot size is concerned. The larger the site area, the lower the plot ratio of commercial sites.
Table 2.
Summary of evaluation findings.
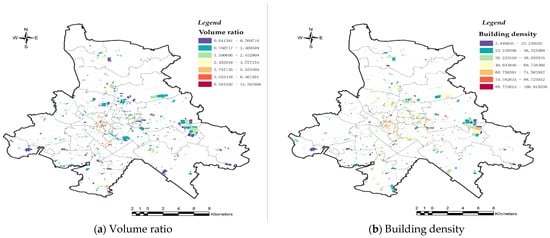
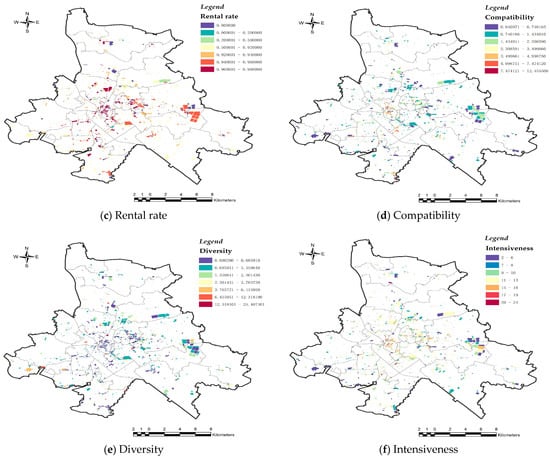
Figure 4.
Evaluation findings.
The highest building density of commercial land in Wuxi is 100.02 and the lowest is 3.84, with a standard deviation of 25.11 (Table 2). Overall, the building density is also high in the city center and low in the suburbs. However, compared with the land ratio, the building density does not show a clear central concentration in space (Figure 4b).
3.2.2. Utilization Efficiency
The evaluation results show that commercial land use in Wuxi is highly effective. The highest commercial land occupancy rate is 0.98, while the median and average occupancy rates are both 0.9 (Table 2). This also reflects the developed commercial market in Wuxi and the high efficiency of commercial land use. However, the lowest occupancy rate of commercial land in Wuxi is 0, indicating that there is also unused commercial land in the city. In terms of spatial distribution, there is no obvious spatial clustering of commercial land rental rates in Wuxi. Most of the commercial sites have an occupancy rate of 92% or more, with the exception of a few scattered commercial sites in the north, where the occupancy rate is low (Figure 4c).
3.2.3. Compatibility
As can be seen from Equation (4), the higher the compatibility value, the less compatible the commercial sites are with each other. Based on the results summarized in Table 2, it can be seen that the mean value of commercial land compatibility in Wuxi is 1.24, with a median value of 0.73. This result indicates that there is a high level of compatibility between the various types of businesses carried by commercial land in Wuxi. In addition, Figure 4d shows that there is clear spatial clustering of the commercial land compatibility indices in Wuxi, with the degree of compatibility of commercial sites in the city center being much higher than the compatibility of sites in the suburbs.
3.2.4. Diversity
The results show that the highest commercial land use diversity index in Wuxi is 12.46 and the lowest is 0.04 (Table 2). The diversity of commercial land uses in Wuxi has significant differentiation characteristics. This result indicates that there is strong locational variability in the degree of composite use of commercial land in Wuxi. This is also evidenced in Figure 4e. Overall, the commercial land use diversity index in Wuxi is low, and the city center shows a depression in diversity.
3.2.5. Intensive Urban Commercial Land Use
The level of intensive use of commercial land based on the parcel is assessed according to Equation (12). As can be seen from Table 2, the average and median intensive use of commercial land in Wuxi is 13.01, indicating that the level of intensive use of commercial land in the city is comparable and at a medium level overall. Except for the high level of intensive commercial land use in the central business district, the level of intensive commercial land use in the periphery of the central city has declined significantly Figure 4f.
3.3. Spatial Divergence Characteristics
The spatial distribution and degree of intensive use of urban commercial land are significantly influenced by the spatial location of the city in which the parcel is located. The result shows that the degree of intensive use of commercial land has significant spatial differentiation characteristics. The results of the exploratory spatial analysis show that, with the exception of the indicators of occupancy and diversity, the indicators used to evaluate intensive use have significantly spatially divergent characteristics (Table 3).
Table 3.
Summary of spatiotemporal differentiation.
Firstly, the floor area ratio shows significant spatial clustering characteristics. From Figure 5a, it can be seen that the floor area ratio of commercial land in the central city area shows a significant high–high clustering feature. This result indicates that the city center’s commercial area has a better location advantage, with high-rise commercial office buildings predominantly placed on commercial land. Moreover, the high floor area ratio of commercial land in the city center has spatial spillover characteristics, which can effectively enhance the intensive use of the surrounding land.
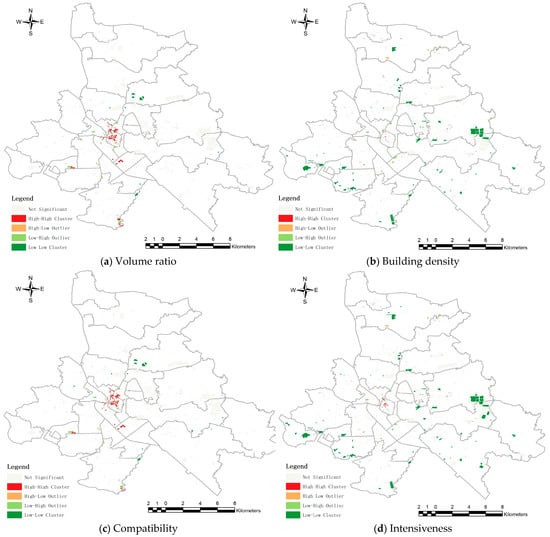
Figure 5.
Spatial divergence characteristics.
Secondly, the building density also has significant spatial clustering characteristics. However, unlike the floor area ratio, the building density is characterized by low clustering at the edge of the city center. The commercial sites away from the city center show a low-density sprawl. Moreover, as can be seen from Figure 5b, unlike the high–high agglomeration characteristic of a more concentrated volumetric ratio, the low–low agglomeration of low-density commercial land is scattered in multiple locations in urban areas away from the city center.
The spatial clustering characteristics of compatibility are very similar to those of the volumetric ratios. The compatibility of commercial land uses in the city center area shows high–high agglomeration Figure 5c. This indicates that there is a high degree of compatibility between commercial businesses in the central city. The spatial spillover of the high compatibility of commercial land can help to further enhance the intensive use of commercial land.
Overall, the level of intensive land use of urban commercial land in Wuxi is characterized by significant spatial clustering Figure 5d. Firstly, the spatial distribution of the level of intensive land use of urban commercial land in Wuxi is relatively uneven. Commercial land in the city center is characterized by a high level of agglomeration. Commercial land use in the peripheral areas of the city is characterized by low concentration. Secondly, the number of parcels with high levels of intensive land use is small and the area is relatively small. The spatial spillover of commercial land parcels with high levels of intensive land use is limited. In contrast, there are many parcels with low levels of land intensive use, and they are scattered over a wide area. The spatial spillover of commercial land parcels with low levels of intensive land use is significant.
4. Discussion
4.1. Multidimensional Expression of Intensive Commercial Land Use
The input–output ratio is the core concept of land-intensive use evaluation. Most of the existing studies also consider the average input–output of the area to measure the degree of intensive use of urban land [26,56]. Without regard to spatial scale, similar assessment concepts and approaches are able to respond objectively to the degree of land use intensification and utilization [39,56]. The volume ratio and building density, as indicators of land use, can reflect the degree of land use intensification more objectively. However, the consideration of only these two indicators is not comprehensive [34]. The intensification of commercial land use takes into account the intensity of building use in the physical dimension, input–output efficiency in the economic dimension, and the organic integration of the diversity and compatibility of commercial land use from the commercial mode. The impact of land use externalities must also be included in the assessment of intensive commercial land use [50]. As noted in this study, a large area of commercial land on the edge of downtown has a relatively high floor area ratio and development density. However, due to the lack of reasonable commercial planning, these areas suffer from the problem of commercial compatibility [13]. As a result, the overall intensive use is not very high. For example, the downtown core area leads the region in terms of the floor area ratio and occupancy rate, but it is obvious that the diversity index of downtown is very low, which limits the intensive use of the downtown core area. From this, it can be seen that the evaluation of intensive land use based on parcels must consider not only the average land use of parcels, but also the relationships between parcels and the relationships between parcels and regions. When evaluating the intensification of commercial land use, compatibility and diversity between parcels must be considered [61].
4.2. Location Has a Significant Impact on Commercial Land Use Intensification
The influence of location on urban commercial land use is very large. Therefore, the degree of intensive commercial land use under the influence of location factors also shows clear spatial differentiation characteristics [21]. Overall, the degree of intensive commercial land use in Wuxi City shows a clear spatial downward trend from the core to the peripheral areas. In particular, it can be seen that the core area of the central city has a significantly high concentration of intensive commercial land use, while the peripheral area of the central city has a significantly low concentration. In addition to the rental rate and diversity index, the volume ratio, development density, and compatibility also exhibit significant spatial cluster characteristics. The core area of the central city is a more developed commercial area, where there are more commercial spaces and where a high volume ratio is more common. In contrast, the development density has significantly less clustering. Because areas distant from the city center tend to have less commercial development, the demand for commercial space is not as strong as in the core areas of the city center [43]. As a result, the density of commercial development in the outlying areas of downtown is relatively low. The study also shows that the volume ratio, development density, rental rate, compatibility, and diversity must be considered together when assessing the level of intensive commercial land use. However, the above indicators show similar spatial clustering characteristics. This also shows that location factors significantly affect the amount of commercial land use. Therefore, when planning commercial land use and developing optimization plans for intensive land use, it is necessary to consider the influence of location on commercial land use [46].
4.3. Implications for Spatial Planning
Spatial planning is the fundamental basis for all forms of territorial development, protection, and construction activities [48]. It is also an important means for the state to guide and monitor the development and use of urban land resources and to regulate and optimize the spatial design [49]. Therefore, in order to comprehensively improve the efficiency of urban land resource utilization, it is necessary to play the leading role of spatial planning scientifically [62]. Research has shown that the degree of intensive use of commercial land is affected by the floor area ratio, building density, compatibility, and diversity. Therefore, not only the floor area ratio, building density, and other controlling elements of each commercial land must be considered in the preparation of national land use planning. The study found that the lack of compatibility and the diversity of the spatial arrangement of commercial areas lead to a loss of urban vitality [50]. Therefore, the compatibility and diversity of commercial enterprises must also be taken into account when preparing land use plans or urban renewal programs. In addition, the spatial spillover effect of the degree of intensification of an individual commercial use must not be ignored [21]. Only when the per capita input index of an individual commercial site and its potential externalities are taken into account can the degree of intensification of commercial land use be effectively improved.
5. Conclusions
Assessing the degree of intensification of urban land use on the basis of the plot scale is a difficult problem in this field of study. When discussing the degree of intensification of commercial land use at the microscopic level, it is necessary to consider not only the indicators related to average land use but also other factors that affect the degree of intensification of land use. In this paper, we construct a system to evaluate the intensity of commercial land use that integrates the indicators of the volume ratio, building density, use efficiency, compatibility, and diversity. An empirical study was conducted in downtown Wuxi as a case study area. The research results show that the mean values of the volume ratio of commercial space, building density, use efficiency, compatibility, and diversity in Wuxi City are 1.97, 59.1, 0.9, 1.24, and 1.86, respectively. The mean value of the intensive use of commercial land in the city is 13.01, with a standard deviation of 5.11 and median value of 13, which generally indicate a medium level. The degree of intensive use of commercial land has obvious characteristics of high, medium, and low levels. Except for the high intensity of commercial land use in the central business district, the intensity of commercial land use decreases significantly at the periphery of the central city. The results of the study can help city managers or planners to optimize commercial land use in terms of land use per capita or in terms of the compatibility or diversity of commercial land types, based on the different intensities of commercial land use and its different indicators in different regions.
In addition, the impact of the externalities of commercial land use must be considered in the development of urban plans. In this study, it was also found that in addition to the average indicators of land consumption, such as the volume ratio, building density, and use efficiency, these can objectively respond to the degree of intensive commercial land use. When evaluating the intensification of land use at the parcel level, it is also necessary to consider the impact of external land use. The study shows that the degree of intensive commercial land use in Wuxi City is favored by the high compatibility among different types of enterprises located on commercial land. However, the diversity of commercial land use in Wuxi City is characterized by significant differentiation. The low diversity in the central business district affects the level of intensive commercial land use throughout the study area. In addition, the spatial clustering characteristics of the different indexes show significant differences. The development density is also high in the city center and low in the suburbs. However, compared to the volume ratio, the development density does not show a clear central concentration in the study area. The commercial land compatibility indexes are highly spatially clustered in Wuxi City, and the degree of commercial land compatibility in the central city is much higher than the compatibility of the land in the suburbs.
The contribution of this study is to develop an area-based evaluation approach for the intensive use of commercial land in the city. This evaluation approach is not only able to reflect the influence of the average area input of commercial land on intensive use. In addition, this system can also consider the external effects of neighboring commercial uses. However, a limitation of this work is that it only examines the evaluation of the intensive use of commercial land based on land size, without analyzing the applicability to other types of land. As with residential and industrial areas, it is necessary to determine which factors must be considered when evaluating compatibility and diversity. This will greatly affect the usefulness and accuracy of the assessment. Future research can further validate this evaluation system using different cities and different land use types.
Author Contributions
Conceptualization, H.W. and K.W.; methodology, H.W., Z.F. and H.Z.; validation, H.W., H.A. and C.M.; writing—original draft preparation, H.W.; writing—review and editing, H.W. and K.W. All authors have read and agreed to the published version of the manuscript.
Funding
This research was funded by the National Natural Science Foundation of China (NSFC No. 42171261).
Institutional Review Board Statement
Not applicable.
Informed Consent Statement
Not applicable.
Data Availability Statement
The data are not publicly available due to privacy.
Conflicts of Interest
The authors declare no conflict of interest.
References
- Schiavina, M.; Melchiorri, M.; Freire, S.; Florio, P.; Ehrlich, D.; Tommasi, P.; Pesaresi, M.; Kemper, T. Land use efficiency of functional urban areas: Global pattern and evolution of development trajectories. Habitat Int. 2022, 123, 102543. [Google Scholar] [CrossRef]
- Xia, L.M.; Chen, S.P. Evaluation on Land Intensive Use Based on the Sustainable Development Theory in Tianjin. In Proceedings of the 2010 International Conference on Logistics Systems and Intelligent Management, Harbin, China, 9–10 January 2010; Volume 1–3, pp. 395–398. [Google Scholar]
- Cai, G.; Zhang, J.; Du, M.; Li, C.; Peng, S. Identification of urban land use efficiency by indicator-SDG 11.3.1. PLoS ONE 2021, 15, e0244318. [Google Scholar] [CrossRef]
- Zhuo, Y.; Zheng, H.; Wu, C.; Xu, Z.; Li, G.; Yu, Z. Compatibility mix degree index: A novel measure to characterize urban land use mix pattern. Comput. Environ. Urban Syst. 2019, 75, 49–60. [Google Scholar] [CrossRef]
- Kazak, J.K.; Błasik, M.; Świąder, M. Land use change in suburban zone: European context of urban sprawl. J. Water Land Dev. 2022, 92–98. [Google Scholar] [CrossRef]
- Miller, J.S.; Hoel, L.A. The “smart growth” debate: Best practices for urban transportation planning. Socio-Econ. Plan. Sci. 2002, 36, 1–24. [Google Scholar] [CrossRef]
- Gabriel, S.A.; Faria, J.A.; Moglen, G.E. A multiobjective optimization approach to smart growth in land development. Socio-Econ. Plan. Sci. 2006, 40, 212–248. [Google Scholar] [CrossRef]
- Howell-Moroney, M. Studying the effects of the intensity of US state growth management approaches on land development outcomes. Urban Stud. 2007, 44, 2163–2178. [Google Scholar] [CrossRef]
- Stevens, M.R. Does Compact Development Make People Drive Less? J. Am. Plan. Assoc. 2017, 83, 7–18. [Google Scholar] [CrossRef]
- Neuman, M. The Compact City Fallacy. J. Plan. Educ. Res. 2005, 25, 11–26. [Google Scholar] [CrossRef]
- Farris, J.T. The barriers to using urban infill development to achieve smart growth. Hous. Policy Debate 2001, 12, 1–30. [Google Scholar] [CrossRef]
- Kim, J.; Larsen, K. Can new urbanism infill development contribute to social sustainability? The case of Orlando, Florida. Urban Stud. 2016, 54, 3843–3862. [Google Scholar] [CrossRef]
- Eom, S.; Suzuki, T.; Lee, M.-H. A land-use mix allocation model considering adjacency, intensity, and proximity. Int. J. Geogr. Inf. Sci. 2019, 34, 899–923. [Google Scholar] [CrossRef]
- Echenique, M.H.; Hargreaves, A.J.; Mitchell, G.; Namdeo, A. Growing Cities Sustainably. J. Am. Plan. Assoc. 2012, 78, 121–137. [Google Scholar] [CrossRef]
- Cen, X.; Wu, C.; Xing, X.; Fang, M.; Garang, Z.; Wu, Y. Coupling Intensive Land Use and Landscape Ecological Security for Urban Sustainability: An Integrated Socioeconomic Data and Spatial Metrics Analysis in Hangzhou City. Sustainability 2015, 7, 1459–1482. [Google Scholar] [CrossRef]
- Qian, Q.; Liu, H.; Zheng, X. A Regional Sustainable Intensive Land Use Evaluation Based on Ecological Constraints: A Case Study in Jinan City. Sustainability 2019, 11, 1434. [Google Scholar] [CrossRef]
- Shao, J.; Ge, J. Investigation into Relationship between Intensive Land Use and Urban Heat Island Effect in Shijiazhuang City Based on the Tapio Decoupling Theory. J. Urban Plan. Dev. 2020, 146, 04020043. [Google Scholar] [CrossRef]
- Wang, X.; Shi, R.; Zhou, Y. Dynamics of urban sprawl and sustainable development in China. Socio-Econ. Plan. Sci. 2020, 70, 100736. [Google Scholar] [CrossRef]
- Xia, C.; Yeh, A.G.-O.; Zhang, A. Analyzing spatial relationships between urban land use intensity and urban vitality at street block level: A case study of five Chinese megacities. Landsc. Urban Plan. 2020, 193, 103669. [Google Scholar] [CrossRef]
- Cui, X.; Huang, S.; Liu, C.; Zhou, T.; Shan, L.; Zhang, F.; Chen, M.; Li, F.; de Vries, W.T. Applying SBM-GPA Model to Explore Urban Land Use Efficiency Considering Ecological Development in China. Land 2021, 10, 912. [Google Scholar] [CrossRef]
- Garang, Z.; Wu, C.; Li, G.; Zhuo, Y.; Xu, Z. Spatio-Temporal Non-Stationarity and Its Influencing Factors of Commercial Land Price: A Case Study of Hangzhou, China. Land 2021, 10, 317. [Google Scholar] [CrossRef]
- Wu, Y.; Fan, P.; You, H. Spatial Evolution of Producer Service Sectors and Its Influencing Factors in Cities: A Case Study of Hangzhou, China. Sustainability 2018, 10, 975. [Google Scholar] [CrossRef]
- Blazy, R.; Łabuz, R. Spatial Distribution and Land Development Parameters of Shopping Centers Based on GIS Analysis: A Case Study on Kraków, Poland. Sustainability 2022, 14, 7539. [Google Scholar] [CrossRef]
- Zhang, P.; Yang, D.; Qin, M.; Jing, W. Spatial heterogeneity analysis and driving forces exploring of built-up land development intensity in Chinese prefecture-level cities and implications for future Urban Land intensive use. Land Use Policy 2020, 99, 104958. [Google Scholar] [CrossRef]
- Wu, Y.; Hui, E.C.M.; Zhao, P.; Long, H. Land use policy for urbanization in China. Habitat Int. 2018, 77, 40–42. [Google Scholar] [CrossRef]
- Lau, S.S.Y.; Giridharan, R.; Ganesan, S. Multiple and intensive land use: Case studies in Hong Kong. Habitat International 2005, 29, 527–546. [Google Scholar] [CrossRef]
- Chen, L.; Yang, X.; Li, L.; Chen, L.; Zhang, Y. The Natural and Socioeconomic Influences on Land-Use Intensity: Evidence from China. Land 2021, 10, 1254. [Google Scholar] [CrossRef]
- Cheng, X.; Shao, H.; Li, Y.; Shen, C.; Liang, P. Urban Land Intensive Use Evaluation Study Based on Nighttime Light—A Case Study of the Yangtze River Economic Belt. Sustainability 2019, 11, 675. [Google Scholar] [CrossRef]
- Zeng, C.; Zhang, A.L.; Liu, L.; Liu, Y. Administrative restructuring and land-use intensity-A spatial explicit perspective. Land Use Policy 2017, 67, 190–199. [Google Scholar] [CrossRef]
- Luo, X.; Qin, J.; Cheng, C.; Pan, Y.; Yang, T. Spatial effects and influencing factors of urban land intensive use in the Yangtze River Delta under high-quality development. Front. Environ. Sci. 2022, 10, 1270. [Google Scholar] [CrossRef]
- Borchers, A.; Pieler, T. Programming pluripotent precursor cells derived from Xenopus embryos to generate specific tissues and organs. Genes 2010, 1, 413–426. [Google Scholar] [CrossRef]
- Zhou, L.; Shi, Y.; Cao, X. Evaluation of Land Intensive Use in Shanghai Pilot Free Trade Zone. Land 2019, 8, 87. [Google Scholar] [CrossRef]
- He, W.; Kuang, F.M.; Wang, P. Evaluation of Intensive Land Use in Shuikoushan Economic Development Zone, Hunan Province, China. IOP Conf. Ser. Earth Environ. Sci. 2017, 86, 012013. [Google Scholar] [CrossRef]
- Yang, J.; Yang, Y.; Tang, W. Development of evaluation model for intensive land use in urban centers. Front. Archit. Res. 2012, 1, 405–410. [Google Scholar] [CrossRef]
- Yang, Z.; Li, S.; Sun, D.; Li, C.; Wu, J. Intensive Evaluation and High-Quality Redevelopment of Enterprise Land Use: A Case Study in China. Land 2022, 11, 432. [Google Scholar] [CrossRef]
- Williams, K. Urban intensification policies in England: Problems and contradictions. Land Use Policy 1999, 16, 167–178. [Google Scholar] [CrossRef]
- Burton, E. Measuring Urban Compactness in UK Towns and Cities. Environ. Plan. B Plan. Des. 2002, 29, 219–250. [Google Scholar] [CrossRef]
- Yang, P.P.-J.; Lay, O.B. Applying ecosystem concepts to the planning of industrial areas: A case study of Singapore’s Jurong Island. J. Clean. Prod. 2004, 12, 1011–1023. [Google Scholar] [CrossRef]
- Taleai, M.; Sharifi, A.; Sliuzas, R.; Mesgari, M. Evaluating the compatibility of multi-functional and intensive urban land uses. Int. J. Appl. Earth Obs. Geoinf. 2007, 9, 375–391. [Google Scholar] [CrossRef]
- Thinh, N.X.; Arlt, G.; Heber, B.; Hennersdorf, J.; Lehmann, I. Evaluation of urban land-use structures with a view to sustainable development. Environ. Impact Assess. Rev. 2002, 22, 475–492. [Google Scholar] [CrossRef]
- Lewis, G.M.; Brabec, E. Regional land pattern assessment: Development of a resource efficiency measurement method. Landsc. Urban Plan. 2005, 72, 281–296. [Google Scholar] [CrossRef]
- Oh, K.; Jeong, Y.; Lee, D.; Lee, W.; Choi, J. Determining development density using the Urban Carrying Capacity Assessment System. Landsc. Urban Plan. 2005, 73, 1–15. [Google Scholar] [CrossRef]
- Li, H.; Chen, K.; Yan, L.; Zhu, Y.; Liao, L.; Chen, Y. Urban Land Use Transitions and the Economic Spatial Spillovers of Central Cities in China’s Urban Agglomerations. Land 2021, 10, 644. [Google Scholar] [CrossRef]
- Lin, G.C.S.; Yi, F. Urbanization of Capital or Capitalization on Urban Land? Land Development and Local Public Finance in Urbanizing China. Urban Geogr. 2013, 32, 50–79. [Google Scholar] [CrossRef]
- Wu, Y.; Luo, J.; Zhang, X.; Skitmore, M. Urban growth dilemmas and solutions in China: Looking forward to 2030. Habitat International 2016, 56, 42–51. [Google Scholar] [CrossRef]
- Kosow, H.; Wassermann, S.; Bartke, S.; Goede, P.; Grimski, D.; Imbert, I.; Jenssen, T.; Laukel, O.; Proske, M.; Protzer, J.; et al. Addressing Goal Conflicts: New Policy Mixes for Commercial Land Use Management. Land 2022, 11, 795. [Google Scholar] [CrossRef]
- Abolhasani, S.; Taleai, M.; Karimi, M.; Rezaee Node, A. Simulating urban growth under planning policies through parcel-based cellular automata (ParCA) model. Int. J. Geogr. Inf. Sci. 2016, 30, 2276–2301. [Google Scholar] [CrossRef]
- Yanbo, Q.; Shilei, W.; Yaya, T.; Guanghui, J.; Tao, Z.; Liang, M. Territorial spatial planning for regional high-quality development—An analytical framework for the identification, mediation and transmission of potential land utilization conflicts in the Yellow River Delta. Land Use Policy 2023, 125, 106462. [Google Scholar] [CrossRef]
- Hersperger, A.M.; Oliveira, E.; Pagliarin, S.; Palka, G.; Verburg, P.; Bolliger, J.; Grădinaru, S. Urban land-use change: The role of strategic spatial planning. Glob. Environ. Change 2018, 51, 32–42. [Google Scholar] [CrossRef]
- Yang, H.J.; Song, J.; Choi, M.J. Measuring the Externality Effects of Commercial Land Use on Residential Land Value: A Case Study of Seoul. Sustainability 2016, 8, 432. [Google Scholar] [CrossRef]
- Sun, W.; Chen, W.; Jin, Z. Spatial Function Regionalization Based on an Ecological-economic Analysis in Wuxi City, China. Chin. Geogr. Sci. 2019, 29, 352–362. [Google Scholar] [CrossRef]
- Liu, Y.L.; Wei, X.J.; Jiao, L.M.; Wang, H.M. Relationships between Street Centrality and Land Use Intensity in Wuhan, China. J. Urban Plan. Dev. 2016, 142, 05015001. [Google Scholar] [CrossRef]
- Luo, J.; Wu, Y.; Choguill, C.L.; Zhang, X. A study on promoting the intensive use of industrial land in China through governance: A game theoretical approach. J. Urban Manag. 2022, 11, 298–309. [Google Scholar] [CrossRef]
- Esfandi, S.; Nourian, F. Urban carrying capacity assessment framework for mega mall development. A case study of Tehran’s 22 municipal districts. Land Use Policy 2021, 109, 105628. [Google Scholar] [CrossRef]
- Peng, C.; Song, M.; Han, F. Urban economic structure, technological externalities, and intensive land use in China. J. Clean. Prod. 2017, 152, 47–62. [Google Scholar] [CrossRef]
- Su, H.M.; He, A.X.; Fang, G. Study of Urban Land Intensive Use Dynamic and Spatial Difference in Anhui Province. Adv. Mater. Res. 2011, 347–353, 3597–3602. [Google Scholar] [CrossRef]
- Irwin, E.G.; Bockstael, N.E. Land use externalities, open space preservation, and urban sprawl. Reg. Sci. Urban Econ. 2004, 34, 705–725. [Google Scholar] [CrossRef]
- Millard, J.; Outhwaite, C.L.; Kinnersley, R.; Freeman, R.; Gregory, R.D.; Adedoja, O.; Gavini, S.; Kioko, E.; Kuhlmann, M.; Ollerton, J.; et al. Global effects of land-use intensity on local pollinator biodiversity. Nat. Commun. 2021, 12, 2902. [Google Scholar] [CrossRef]
- Wang, F. Quantitative Methods and Socio-Economic Applications in GIS; CRC Press, Inc.: Boca Raton, FL, USA, 2014. [Google Scholar]
- Anselin, L. Local Indicators of Spatial Association. Geogr. Anal. 1995, 27, 93–115. [Google Scholar] [CrossRef]
- Gao, J.; Song, J.; Wu, L. A new methodology to measure the urban construction land-use efficiency based on the two-stage DEA model. Land Use Policy 2022, 112, 105799. [Google Scholar] [CrossRef]
- Wang, L.Y.; Zhang, S.Y.; Tang, L.P.; Lu, Y.C.; Liu, Y.F.; Liu, Y.L. Optimizing distribution of urban land on the basis of urban land use intensity at prefectural city scale in mainland China. Land Use Policy 2022, 115, 106037. [Google Scholar] [CrossRef]


Disclaimer/Publisher’s Note: The statements, opinions and data contained in all publications are solely those of the individual author(s) and contributor(s) and not of MDPI and/or the editor(s). MDPI and/or the editor(s) disclaim responsibility for any injury to people or property resulting from any ideas, methods, instructions or products referred to in the content. |
© 2023 by the authors. Licensee MDPI, Basel, Switzerland. This article is an open access article distributed under the terms and conditions of the Creative Commons Attribution (CC BY) license (https://creativecommons.org/licenses/by/4.0/).