Abstract
Enhancing rural ecological protection and promoting the adoption of environmentally-friendly agricultural production practices largely depend on the implementation of green production methods by farmers. This research paper focuses on the green production behavior of farmers in Hainan Province, China, drawing insights from survey responses provided by 543 farmers. The study examines how farmers’ capital endowment, ecological cognition, and environmental regulation impact their multiple green production practices, using the ordered probit model, mediation effect model, and moderation effect model for analysis and further applying the Ivoprobit_CMP, PSM, and other methods for endogeneity treatment and a robustness test. The study reveals several key findings. Firstly, only a small proportion of farmers consistently adopt green production practices throughout various stages of agricultural production. Secondly, the research shows that capital endowment, including natural, economic, human, and social capital, has a significant influence on farmers’ green production behavior. Thirdly, the study finds that ecological cognition plays a crucial role in mediating the relationship between capital endowment and its dimensions (human and social capital) and the adoption of green production practices. Additionally, the research discovers that environmental regulation positively moderates the relationship between ecological cognition and farmers’ green production behavior. Finally, the research indicates that factors such as ethnicity, fluctuations in agricultural production, and the location of the village agricultural waste collection site are all significant determinants of farmers’ engagement in green production practices. The study also identifies significant regional disparities in farmers’ adoption of green production practices. To address the issue of farmers’ low adoption of green production practices, the paper recommends promoting the overall green transformation of the entire agricultural production process. This can be achieved by enhancing farmers’ capital endowment in multiple dimensions and improving their ecological cognition through various channels. Additionally, creating a supportive external environment that aligns with green production practices is deemed critical.
1. Introduction
The traditional “high-input, high-consumption, high-emission” agricultural production model has overdrawn the ecological dividend and has caused various nonnegligible consequences for China’s agriculture and rural areas, such as resource tension, environmental pollution, and ecological degradation [1]. According to statistics, in 2019, China applied 54.036 million tons of fertilizers, used 1.392 million tons of pesticides, generated 870 million tons of crop straw, used 2.465 million tons of agricultural films, and discarded pesticide packaging of about 3.5 billion pieces [2]. Due to the large base of fertilizer and pesticide use and waste generation, the situation regarding sustainable agricultural and rural development is severe. Modifying the conventional production mode and promoting agricultural green production is a practical solution to address resource, environmental, and ecological issues [3]. Agricultural green production refers to a novel production mode that achieves resource conservation, pollution reduction, efficient output, and sustainable development through a series of scientific agricultural techniques and rational field management [3]. Green investment and improvement in pre-production, green technology adoption in mid-production, and integrated management of the farmland in post-production are the three linkages covered [4,5]. Green production has the potential to achieve coordinated economic, social, and ecological development. Li et al. [6] found that green production technologies adoption significantly boosted the technical efficiency of rice production by 18.8% to 24.5%. Benitez-Altuna et al. [7] pointed out that the extensive global practice of green production confirmed its functions of enhancing ecosystem services, increasing agricultural productivity and profitability, and reducing the use of agricultural inputs. Farmers are the main implementers of agricultural green production. Based on the definition of agricultural green production, farmers’ green production behavior means that farmers consciously engage in reduction, reuse, low pollution, and multi-benefit production methods within all stages of agricultural production. It includes practices such as conservation tillage, water-saving irrigation, application of farmyard manure and organic manure, formula fertilization, and utilization of agricultural waste [8].
Despite the multiple benefits of agricultural green production, farmers’ motivation for green production is generally lower than expected, and the extensive operation model that relies on resource consumption is unchanged [9]. There should be a clarity on the grim situation and the arduous task facing China’s agricultural green production [3]. Xu et al. [10] argued that Chinese farmers’ characteristics contribute to the decentralized, diverse, and complex nature of agricultural production. As the actual practitioners of green production, farmers’ green production behavior constitutes the foundation for the smooth implementation of agricultural production’s green transformation and is directly related to the governance of ecological and environmental issues [8]. Therefore, it is significant to clarify the decision-making mechanism of farmers’ green production behavior.
Farmers’ green production behavior is largely determined by both internal and external factors [11,12]. Furthermore, Zhu and Deng [13] pointed out that the effective connection and mutual support of capital endowment, ecological cognition, and environmental regulation create conditions for farmers’ green production behavior, and these three factors play a fundamental, guiding, and driving role in the generation logic of green transition.
In terms of internal factors, capital endowment refers to the various resources and capabilities that a household and its members possess innately or acquire later and can use as objective support to sustain production and livelihood [14,15]. Capital endowment objectively represents farmers’ behavioral capabilities and ultimately determines the actual level and effectiveness of green production [16]. A large number of studies have reached a consensus on its positive effect [17,18,19,20]. Previous studies have comprehensively examined farmers’ capital endowment at the aggregate and subdimensional levels, since capital endowment is an integrated concept, and a single variable’s explanatory power is limited [21,22]. He et al. [23] affirmed the decisive role of farmers’ capital endowment on agricultural waste reuse and found that social, human, and physical capital significantly increase farmers’ willingness to reuse agricultural waste.
Ecological cognition is a comprehensive expression of farmers’ knowledge reserves, behavioral tendencies, and responsibility awareness towards rural ecology, formed through exposure to external ecology and perception of the interdependence between agriculture and ecology [24]. Scholars agree that ecological cognition is multidimensional [15,25], but previous studies have mainly focused on the environmental perspective [26,27,28], posing a problem when building indicators of ecological cognition. Gosling and Williams [29] noted that concern for other biological groups can better promote environment-friendly behavior. Ecological cognition can effectively drive farmers to adopt green production [30,31,32]. Zhang et al. [33] based on the data from 924 Chinese farmers concluded that ecological concerns contributed the most to farmers’ willingness to reduce pesticides. In contrast, according to Ren et al. [22], there was no substantial consistency between ecological cognition and farmers’ green production. Qing et al. [28] found that higher ecological perception did not necessarily lead to ecological improvement behaviors. Hence, indicator selection and the effect of ecological cognition need to be further explored.
In terms of external factors, the public goods attributes of agricultural resources, ecology and environment, and the externalities of traditional agricultural production provide the economic logic for environmental regulation intervention. Environmental regulation pertains to the guidance and constraints that government enforces regarding farmers’ behavior, utilizing its institutional resources to mitigate resource waste, environmental pollution, and ecological destruction [34]. Environmental regulation can regulate farmers’ involvement in green production and negative externalities and thus reconcile conflicts between agricultural development, environment, and ecology [3]. However, Pemsl et al. [35] and Zhang et al. [1] proposed that government “top-down” regulation suffers from “institutional failure”. Environmental regulation focused on long-term benefits cannot fundamentally reverse farmers’ preference for short-term benefits [9], and the difficulty of enforcing regulation makes it difficult to adjust farmers’ behavior effectively [36]. So, whether environmental regulation influences farmers’ green production behavior is far from settled.
The current research is of crucial importance to this paper. However, there is room for improvement. First, most of the existing research selects one or several green production methods or technologies in a particular link as a characterization of farmers’ green production behavior, which is a single and one-sided choice [10,32,37]. Second, a limited amount of research focuses on concurrently incorporating capital endowment, ecological cognition, and environmental regulation into the theoretical framework. Third, the dimensional expansion of the evaluation indicators of ecological cognition has yet to be studied well. Fourth, few studies have been conducted on encouraging farmers in Hainan Province to become involved in green production based on survey data. Hainan is a national pioneer area for agricultural green development. Still, the agricultural green development level is lower than that of the country as a whole. The high resource input, low nutrient utilization efficiency, and high environmental pollution emission are contrary to the development goals [5].
This study makes four key contributions to filling the gap in this field. First, farmers’ multiple green production behaviors chosen in this paper can encompass the prominent linkages of agricultural production, including soil testing and formulated fertilization technology in pre-production, organic fertilizer application in mid-production, straw returning, pesticide packaging waste recycling, and agricultural mulch film recycling in post-production. Second, this study further elaborates on the underlying impact mechanism of farmers’ green production behavior by unifying the capital endowment, ecological cognition, and environmental regulation. Third, by introducing ecologically-focused indicators like “biodiversity” and “two mountains theory”, this research reconstructs the ecological cognition dimensional space and comprehensively extracts ecological cognition. This optimization in measuring ecological cognition improves the explanatory power of farmers’ green production behavior compared to previous studies. Fourth, this paper explores reasons for farmers’ low participation in green production, contributing to a reliable theoretical and empirical basis for the green transformation of agricultural production in Hainan Province.
2. Theoretical Framework
Farmers’ behavior is profoundly affected by capital endowment. For farmers to attain sustainable agricultural production, relying on just one asset is challenging; instead, they must have a variety of capital endowments [38,39]. Capital endowments that farmers are expected to have to support green production include natural, economic, human, and social capital [40].
Natural capital is reflected as the natural conditions for farm households to carry out agricultural production and operation. For the sake of scale economies, farmers will tend to practice green production if they have larger farmland to achieve the scientific management of resource input and reduce the average cost of agricultural production [41]. Meanwhile, concentrated and flat farmland is advantageous for farmers to implement large-scale operations and mechanized production, which facilitates the green transformation of agricultural production [8,42,43]. Economic capital is a type of capital that can be converted into a monetary form or institutionalized as property rights to provide economic benefits to farm households [39]. Economic capital provides an important prerequisite and guarantee for farmland’s green investment. Agricultural assets such as income, land property right, and machinery are often considered economic capital measures [11,44,45], and their holdings reflect the importance farmers attach to agriculture and are significantly associated with increased green production behaviors [46]. Human capital consists of farm households’ labor capacity, health status, and the accumulation of qualities acquired through investment in skills, practices, or literacy [37]. Households with a greater labor force have broader access to livelihoods; so, family agricultural laborers have more energy to concentrate on green production management [23]. In addition, the quantity and quality of labor are essential guarantees of agricultural management with a significant impact on the production methods of farmers [16]. Social capital refers to the resources obtained within a specific social structure, such as social networks, trust, and involvement [47]. Farmers obtain information on agricultural green production through social capital to reduce the uncertainty of participation [48,49]. Interaction and trust in the government, village committee, village cadre, and other social subjects can reduce transaction costs of initiators and participants and advance coordination and cooperation in green production [50]. Thus, we propose the following hypothesis:
H1.
Capital endowment and its dimensions have a significant positive impact on farmers’ green production behavior.
Ecological cognition mainly includes the perception of ecological status [31], the knowledge of ecological policies [28], the awareness of responsibility for ecological protection [51], and the understanding of green production and living actions [52,53]. The bounded rationality hypothesis of behavioral economics suggests that information incompleteness due to limited ecological cognitive capacity constrains the rational limits of farmers’ green production behavior [54,55]. Ecological cognitive completeness can reduce farmers’ green production behavior deviation from rationality. Farmers’ expectations of eco-efficiency will significantly rise once they realize that the benefits of ecological conservation outweigh the costs. The shift from economic to ecological rationality will lead to more responsible attitudes and behaviors toward ecology, thus promoting green production [56], consequently, the stronger the intrinsic motivation of farmers to alleviate ecological and environmental problems through green production becomes. Thus, we propose the following hypothesis:
H2.
Ecological cognition has a significant positive impact on farmers’ green production behavior.
Environmental regulation can foster farmers’ green production willingness through education and training initiatives, as well as increase the cost of noncompliant production practices through supervision and penalty activities, thereby regulating farmers’ production behavior [57]. The greater the intensity and frequency of environmental regulation, coupled with effective enforcement, the more likely farmers are to embrace green production practices [10]. Farmers’ green production decisions tend to be more rationalized under the influence of environmental regulation [58]. Under certain institutional situations, the costs of farmers’ behavior that is compatible with the environment will decrease, while the costs and utility losses incurred by farmers’ violations will increase. After weighing the costs, rationality will motivate farmers to adopt the green production decision to maximize their utility [59]. Thus, we propose the following hypothesis:
H3.
Environmental regulation has a significant positive impact on farmers’ green production behavior.
Farmers’ ecological cognition is influenced by their capital endowment [60]. In concrete terms, farmers will prioritize the ecological environment for sustainable agricultural growth when agriculture becomes more important due to increased natural capital [61]. As economic capital increases, according to Maslow’s hierarchy of needs, farmers will develop a higher level of security needs for the ecological environment after satisfying their basic survival needs [62]. The greater the human capital possessed by farmers, the more they can be guided to view green production from a developmental perspective and visibly enlighten their awareness and emotions about ecological conservation [63]. Plentiful social capital can disseminate knowledge and information related to green development and promote farmers to develop a high level of ecological cognition [64]. In addition, ecological cognition may contribute significantly to farmers’ green production behavior. Therefore, we propose the following hypothesis:
H4.
Ecological cognition mediates the relationship between the overall and subdimensional capital endowments and farmers’ green production behavior.
Environmental regulation plays a crucial moderating role in the influence of capital endowment and ecological cognition on farmers’ green production behavior. On the one hand, Farmers’ participation in green production is the aim of environmental regulation. However, compliance cost theory suggests that environmental regulation that internalizes the externalities of “non-green” production will raise farmers’ production costs and crowd out the original capital endowments investment [65]. If farmers lack sufficient capital endowments to bear the cost of environmental regulation and to support the adoption of green production, the dominance of the compliance cost effect will result in the fact that the stricter the environmental regulation, the less it will guarantee farmers’ green production behavior [66]. On the other hand, according to the “cognition–situation–behavior” theory, environmental regulation as a crucial situational factor can exert an impact on the process of cognition leading to behavior [67]. When environmental regulation changes, farmers reinforce their ecological cognition based on the “increment” of such changes to seek compatibility with the external situation, thus achieving coordination and adaptive adjustment between the cognitively guided agricultural production behavior and the environment [68]. Hence, environmental regulation can effectively compensate for the lack of farmers’ ecological cognition and exert influence, thus enhancing their behavioral response to green production. Therefore, we propose the following hypotheses:
H5.
Environmental regulation negatively moderates the relationship between capital endowment and farmers’ green production behavior.
H6.
Environmental regulation positively moderates the relationship between ecological cognition and farmers’ green production behavior.
In summary, the theoretical framework constructed is shown in Figure 1.
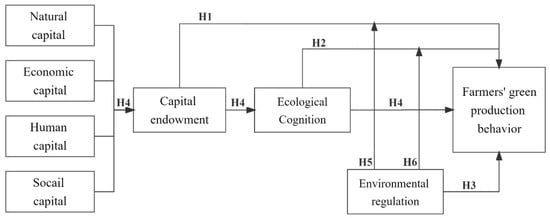
Figure 1.
The theoretical framework.
3. Materials and Methods
3.1. Data
The data used in this study were obtained from a household survey regarding farmers who grew crops in four areas of Haikou City, Qiongzhong Li and Miao Autonomous County, Lingshui Li Autonomous County, and Dongfang City in Hainan Province, China, in July 2021. The following reasons were considered in selecting the sample areas: First, the four different sample areas represent different levels of agricultural development in Hainan Province, which leads to differences in farmers’ behaviors. Dongfang, as the major agricultural city of Hainan, has maintained a leading position in agricultural development, the development scale of Haikou is inferior to Dongfang, Lingshui is in the middle, while Qiongzhong’s development is relatively low [69]. Second, Hainan Island features high terrain in the middle and low surrounding. With Wuzhi Mountain and Yingge Mountain as its core, the island’s topography forms a ring-shaped layer consisting of mountains, hills, plateaus, and plains, forming an ecological function area, a mountain forestry economic area, a hilly cash crop cultivation area, and a plain farming area [70]. The four areas are situated in the northern, central, western, and southeastern parts of Hainan Island, collectively encompassing the island’s geographic and agricultural regions from the inside out. In addition, these are typical and priority areas for the promotion of agricultural green production in Hainan. The study areas are shown in Figure 2.
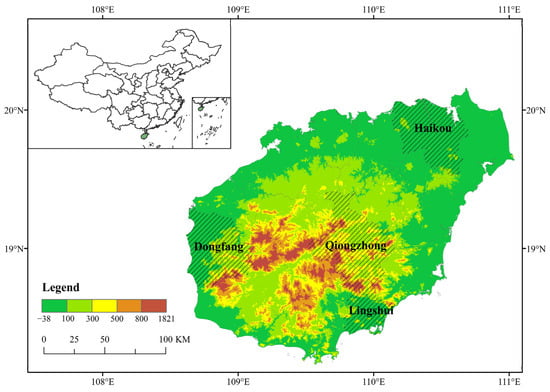
Figure 2.
Location of the study areas in Hainan Island, China.
A combination of stratified multilevel and random sampling was used for sampling. To begin, Haikou, Qiongzhong, Lingshui, and Dongfang were chosen based on the representativeness, agricultural development level, regional distribution, and agricultural production condition. Next, for each city or county, 2 to 4 townships were randomly selected. Thirdly, 1 to 3 administrative villages were randomly selected in each township, and 2 to 5 natural villages were randomly selected in each administrative village. Finally, 10 to 20 respondents were randomly selected from each natural village for a “one-on-one” interview, which was conducted with household heads or family members involved in production and management decisions making and lasted 30 to 40 min. The survey content mainly included information on personal and family characteristics, agricultural production and operation status, farmers’ cognition, willingness for and behavior toward green production, and farmers’ ecological cognition. To ensure data quality, the interviewers received formal intensive training and simulation exercises prior to the survey. A total of 666 questionnaires were distributed; excluding those with missing data and conflicting information, 543 were valid, with an efficiency rate of 81.53%.
The basic characteristics of the sample farmers are shown in Table 1. The respondents were mainly male, accounting for 74.22%. Most of the respondents were middle-aged, with 63.54% aged 40 to 60, indicating that with urbanization, most young and strong rural laborers migrate to work, and the farmers presently engaged in agricultural production are older, in line with the current situation in rural China. The overall education level of the respondents was medium, with 72.19% being in junior high school or above. The family farmland area was concentrated in less than ten mu, of which 33.89% was less than five mu. The majority of farmland plots ranged from 5 to 8, indicating a prevalent trend towards small-scale and decentralized agricultural operations in Hainan, China. We derived the annual net income per capita of CNY 12,800 based on the average annual household income of CNY 57,500 and the average household size of 4.49 people, which was in relative agreement with the official data of CNY 16,000 per capita disposable income for rural residents in Hainan Province in 2020. The mean of the age, years of education, and average household size also matched the data in the statistical yearbook [69]. All these data indicate that the sample was moderately representative.

Table 1.
Sample characteristics.
As shown in Table 2, 95.21% of the sample farmers were involved in green production, among which the proportions of soil testing and formulated fertilization technology, agricultural mulch film recycling, organic fertilizer application, straw returning, and pesticide packaging waste recycling were 10.87%, 22.47%, 48.43%, 48.80%, and 82.14%, respectively. This shows the low participation rate in soil testing and formulated fertilization technology and agricultural mulch film recycling, while the initiative and enthusiasm of farmers to recycle pesticide packaging waste was relatively high. Due to the low implementation rate of formula fertilization promotion, farmers rely more on professionals in the agricultural sector to adopt this behavior, resulting in a high threshold for technology adoption. Participation in organic fertilizer application and straw returning was at a medium level, probably related to their higher economic costs. For agricultural waste recycling, it is more convenient for farmers to collect pesticide packaging waste in the field, as pesticide packaging has significant residues of hazardous substances. However, recycling of agricultural mulch film requires higher human and economic costs.
Table 2.
Sample distribution of the type of farmers’ green production behaviors.
In terms of the number of green production behaviors, it can be observed that the number of agricultural green production practices among farmers in the four study areas in Hainan was concentrated in the range of 1–3 practices (Table 3), with a very low proportion of farmers further enhancing their adoption level. The number of farmers’ green production behaviors was 22.28%, 38.31%, 26.15%, 7.00%, and 1.47% of the samples with 1, 2, 3, 4, and 5, respectively (Figure 3), which also shows the limited overall intensity of involvement in green production.
Table 3.
Sample size and distribution of the number of farmers’ green production behaviors in each city (county).
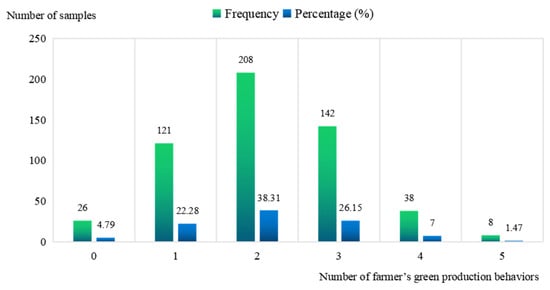
Figure 3.
Sample distribution of the number of farmers’ green production behaviors.
3.2. Core Variables
The dependent variable is farmers’ green production behavior, measured by the number of green production behaviors in which farmers are involved [34], with a nonnegative whole value from 0 to 5. This study takes farmers’ multiple green production behaviors, including soil testing and formulated fertilization technology, organic fertilizer application, straw returning, pesticide packaging waste recycling, and agricultural mulch film recycling. Questionnaires were designed with the questions “Do you use soil testing and formulated fertilization technology?” “How do you deal with straw, pesticide packaging waste, and agricultural mulch film?” and “annual input of organic fertilizer (catties)” as identification criteria.
Capital endowment is the core independent variable in this paper. Consistent with relevant studies [14,16,21,22], we establish an indicator system of capital endowment from the four aspects of natural, economic, human, and social capital, and adopt the entropy method to assign weight to 15 indicators to calculate the dimensional and aggregate scores of capital endowment. The entropy method utilizes information entropy to calculate the discrete degree of indicator, which is an objective, comprehensive, and priori result-free method for the evaluation of multiple indicators’ system [21]. The smaller the information entropy, the greater the amount of information provided by the indicator. Hence, the greater the weight of the indicator, the greater its role in the comprehensive analysis, and vice versa. The design and weight of the indicators are presented in Table 4.
Table 4.
Construction of the indicator system for capital endowment.
Ecological cognition is the independent variable that this study is concerned with, and it is a latent variable that cannot be directly observed. Hence, we designed the 14 measurement items in Table 5 to construct an indicator system of farmers’ ecological cognition including four dimensions of rural ecological perception, rural ecological policy knowledge, rural ecological protection responsibility awareness, and rural green production and living action understanding [26], while using exploratory factor analysis to measure farmers’ ecological cognition [71]. As shown in Table A1 (see Appendix A), we first confirmed that the factor analysis of ecological cognition was appropriate, as indicated by Cronbach’s alpha value of 0.707, KMO value of 0.758, and Bartlett’s sphericity test p-value of 0.000. Then, through varimax rotation corresponding to characteristic roots greater than one, we identified four common factors that contributed 57.989% to ecological cognition. These factors were named according to their maximum loading value on the observation indicators and included action understanding, policy knowledge, responsibility awareness, and ecological perception. Finally, the ecological cognition score of farmers was calculated based on the factor score and cumulative variance contribution. Specifically, ecological cognition = (16.593% × action understanding + 14.646% × policy knowledge + 14.047% × responsibility awareness + 12.703% × ecological perception) ÷ 57.989%.
Table 5.
Construction of the indicator system for ecological cognition.
This study also considered environmental regulation as the core independent variable and focused on guidance-based, incentive-based, and constraint-based regulation [57]. Farmers’ access to the above three types of government environmental regulations is shown in Table 6. We assessed environmental regulation by taking the arithmetic mean for publicity and education, extension services, and binding supervision.
Table 6.
Construction of the indicator system for environmental regulation.
Following previous studies [4,7,12], the characteristics of the individual, agricultural production operation, and external environment were required as control variables. Specifically, farmers’ characteristics involve sex, age, and ethnicity, while agricultural production operation is marked by production fluctuations and product certification. For external environmental characteristics, publicity and education, village committee regulation, and access to dedicated agricultural waste facilities are introduced. Meanwhile, regional dummy variables are introduced to compare green production across regions.
The definition, assignment, and descriptive statistics of variables are shown in Table 7.
Table 7.
Definition, assignment, and descriptive statistics of variables.
3.3. Methods
Farmers’ green production behavior is an ordered discrete variable ranging from 0 to 5. Accordingly, we employed the ordered probit model for regression analysis. The empirical model was set as follows:
In Equations (1) and (2), represents the latent variable of farmers’ green production behavior and is used to derive a maximum likelihood estimator. represents the number of green production practices participated in by farmers. CE, EC, ER, and Control refer to the capital endowment or its dimensions (natural, economic, human, and social capital), ecological cognition, environmental regulation, and a series of control variables, respectively. denotes the estimated coefficient, and denotes a random disturbance term obeying standard normal distribution. Equation (2) shows the relationship between and . , , , , and are unknown split points of the number of farmers’ participation in green production practices, and < < < < . The resulting probabilities of the number of farmers’ participation in green production practices, respectively, are:
In Equation (3), signifies the explanatory variables, is the estimated coefficient, and represents the standard normal distribution’s cumulative probability density function.
To enhance the analysis of the mediation effect of ecological cognition in capital endowment and its dimensions influencing farmers’ green production behavior, we established the following model using the Karlson-Holm-Breen (KHB) method proposed by Kohler et al. [72]:
Equation (4) is the regression of capital endowment or its dimensions (CE) on farmers’ green production behavior (Y), while Equation (5) further includes ecological cognition (EC) in the regression. By regressing EC on CE and obtaining the residual®, we can replace EC with R in Equation (5) and perform further regression to obtain Equation (6). , , and are the constant terms, , , , , , , , and represent the estimated coefficients of the above variables, and , , and denote the residual terms. The mediation effect holds if there is a significant difference between and .
Referring to the moderation effect approach proposed by Jiang et al. [67], we constructed the following model to examine how environmental regulation moderates the relationship between capital endowment, ecological cognition, and farmers’ green production behavior:
Y, CE, EC, ER, and Control in Equation (7) refer to farmers’ green production behavior, capital endowment, ecological cognition, environmental regulation, and the control variables, respectively. The interaction terms CE ∗ ER and EC ∗ ER respectively reflect the moderating effects of environmental regulation on capital endowment and ecological cognition. , , , , , and are the estimated coefficients, and εi is the random disturbance term.
4. Results
The results of the regression analysis are shown in Table 8. Before regression, we tested for multicollinearity by calculating the VIFs, which ranged from 1.06 to 1.26, satisfying the independence principle of variables. Model 1 was derived by incorporating capital endowment, ecological cognition, and environmental regulation as independent variables. Then, the impacts of various dimensions of capital endowment were further analyzed to obtain model 2. Model 3 presents the average marginal effects based on Models 1 and 2.
Table 8.
Estimation result and marginal effect of the ordered probit model.
4.1. Benchmark Regression Analysis
From Model 1, the coefficient of capital endowment was positive at the 1% significance level, which indicates that the abundant available resources can meet the requirements arising from farmers’ green production behavior. Model 2 demonstrates that dimensions of capital endowment positively affect farmers’ green production behavior. Natural and social capital are significant at the 10% level, human capital is significant at the 5% level, while economic capital exhibits significance at the 1% level. As the capital endowment increases in each dimension, farmers are more inclined to participate in green production. Possible explanations for these findings are that higher natural capital can lead to greater expectations of long-term scale returns in agriculture, making green production a good option for higher yields and lower costs. More prosperous economic resources allow farmers to invest and take on more risk in green production. Additionally, having more human and social capital can provide high quantity and quality of labors and increase trust and acceptance to engage in green production. Thus, hypothesis H1 is verified. Model 1 and Model 2 show that ecological cognition has a positive impact on farmers’ green production behavior at the 5% significance level, which confirms hypothesis H2. Ecological cognition makes farmers more aware of the impact of agricultural practices on the ecology. Additionally, it aids in the growth of their ecological perception, behavioral tendencies, knowledge bank, and consciousness of accountability for transitioning to eco-friendly practices. As a result, farmers are motivated to proactively participate in green production, ultimately contributing to the betterment of local agricultural and rural environments. In addition, the effect of environmental regulation is positive at the 1% significance level, signaling that environmental regulation, as a formal institutional representation of farmer behavior, has prompted farmers to place a greater emphasis on ecological preservation throughout the production process, thereby promoting the development of green production. Therefore, hypothesis H3 is confirmed.
In terms of the other controlled variables, sex and age are not the main factors affecting the farmers’ green production behavior. The outflow of male and young agricultural labor may cause this. Ethnic minority farmers are more inclined towards green production compared to Han farmers at the 1% significance level. The field survey conducted in Hainan Province reveals that ethnic minorities, such as the Li and Miao, still uphold a deep respect and appreciation for nature through their eco-friendly farming practices. The fluctuation in production is positive and statistically significant at the 5% level. To ensure consistent benefits and achieve sustainable development, farmers focus on factors affecting agricultural output, including farmland quality and technological inputs, and thus become more involved in green production. Unusually, the certification of agricultural products has a negative impact, probably due to information asymmetry and imperfect market mechanisms, causing farmers to stick to traditional production, as the economic benefits of certified products cannot offset the added costs. At the 5% significance level, the village agricultural waste collection site contributed to farmers’ green production, as it provided farmers with convenient waste disposal options. The failure of the village committee regulation to pass the significance test could be attributed to its informal nature, limited ability to motivate and supervise, and poor practical implementation. The regional dummy variable is significant at the 1% level. According to the field survey and the Hainan Provincial Statistical Yearbook 2021 [69], Haikou, Lingshui, and Dongfang had higher agricultural output and proportion in 2020 than Qiongzhong. However, their ecological quality is inferior. Hence, farmers in these areas favor green production more than Qiongzhong.
4.2. Marginal Effect Analysis
The Oprobit model’s regression coefficients provide limited information on the significance and direction [34]. Additionally, the nonlinear model suggests that the behavior of individuals at the sample mean differs from the average behavior of individuals in the sample [73]. To address this, the average marginal effect of each explanatory variable is further calculated to determine how a 1-unit change in the explanatory variable affects the probability of each value of the explained variable. From the results of Model 3, the marginal effect of each explanatory variable can be summarized as follows. Firstly, the impact of the explanatory variables on farmers’ green production behavior is consistent with the benchmark regressions in terms of significance and direction. Secondly, variables with a positive overall effect show a “− + −” trend, while those with a negative overall effect show a “+ − +” trend. Thirdly, inflection points are evident in the marginal effects of the explanatory variables, with the first at “number = 1” and the second at “number = 3”. The sign of each variable’s marginal effect changes at “number = 3”. Analyzing the variables with an overall positive impact, the probability of “number = 1” decreases less than “number = 0”. The possible reason is that farmers may resist transitioning to green production due to loss aversion, as it could disrupt the efficiency and low cost of traditional agricultural practices. Tempted by short-term benefits, farmers perceive that engaging in agricultural green production will lead to greater losses, thus diminishing their individual utility. The variables’ marginal effects exhibited an inverted U-shaped pattern subsequent to the farmers’ boundary alteration between green production non-participation and participation, which aligns with agricultural production theory. In the case of “number = 1–3”, farmers aim to obtain a growing marginal effect by increasing each variable. However, the probability of “number = –5” dwindles as the level of each variable escalates, and farmers are inclined to maintain the current level of each variable to prevent a decrement in the marginal effect.
4.3. Mediation Effect Test of Ecological Cognition
The KHB model result in Table 9 demonstrates the significant mediation effect of ecological cognition between capital endowment and farmers’ green production behavior. with a 0.191 effect size at a 5% significance level, accounting for 9.17% of the total effect. Furthermore, in the dimensional decomposition of capital endowment, ecological cognition partially mediates between human capital, social capital, and green production behavior. These mediation effects are significant at the 1% level with sizes of 0.978 and 0.537, accounting for 16.64% and 20.98% of the total effect, respectively. The results suggest that elevated levels of capital endowment, human capital, and social capital facilitate heightened ecological cognition, subsequently fostering farmers’ engagement in environmentally-friendly practices. Nevertheless, the mediating role of ecological cognition between natural capital, economic capital, and farmers’ green production behavior is invalid. Explanations could be that agricultural green production is a set of ecological behaviors with high inputs and slow results, and farmers consider that the costs of adopting green production practices will be high as natural capital increases, without considering the invisible and long-term outputs from sound ecology. Thus, natural capital does not significantly reinforce ecological cognition. As for economic capital, farmers’ current level of economic capital is insufficient to break through the physiological demand hierarchy. This forces farmers to pursue the economic accumulation of increased agricultural production and income, curbing their enthusiasm to make the rural environment livable. In general, hypothesis H4 is partially verified.
Table 9.
KHB mediation effect test.
4.4. Moderation Effect Test of Environmental Regulation
Model 4 in Table 10 with the interaction term has a higher Pseudo R2 compared to Model 1, indicating an improvement in the explanatory power of the model. The interaction term between capital endowment and environmental regulation is not significant. Possibly, the ineffectiveness and poor implementation of existing measures of environmental regulation inhibit their ability to moderate the impact of capital endowment on farmers’ green production behavior, ultimately resulting in insignificant empirical results. The interaction term between ecological cognition and environmental regulation is significant at the 1% level with a positive effect. It is suggested that environmental regulation plays an enhanced moderating role in ecological cognition on farmers’ green production behavior. Environmental regulation implemented by the government possesses a certain degree of obligation and serves as vehicles for conveying norms and requirements, thereby strengthening farmers’ comprehension and execution abilities in decision making. Despite farmers’ limited ecological cognition, they still comply with the implementation requirements set by the government and engage in green production. Thus, hypothesis H6 is confirmed, while hypothesis H5 fails to be supported. The interaction effect in Figure 4 shows that the magnitude of the congruent enhancement of ecological cognition and farmers’ green production behavior increases to a greater extent at higher environmental regulation (β = 0.442 ***, t = 3.770, p = 0.000) compared to lower environmental regulation (β = −0.053, t = −0.445, p = 0.656).
Table 10.
Moderation effect test.
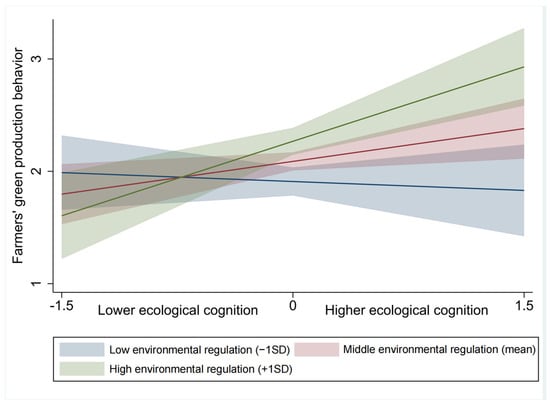
Figure 4.
Interaction effect of ecological cognition and environmental regulation, with 95% CIs.
5. Discussion
5.1. Endogeneity Discussion
Ecological cognition as a subjective consciousness influences farmers’ decision making, while active involvement in green production enhances farmers’ concern for ecological benefits and ecological knowledge reserve [73]. However, the direct impact of green production behavior on capital endowment and environmental regulation remains challenging [15,39]. The endogeneity issue of reversed causality may be observed between ecological cognition and farmers’ green production behavior. Considering that the explained variable is ordered discrete, we used the Conditional Mixed Process (CMP) method [74] and chose information literacy and economic interest pursuit as instrumental variables of ecological cognition to solve the above problem. Information literacy is measured by “farmers’ ability to distinguish the authenticity of internet information” and is represented by the values of 0, 1, and 2 for inability, uncertainty, and ability, respectively. Economic interest pursuit is assigned a value of 1–5 from fully agree to disagree based on the “farmer believes that environmental protection would limit the pursuit of economic benefits”. Referring to Chyi and Mao [75], we determine the instrumental variables’ validity by statistical tests of the linear model (see Table A2). The IVoprobit_CMP results are shown in Table 11. The lnsig_2 value indicates the model result is significant at the 1% level, while the endogeneity test parameter atanhrho_12 rejects the original hypothesis of “ecological cognition as an exogenous variable” at 10% significance level, implying the instrument variables are exogenous. The first stage of the IVoprobit_CMP showed a significant correlation between information literacy, economic interest pursuit, and ecological cognition. In the second stage, after correcting for endogeneity bias, the impact of ecological cognition was found to be more pronounced with a significantly larger coefficient. Failure to address endogeneity may result in an underestimation of the model result. The marginal effect of ecological cognition shows that after controlling for the endogeneity problem, a 1 unit rise in ecological cognition yields a decrease of 7.1%, 13.0%, and 2.0%, and an increase of 12.1%, 7.4%, and 2.6% in the probability of “number = 0–5”, respectively. This result also further validates the aforementioned conclusion.
Table 11.
Re-estimation results of the Ivoprobit_CMP and PSM.
Farmers’ ecological cognition is influenced by various factors such as demographic characteristics, production and operation characteristics, and social environment characteristics, which may lead to sample self-selection bias [63]. To address this issue, Propensity Score Matching (PSM) was employed to establish a counterfactual framework. The sample was divided into two groups, with farmers who had ecological cognition above the mean as the treatment group and those below the mean as the control group. The k-nearest neighbor matching method (K = 3) was used for the matching test. Table A3 presents the balance test results. After matching, the means of the matched variables were similar for the treatment and control groups, with the absolute values of the standard deviations below 10%. The t-test results support the original hypothesis that there were no systematic differences between the matched variables in the treatment and control groups. These results suggest that the significant differences between the two groups of farmers after PSM were mostly eliminated, indicating a good matching effect. Table 11 displays the oprobit results for the matched sample, revealing that capital endowment, ecological cognition, and environmental regulation still had significant effects on farmers’ green production behavior after potential self-selection bias was eliminated.
Drawing on Altonji et al. [76] and Nunn and Wantchekon [77], we used controlled observable variables to estimate changes in the coefficients of the core explanatory variables, thus providing a measure of the potential impact of omitted variable bias. First, restrained Model 1 was built using the core explanatory variables. Then, restrained Model 2 was developed by incorporating farmers’ individual characteristics, and the estimated coefficients βR of the core explanatory variables under both restrained models were obtained. Second, based on the restrained models, we added production and operation variables as well as external environment variables to obtain the estimated coefficients βF for the core explanatory variables in full Models 1 and 2. Finally, we calculated the omitted variable bias coefficient σ = |βF/(βR − βF)|. Theoretically, σ is greater than 1. A larger σ indicates a lower probability of estimation bias due to the omitted variables [76]. As shown in Table 12, the σ of the core explanatory variables exceeded 1, which suggests that endogeneity issues arising from the omitted variables can be largely excluded.
Table 12.
Estimation results of the restrained model and the full model.
5.2. Robustness Test
The robustness of the benchmark regression was tested using model replacement and excluding the sample of elderly people aged above 65 years [39]. As evidenced by Models 5–10 in Table A4, the direction and significance of each explanatory variable were highly consistent with the benchmark regression, indicating that the estimation results were robust. We further applied the Ivoprobit_CMP method to test the robustness of the moderation effect while controlling for endogeneity. The result of Model 11 (see Table A4) further supports that environmental regulation and ecological cognition can synergistically contribute to the enhancement of farmers’ green production behavior. The robustness of the mediation effect was tested using the bootstrap method, which offers superior confidence intervals and stronger statistical power [78]. A significant mediation effect is confirmed when the 95% confidence interval excludes 0. The bootstrap test results shown in Table A5 underscored the significance of ecological cognition as a crucial channel through which capital endowments, human capital, and social capital exert influence on farmers’ green production behavior, thus affirming the validity of our conclusions.
5.3. Consistency with Existing Research
This study analyzes farmers’ participation in agricultural green production and its determinants. Based on the analysis above, we know that the number of farmers’ green production behaviors is in the range of 1–3 types, and farmers’ level of involvement still requires further enhancement. This finding is in line with the results obtained by Du et al. [4] and Benitez-Altuna et al. [7]. Consistent with the study of Keil et al. [40], we connect the four resource endowments of sustainable livelihood theory to farmers’ green production practices, confirming the positive role of capital endowments. Meanwhile, we provide insights into the mediating transmission mechanisms through which capital endowment ultimately affects green production behavior by changing ecological cognition, and the conclusions are consistent with those of Qiao et al. [63] and Luo et al. [73]. For the citation of the bounded rationality and externality theory, our conclusion supports the work of Xu et al. [10], who argued that ecological cognition and environmental regulation significantly positively affect farmers’ green production. Furthermore, the synergy of environmental regulation and ecological cognition reconfirms the empirical results of Li et al. [68]. Overall, in light of Baumgart-Getz et al. [11], a more systematic and scientific approach has been considered to gain insight into farmers’ green practices through a joint investigation of socioeconomic traits and psychological aspects in this work.
5.4. Limitations
Limitations inevitably existed in this study. First, it ignored the correlation between farmers’ multiple green production behaviors. Further studies should apply a multivariate probit model to explore the alternative or complementary relationships in farmers’ green production behaviors. Second, it neglected the structural heterogeneity of capital endowment. Farmers’ green production not only depends on the support of dominant capital endowment but also requires a reasonable structural allocation of capital endowment and matching of factor transformation. Future research can examine the effects of different capital structures on farmers’ green production behavior. Third, it neglected to distinguish farmers in terms of growing different types of crops. Tropical crops such as pepper, coffee, betel nut, and natural rubber are grown in Hainan, and farmers who grow different crops differ in their green production behavior. We can identify types of farmers more accurately and conduct global comparative studies due to Hainan’s particular tropical setting, which might provide a valuable reference for the interactive integration of tropical plantations in Hainan, countries along the Belt and Road Initiative, and the Association of Southeast Asian Nations countries.
5.5. Policy Implications
This paper provides several policy implications. First is the need to advance the green transformation of the whole process of agricultural production. Since agricultural green production is an integrated behavioral process covering the entire production link, it is necessary to consider the constraints of farmers’ participation in green production in different links and develop policies that meet farmers’ interests. Second, farmers’ capital endowment needs to be improved in multiple dimensions. Capital endowment is an essential basis for farmers’ behavioral decisions. Farmers with relatively weak capital endowments dominate agricultural production and operation. Total capital endowment should be strengthened to break through the short-term effect that restricts participation in various green practices. Third is the need to enhance farmers’ ecological cognition through multiple channels. This includes raising farmers’ attention to green production and rural ecology, popularizing ecological knowledge and policies in various popular ways, encouraging farmers to form a green production and lifestyle, and actively cultivating farmers’ sense of ecological conservation ownership. Fourth, to create an external environment compatible with green production, the government should further strengthen the guidance and supervision of green production and increase the supply of supporting infrastructure, such as waste facilities at the village level. We should also maximize the function of ecological culture and inject cultural connotations into agriculture green development.
6. Conclusions
In conclusion, this study highlights the need for promoting the adoption of green production practices among farmers in Hainan Province, China, to enhance rural ecological protection and promote sustainable agricultural development. The findings reveal that only a small proportion of farmers consistently adopt green production practices throughout various stages of agricultural production. The study demonstrates that capital endowment, including natural, economic, human, and social capital, has a significant influence on farmers’ green production behavior. In addition, ecological awareness plays a crucial role in mediating the relationship between capital endowment and its dimensions (human and social capital) and the adoption of green production practices. Furthermore, the synergy of environmental regulation and ecological cognition on farmers’ green production behavior can be achieved. The research indicates that factors such as ethnicity, fluctuations in agricultural production, and the location of the village agricultural waste collection site are all significant determinants of farmers’ engagement in green production practices. The study also identifies significant regional disparities in farmers’ adoption of green production practices. To address the issue of farmers’ low adoption of green production practices, this paper recommends promoting the overall green transformation of the entire agricultural production process. This can be achieved by enhancing farmers’ capital endowment in multiple dimensions and improving their ecological awareness through various channels. Creating a supportive external environment that aligns with green production practices is also deemed critical.
Author Contributions
Conceptualization, X.X.; methodology, X.X. and F.W.; software, X.X. and F.W.; validation, X.X. and S.U.K.; formal analysis, X.X.; investigation, X.X., F.W. and T.X.; resources, T.X.; data curation, X.X. and F.W.; writing—original draft preparation, X.X.; writing—review and editing, S.U.K.; visualization, S.U.K.; supervision, F.W.; project administration, T.X.; funding acquisition, T.X. All authors have read and agreed to the published version of the manuscript.
Funding
This research was funded by the National Banana Industry Technical System Industrial Economic Position (No. CARS-31-15), the National Natural Science Foundation of China (No. 72103052, No. 72003054), and the Hainan Provincial Natural Science Foundation of China (No. 722RC630, No. 720RC576, No.720QN243).
Institutional Review Board Statement
Not applicable.
Informed Consent Statement
Not applicable.
Data Availability Statement
Data will be made available on request from the corresponding author.
Acknowledgments
We acknowledge the enumerators and sample respondents for providing the data used for this study.
Conflicts of Interest
The authors declare no conflict of interest.
Appendix A
Table A1.
Results of Exploratory Factor Analysis.
Table A1.
Results of Exploratory Factor Analysis.
| Observation Indicator | Factor 1 | Factor 2 | Factor 3 | Factor 4 | Communality |
|---|---|---|---|---|---|
| Status of rural animals | −0.144 | −0.042 | 0.041 | 0.811 | 0.681 |
| Status of rural plants | −0.033 | −0.052 | 0.032 | 0.859 | 0.742 |
| Status of rural ecology | 0.298 | 0.039 | −0.055 | 0.508 | 0.352 |
| Understanding of “ecology” | 0.232 | 0.762 | 0.099 | −0.065 | 0.649 |
| Understanding of “global warming” | 0.471 | 0.585 | 0.012 | 0.094 | 0.573 |
| Understanding of “lucid waters and lush mountains are invaluable assets” | 0.319 | 0.715 | 0.135 | −0.04 | 0.633 |
| Understanding of government ecological policies | −0.044 | 0.634 | 0.144 | −0.015 | 0.425 |
| Participate in rural garbage sorting | 0.153 | 0.151 | 0.680 | −0.088 | 0.516 |
| Learn knowledge and technology | 0.059 | 0.178 | 0.772 | −0.005 | 0.631 |
| Provide voluntary labor | −0.016 | 0.116 | 0.677 | −0.015 | 0.472 |
| The necessity of rural governance | 0.231 | −0.072 | 0.567 | 0.166 | 0.408 |
| CO2 emissions | 0.836 | 0.263 | 0.113 | −0.077 | 0.787 |
| Energy saving | 0.833 | 0.244 | 0.126 | −0.138 | 0.789 |
| Hazards of phosphorus-containing detergents | 0.599 | 0.071 | 0.213 | 0.225 | 0.46 |
| Characteristic root | 2.323 | 2.050 | 1.967 | 1.778 | |
| Variance contribution (%) | 16.593 | 14.646 | 14.047 | 12.703 | |
| Cumulative variance contribution (%) | 16.593 | 31.239 | 45.286 | 57.989 | |
| KMO measure of sampling adequacy | 0.758 | ||||
| Cronbach’s Alpha | 0.707 | ||||
Table A2.
Instrumental variable test.
Table A2.
Instrumental variable test.
| Test | Endogeneity Test | Relevance Test | Overidentification Test |
|---|---|---|---|
| Hausman test | 3.266 * | ||
| (0.071) | |||
| Kleibergen–Paap rk LM statistic | 53.527 *** | ||
| (0.000) | |||
| Kleibergen–Paap Wald rk F statistic | 31.767 | ||
| [19.93] | |||
| Hansen J statistic | 0.475 | ||
| (0.491) |
Note: * and *** denote significance at the 10% and 1% levels. p-value is in parentheses; the 10% critical value of the Stock–Yogo test is in square bracket.
Table A3.
Balance test results.
Table A3.
Balance test results.
| Variable | Unmatched | Mean | Bias (%) | Reduct |Bias| (%) | t-Test | |
|---|---|---|---|---|---|---|
| Matched | Treated | Control | ||||
| Sex | U | 0.815 | 0.678 | 31.80 | 3.67 *** | |
| M | 0.813 | 0.817 | −0.8 | 97.6 | −0.10 | |
| Age | U | 48.598 | 51.260 | −24.70 | −2.86 *** | |
| M | 48.583 | 48.273 | 2.9 | 88.3 | 0.32 | |
| Ethnicity | U | 0.665 | 0.716 | −11.0 | −1.28 | |
| M | 0.663 | 0.657 | 1.2 | 89.0 | 0.13 | |
| Fluctuations in agricultural production | U | 3.142 | 2.886 | 18.0 | 2.09 ** | |
| M | 3.131 | 3.216 | −6.0 | 66.7 | −0.69 | |
| Certification of agricultural products | U | 0.055 | 0.014 | 22.7 | 2.69 *** | |
| M | 0.048 | 0.032 | 8.7 | 61.5 | 0.91 | |
| Village committee regulation | U | 0.091 | 0.076 | 5.2 | 0.61 | |
| M | 0.091 | 0.097 | −2.0 | 61.0 | −0.22 | |
| Agricultural waste collection site | U | 0.157 | 0.097 | 18.2 | 2.13 ** | |
| M | 0.155 | 0.140 | 4.6 | 74.9 | 0.48 | |
| Regional dummy variable | ||||||
| Haikou | U | 0.390 | 0.374 | 3.3 | 0.38 | |
| M | 0.385 | 0.388 | −0.7 | 79.4 | −0.08 | |
| Lingshui | U | 0.224 | 0.225 | −0.1 | −0.01 | |
| M | 0.226 | 0.213 | 3.1 | −2458.7 | 0.35 | |
| Dongfang | U | 0.150 | 0.204 | −14.3 | −1.66 * | |
| M | 0.151 | 0.154 | −1.0 | 93.3 | −0.11 | |
Note: *, **, and *** denote significance at the 10%, 5%, and 1% levels, respectively. Standard errors are in parentheses.
Table A4.
Robustness tests of the benchmark regression and moderation effect.
Table A4.
Robustness tests of the benchmark regression and moderation effect.
| Variable | Model 5 | Model 6 | Model 7 | Model 8 | Model 9 | Model 10 | Model 11 |
|---|---|---|---|---|---|---|---|
| Ologit | Ologit | OLS | OLS | Oprobit | Oprobit | Ivoprobit_CMP | |
| Capital endowment | 3.137 *** | 1.577 *** | 1.772 *** | 1.474 *** | |||
| (0.632) | (0.307) | (0.374) | (0.403) | ||||
| Natural capital | 5.829 * | 3.036 * | 4.669 ** | ||||
| (3.480) | (1.769) | (2.115) | |||||
| Economic capital | 3.021 *** | 1.439 *** | 1.479 ** | ||||
| (1.112) | (0.541) | (0.652) | |||||
| Human capital | 5.527 * | 2.755 * | 2.332 | ||||
| (2.831) | (1.419) | (1.746) | |||||
| Social capital | 2.070 * | 1.087 * | 1.243 * | ||||
| (1.199) | (0.609) | (0.741) | |||||
| Ecological cognition | 0.375 ** | 0.387 ** | 0.198 ** | 0.201 ** | 0.203 * | 0.207 * | 0.670 ** |
| (0.172) | (0.177) | (0.087) | (0.089) | (0.107) | (0.110) | (0.274) | |
| Environmental regulation | 0.888 *** | 0.864 *** | 0.460 *** | 0.446 *** | 0.660 *** | 0.656 *** | 0.446 ** |
| (0.280) | (0.281) | (0.138) | (0.140) | (0.171) | (0.173) | (0.193) | |
| Capital endowment × Environmental regulation | −0.366 | ||||||
| (1.074) | |||||||
| Ecological cognition × Environmental regulation | 0.823 *** | ||||||
| (0.282) | |||||||
| Sex | −0.025 | −0.036 | −0.000 | −0.007 | −0.003 | −0.012 | −0.055 |
| (0.203) | (0.203) | (0.101) | (0.102) | (0.123) | (0.123) | (0.122) | |
| Age | −0.010 | −0.010 | −0.005 | −0.005 | 0.002 | 0.002 | −0.005 |
| (0.008) | (0.008) | (0.004) | (0.004) | (0.006) | (0.006) | (0.005) | |
| Ethnicity | −0.993 *** | −0.989 *** | −0.440 *** | −0.432 *** | −0.511 *** | −0.510 *** | −0.479 *** |
| (0.292) | (0.294) | (0.138) | (0.139) | (0.165) | (0.167) | (0.159) | |
| Fluctuations in agricultural production | 0.143 ** | 0.140 ** | 0.070 ** | 0.068 ** | 0.069 ** | 0.067 * | 0.068 * |
| (0.058) | (0.058) | (0.029) | (0.029) | (0.035) | (0.035) | (0.035) | |
| Certification of agricultural products | −0.691 | −0.789 * | −0.371 | −0.406 * | −0.470 * | −0.498 * | −0.502 * |
| (0.453) | (0.465) | (0.227) | (0.232) | (0.261) | (0.267) | (0.260) | |
| Village committee regulation | 0.213 | 0.224 | 0.137 | 0.142 | 0.136 | 0.138 | 0.173 |
| (0.296) | (0.299) | (0.151) | (0.152) | (0.179) | (0.180) | (0.171) | |
| Agricultural waste collection site | 0.588 ** | 0.572 ** | 0.258 ** | 0.251 * | 0.418 *** | 0.415 *** | 0.253 * |
| (0.253) | (0.253) | (0.127) | (0.128) | (0.153) | (0.153) | (0.146) | |
| Regional dummy variables | |||||||
| Haikou | 1.495 *** | 1.530 *** | 0.705 *** | 0.720 *** | 0.858 *** | 0.888 *** | 0.765 *** |
| (0.341) | (0.347) | (0.163) | (0.165) | (0.199) | (0.203) | (0.189) | |
| Lingshui | 1.386 *** | 1.484 *** | 0.662 *** | 0.713 *** | 0.844 *** | 0.930 *** | 0.749 *** |
| (0.278) | (0.294) | (0.135) | (0.143) | (0.160) | (0.171) | (0.156) | |
| Dongfang | 1.372 *** | 1.419 *** | 0.609 *** | 0.630 *** | 0.787 *** | 0.807 *** | 0.706 *** |
| (0.367) | (0.382) | (0.176) | (0.183) | (0.213) | (0.223) | (0.202) | |
| Prob > chi2 | 0.000 | 0.000 | 0.000 | 0.000 | 0.000 | 0.000 | |
| Pseudo R2 | 0.082 | 0.084 | 0.093 | 0.094 | |||
| Adjusted R2 | 0.219 | 0.222 | |||||
| lnsig_2 | −0.849 *** | ||||||
| atanhrho_12 | −0.222 * | ||||||
| Obs. | 543 | 543 | 543 | 543 | 481 | 481 | 543 |
Note: *, **, and *** denote significance at the 10%, 5%, and 1% levels, respectively. Standard errors are in parentheses.
Table A5.
Bootstrap mediation effect test.
Table A5.
Bootstrap mediation effect test.
| Function Route | Direct Effect | Indirect Effect | 95% CIs | Percentage of Mediation Effect |
|---|---|---|---|---|
| capital endowment → ecological cognition → farmers’ green production behavior | 1.669 *** | 0.168 ** | [0.062, 0.331] | 9.16% |
| (0.321) | (0.068) | |||
| natural capital → ecological cognition → farmers’ green production behavior | 5.706 *** | 0.344 | [−0.129, 0.985] | - |
| (1.648) | (0.274) | |||
| economic capital → ecological cognition → farmers’ green production behavior | 1.991 *** | −0.027 | [−0.218, 0.149] | - |
| (0.550) | (0.092) | |||
| human capital → ecological cognition → farmers’ green production behavior | 4.312 *** | 0.885 *** | [0.376, 1.678] | 17.02% |
| (1.457) | (0.320) | |||
| social capital → ecological cognition → farmers’ green production behavior | 1.800 *** | 0.486 *** | [0.196, 0.877] | 21.25% |
| (0.611) | (0.173) |
Note: nonparametric percentile Bootstrap method with bias corrected; 5000 bootstrap samples. ** and *** denote significance at the 5%, and 1% levels, respectively. Standard errors are in parentheses.
References
- Zhang, Y.; Long, H.; Li, Y.; Tu, S.; Jiang, T. Non-point source pollution in response to rural transformation development: A comprehensive analysis of China’s traditional farming area. J. Rural. Stud. 2020, 83, 165–176. [Google Scholar] [CrossRef]
- Ministry of Agriculture and Rural Affairs of China. Available online: http://www.moa.gov.cn/nybgb/2021/202109/202112/t20211207_6384006.htm (accessed on 20 August 2022).
- Liu, Y.; Sun, D.; Wang, H.; Wang, X.; Yu, G.; Zhao, X. An evaluation of China’s agricultural green production: 1978–2017. J. Clean. Prod. 2019, 243, 118483. [Google Scholar] [CrossRef]
- Du, S.; Liu, J.; Fu, Z. The Impact of Village Rules and Formal Environmental Regulations on Farmers’ Cleaner Production Behavior: New Evidence from China. Int. J. Environ. Res. Public Health 2021, 18, 7311. [Google Scholar] [CrossRef]
- Qiao, D.; Xu, S.; Xu, T.; Hao, Q.; Zhong, Z. Gap between Willingness and Behaviors: Understanding the Consistency of Farmers’ Green Production in Hainan, China. Int. J. Environ. Res. Public Health 2022, 19, 11351. [Google Scholar] [CrossRef]
- Li, C.; Shi, Y.; Khan, S.U.; Zhao, M. Research on the impact of agricultural green production on farmers’ technical efficiency: Evidence from China. Environ. Sci. Pollut. Res. 2021, 28, 38535–38551. [Google Scholar] [CrossRef] [PubMed]
- Benitez-Altuna, F.; Trienekens, J.; Materia, V.C.; Bijman, J. Factors affecting the adoption of ecological intensification practices: A case study in vegetable production in Chile. Agric. Syst. 2021, 194, 103283. [Google Scholar] [CrossRef]
- Xie, H.; Huang, Y. Influencing factors of farmers’ adoption of pro-environmental agricultural technologies in China: Meta-analysis. Land Use Policy 2021, 109, 105622. [Google Scholar] [CrossRef]
- Liu, Y.; Ruiz-Menjivar, J.; Zhang, L.; Zhang, J.; Swisher, M.E. Technical training and rice farmers’ adoption of low-carbon management practices: The case of soil testing and formulated fertilization technologies in Hubei, China. J. Clean. Prod. 2019, 226, 454–462. [Google Scholar] [CrossRef]
- Xu, X.; Zhang, Z.; Kuang, Y.; Li, C.; Sun, M.; Zhang, L.; Chang, D. Waste pesticide bottles disposal in rural China: Policy constraints and smallholder farmers’ behavior. J. Clean. Prod. 2021, 316, 128385. [Google Scholar] [CrossRef]
- Baumgart-Getz, A.; Prokopy, L.S.; Floress, K. Why farmers adopt best management practice in the United States: A meta-analysis of the adoption literature. J. Environ. Manag. 2012, 96, 17–25. [Google Scholar] [CrossRef] [PubMed]
- Li, H.; Wang, C.; Chang, W.-Y.; Liu, H. Factors affecting Chinese farmers’ environment-friendly pesticide application behavior: A meta-analysis. J. Clean. Prod. 2023, 409, 137277. [Google Scholar] [CrossRef]
- Zhu, J.; Deng, Y. Green Transformation of Agricultural Production: Logic of Formation, Dilemma and Practical Strategy. Reform. Econ. Syst. 2022, 234, 84–89. [Google Scholar]
- Kuang, F.; Jin, J.; He, R.; Wan, X.; Ning, J. Influence of livelihood capital on adaptation strategies: Evidence from rural households in Wushen Banner, China. Land Use Policy 2019, 89, 104228. [Google Scholar] [CrossRef]
- Wang, H.; Wang, X.; Sarkar, A.; Zhang, F. How Capital Endowment and Ecological Cognition Affect Environment-Friendly Technology Adoption: A Case of Apple Farmers of Shandong Province, China. Int. J. Environ. Res. Public Health 2021, 18, 7571. [Google Scholar] [CrossRef] [PubMed]
- Wang, Q.; Miao, Y. The Impact of Family Sustainable Livelihood and Environmental Cognition on Herdsmen’s Choice of Production Behavior. Adv. Mater. Sci. Eng. 2022, 2022, 4278331. [Google Scholar] [CrossRef]
- Burton, R.J. The influence of farmer demographic characteristics on environmental behaviour: A review. J. Environ. Manag. 2014, 135, 19–26. [Google Scholar] [CrossRef]
- Knowler, D.; Bradshaw, B. Farmers’ adoption of conservation agriculture: A review and synthesis of recent research. Food Policy 2007, 32, 25–48. [Google Scholar] [CrossRef]
- Li, Y.; Fan, Z.; Jiang, G.; Quan, Z. Addressing the Differences in Farmers’ Willingness and Behavior Regarding Developing Green Agriculture—A Case Study in Xichuan County, China. Land 2021, 10, 316. [Google Scholar] [CrossRef]
- Marenya, P.P.; Barrett, C.B. Household-level determinants of adoption of improved natural resources management practices among smallholder farmers in western Kenya. Food Policy 2007, 32, 515–536. [Google Scholar] [CrossRef]
- Huang, X.; Wang, L.; Lu, Q. Vulnerability Assessment of Soil and Water Loss in Loess Plateau and Its Impact on Farmers’ Soil and Water Conservation Adaptive Behavior. Sustainability 2018, 10, 4773. [Google Scholar] [CrossRef]
- Ren, J.; Lei, H.; Ren, H. Livelihood Capital, Ecological Cognition, and Farmers’ Green Production Behavior. Sustainability 2022, 14, 16671. [Google Scholar] [CrossRef]
- He, K.; Zhang, J.; Feng, J.; Hu, T.; Zhang, L. The Impact of Social Capital on farmers’ Willingness to Reuse Agricultural Waste for Sustainable Development. Sustain. Dev. 2015, 24, 101–108. [Google Scholar] [CrossRef]
- Schultz, P.W.; Shriver, C.; Tabanico, J.J.; Khazian, A.M. Implicit connections with nature. J. Environ. Psychol. 2004, 24, 31–42. [Google Scholar] [CrossRef]
- Smith, H.F.; Sullivan, C.A. Ecosystem services within agricultural landscapes—Farmers’ perceptions. Ecol. Econ. 2014, 98, 72–80. [Google Scholar] [CrossRef]
- Meng, L.; Si, W. Pro-Environmental Behavior: Examining the Role of Ecological Value Cognition, Environmental Attitude, and Place Attachment among Rural Farmers in China. Int. J. Environ. Res. Public Health 2022, 19, 17011. [Google Scholar] [CrossRef] [PubMed]
- Kollmuss, A.; Agyeman, J. Mind the Gap: Why do people act environmentally and what are the barriers to pro-environmental behavior? Environ. Educ. Res. 2002, 8, 239–260. [Google Scholar] [CrossRef]
- Qing, C.; Guo, S.; Deng, X.; Xu, D. Farmers’ awareness of environmental protection and rural residential environment improvement: A case study of Sichuan province, China. Environ. Dev. Sustain. 2021, 24, 11301–11319. [Google Scholar] [CrossRef]
- Gosling, E.; Williams, K.J. Connectedness to nature, place attachment and conservation behaviour: Testing connectedness theory among farmers. J. Environ. Psychol. 2010, 30, 298–304. [Google Scholar] [CrossRef]
- Meng, F.; Chen, H.; Yu, Z.; Xiao, W.; Tan, Y. What Drives Farmers to Participate in Rural Environmental Governance? Evidence from Villages in Sandu Town, Eastern China. Sustainability 2022, 14, 3394. [Google Scholar] [CrossRef]
- Guo, A.; Wei, X.; Zhong, F.; Wang, P.; Song, X. Does Cognition of Resources and the Environment Affect Farmers’ Production Efficiency? Study of Oasis Agriculture in China. Agriculture 2022, 12, 592. [Google Scholar] [CrossRef]
- Lu, H.; Hu, L.; Zheng, W.; Yao, S.; Qian, L. Impact of household land endowment and environmental cognition on the willingness to implement straw incorporation in China. J. Clean. Prod. 2020, 262, 121479. [Google Scholar] [CrossRef]
- Zhang, L.; Li, X.; Yu, J.; Yao, X. Toward cleaner production: What drives farmers to adopt eco-friendly agricultural production? J. Clean. Prod. 2018, 184, 550–558. [Google Scholar] [CrossRef]
- Huang, Q.; Wang, H.; Chen, C. The Influence of Government Regulation on Farmers’ Green Production Behavior—From the Perspective of the Market Structure. Int. J. Environ. Res. Public Health 2022, 20, 506. [Google Scholar] [CrossRef] [PubMed]
- Pemsl, D.; Waibel, H.; Gutierrez, A.P. Why Do Some Bt-Cotton Farmers in China Continue to Use High Levels of Pesticides? Int. J. Agric. Sustain. 2005, 3, 44–56. [Google Scholar] [CrossRef]
- Liu, C.; Zheng, H. How social capital affects willingness of farmers to accept low-carbon agricultural technology (LAT)? A case study of Jiangsu, China. Int. J. Clim. Chang. Strat. Manag. 2021, 13, 286–301. [Google Scholar] [CrossRef]
- Xiang, W.J.; Chen, J.P.; Fu, X.H. Influencing Factors of Grain Farmers’ Application Behavior to Adopt Organic Fertilizer from the Perspective of Heterogeneity—Based on The Empirical Study of 512 Farmers in Sichuan Province. IOP Conf. Ser. Earth Environ. Sci. 2020, 510, 032030. [Google Scholar] [CrossRef]
- Belay, M.; Bewket, W. Farmers’ livelihood assets and adoption of sustainable land management practices in north-western highlands of Ethiopia. Int. J. Environ. Stud. 2013, 70, 284–301. [Google Scholar] [CrossRef]
- Yu, L.; Wang, W.; Cui, Y.; Zhou, W.; Fu, Z.; He, L. Influence of capital endowment on rural households’ willingness to pay for rural human settlement improvement: Evidence from rural China. Appl. Econ. 2022, 55, 3980–3995. [Google Scholar] [CrossRef]
- Keil, A.; Zeller, M.; Wida, A.; Sanim, B.; Birner, R. What determines farmers’ resilience towards ENSO-related drought? An empirical assessment in Central Sulawesi, Indonesia. Clim. Chang. 2007, 86, 291–307. [Google Scholar] [CrossRef]
- Wang, Y.; Zhu, Y.; Zhang, S.; Wang, Y. What could promote farmers to replace chemical fertilizers with organic fertilizers? J. Clean. Prod. 2018, 199, 882–890. [Google Scholar] [CrossRef]
- Qi, X.; Liang, F.; Yuan, W.; Zhang, T.; Li, J. Factors influencing farmers’ adoption of eco-friendly fertilization technology in grain production: An integrated spatial–econometric analysis in China. J. Clean. Prod. 2021, 310, 127536. [Google Scholar] [CrossRef]
- Tan, S.; Heerink, N.; Kruseman, G.; Qu, F. Do fragmented landholdings have higher production costs? Evidence from rice farmers in Northeastern Jiangxi province, P.R. China. China Econ. Rev. 2008, 19, 347–358. [Google Scholar] [CrossRef]
- Daberkow, S.G.; McBride, W.D. Farm and Operator Characteristics Affecting the Awareness and Adoption of Precision Agriculture Technologies in the US. Precis. Agric. 2003, 4, 163–177. [Google Scholar] [CrossRef]
- Mariano, M.J.; Villano, R.; Fleming, E. Factors influencing farmers’ adoption of modern rice technologies and good management practices in the Philippines. Agric. Syst. 2012, 110, 41–53. [Google Scholar] [CrossRef]
- Mishra, P.; Upadhyay, R. Diagnostic Analysis of Technology Adoption and Factors Influencing Adoption Level of Tribal Farmers of Madhya Pradesh. Econ. Aff. 2018, 63, 1–7. [Google Scholar] [CrossRef]
- Hunecke, C.; Engler, A.; Jara-Rojas, R.; Poortvliet, P.M. Understanding the role of social capital in adoption decisions: An application to irrigation technology. Agric. Syst. 2017, 153, 221–231. [Google Scholar] [CrossRef]
- Foster, A.D.; Rosenzweig, M.R. Learning by Doing and Learning from Others: Human Capital and Technical Change in Agriculture. J. Political Econ. 1995, 103, 1176–1209. [Google Scholar] [CrossRef]
- Bandiera, O.; Rasul, I. Social Networks and Technology Adoption in Northern Mozambique. Econ. J. 2006, 116, 869–902. [Google Scholar] [CrossRef]
- MacKeracher, T.; Diedrich, A.; Gurney, G.G.; Marshall, N. Who trusts whom in the Great Barrier Reef? Exploring trust and communication in natural resource management. Environ. Sci. Policy 2018, 88, 24–31. [Google Scholar] [CrossRef]
- Vogel, S. Farmers’ Environmental Attitudes and Behavior. Environ. Behav. 1996, 28, 591–613. [Google Scholar] [CrossRef]
- Xue, Y.; Guo, J.; Li, C.; Xu, X.; Sun, Z.; Xu, Z.; Feng, L.; Zhang, L. Influencing factors of farmers’ cognition on agricultural mulch film pollution in rural China. Sci. Total. Environ. 2021, 787, 147702. [Google Scholar] [CrossRef]
- Atinkut, H.B.; Yan, T.; Zhang, F.; Qin, S.; Gai, H.; Liu, Q. Cognition of agriculture waste and payments for a circular agriculture model in Central China. Sci. Rep. 2020, 10, 10826. [Google Scholar] [CrossRef] [PubMed]
- Li, C.; Jin, L. Multi-Level Determinants of Acceptance in Centralized Pesticide Delivery among Farmers: Evidence from Huangshan City, China. Water 2022, 14, 1566. [Google Scholar] [CrossRef]
- Cordaro, F.; Desdoigts, A. Bounded Rationality, Social Capital and Technology Adoption in Family Farming: Evidence from Cocoa-Tree Crops in Ivory Coast. Sustainability 2021, 13, 7483. [Google Scholar] [CrossRef]
- Bakker, L.; Sok, J.; van der Werf, W.; Bianchi, F. Kicking the Habit: What Makes and Breaks Farmers’ Intentions to Reduce Pesticide Use? Ecol. Econ. 2020, 180, 106868. [Google Scholar] [CrossRef]
- Li, M.; Liu, Y.; Huang, Y.; Wu, L.; Chen, K. Impacts of Risk Perception and Environmental Regulation on Farmers’ Sustainable Behaviors of Agricultural Green Production in China. Agriculture 2022, 12, 831. [Google Scholar] [CrossRef]
- Xie, J.; Yang, G.; Wang, G.; Zhu, Y.; Guo, Z. Substitutes or complements? Exploring the impact of environmental regulations and informal institutions on the clean energy utilization behaviors of farmers. Environ. Dev. Sustain. 2022, 25, 3893–3922. [Google Scholar] [CrossRef]
- Wang, N.; Gao, Y.; Wang, Y.; Li, X. Adoption of eco-friendly soil-management practices by smallholder farmers in Shandong Province of China. Soil Sci. Plant Nutr. 2016, 62, 185–193. [Google Scholar] [CrossRef]
- Chen, Z.; Sarkar, A.; Hasan, A.K.; Li, X.; Xia, X. Evaluation of Farmers’ Ecological Cognition in Responses to Specialty Orchard Fruit Planting Behavior: Evidence in Shaanxi and Ningxia, China. Agriculture 2021, 11, 1056. [Google Scholar] [CrossRef]
- Wang, X.; Zhang, J.; He, K.; Li, W. Place attachment, environmental cognition and organic fertilizer adoption of farmers: Evidence from rural China. Environ. Sci. Pollut. Res. 2021, 28, 41255–41267. [Google Scholar] [CrossRef]
- Deng, Z.; Dai, L.; Deng, L.; Peng, P. Analysis of farmers’ perceptions and behavioral response to rural living environment renovation in a major rice-producing area: A case of Dongting Lake Wetland, China. Ciência Rural 2021, 51, e20200847. [Google Scholar] [CrossRef]
- Qiao, D.; Li, N.; Cao, L.; Zhang, D.; Zheng, Y.; Xu, T. How Agricultural Extension Services Improve Farmers’ Organic Fertilizer Use in China? The Perspective of Neighborhood Effect and Ecological Cognition. Sustainability 2022, 14, 7166. [Google Scholar] [CrossRef]
- Xie, J.; Yang, G.; Wang, G.; Xia, W. How Do Network Embeddedness and Environmental Awareness Affect Farmers’ Participation in Improving Rural Human Settlements? Land 2021, 10, 1095. [Google Scholar] [CrossRef]
- Liu, H.; Peng, H.; Li, L.-W.; Dong, X.-X. The mechanism and heterogeneity of environmental regulations’ impact on the technological progress of dairy farming. J. Integr. Agric. 2022, 21, 3067–3081. [Google Scholar] [CrossRef]
- Cui, G.; Liu, Z. The Impact of Environmental Regulations and Social Norms on Farmers’ Chemical Fertilizer Reduction Behaviors: An Investigation of Citrus Farmers in Southern China. Sustainability 2022, 14, 8157. [Google Scholar] [CrossRef]
- Jiang, L.; Huang, H.; He, S.; Huang, H.; Luo, Y. What motivates farmers to adopt low-carbon agricultural technologies? Empirical evidence from thousands of rice farmers in Hubei province, central China. Front. Psychol. 2022, 13, 983597. [Google Scholar] [CrossRef]
- Li, S.; Huo, X.; Si, R.; Zhang, X.; Yao, Y.; Dong, L. Exploring the role of environmental literacy and social norms in farmers’ LMTT adoption: Evidence from China. Int. J. Clim. Chang. Strat. Manag. 2022. ahead-of-print. [Google Scholar] [CrossRef]
- Hainan Provincial Bureau of Statistics. Available online: http://stats.hainan.gov.cn/tjj/tjsu/ndsj/2021/index.html (accessed on 10 August 2022).
- Song, C.; Zhang, J.; Liu, L.; Ma, W.; Ma, L.; Ding, S.; Zhao, H. Spatial and temporal characteristics of agricultural green de-velopment indica-tors in Hainan Island. Chin. J. Eco-Agric. 2020, 28, 1156–1167. [Google Scholar] [CrossRef]
- Zheng, H.; Ma, J.; Yao, Z.; Hu, F. How Does Social Embeddedness Affect Farmers’ Adoption Behavior of Low-Carbon Agri-cultural Technology? Evidence From Jiangsu Province, China. Front. Environ. Sci. 2022, 10, 909803. [Google Scholar] [CrossRef]
- Kohler, U.; Karlson, K.B.; Holm, A. Comparing Coefficients of Nested Nonlinear Probability Models. Stata J. Promot. Commun. Stat. Stata 2011, 11, 420–438. [Google Scholar] [CrossRef]
- Luo, L.; Qiao, D.; Tang, J.; Wan, A.; Qiu, L.; Liu, X.; Liu, Y.; Fu, X. Training of Farmers’ Cooperatives, Value Perception and Members’ Willingness of Green Production. Agriculture 2022, 12, 1145. [Google Scholar] [CrossRef]
- Roodman, D. Fitting Fully Observed Recursive Mixed-process Models with cmp. Stata J. Promot. Commun. Stat. Stata 2011, 11, 159–206. [Google Scholar] [CrossRef]
- Chyi, H.; Mao, S. The Determinants of Happiness of China’s Elderly Population. J. Happiness Stud. 2011, 13, 167–185. [Google Scholar] [CrossRef]
- Altonji, J.G.; Elder, T.E.; Taber, C.R. Selection on Observed and Unobserved Variables: Assessing the Effectiveness of Catholic Schools. J. Political Econ. 2005, 113, 151–184. [Google Scholar] [CrossRef]
- Nunn, N.; Wantchekon, L. The Slave Trade and the Origins of Mistrust in Africa. Am. Econ. Rev. 2011, 101, 3221–3252. [Google Scholar] [CrossRef]
- Luo, L.; Qiao, D.; Zhang, R.; Luo, C.; Fu, X.; Liu, Y. Research on the Influence of Education of Farmers’ Cooperatives on the Adoption of Green Prevention and Control Technologies by Members: Evidence from Rural China. Int. J. Environ. Res. Public Health 2022, 19, 6255. [Google Scholar] [CrossRef]


Disclaimer/Publisher’s Note: The statements, opinions and data contained in all publications are solely those of the individual author(s) and contributor(s) and not of MDPI and/or the editor(s). MDPI and/or the editor(s) disclaim responsibility for any injury to people or property resulting from any ideas, methods, instructions or products referred to in the content. |
© 2023 by the authors. Licensee MDPI, Basel, Switzerland. This article is an open access article distributed under the terms and conditions of the Creative Commons Attribution (CC BY) license (https://creativecommons.org/licenses/by/4.0/).