Abstract
The Yellow River Source Area is located in the ecological protection and restoration area of the Sanjiangyuan in China, which has been deteriorating as a result of human-caused overgrazing and the grassland destruction caused by plateau rats and rabbits, as well as the influence of other natural factors. The Yellow River Source Area is an important area that implements ecological restoration and protection in the Three Rivers Source Region, where the ecologically vulnerable areas that are of great significance to the implementation of ecological restoration in national land space should be identified and the early warning should be extended. This measure can help us identify potential ecological problems and take timely and targeted protection measures to ensure the health and sustainable development of the ecosystem in the Yellow River Source Area. Therefore, an in-depth understanding of the ecological vulnerability of the Yellow River Source Area and the establishment of an early warning mechanism are of vital importance for the protection and restoration of the ecology of the national space in the Yellow River Source Area. Aiming to comprehensively delimit ecological restoration areas in the Yellow River Source Area and provide an early warning, this study applies the MSPA method to identify ecological source areas and uses a patch importance index to identify the importance of ecological source areas, along with extracting potential ecological corridors by using the MCR model, screening important ecological corridors by using the gravity model as a criterion, and simulating land cover changes in 2030 under the limitations of ecological security pattern by using the PLUS model. The results show that: (1) 154 potential ecological corridors were extracted based on the MCR model, with a total length of 7891.90. (2) The total area of the landscape types in the Yellow River Source Area was 12,301 based on MSPA analysis, including the 6899.57 of core area. (3) Based on the PLUS model, the area of farmland and forest in the study area will decrease, while the grassland area will increase. According to the studies, the grassland in the study area expands in a circular pattern towards the surrounding wetland and water area, threatening the ecological sources and corridors. In summary, the study delimits one protection zone in the ecological source land and two core ecological restoration zones and points out the early warning points in the ecological protection space. The delimitation and instruction provide specific spatial guidance for the protection and restoration of ecosystems in order to promote ecological sustainability.
1. Introduction
The ecological restoration of national land space is the basis of ecological civilization construction, which is of extraordinary significance for maintaining national ecological security. Meanwhile, achieving the goal of ecological restoration plays an important role in fulfilling the belief that “lucid waters and lush mountains are invaluable assets” [1]. However, with the rapid development of human urbanization and industrialization [2], many arising ecological problems have been posing a great threat to the structure of the ecosystem and natural resources [3], which have severely affected the socio-economic and ecological security of China. In order to deal with ecological problems, China has launched multiple ecological projects such as water and soil conservation in the middle and upper reaches of the Yellow River, grain for green, and the protection of natural forest resources [4]. Meanwhile, the priorities for ecological restoration of the national territory space are the construction of ecological corridors, the restoration of important habitats, and the restoration of abandoned land. At present, identifying the key areas, building a pattern of ecological restoration of national land and space, and promoting the systematic management of mountains, water, forests, fields, lakes, and grass are important challenges that the ecological restoration of land space is facing. The solutions to these problems are of key importance for the ecological restoration of the national space.
The ecological security pattern is based on the theory of landscape ecology, which is an important path to coordinate the development of socio-economic and ecological environment [5]. Integrating overall protection and key ecological issues is of great significance to enhance the ecosystem function of ecological restoration areas, maintain biodiversity, and build ecological security barriers [6]. The construction of ecological security patterns plays an important role in the ecological restoration of national land space, and the restoration of ecological fragile landscape is the key to constructing regional ecological security patterns [7]. At the present, the general approach of ecological security pattern research is “source identification—resistance surface construction—corridor extraction” [8]. Ecological source areas are regarded as the basis for establishing ecological security patterns, which can be directly selected as nature reserves [9], green areas [10], forest patches, or other important ecological land. However, this method is subjective and neglects the evolution of the spatial structure of the ecosystem, which can also be analyzed through comprehensive evaluation systems such as the granularity inverse method [11] and principal component analysis [12]. Due to the large differences in environments, a variety of indicators will be selected for the study. Therefore, this paper chooses to apply Morphological Spatial Pattern Analysis (MSPA) [13,14] and landscape connectivity [15] to quantitatively identify ecological source areas. The use of these methods can effectively assess the quality and distribution of ecological source areas [12].
Ecological resistance surfaces can manifest the difficulty of material and energy exchange. Some scholars have directly assigned value to resistance surfaces through the land cover types [16], but this method ignores the different resistance values of similar land types in different locations. Zhang Liqing et al. [17] corrected the ecological resistance values through the nighttime light data, and the corrected resistance value is more scientific [18]. The common resistance factors are terrain [19], land type, and environment [20], which are used to present human interference or natural factors on ecological processes [20]. The corridors are presented as lines or bands, which play an important role in connecting ecological sources, energy conversion between species, and information transfer. The judgement of corridors relies on the setting of resistance surfaces [21], which can be extracted by methods such as the Minimum Cumulative Resistance (MCR) model [22,23], circuit theory [24], graph theory [25] etc. By comparing the methods above, the MCR can better simulate the landscape obstructing spatial movement processes and can better respond to the interaction relationship between landscape patterns and ecological processes [12]. The model plays a significantly important role in the construction of ecological corridors [26]. The construction of ecological security patterns can provide a scientific reference for ecological landscape restoration, which refers to assisting in the degraded, damaged, or completely destroyed process of ecosystem restoration [27]. Confirming the key restoration protection areas is of great significance for ecological restoration. In the process of constructing an ecological security pattern, the spatial distribution of important ecological sources, important corridors, and other key areas, as well as the spatial relationship between them, are important references for the confirmation of ecological restoration zones in the study areas [28].
Taking the Yellow River Source Area as the study area, this paper extracts the source and corridor by using MSPA and MCR methods based on summarizing and analyzing ecological restoration both in China and overseas, and determines the priority protection order of the corridor by calculating the landscape connectivity and the relative importance of the corridor, which can provide a theoretical basis for the government to formulate the ecological restoration strategy. Simulating land use changes in the future to explore the current direction of ecological protection can effectively identify the ecological threats brought by future land use and can identify and prevent future risks in advance.
2. Materials and Methods
2.1. Study Area
The Yellow River Source Area is an important part of the Tibetan Plateau, covering several cities in the provinces of Qinghai, Gansu, and Sichuan. This area covers 16% of the total area of the Yellow River Basin and is geographically located between northern latitude 32°16′ and 36°09′, and east longitude 95°48′ and 103°28′ east (Figure 1). The alpine meadows and alpine grasslands, as the main vegetation types in the Yellow River Source Area, account for 70 percent of the total area [29]. The Yellow River Source Area is rich in wetlands and water resources, providing important ecosystem services to the Yellow River Basin. However, with the influence of anthropogenic and natural factors in recent years, ecological problems such as soil erosion [30], pasture degradation [31], and desertification [32] have appeared in the source area.
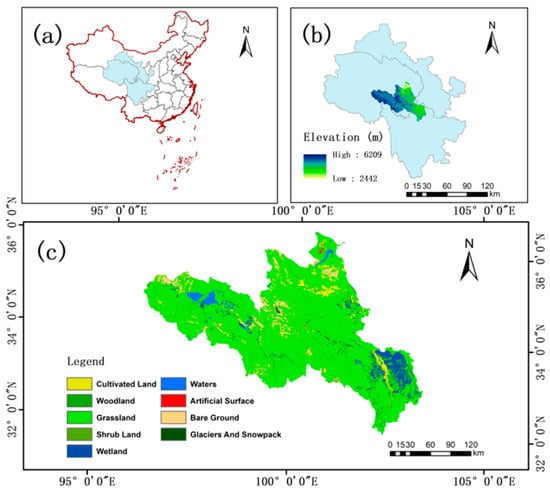
Figure 1.
Location map of the Yellow River source area; (a) China; (b) study area dem; (c) study area land cover data.
2.2. Research Framework and Data Sources
2.2.1. Land Cover and NDVI Data
Figure 2 shows the framework of this study, which is expanded upon in the following sections. The land cover data of the study area in 2000, 2010, and 2020 were obtained from (http://globeland30.org, accessed on 12 April 2023) with a spatial resolution of 30 × 30 m, including a total of ten primary types such as farmland, forest, grassland, etc. The NDVI (Normalized Differential Vegetation Index) data were obtained from the Resource and Environment Science and Data Center (https://www.resdc.cn, accessed on 12 April 2023) with a resolution of 1000 × 1000 m and were normalized after collection.
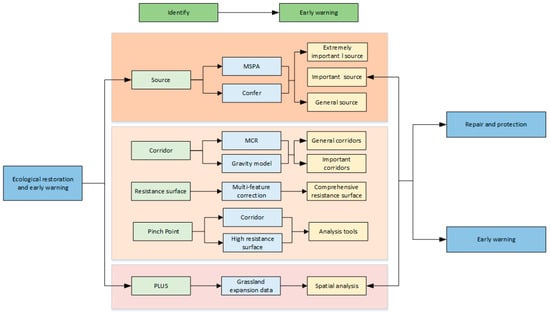
Figure 2.
Research framework.
2.2.2. Driving Factors
Considering the natural and socio-economic conditions and based on the difficulty of obtaining the driving factors, the time effect, and the principle of significance, nine driving factors [33,34] were selected to predict the land cover distribution of different scenarios in the Yellow River Source Area in 2030 (Table 1) to improve the accuracy of the projections, the data for 2020 were used for the driving factors.

Table 1.
Source information of the data.
2.3. Ecological Source Area Identification Based on the MSPA Approach
2.3.1. Landscape Pattern Analysis
MSPA is based on the principles of mathematical morphology such as erosion, expansion, open operation, and the closed operation to process mathematical images, which can better identify the landscape ecological patches. MSPA can recognize the target such as the spatial topological relationship between the element set and the structural elements, where the core area patches can be calculated by applying a series of mathematical operations such as expansion, reconstruction, and skeletal extraction [35]. Prospective data came from land types capable of generating ecosystem service functions. Referring to the research methods of the previous researchers [36,37,38] and based on the land cover data of the source area, forest land, water bodies, and wetland were selected as the foreground data of the MSPA and the analysis of the Yellow River Source Area and were assigned a value of 1. The rest of the land cover types were assigned a value of 2 as background data. The land cover data were converted to binary raster data through reclassification [39], and the data were analyzed based on the software Guidos Toolbox, which can obtain seven landscape elements [40] (Table 2). In the end, Confer2.6 was used to perform landscape connectivity analysis of the core area to extract the ecological source.
Table 2.
Type and meaning of various MSPA landscapes.
2.3.2. Landscape Connectivity Evaluation
Landscape connectivity refers to the degree to which the movement of organisms between patches is facilitated or hindered and plays an important role in landscape evaluation and ecological planning [41]. Landscape connectivity index includes the overall connectivity indexes (), possible connectivity index (), and patch importance index () [42]. In this paper, the patch importance index () was selected to identify important ecological sources in the core area. The formula is as follows [43]:
In the formula, denotes the possible connectivity index between patches; denotes the patch importance index; denotes the total number of patches; denotes the area of patches and ; denotes the total area of the contained landscape; denotes the maximum distance for species to spread between patches. denotes the connectivity index value of the landscape after excluding a patch. The patch area and connectivity give full play to the important role in the ecological function of the landscape. Areas with larger core areas tend to have higher habitat quality, In this study, based on the results of MSPA analysis, the core area was ranked, and the top 30 former patch areas were selected as the initial ecological source. Following that, landscape connectivity was analyzed via Conefor 2.6 software and the patches with higher connectivity were selected as the source area of final ecology. According to the previous study,2.5 km was selected as the distance threshold value [44] for the evaluation of landscape connectivity with a set of 0.5 as connectivity probability [45]. The 9 highest patches out of 30 core areas were selected as the final ecological source area (Table 3), which covered the first level ecological control area of the study area.
Table 3.
Patch importance indices.
The values of different ecological sources differed greatly, and it was necessary to construct an ecological network to improve landscape connectivity. The distribution of ecological sources in the study area was uneven, and the overall connectivity was comparatively poor.
2.4. Extraction of Ecological Corridors Based on the Minimum Cumulative Resistance (MCR) Model
2.4.1. Resistance Surface Factor Selection
Ecological resistance refers to the obstacles faced by species and ecological functions in the process of spatial control and coverage. Ecological elements between ecological source areas are restricted in the circulation and exchange of materials, energy, and information, which is not only limited by natural conditions, but also disturbed by human activities [46,47]. Based on the comprehensive consideration of natural and human impacts, and with reference to the previous research results [48], we can confirm five impact factors, including land cover type [49], elevation [50], slope [51], undulation, NDVI, and make a graded assignment [12] (Table 4, Figure 3).
Table 4.
Classification of ecological resistance factors.
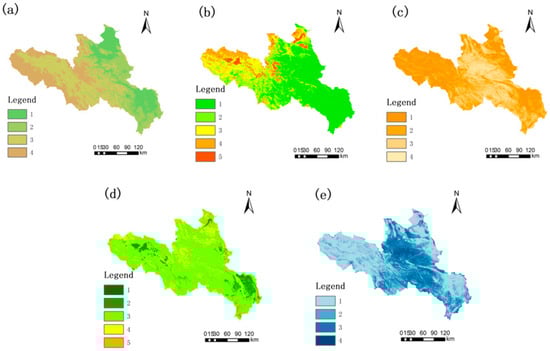
Figure 3.
Ecological resistance base surface in the Yellow River source area (Note: (a) Slope reclassification; (b) NDVI reclassification; (c) Slope reclassification; (d) Undulation reclassification; (e) Land cover type reclassification.
2.4.2. Confirmation of Resistance Values and Construction of Integrated Resistance
Surface
In this study, the entropy weight method combined with the hierarchical analysis method was used to assign weight values to each resistance factor. Referring to the previous studies [52], the following five indicator factors are scored by 21 experts in the field according to the degree of importance. The subjective weight of the indicator can be confirmed by using the hierarchical analysis method, constructing a tiered index hierarchy structure based on each indicator set and using the paired comparison method for the consistency test. The objective weight of each factor can be obtained by the metadata scored by the experts and normalized and constructing an entropy value matrix based on the entropy value formula. As a complex objective weight method, entropy weight has the advantage of avoiding the error brought by the information crossing and repetition between the factors. AHP (Analytic Hierarchy Process) requires less data information and simple calculation but is more subjective. Therefore, this study corrects the results of hierarchical analysis through entropy weight to obtain the comprehensive weight of each factor (Table 5). In the end, the raster calculator was applied to superimpose the five resistance factors to obtain the comprehensive resistance surface (Figure 4). The correction formula is as follows [53]:
Table 5.
Resistance factor weights.

Figure 4.
Integrated resistance surface.
2.4.3. Extraction of Ecological Corridors Based on the Minimum Cumulative Resistance (MCR) Model
Ecological corridors are laid out in a linear or banding form in the ecosystem, providing channels and places for processes such as migration and the reproduction of plants and animals. This layout helps to promote the movement and exchange of species, protect the genetic diversity of species, and maintain ecological balance [54,55]. In this paper, the MCR model is used to extract the corridor, and the MCR model considers the source, distance, and landscape characteristics, which describes the energy consumption required for ecological substances to travel from the origin source to the target source as they flow through a landscape with different resistance values [56], and its formula is as follows:
denotes the positive correlation function between and the ecological process; represents the spatial distance required for one point to reach another point; represents the ecological resistance coefficient.
The gravity model was used to calculate the interaction strength between the ecological source areas, the relative importance of the corridor was confirmed by the acting force, and its formula is as follows [57]:
In the formula, is the interaction force between the ecological source areas and , is the study area, , represents the patch area, and represents the resistance value between the patches.
2.5. Simulation Analysis of Land Cover Change Based on the PLUS Model
2.5.1. PLUS Model
The PLUS model is developed on the basis of the FLUS model [58], which combines key factors such as spatial planning, land use policy, and environmental factors to predict future land use changes and guide land management decisions. This paper is based on the land cover data of two periods in 2010 and 2020, and the driving factor is used as a predictor variable to calculate the suitability probability of each class. The land cover data in 2020 were used as a simulation benchmark, and the 2030 land cover simulation data were obtained by applying the PLUS model with reference to the previous research results [33,34]. This paper selected nine driving factors such as DEM, slope, slope direction, GDP, population density, precipitation, temperature, soil type, and distance from the road to simulate the changes. The ecological source area was set as a restriction of change area in this study. Meanwhile, the study uses 2010 land cover data as the basis to simulate the land cover type in 2020 for accuracy verification, where the resulting coefficient is 0.84 and the overall accuracy is 0.8, which is in line with the accuracy requirements.
2.5.2. Kernel Density Analysis
Based on the data of grassland expansion, this paper analyses the impact of grassland expansion on the ecological source land via the Arcgis platform to analyze and extract the spatial warning points for ecological protection. The formula is as follows [59]:
In the formula, denotes the kernel density value; denotes the bandwidth; denotes the number of points in the bandwidth range.
3. Results
3.1. Landscape Pattern Analysis
The data were analyzed by using MSPA via Guidos Toolbox software. As shown in Figure 5, the total area of the seven landscape types takes up 12,301 km2. Among them, the core area occupies 6899.57 km2, accounting for 56.01% of the ecological space area as the largest proportion. The bridging area occupies 176.01 km2, accounting for 1.43% of the ecological space area. The fringe area accounts for 10.49%, ranking third largest among all landscape types. The island patches account for 20.89%. Among the rest of the landscape types, roundabouts take up 6.4%, pores account for 1.56%, and the tributary line occupies 3.12%.
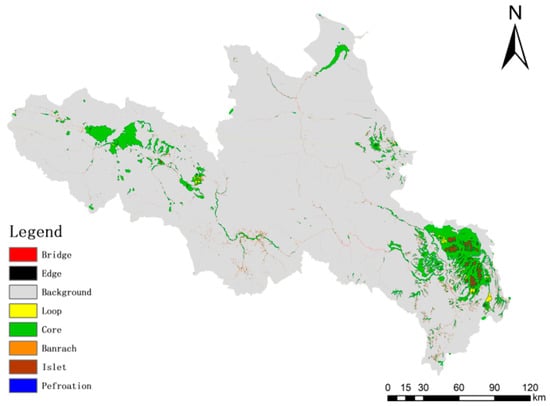
Figure 5.
Landscape pattern of MSPA in the Yellow River source area in 2020.
3.2. Ecological Network Construction
3.2.1. Ecological Source Area
In this study, nine ecological source patches were extracted, with a total area of 5558.6115 km2. According to the value of the patch importance index (), ecological source areas were divided into utmost important ecological source areas ( > 6), important ecological source areas (1 < < 6), and general ecological source areas (0.1 < < 1) [13] (Figure 6). There was one utmost important ecological source area distributed in the southwest part of the Yellow River Source Area, where the wetland national nature reserve and other ecologically important areas had significant ecosystem service functions with less human interference. The patch 28 has the largest value 88.19, with an area of 2809.31 km2, which is mainly located in Ruoergai County and the northern part of Hongyuan County, where the “Internationally Important Wetland” Ruoergai Wetland National Nature Reserve is located. The Ruoergai Wetland National Nature Reserve, known as “Wetlands of International Importance”, is located in this area. The second largest one Patch 11, with a value of 5.65 and an area of 592.22 km2, is located in the northwestern part of Maduo County, Sanjiangyuan National Nature Reserve, where there are nature reserves such as Xingxinghai, Zaling Lake, and Eling Lake. There are five important ecological source areas and three general ecological source areas with a value less than 1, mainly distributed in Zeku County and Gonghe County.
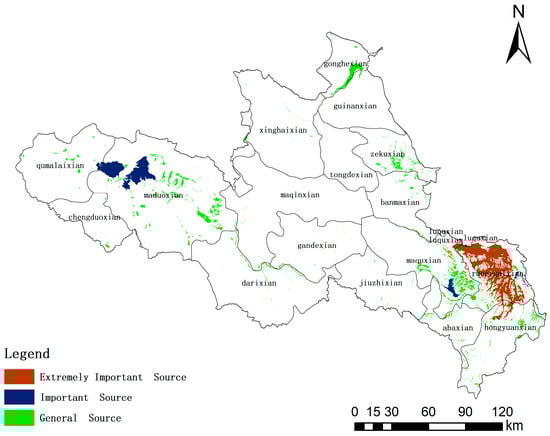
Figure 6.
Distribution of ecological source sites.
3.2.2. Ecological Corridor
Based on the MCR model, 154 potential ecological corridors were extracted, with a total length of 7891.90 km. The interaction matrix between ecological source areas was calculated by using the gravity model (Table 6). The ecological corridors with an interaction force of more than 80 were regarded as important ecological corridors, and the rest were classified as general ecological corridors (Figure 7), of which there were 38 important ecological corridors and 116 general ecological corridors. The interaction force can prove that the interaction force between patches 4 and 11 is the largest, which is 1313.409, indicating that the correlation between the patches is high, and organisms have a higher possibility of migrating between the patches. Therefore, the ecological corridor between patches 4 and 11 needs to be protected, which is used to safeguard the flow of material and energy between patches as well as the connectivity between the patches. The interaction force between patch 4 and 24 is the smallest, which is 3.122579. The two patches are located on the east and west sides of the Yellow River Source Area with a far distance, and the landscape resistance between the patches is larger with a small possibility of species migration. The exchange of materials between the corridors is more difficult. Therefore, in future planning, stepping-stones or ecological source areas should be added between the ecological source areas that have a larger landscape resistance, which can be used to increase the connectivity between the patches. The corridors between patches 7, 11, 21, and 28 are more densely distributed, with higher landscape connectivity. According to the figure, it can be seen that the central part of the Yellow River Source Area, such as Xinghai County, Maqin County, and Gande County, lacks ecological source areas, which leads to a greater resistance to the exchange of materials and energy between the eastern and western of the Yellow River Source Area and is not conducive to the landscape connectivity of the Yellow River Source Area and causes the incomplete ecological network of the study area. Therefore, ecological stepping-stones or ecological source areas need to be added to improve the ecological network in the region to strengthen the ecological connection in the source area, such as the construction of ecological buffer zones and the construction of parks.
Table 6.
Interaction matrix of ecological sources based on a gravity model.
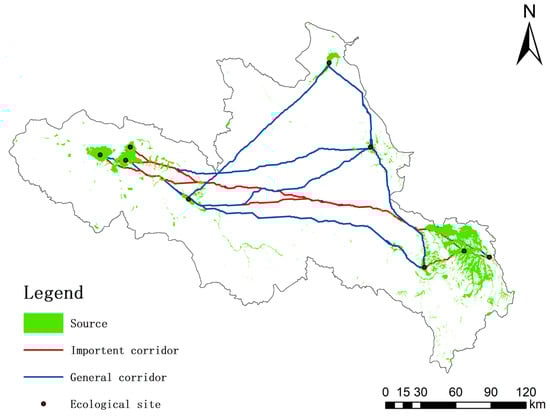
Figure 7.
Ecological corridor distribution map.
3.2.3. Ecological Nodes
According to the study results, ecological nodes in the ecological corridors require urgent restoration, which suffer from greater resistance during the exchange of materials and energy between ecological source areas [60,61]. In this study, locations where ecological corridors intersect resistance surfaces (resistance values ranging from (3.5–4.11)) are defined as ecological nodes (Figure 8). As shown in Figure 8, the ecological nodes are densely distributed in the western part of Maqin County. These ecological nodes have an important obstructive effect on the ecological corridor, which has a great influence on the exchange of materials and energy between the ecological source areas on the east and west sides of the Yellow River Source Area, and is unfavorable to the ecological security of this area. Ecological restoration and protected areas in the Yellow River source area(Figure 9), see Section 4.1 for details
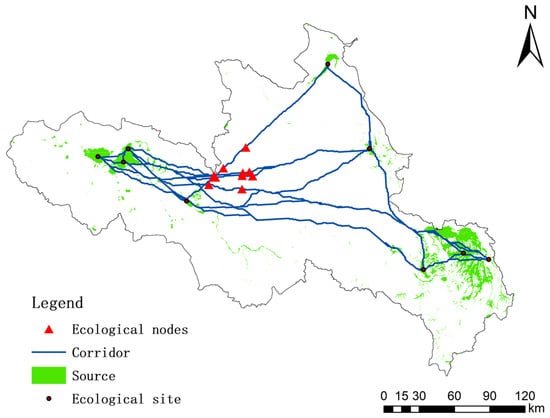
Figure 8.
Spatial distribution of ecological pinch points.
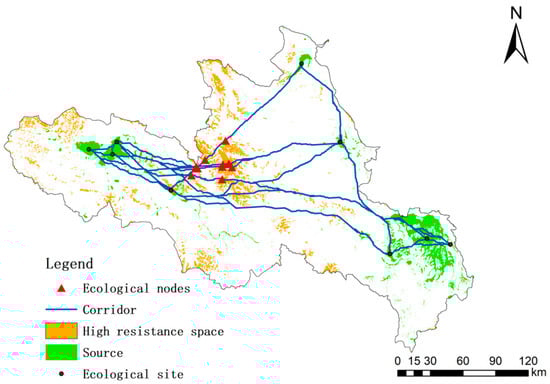
Figure 9.
Ecological protection and restoration area.
3.3. Simulation Analysis of Land Cover Change
Based on the transfer matrix of land cover change and the trajectory of land cover type change from 2020 to 2030 (Table 7 and Figure 10), it can be observed that grasslands, wetlands, and water bodies change significantly. In particular, the area of grasslands increased, while the area of wetlands and water bodies relatively decreased. The most significant land type changes from 2020 to 2030 are based on the changes from cropland, wetlands, and water bodies to grassland. The changes from farmland to grassland are mainly concentrated in Maduo County, while the changes from wetlands to grassland are mainly located in the areas of Kuze County, Maqu County, and Ruoergai County. Kappa coefficients are generally divided into five categories: low (0–0.20), average (0.21–0.4), medium (0.41–0.60), high (0.61–0.80), and almost perfect (0.81–1) [62]. The study uses the land cover data from 2010 as the basis for simulating the land cover type in 2020 and compares the results with the existing land cover data in 2020. The sampling rate was set at 10%, and the obtained kappa coefficient was 0.84, with an overall accuracy of 0.8, which meets the accuracy requirements.
Table 7.
Land use transfer matrix for 2020–2030/.
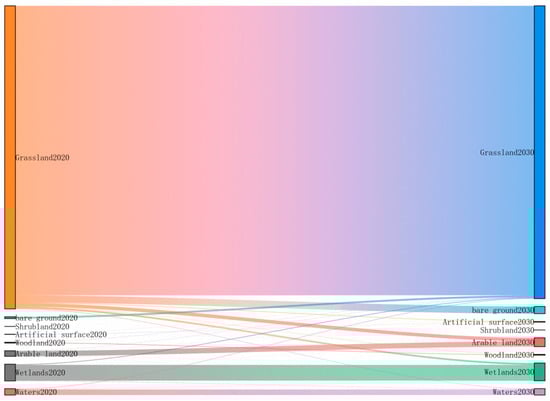
Figure 10.
Land cover type change trajectory in the Yellow River source area, 2020–2030.
3.4. Early-Warning Points of Ecological Protection Space
The study can identify the areas that pose a threat to ecological source areas in future land cover simulations as key early warning points and the identification of ecological protection space. These key warning points help guide environmental management and decision-making in order to ensure that key ecological function areas are effectively protected [48]. By applying kernel density analysis, the grass expansion data can be graded into different classes such as low sensitivity, general sensitivity, medium sensitivity, and high sensitivity. Among them, the highly sensitive areas were mainly distributed in Ruoergai County, Maqu County, Hongyuan County, Kuze County and Maduo County. The hotspot areas of grassland expansion and the ecological security patterns are superimposed and analyzed, and it can be concluded that the continuous expansion of the grassland in the future will squeeze on the ecological space outside the ecological source area and impede the connectivity of the ecological corridors (Figure 11). This situation is unfavorable for the protection of the ecological security pattern of the whole region. In future planning and management, corresponding measures should be considered to mitigate the negative impacts of grassland expansion on ecological space and ecological corridors so as to maintain the overall ecological security pattern of the region.
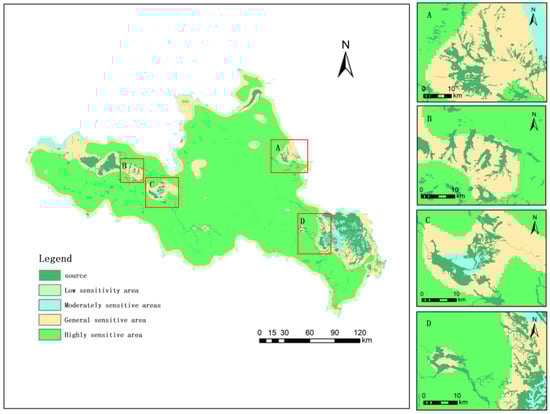
Figure 11.
Ecological protection warning points.
4. Discussion
4.1. Restoration Area of Ecological Protection and Identification and Analysis of Early Warning Points
Ecological restoration can enhance the function of regional ecosystems. Most of the previous research identified the spatial distribution of ecological sources and ecological corridors, only establishing a buffer for the corridors. However, there is no clarity on the specific areas to be restored [63], and there is less research on the early warning of ecological security patterns. In this paper, ecological restoration is combined with the early warning, and early warning is capable of identifying the areas that will pose a threat to ecological security in the future, which is important for the formulation of a variety of feasible policies, and it also completes the ecological restoration measures.
This study takes the ecological source areas, the characteristics of quantity and location of corridors, as well as the spatial distribution characteristics of comprehensive resistance surfaces as the basis of ecological protection and restoration of land space in the Yellow River Source Area, delimiting the ecological protection and restoration area of this area. The ecological source area, as the core area to maintain the stability of the ecosystem, should be the absolute protection area. The area with a high ecological resistance value would interfere the ecosystem, which is not conducive to the substance exchange. Therefore, ecological protection and restoration of areas with a high resistance value is necessary. Focusing on the construction and protection of ecological corridors and the restoration of ecological nodes, the ecological restoration and protection of national land space can effectively facilitate the restoration and protection of ecosystems, improve biodiversity, and maintain ecological security. Therefore, the main areas to be protected and restored in the Yellow River Source Area consist of three areas: the protection area of the ecological source, the core area of ecological node restoration, and the core area of ecological resistance high value restoration [48] (Figure 9).
In this study, nine ecological source areas were classified as protection zones of ecological source areas. The ecological source areas in the Yellow River Source Area mainly consist of wetlands and water areas, rich in ecological resources, which need to be protected to maintain the ecological supply function. The protection zones in the ecological source areas are mainly located in the eastern and southwestern parts of the study area with poor overall circulation among the source areas. Depending on the ecological protection policy in the region, the ecological source areas are found to be less likely to disappear. Therefore, the protection of ecological source areas should be based on the laws of nature, where ecological shelter and buffer zones should be established to protect the area around the ecological source areas to maintain ecological quality and ecological benefits, as well as protecting biodiversity, and avoiding damage to the ecological source area. The central counties of the Yellow River Source Area, including Maqin County, Xinghai County, and Gande County, have not been covered by the ecological source areas, which is not conducive to the ecological service function. This paper suggests that ecological source protection areas should focus on “protection and conservation” against interference. In areas not covered by ecological sources, green infrastructure should be built in places that are not covered by ecological source areas to have secondary ecological source services. In this way, the existing ecological source services will be supplemented and enhance regional ecological connectivity. The aim is to maximize the functional utility of ecological source areas, protect biodiversity and ecosystems, and achieve the goals of regional ecological security and sustainable development.
The future expansion of grassland in Ruoergai County, Maqu County, Hongyuan County, Kuzhexian, Mado County, and other regions is constantly approaching the ecological source and squeezing the ecological space outside the ecological source areas, blocking some of the ecological corridors, which is not conducive to the protection of the regional ecological security pattern as a whole, such as in Maduo County, Ruoergai County, etc. Therefore, the ecological protection of the region should be strengthened, such as the construction of a forest protection belt to prevent the expansion of grassland from squeezing the ecological source.
4.2. Strategy of Ecological Restoration and Early Warning in the Important Areas
This study confirms that the key areas of ecological protection and restoration in the Yellow River Source Area are ecological protection belts, ecological nodes, high value areas of ecological resistance, and early warning points. Aiming to implement effective ecological restoration, this paper puts forward the following strategies.
- Ecological protection belts: the ecological source area mainly includes forest and wetland. In terms of the forest, in order to strengthen the protection and management measures, we should carry out ecological restoration of degraded forests to increase the forest cover. The forest used for commercial purposes is prohibited to prevent the reverse loss of high-quality forest [2]. At the same time, we should protect and promote the natural resilience of forest vegetation. In terms of wetlands, the natural ecosystem of wetlands should be rebuilt or restored through ecological restoration projects. For example, restoring vegetation, improving hydrological conditions of wetlands, protecting and introducing animal species, and strengthening legal protection and policy development.
- Ecological pinch points: Ecological pinch point areas mainly consist of bare land, where the quality of the regional ecological environment can be steadily improved by planting trees and building green parks.
- Ecological early warning points: the ecological early warning area mainly consists of the grass expansion area. The study predicts that the expansion of the grass can squeeze the ecological source areas, which is unfavorable to the ecological pattern of the Yellow River Source Area. An ecological barrier and buffer can be constructed around the ecological source area to ensure the long-term stability of the ecological source areas in the region.
4.3. Insufficiency and Expectations
Different species have different requirements for the width of ecological corridors and the magnitude of resistance values [46]. This study did not take into account the survival needs of biological species in the study area when setting the width of ecological corridors and landscape resistance values, which causes the unspecific width of ecological corridors and the limitations of setting the distance threshold values for landscape connectivity.
Future research can explore the directions as follows. For different ecological restoration purposes, ecological safety patterns at different scales are established so as to accurately identify the space to be protected and restored. By reasonably delimiting the pattern, ecological restoration can be better guided. To ensure the health and stability of the ecosystem, emphasis will be placed on researching how to effectively construct buffer zones for secondary ecological sources and early warning points, which can provide additional ecological protection and early warning functions. The study should focus on the determination of the extent of the areas, the development of conservation measures, and the implementation of management strategies to ensure the effectiveness and sustainability of these areas. Further research should focus on setting appropriate thresholds for ecological corridor widths. Confirming the appropriate width thresholds can ensure the ecological corridors are sufficiently connected and functional to facilitate species migration and gene exchange, thereby maintaining ecosystem integrity and stability. The study can further refine ecological restoration measures, including specific technologies and management methods. In this way, the study will provide more specific and actionable guidance for the implementation of ecological restoration and improve the effectiveness and sustainability of restoration.
5. Conclusions
Taking the Yellow River Source Area as the study area, this study extracted the ecological source and ecological corridor based on the MSPA and MCR models from the perspective of landscape ecology, and constructed the protection and restoration area of the Yellow River Source Area with “one belt and two cores”. The PLUS model was used to provide a scientific basis for the ecological restoration and protection of the Yellow River Source Area, and to make the restoration and protection more comprehensive through early warning. The results showed that nine final ecological source areas were extracted from the analysis of patch importance and connectivity, with a total area of 5558.6115 km2, among which there was one utmost important ecological source area, five important ecological source areas, and three general ecological source areas, which were mainly distributed in the western and southeastern parts of the Yellow River Source Area. Based on the MCR and gravity model, 38 important ecological corridors and 116 potential ecological corridors were extracted, with a total length of 7891.90 km, and eight ecological pinch points were mainly distributed in the west of Maqin County. It is known through the PLUS prediction that the ecological sources in the future in Maqin County, Maduo County, and Xinghai County will be squeezed by the grassland expansion side. Therefore, this paper recommends constructing a certain scale of green infrastructure in this area to supplement the ecological source sites to improve the overall circulation among the source sites in the Yellow River Source Area.
Author Contributions
Conceptualization, S.W. and Q.S.; methodology, S.W.; software, S.W.; validation, S.W., Q.S. and Z.L.; formal analysis, S.W.; investigation, H.Z.; resources, Q.S.; data curation, S.W.; writing—original draft preparation, S.W.; writing—review and editing, S.W.; visualization, S.W.; supervision, Q.S.; project administration, J.Z.; funding acquisition, J.Z. All authors have read and agreed to the published version of the manuscript.
Funding
This research was funded by Qinghai Provincial Basic Research Programme Project: Research on the Impact Mechanism of Extreme Climate Change on Alpine Grassland Ecosystems in the Yellow River Source Area (2021-ZJ-743).
Institutional Review Board Statement
Not applicable.
Informed Consent Statement
Not applicable.
Data Availability Statement
Data are contained within the article.
Conflicts of Interest
The authors declare no conflict of interest.
References
- Fu, F.J.; Liu, Z.H.; Liu, H. Identifying key areas of ecosystem restoration for territorial space based on ecological security pattern: A case study in Hezhou City. Acta Ecol. Sin. 2021, 41, 3406–3414. [Google Scholar]
- Ran, Y.J.; Lei, D.M.; Li, J. Identification of crucial areas of territorial ecological restoration based on ecological security pattern: A case study of the central Yunnan urban agglomeration, China. Ecol. Indic. 2022, 143, 109318. [Google Scholar] [CrossRef]
- Ma, S.F.; Lao, C.H.; Jiang, H.Y. Ecological restoration zoning of territorial space based on the pattern simulation of eco-security scenario: A case study of Guangdong-Hong Kong-Macao Greater Bay Area. Acta Ecol. Sin. 2021, 41, 3441–3448. [Google Scholar]
- Wei, X.D.; Lin, L.G.; Feng, X.L.; Wang, X.F.; Kong, D.H.; Lin, K.L.; Yang, J. Construction of ecological security pattern and quantitative diagnosis of ecological problems in Shenmu City. Acta Ecol. Sin. 2023, 43, 82–94. [Google Scholar]
- Yan, Y.Y.; Sun, Y.W.; Liu, M. Identification and restoration strategy of key areas for territorial space ecological restoration in Shanghai, China based on ecological security pattern. Chin. J. Appl. Ecol. 2022, 33, 3369–3378. [Google Scholar]
- Li, T.; Tang, T.; Deng, H.B.; Wu, G.; Cai, Q.H. Ecological theory and restoration practices of the mountain-river -forest-farmland -lake-grasslands system in the Three Gorges area of Hubei Province. Acta Ecol. Sin. 2019, 39, 8896–8902. [Google Scholar]
- Guan, W.B.; Xie, C.H.; Ma, K.M.; Niu, J.Z.; Zhao, Y.T.; Wang, X.L. A vital method for constructing regional ecological security pattern: Landscape ecological restoration and rehabilitation. Acta Ecol. Sin. 2003, 23, 64–73. [Google Scholar]
- Ni, Q.H.; Hou, H.P.; Ding, Z.Y.; Li, Y.B. Ecological remediation zoning of territory based on the ecological security pattern recognition: Taking Jiawang district of Xuzhou city as an example. J. Nat. Resour. 2020, 35, 204–216. [Google Scholar]
- Yan, L.; Yu, L.; An, M.; Su, H.; Li, H.; Yuan, C. Explanation of the Patterns, Spatial Relationships, and Node Functions of Biodiversity and Island: An Example of Nature Reserves in Guizhou, Southwest China. Sustainability 2019, 11, 6197. [Google Scholar] [CrossRef]
- Cui, L.; Wang, J.; Sun, L.; Lv, C. Construction and optimization of green space ecological networks in urban fringe areas: A case study with the urban fringe area of Tongzhou district in Beijing. J. Clean. Prod. 2020, 276, 124266. [Google Scholar] [CrossRef]
- Chen, C.; Shi, L.; Lu, Y.; Yang, S.; Liu, S. The Optimization of Urban Ecological Network Planning Based on the Minimum Cumulative Resistance Model and Granularity Reverse Method: A Case Study of Haikou, China. IEEE Access 2020, 8, 43592–43605. [Google Scholar] [CrossRef]
- Zhang, X.M.; Du, H.M.; Wang, Y.; Chen, Y.; Ma, L.; Dong, T.X. Watershed landscape ecological risk assessment and landscape pattern optimization: Take Fujiang River Basin as an example. Hum. Ecol. Risk Assess. Int. J. 2021, 27, 2254–2276. [Google Scholar] [CrossRef]
- Wang, B.; Liu, C.Q. Construction and optimization of ecological network based on MSPA and MCR—Taking Jizhou District of Ji’an City as an example. Environ. Prot. Sci. 2021, 47, 37–43. [Google Scholar]
- Wickham, J.D.; Riitters, K.H.; Wade, T.G.; Vogt, P. A national assessment of green infrastructure and change for the conterminous United States using morphological image processing. Landsc. Urban Plan. 2010, 94, 186–195. [Google Scholar] [CrossRef]
- Xu, F.; Yin, H.W.; Kong, F.H.; Xu, J.G. Developing ecological networks based on mspa and the least-cost path method: A case study in bazhong western new distric. Acta Ecol. Sin. 2015, 35, 6425–6434. [Google Scholar]
- Huang, M.Y.; Yue, W.Z.; Fang, B.; Feng, S.R. Scale response characteristics and geographic exploration mechanism of spatial differentiation of ecosystem service values in Dabie Mountain area, central China from 1970 to 2015. Acta Geogr. Sin. 2019, 74, 1904–1920. [Google Scholar]
- Zhang, L.Q.; Peng, J.; Liu, Y.X.; Wu, J.S. Coupling ecosystem services supply and human ecological demand to identify landscape ecological security pattern: A case study in Beijing-Tianjin-Hebei region, China. Urban Ecosyst. 2017, 20, 701–714. [Google Scholar] [CrossRef]
- Peng, J.; Jia, J.L.; Hu, Y.N.; Tian, L.; Li, H.L. Construction of ecological security pattern in the agro-pastoral ecotone based on surface humid index: A case study of Hangjin Banner, Inner Mongolia Autonomous Region, China. Chin. J. Appl. Ecol. 2018, 29, 1990–1998. [Google Scholar]
- Li, Q.; Zhou, Y.; Yi, S. An integrated approach to constructing ecological security patterns and identifying ecological restoration and protection areas: A case study of Jingmen, China. Ecol. Indic. 2022, 137, 108723. [Google Scholar] [CrossRef]
- Li, H.H.; Ma, T.H.; Wang, K.; Tan, M.; Qu, J.F. Construction of Ecological Security Pattern in Norther Peixian Based on MCR and SPCA. J. Ecol. Rural Environ. 2020, 36, 1036–1045. [Google Scholar]
- Chen, X.; Peng, J.; Liu, Y.X.; Yang, Y.; Li, G.C. Constructing ecological security patterns in Yunfu city based on the framework of importance-sensitivity-connectivity. Geogr. Res. 2017, 36, 471–484. [Google Scholar]
- Wang, J.L.; Xie, D.T.; Shao, J.A.; Ni, J.P.; Lei, P. Identification of source-sink risk pattern of agricultural non-point source pollution in cultivated land in Three Gorge Reservoir Area based on accumulative minimum resistance model. Trans. CSAE 2016, 32, 206–215. [Google Scholar]
- Tan, H.Q.; Zhang, J.T.; Zhou, X.S. Construction of ecological security patterns based on minimum cumulative resistance model in Nanjing City. Bull. Soil Water Conserv. 2020, 40, 282–288. [Google Scholar]
- Li, J.; Xu, J.; Chu, J. The Construction of a Regional Ecological Security Pattern Based on Circuit Theory. Sustainability 2019, 11, 6343. [Google Scholar] [CrossRef]
- Peng, J.; Zhao, H.J.; Liu, Y.X. Urban ecological corridors construction: A review. Acta Ecol. Sin. 2017, 37, 23–30. [Google Scholar] [CrossRef]
- Dong, J.; Peng, J.; Liu, Y.; Qiu, S.; Han, Y. Integrating spatial continuous wavelet transform and kernel density estimation to identify ecological corridors in megacities. Landsc. Urban Plan. 2020, 199, 103815. [Google Scholar] [CrossRef]
- Cortina-Segarra, J.; García-Sánchez, I.; Grace, M.; Andrés, P.; Baker, S.; Bullock, C.; Decleer, K.; Dicks, L.V.; Fisher, J.L.; Frouz, J.; et al. Ventocilla Barriers to ecological restoration in Europe: Expert perspectives. Restor. Ecol. 2021, 29, e13346. [Google Scholar] [CrossRef]
- VonThaden, J.; Badillo-Montaño, R.; Lira-Noriega, A.; García-Ramírez, A.; Benítez, G.; Equihua, M.; Looker, N.; Pérez-Maqueo, O. Contributions of green spaces and isolated trees to landscape connectivity in an urban landscape. Urban For. Urban Green. 2021, 64, 127277. [Google Scholar] [CrossRef]
- Lu, Z.B.; Song, Q.; Zhao, J.Y.; Ding, Y.Y. Changes in Ecological Land Patterns and Divergence Trends in Yellow River Source Area from 2005 to 2020. Bull. Soil Water Conserv. 2022, 42, 277–284. [Google Scholar]
- Hou, C.M.; Zhang, Z.Q.; Liu, X.Q.; Li, M. Eco-environmental problem in yellow river source region andcorresponding solutions in sustainable development. China Popul. Resour. Environ. 2001, 11, 51–53. [Google Scholar]
- Hu, J.J.; Hu, G.G.; Dong, Z.B. Particle size characteristics of aeolian desertified land in Madoi Basin of the source region of Yellow River. J. Desert Res. 2022, 42, 242–252. [Google Scholar]
- Hou, J.K.; Cheng, J.J.; Zhang, K.Q.; Zhou, G.Q.; You, H.T.; Han, X.W. Temporal and Spatial Variation Characteristics of Carbon Storage in the Source Region of the Yellow River Based on InVEST and GeoSoS-FLUS Models and Its Response to Different Future Scenarios. Environ. Sci. 2022, 43, 5253–5262. [Google Scholar]
- Mao, Y.F.; Zhou, Q.G.; Wang, T. Spatial–temporal Variation of Carbon Storage and Its Quantitative Attribution in the Three Gorges Reservoir Area Coupled With PLUS—InVEST Geodector model. Resour. Environ. Yangtze Basin 2023, 32, 1042–1057. [Google Scholar]
- Wang, Z.Y.; Huang, C.L.; Li, L.; Lin, Q. Ecological zoning planning and dynamic evaluation coupled with Invest-HFI-Plus model: A case study in Bortala Mongolian Autonomous Prefecture. Acta Ecol. Sin. 2022, 42, 5789–5798. [Google Scholar]
- Yang, Z.G.; Jiang, Z.Y.; Guo, C.X.; Yang, X.J.; Xu, X.J.; Li, X.; Hu, Z.M.; Zhou, H.Y. Construction of ecological network using morphological spatial pattern analysis and minimal cumulative resistance models in Guangzhou City, China. Chin. J. Appl. Ecol. 2018, 29, 3367–3376. [Google Scholar]
- Wang, Y.J.; Qu, Z.Y.; Zhong, Q.H.; Zhang, Q.P.; Zhang, L.; Zhang, R.; Yi, Y.; Zhang, G.L.; Li, X.C.; Liu, J. Delimitation of ecological corridors in a highly urbanizing region based on circuit theory and MSPA. Ecol. Indic. 2022, 124, 1092528. [Google Scholar] [CrossRef]
- Wei, Q.Q.; Abudureheman, H.; Yao, K.X.; Chen, L.M.; Maihemuti, B. Construction and optimization of ecological security pattern in Ebinur Lake Basin based on MSPA-MCR models. Ecol. Indic. 2022, 138, 108857. [Google Scholar] [CrossRef]
- Zhou, S.K.; Song, Y.H.; Li, Y.J.; Wang, J.; Zhang, L. Construction of Ecological Security Pattern for Plateau Lake Based on MSPA–MCR Model: A Case Study of Dianchi Lake Area. Sustainability 2022, 14, 14532. [Google Scholar] [CrossRef]
- Lei, S.; Li, Z.B.; Xiao, L.; Wu, L.F.; Chen, S.Y.; Wei, L.; Yin, Z.Y. Construction and Optimization of Ecological Network of Heyuan City Based on MSPA and MCR Model. For. Environ. Sci. 2023, 39, 1–11. [Google Scholar]
- Lin, J.Y.; Qiu, S.X.; Tan, X.J.; Zhuang, Y.Y. Measuring the relationship between morphological spatial pattern of green space and urban heat island using machine learning methods. Build. Environ. 2023, 228, 109910. [Google Scholar] [CrossRef]
- Wu, C.G.; Zhou, Z.X.; Wang, P.C.; Xiao, W.F.; Teng, M.J. The concept and measurement of landscape connectivity and its applications. Acta Ecol. Sin. 2010, 30, 1903–1910. [Google Scholar]
- Yu, Y.P.; Yin, H.W.; Kong, F.H.; Wang, J.J.; Xu, Y.P. Scale effect of Nanjing urban green infrastructure network pattern and connectivity Analysis. Chin. J. Appl. Ecol. 2016, 27, 2119–2127. [Google Scholar]
- Wang, Y.C. The connectivity evaluation of Shanghai urban landscape eco-network. Geogr. Res. 2009, 28, 284–292. [Google Scholar]
- Zhang, Y.L.; Yi, W.T.; Hu, X.J.; Li, X.H.; Yang, X.J. The Construction of Resource-saving Ecological Network Based on MSPA and MCR Model-A Case Study of Dongshan Island in Fujian Province. J. Northwest For. Univ. 2021, 36, 254–261. [Google Scholar]
- Xu, X.L.; Wang, S.Y.; Rong, W.Z. Construction of ecological network in Suzhou based on the PLUS and MSPA models. Ecol. Indic. 2023, 154, 110740. [Google Scholar] [CrossRef]
- Liu, C.F.; Zhou, B.; He, X.Y.; Chen, W. Selection of distance thresholds of urban forest landscape connectivity in Shenyang City. Chin. J. Appl. Ecol. 2010, 21, 2508–2516. [Google Scholar]
- Chen, Y.H.; Lei, Y.Q.; Xing, Y.L.; Zhao, M. Research on Ecological Security Pattern Construction in Fuliang County based on MSPA-MCR Mode. J. Shandong For. Sci. Technol. 2022, 52, 12–18+26. [Google Scholar]
- Liu, J.L.; Li, S.P.; Fan, S.L.; Hu, Y. Identification of territorial ecological protection and restoration areas and early warning places based on ecological security pattern: A case study in Xiamen-Zhangzhou-Quanzhou Region. Acta Ecol. Sin. 2021, 41, 8124–8134. [Google Scholar]
- Hu, C.; Wang, Z.; Wang, Y.; Sun, D.; Zhang, J. Combining MSPA-MCR Model to Evaluate the Ecological Network in Wuhan, China. Land 2022, 11, 213. [Google Scholar] [CrossRef]
- Song, S.; Wang, S.H.; Shi, M.X.; Hu, S.S.; Xu, D.W. Multiple scenario simulation and optimization of an urban green infrastructure network based on complex network theory: A case study in Harbin City, China. Ecol. Processes 2022, 11, 33. [Google Scholar] [CrossRef]
- Li, Y.Y.; Zhang, Y.Z.; Jiang, Z.Y.; Guo, C.X.; Yang, Z.G.; Guo, M.Y.; Wu, B.Y.; Chen, Q.L. Integrating morphological spatial pattern analysis and the minimal cumulative resistance model to optimize urban ecological networks: A case study in Shenzhen City, China. Ecol. Processes 2021, 10, 63. [Google Scholar] [CrossRef]
- Shao, R.Y.; Luo, Z.W.; Hu, X.J.; Wang, Y.Z.; Zhang, J.Y. The Construction of Zhuzhou Ecological Network Based on MSPA and MCR Mode. J. Northwest For. Univ. 2023, 4, 26. [Google Scholar]
- Tian, S.J.; Zhang, W.J.; He, L.; Miao, J.Y.; Zi, Y.K. Construction and Optimization of Chengdu Ecological Network Based on Linkage Mapper and Complex Network. J. Northwest For. Univ. 2023, 38, 176–184. [Google Scholar]
- Jiang, S.X.; Li, X.; Wang, G.Q.; Chen, Y.; Weng, S.X. Regional ecological security pattern of Fujian and Guangdong networking project (Fujian section) based on the minimum cumulative resistance model. Bull. Surv. Mapp. 2023, 04, 16–22. [Google Scholar]
- Zheng, Q.M.; Hu, J.H.; Sheng, M.Z. Construction of Ecological Network in Hunan Province Based onMSPA and MCR Models. J. Nat. Sci. Hunan Norm. Univ. 2021, 44, 1–10. [Google Scholar]
- Ye, H.; Yang, Z.; Xu, X. Ecological Corridors Analysis Based on MSPA and MCR Model—A Case Study of the Tomur World Natural Heritage Region. Sustainability 2020, 12, 959. [Google Scholar] [CrossRef]
- Zhao, Y.S.; Ning, B.; Wang, R. Research on Ecological Network Problem Identification of Shenmu Based on InVEST and MCR model. Territ. Nat. Resour. Study 2023, 3, 55–60. [Google Scholar]
- Gong, S.X.; Zhang, Y.H.; Li, Y.H. Spatio–temporal variation and prediction of carbon storage in Beijing–Tianjin–Hebei region—A PLUS—InVEST model approach. J. Arid. Land Resour. Environ. 2023, 37, 20–28. [Google Scholar]
- Li, S.P.; Liu, J.L.; Lin, J.; Fan, S.L. Spatial and Temporal Evolution Simulation of Eco economic SystemCoordination in Fujian Province Under Land Use Scenarios. J. Soil Water Conserv. 2021, 28, 234–241. [Google Scholar]
- Shen, R.; Shi, Z.T.; He, G.X.; Xu, R. Construction and Optimization of the Ecological Security Pattern of Xishuangbanna Based on Fragmentation Index. Trop. Geogr. 2022, 42, 1363–1375. [Google Scholar]
- Wei, B.J.; Su, J.; Hu, X.J.; Xu, K.H.; Zhu, M.L.; Liu, L. Comprehensive identification of eco-corridors and eco-nodes based on principle of hydrological analysis and Linkage Mapper. Acta Ecol. Sin. 2022, 42, 2995–3009. [Google Scholar]
- Cao, X.; Liu, Z.; Li, S.; Gao, Z. Integrating the Ecological Security Pattern and the PLUS Model to Assess the Effects of Regional Ecological Restoration: A Case Study of Hefei City, Anhui Province. Int. J. Environ. Res. Public Health 2022, 19, 6640. [Google Scholar] [CrossRef]
- Wang, Z.F.; Liu, Y.; Xie, X.Q.; Wang, X.Q.; Lin, H.; Xie, H.L. Identifying Key Areas of Green Space for Ecological Restoration Based on Ecological Security Patterns in Fujian Province, China. Land 2022, 11, 1496. [Google Scholar] [CrossRef]
Disclaimer/Publisher’s Note: The statements, opinions and data contained in all publications are solely those of the individual author(s) and contributor(s) and not of MDPI and/or the editor(s). MDPI and/or the editor(s) disclaim responsibility for any injury to people or property resulting from any ideas, methods, instructions or products referred to in the content. |
© 2023 by the authors. Licensee MDPI, Basel, Switzerland. This article is an open access article distributed under the terms and conditions of the Creative Commons Attribution (CC BY) license (https://creativecommons.org/licenses/by/4.0/).