Article

Analysis of Land Use Change Characteristics and Its Driving Forces in the Loess Plateau: A Case Study in the Yan River Basin

1
State Key Laboratory of Soil Erosion and Dryland Farming on the Loess Plateau, Institute of Soil and Water Conservation, Northwest A&F University, Yangling 712100, China
2
State Key Laboratory of Soil Erosion and Dryland Farming on the Loess Plateau, Institute of Soil and Water Conservation, Chinese Academy of Sciences and Ministry of Water Resources, Yangling 712100, China
3
University of Chinese Academy of Sciences, Beijing 100000, China
*
Author to whom correspondence should be addressed.
Land 2023, 12(9), 1653; https://doi.org/10.3390/land12091653
Submission received: 1 July 2023 / Revised: 21 August 2023 / Accepted: 21 August 2023 / Published: 23 August 2023

Abstract

:
Land resources are closely intertwined with human survival, making it crucial to explore the spatiotemporal changes and driving forces of land use. In this study, the Yan River Basin in the Loess Plateau was selected as the study area. The Mann–Kendall trend test, Pettitt’s test, landscape pattern indices, and other methods were employed to explore characteristics and driving factors of land use change from 1990 to 2020. The results indicate that: (1) The areas of forest and impervious showed a significant increasing trend and suddenly changed in 2004. Change-point years for the area of cropland and grassland were 2005 and 1999, respectively. The main transition of land use types was from cropland to grassland and from grassland to forest. (2) Patches showed a trend towards regularization and simplification, indicating the strengthening of human activities’ impact on spatial patterns. (3) Both social and natural factors jointly influenced land use change in the Yan River Basin. The Grain for Green (GfG) project was the main driving factor in accelerating land use transformation. This study aims to provide a basis for the scientific management of land resources and serve as an example for related research on land use change in the Loess Plateau.

1. Introduction

Land resources are an essential carrier for social development and human activities, land use is the core area where human activities interact with the ecological environment [1], and the long-term or cyclical management activities carried out by humans on land have a profound impact on the ecological system and land use patterns [2]. Human activities impact land resources, including urbanization, natural resource exploitation, landscape homogenization, and the massive input of energy and nutrients [3,4]. Land use types are commonly regarded as a factor that influences the variations in runoff and sediment [5,6], water quality [7], soil nutrients [8], and ecosystem service functions [9] when analyzing their impacts. Unreasonable land use will cause environmental problems, such as land degradation, soil erosion, climate change, and so on [10]. The spatial and temporal distribution of land resources is highly heterogeneous and complex, and the rapid development of the socio-economy and intensification of human activities further deepened the contradictions between the limited land resources and various demands [11,12]. The drivers of land use change can generally be categorized into two types: natural drivers, such as climate [13], geology and geomorphology, hydrological characteristics [14], etc., and social drivers, such as population dynamics, political and economic systems [15], culture [16], etc. As one of the most severely eroded regions in the world, the Loess Plateau in China received substantial attention under government-led land restoration policies [17]. From 1970 to the end of the last century, the Loess Plateau implemented multiple land restoration projects focused on vegetation restoration, soil and water conservation measures (SWC), and desertification control, resulting in drastic changes in land use types. Therefore, comprehensively and accurately characterizing the spatial and temporal changes in land use and its application to specific regional practices has significant practical significance for improving the level of land use planning and efficiency.
Land use change is an essential component and determinant of global environmental change and a primary manifestation of landscape pattern change in terrestrial systems. Changes in landscape patterns can be observed through land use variations since land use alterations lead to changes in landscape patterns [18,19]. Landscape pattern indices highly condense information about landscape patterns and serve as quantitative indicators reflecting characteristics such as structural composition and spatial configuration. Landscape pattern indices are important methods in landscape ecology research, as they can reveal detailed characteristics of landscape patterns and internal spatial variations, providing further descriptions of landscape attributes [20]. Therefore, landscape indices are crucial in landscape pattern observation, assessment, and planning [21,22,23]. The Loess Plateau, where the impact of human activities on the natural environment is increasingly pronounced, is undergoing significant changes in land use patterns. However, traditional manual land survey methods, which heavily rely on human labor, face challenges in achieving real-time monitoring across the entire region. These methods have limitations such as discontinuous historical data, poor comparability, and inadequate ability to meet long-term monitoring requirements. Remote sensing monitoring can provide comprehensive and quantitative land information, including land types, vegetation coverage, land use changes, etc. Extensive and continuous land information can be obtained through the acquisition and analysis of remote sensing imagery and data, aiding in our understanding of the spatiotemporal distribution characteristics of land use [24]. In the early stages, researchers typically relied on a limited number of land use datasets to analyze land use changes. For instance, Abdullah et al. (2006) utilized land use data from three periods spanning 1966, 1981, and 1995. This study presented a case study in Selangor, Malaysia to elucidate the response of landscape patterns and types to land use changes [25]. Liu et al. (2010) utilized land use data from two periods, 2000 and 2005, to analyze land use changes and their driving factors [26]. It should be noted that the land use data used in the study had a relatively low spatial resolution. This type of land use data can only demonstrate whether land use changed over a certain period and the magnitude of the changes. With the advancement and iteration of remote sensing technology, we now have the opportunity to use higher temporal resolution remote sensing data to conduct more detailed analyses of land use change. For example, Guo et al. (2019) explored landscape changes in the Beijing–Tianjin corridor using land use data from 2000, 2005, 2020, and 2015 [27]. Zhu et al. (2021) conducted a study on the spatiotemporal changes in land use and landscape patterns in the Liuxihe River basin of Guangzhou using land use thematic maps derived from satellite images from 1980, 1990, 1995, 2000, 2005, 2008, 2010, and 2015 [28]. The research focused on examining the temporal and spatial variations of land use and landscape patterns in the Liuxihe River basin of Guangzhou in the context of rapid urbanization. Zhou et al. (2021) selected land use data from 1980, 1990, to 2015 with a 5-year time interval to differentiate the spatiotemporal variations in land use changes at the county scale during two study periods: 1980–2000 and 2000–2020 [29]. In recent years, the storage, processing, and sharing of remote sensing big data placed high demands on computer performance. At the 2011 American Geophysical Union Fall Meeting, the integrated spatial big data and cloud computing platform, Google Earth Engine, was introduced, which incorporates various satellite images [30]. With the support of this new technology, researchers can construct high-resolution annual time series thematic datasets. For example, Hansen et al. (2013) produced maps of global forest loss (2.3 million square kilometers) and gain (0.8 million square kilometers) from 2000 to 2012, with a spatial resolution of 30 m, which is continuously updated [31]. Pekel et al. (2016) created a global surface water dataset covering 1984 to 2015 [32]. Yang et al. (2021) computed annual land cover data for China from 1990 to 2019 [33]. Thus, the construction of data based on annual continuous time series provides unprecedented opportunities for the spatiotemporal analysis of land use.
The Loess Plateau is the region with the most severe soil erosion and the most fragile ecological environment in China and even in the world. Out of the total area of 6.4 × 10⁵ square kilometers in the Loess Plateau, the area affected by soil erosion accounts for 4.54 × 10⁵ square kilometers. Soil erosion leads to land degradation and environmental deterioration, posing a serious threat to human survival [34,35]. In the late 1990s, the Chinese government implemented the Grain for Green (GfG) program, which greatly increased the vegetation cover of the Loess Plateau [36], improved the ecological environment, significantly reduced the sediment discharge of river channels in river basins, and caused significant changes in land use patterns [37]. The Yan River Basin (YRB), located in the B2 sub-region of the Loess Plateau, is a typical hilly–gully region in the Loess Plateau. The soil type in the YRB is classified as loessial soil, characterized by loose soil texture and fragmented topography. Due to long-term steep slope cultivation and excessive deforestation, the vegetation in this area was severely damaged, resulting in significant soil erosion. The YRB is located in Yan’an City, Shaanxi Province, China. Yan’an City holds significant importance for China regarding politics, economy, and environment. Moreover, the Yan’an region actively responded to the Chinese government’s GfG project, leading to significant changes in land use types and landscape patterns. Soil erosion is the most significant ecological and environmental issue. With the implementation of the GfG program, exploring the characteristics of land use change before and after the implementation of GfG policy in the YRB and conducting attribution analysis can provide a typical example for the study of land use change in the entire Loess Plateau.
Although researchers extensively explored the characteristics of land use change and landscape pattern changes in the Loess Plateau region [38,39,40], studies on land use change generally rely on sparse and discontinuous sequences, lacking continuous long-term spatiotemporal information. This limitation results in an insufficient understanding of when changes occur, their persistence, and trends, thereby hindering a comprehensive exploration and discussion of the driving forces behind land use. Therefore, this study selects a typical watershed, the YRB, located in the Loess Plateau, as the study area and analyzes land use changes and their driving forces based on annual long-term sequence data. The objectives of this study are as follows: (1) to examine the spatiotemporal distribution characteristics of land use change in the YRB from 1985 to 2020 and the mutual conversions between different land use types; (2) to characterize the spatial configuration of the landscape pattern in time and space; and (3) to assess the major driving factors of land use type changes from 1990 to 2020.

2. Materials and Methods
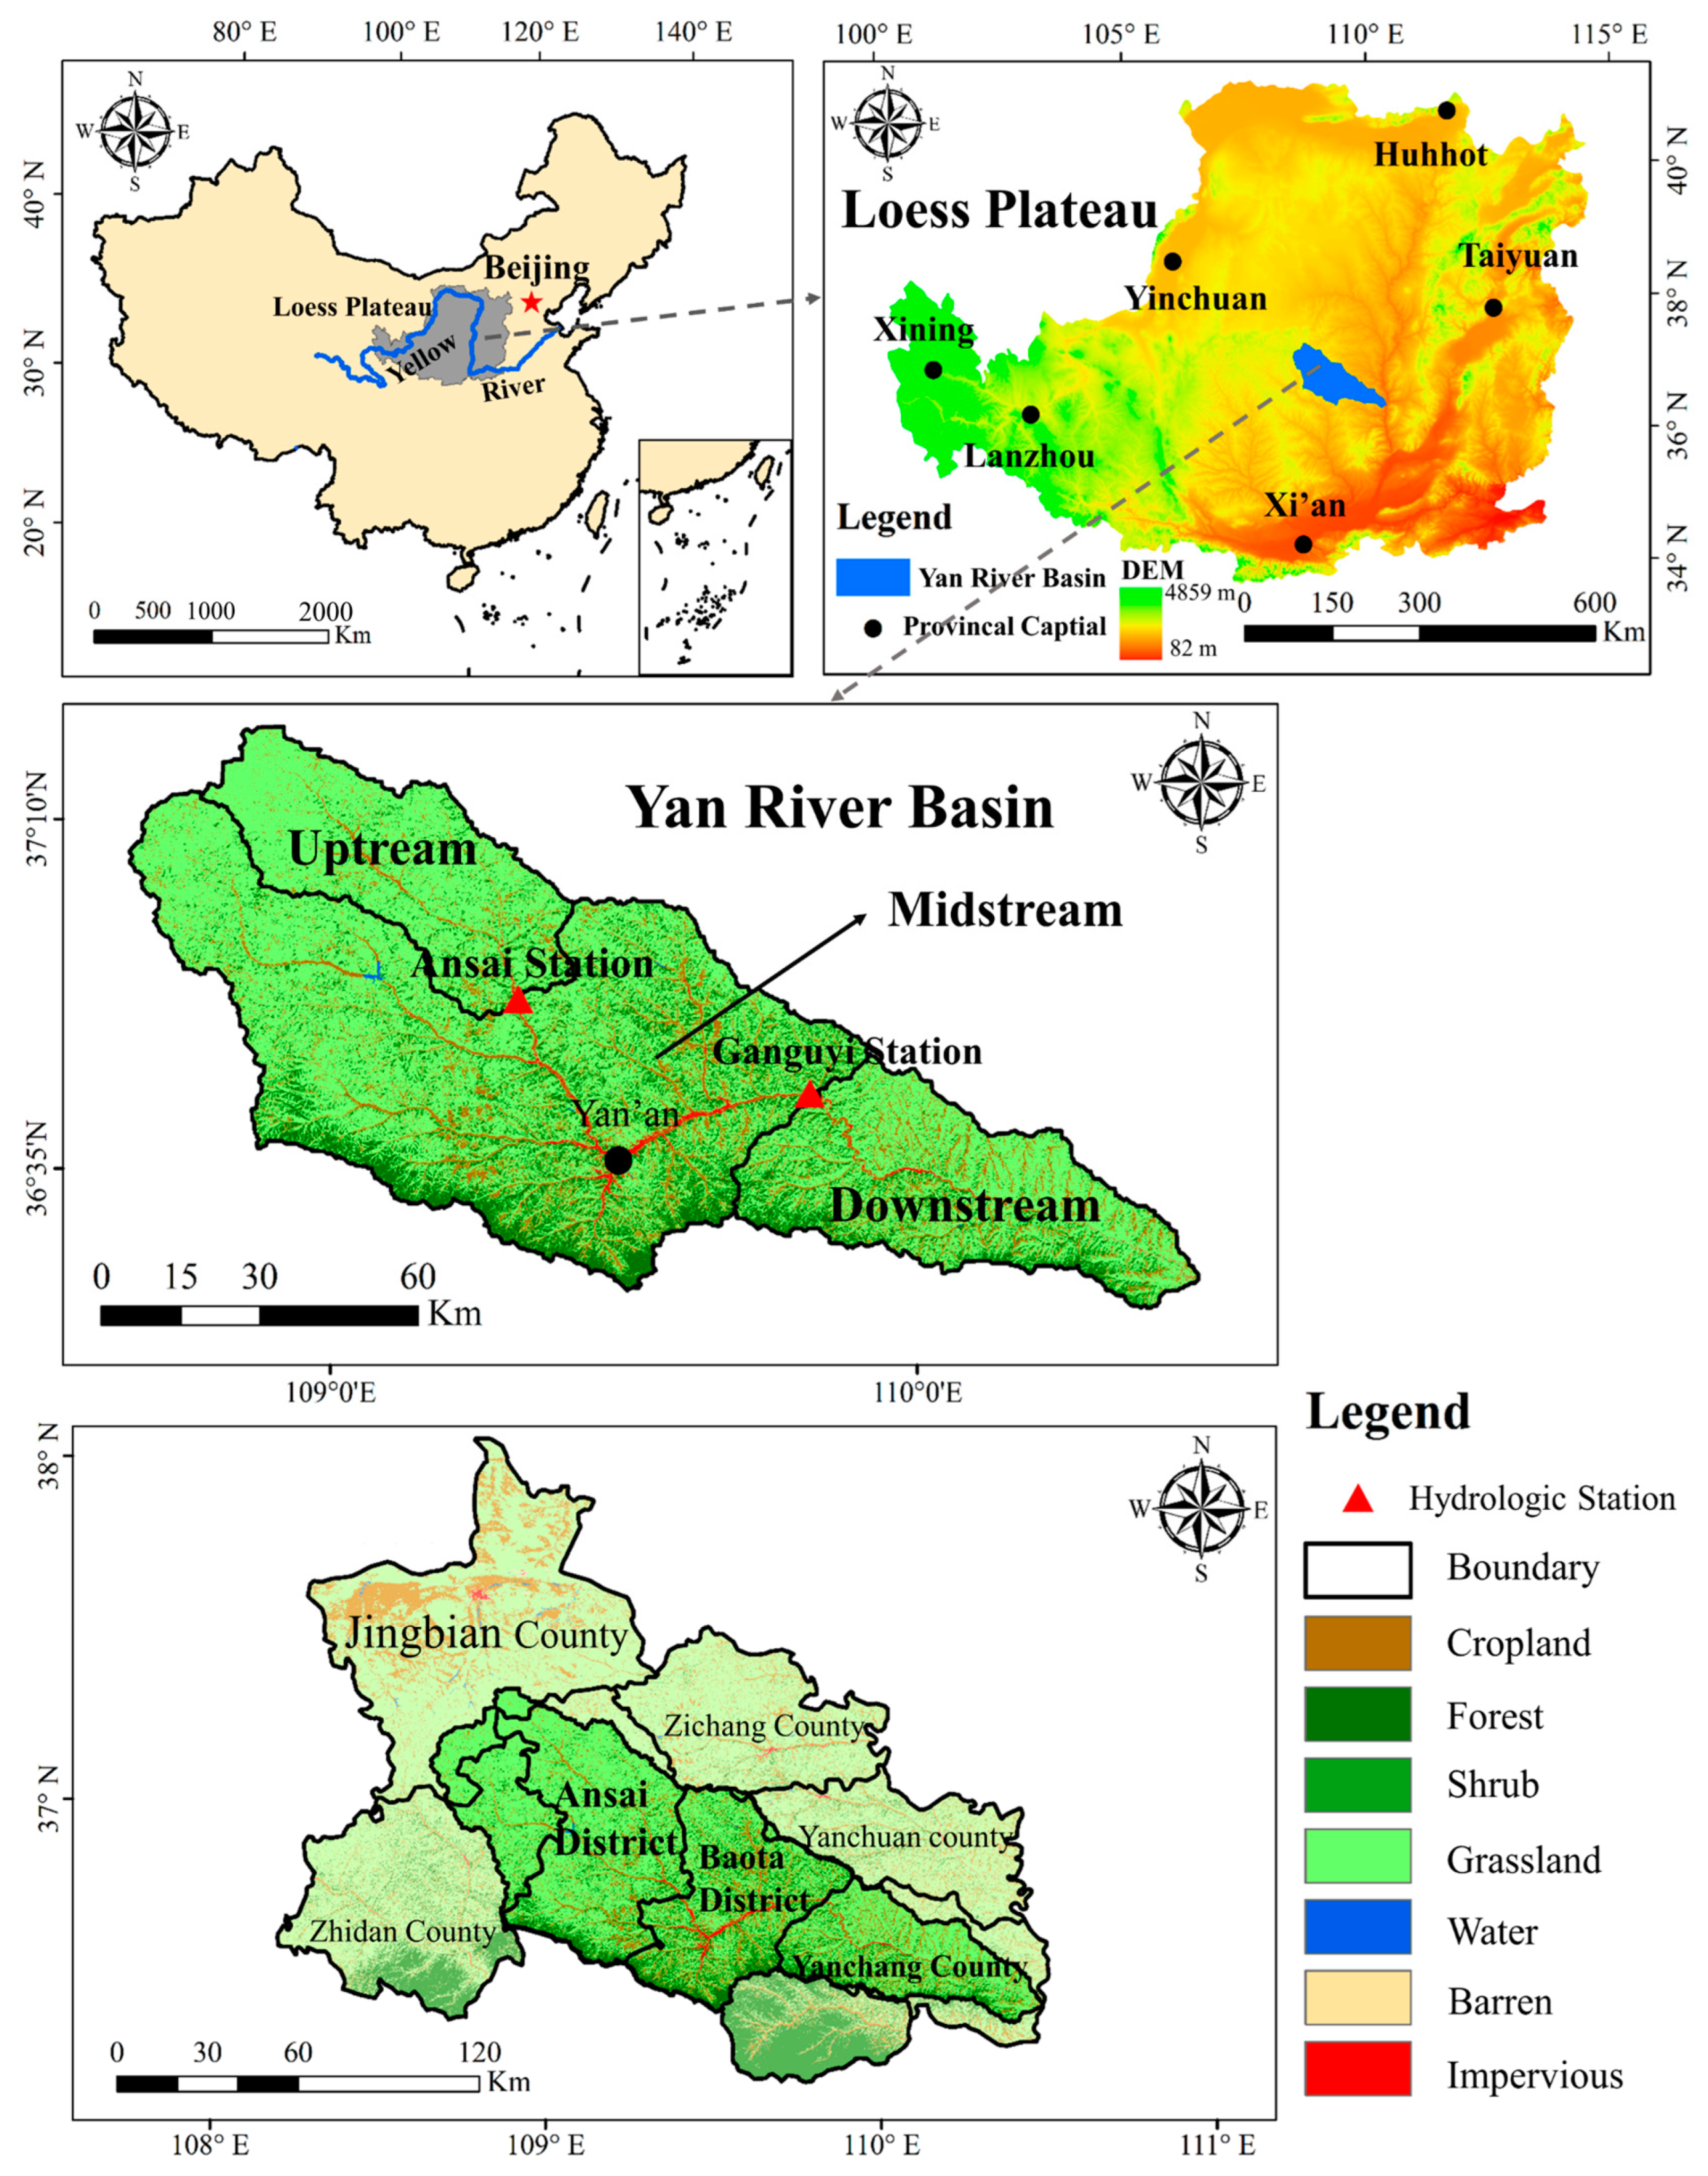
2.1. Study Area

The YRB (36°21′–37°19′ N, 108°38′–110°29′ E) is located in the middle part of the Loess Plateau (Figure 1). It originates from Gaomiao Mountain in the southeast of Jingbian County, and is a primary tributary of the Yellow River, with a drainage area of 7725 km² and a length of 286.9 km. The Yan River flows from northwest to southeast and passes through several counties, including Jingbian, Ansai, Baota, Zhidan, and Yanchang. According to the geographic location of the Yan River hydrologic station, the YRB is divided into three regions: upper, middle, and lower reaches. The upper reach runs from the river source to Zhenwudong Town in Ansai District. The riverbed has a large drop, sparse vegetation, and severe soil erosion. The middle reach runs from Zhenwudong Town to Ganguyi Town in Baota District. The river valley is wide, and the erosion is less severe than the upper reach. The lower reach runs from Ganguyi Town to the estuary. The mesas are narrow, and the gullies are developed. The soil erosion is relatively severe. The YRB belongs to a typical warm-temperate continental monsoon climate, with a multi-year average rainfall of 502.6mm, mainly concentrated in the flood season (June to September) [41], which accounts for 72.9% of the annual rainfall. The annual variation in rainfall is significant, and the seasonal distribution is uneven, leading to frequent droughts and floods in alternate years. The main administrative districts in the research area include Ansai District, Baota District, and Yanchang County, with population figures of 19.57 × 10⁴, 48.33 × 10⁴, and 15.32 × 10⁴, respectively, in the year 2020. The main soil type in the research area is the easily eroded loessial soil [42]. Multi-year average runoff in the area is 2.89 × 10⁸ m3, with a runoff modulus of 3.74 × 10⁴ m3/km2·a. Land use types in the study area mainly include cropland, forest, shrub, grassland, water, barren, and impervious.

2.2. Data Sources

2.2.1. Land Use Dataset

The data source for this study is the China Land Cover Dataset (CLCD) [33], which is widely used for research on land use change and related topics [43,44,45,46,47]. CLCD exhibits the characteristics of a long-term time series and high accuracy. CLCD utilized Landsat images provided by Google Earth Engine to construct indicators and obtain classification results using the random forest classifier. A combination of spatiotemporal filtering and logical inference was used as a post-processing method to calculate China’s annual land cover dataset from 1985 to 2020. The spatial resolution of the data is 30 m. Due to the uneven coverage of Landsat 5 data before 1990, the CLCD before 1990 was presented separately as the data for 1985. CLCD consists of nine land cover types, including cropland, forest, shrub, grassland, water, snow/ice, barren, impervious, and wetland, with an overall accuracy of 79.31%. In this study, the impervious was considered as the construction land.
In this study, land use data from five significant years, namely 1985, 1990, 2000, 2010, and 2020, were selected for traditional statistical analysis. Additionally, land use data from 1990 to 2020, representing continuous observations, were chosen for trend analysis, change point analysis, and subsequent exploration of driving factors.

2.2.2. Economic and Demographic Data

Economic and demographic data used in this study were obtained from Yan’an statistical yearbooks (http://tjj.yanan.gov.cn/tjxx/tjsj/tjnj/1.html, accessed on 1 June 2023), and the economic and demographic data of Baota District, Ansai District, and Yanchang County were selected, respectively.

2.2.3. Precipitation Data

The precipitation data used in this study were sourced from the National Tibetan Plateau Data Center (https://data.tpdc.ac.cn/, accessed on 1 June 2023). The spatial resolution of this dataset is approximately 1 km. The dataset was downscaled for the China region using the Delta spatial downscaling method, based on the global 0.5° climate data from CRU and the high-resolution global climate data from WorldClim. The dataset was validated, and the results are reliable [48].

2.3. Methods

2.3.1. Land Use Intensity

The Land Use Intensity Composite Index refers to the degree of transformation and change in land resources in human development and utilization. A higher value indicates a greater intensity of human land use in that area, while a lower value indicates the opposite [49,50]. Its calculation formula is:
L a = 100 × i = 1 n A i · C i               L a [ 100,400 ]
where La represents the comprehensive index of land use intensity. Ai and Ci represent the grading index and area proportion of the i-th level of land use intensity classification in the study area, respectively. N represents the number of levels of grading. The land use grading index for barren land is 1; for forest, grassland, and water, the land use grading index is 2; for cropland, the land use grading index is 3; and for impervious, the land use grading index is 4.

2.3.2. Selection of Spatial Pattern Indices

Many indices can be used to characterize landscape patterns, but many have similar meanings and high correlations [51]. Therefore, when conducting landscape pattern analysis, landscape pattern indices can be screened to reflect the characteristics of landscape patterns objectively. Based on the actual conditions of the YRB, 6 landscape pattern indices were selected in this study (Table 1). In this study, the grid analysis method was employed, dividing the study area into grid cells measuring 3 km × 3 km in size [52]. The landscape metrics are calculated using Fragstats 4.2 (https://fragstats.org/, accessed on 1 June 2023).

2.3.3. Mann–Kendall Trend Test

The Mann–Kendall (M-K) non-parametric trend test is widely used to detect trends in time series data. However, the existence of sequence correlation can affect trend identification [54]. Therefore, this study used the trend-free pre-whitening (TFPW) method [55] to preprocess the data, eliminating the correlation in the original time series to obtain a new time series. The M-K trend test was then used to analyze the new sequence. The positive (negative) value of statistic Z indicates an upward (downward) trend in the sequence. When the absolute value of Z is greater than 1.96 and 2.58, it indicates that it passed the significance test with α = 0.05 and α = 0.01, respectively.

2.3.4. Pettitt Change-Point Detection Test

Pettitt’s test for detecting abrupt changes in a time series is a non-parametric statistical test [56]. Determining the time of a change point by testing the significant change in the mean of a time series can effectively avoid the influence of data distribution characteristics and the interference of outliers. Pettitt’s test is widely used in environmental studies and hydrology, among other fields. For a time series with a sample size of N, the test statistic is constructed as follows:
U t ,   N = U t 1 ,   N + j = 1 N s g n x t x j
where t = 2, ..., N. Let xt − xj = θ, then the value of sgnθ is determined by the following formula:
s g n + 1   θ > 0 0         θ = 0 1   θ < 0

3. Results and Discussion

3.1. Temporal Changes in Land Use Characteristics for Five Representative Years

3.1.1. Changes in Land Use Area

As shown in Table 2, the cropland in the YRB consistently decreased, with its proportion declining from 28.70% in 1985 to 10.19% in 2020, resulting in a reduction of 1422.56 km² in area. The proportion of forest land increased from 6.59% in 1985 to 16.77% in 2020. The grassland area showed an initial increase and subsequent decrease, with its proportion rising from 64.37% in 1985 to 80.16% in 2010 and then declining to 72.13% in 2020. The impervious area showed a continuously increasing trend, increasing by 44.44 km² from 1985 to 2020.
The main land use types in the upper, middle, and lower reaches of the YRB showed the following changes over time (Table 3): In the upper catchment, the dominant land use types in 1985 were cropland and grassland, accounting for 24.26% and 75.51%, respectively. The cropland area in the upper catchment decreased over time, while the grassland area initially experienced a substantial increase followed by a slight decline. By 2020, the main land use types in the upper catchment transformed to cropland (6.20%), forest (6.28%), and grassland (87.13%). In the middle catchment, the primary land use types in 1985 were cropland, forest, and grassland, accounting for 30.08%, 8.04%, and 61.53%, respectively. Compared to the upper catchment, the forest area in the middle reaches showed a significant increase. Although the proportion of impervious area in the middle catchment is not high, by 2020, it hexpanded to 45.05 km², more than five times the impervious area in 1985. Figure 2 shows a noticeable increase in the impervious area in the middle catchment. In 1985, the cropland, forest, and grassland proportions in the lower catchment were 28.61%, 8.06%, and 62.87%, respectively. By 2020, these proportions changed to 12.71%, 17.25%, and 69.42%. The changes in cropland and grassland areas in the lower catchment were not as drastic as those in the upper and middle catchment.
In summary, from 1985 to 2020, the predominant land use types in the YRB were cropland, forest, and grassland, with average proportions of 18.27%, 9.15%, and 72.02%, respectively. Grassland was the main land use type in the upstream area of the YRB, while cropland, forest, and grassland were the primary land use types in the middle and lower catchment. The impervious in the YRB were primarily concentrated in the middle reaches. By 2020, the impervious area in the middle catchment accounted for 75.89% of the total impervious area in the entire basin.

3.1.2. Conversion of Land Use Types

Based on the land use transition matrix of the YRB (Table 4), from 1985 to 1990, the changes in land use types were relatively small, with the predominant transition occurring between cropland and grassland. From 1990 to 2000, the cropland area within the YRB decreased by 12.84%, being mainly converted to grassland and impervious. The grassland area witnessed the highest increase, with a net addition of 12.50%, predominantly sourced from cropland. From 2000 to 2010, the cultivated land area within the basin continued to decrease, being converted to forest land, grassland, and construction land. Among these conversions, 95.17% of the converted area went to grassland. The grassland area was transferred into 6.36% and out 4.46%, mainly into cultivated land and forest land. From 2010 to 2020, the area of cropland within the basin slightly increased, mainly from the conversion of grassland; the area of forest land increased by 7.76%, mainly from the conversion of grassland and cropland; the area of grassland decreased by 7.99%, mainly converted to cropland and forest land; and the area of impervious increased by 0.22%, mainly from the conversion of cropland and grassland. Overall, during the study period, the main transitions in land use types in the YRB were from cropland to grassland and from grassland to forest.

3.1.3. Land Use Intensity

The comprehensive index of land use intensity in the YRB shows a trend of initial decrease followed by a slight increase (Figure 3), ranging from 211.01 to 228.82. The minimum value was reached in 2010, with a slight increase observed in 2020. Due to variations in topography, human activities, and socio-economic development, the upper, middle, and lower regions exhibit different land use intensity trends. Due to its topographical characteristics characterized by a large number of valleys and ravines in hilly terrain, the upstream areas are unsuitable for agricultural cultivation activities and the development of production projects. Consequently, the land use intensity index in the upper region is the lowest and exhibits a continuous decline throughout the study period. The middle and lower regions show a similar trend of initially decreasing and then slightly increasing land use intensity. Before 1990, the middle region had the highest land use intensity, while after 1990, the lower region had the highest. This is attributed to the higher proportion of cropland and impervious in the middle and lower regions compared to the upper region.

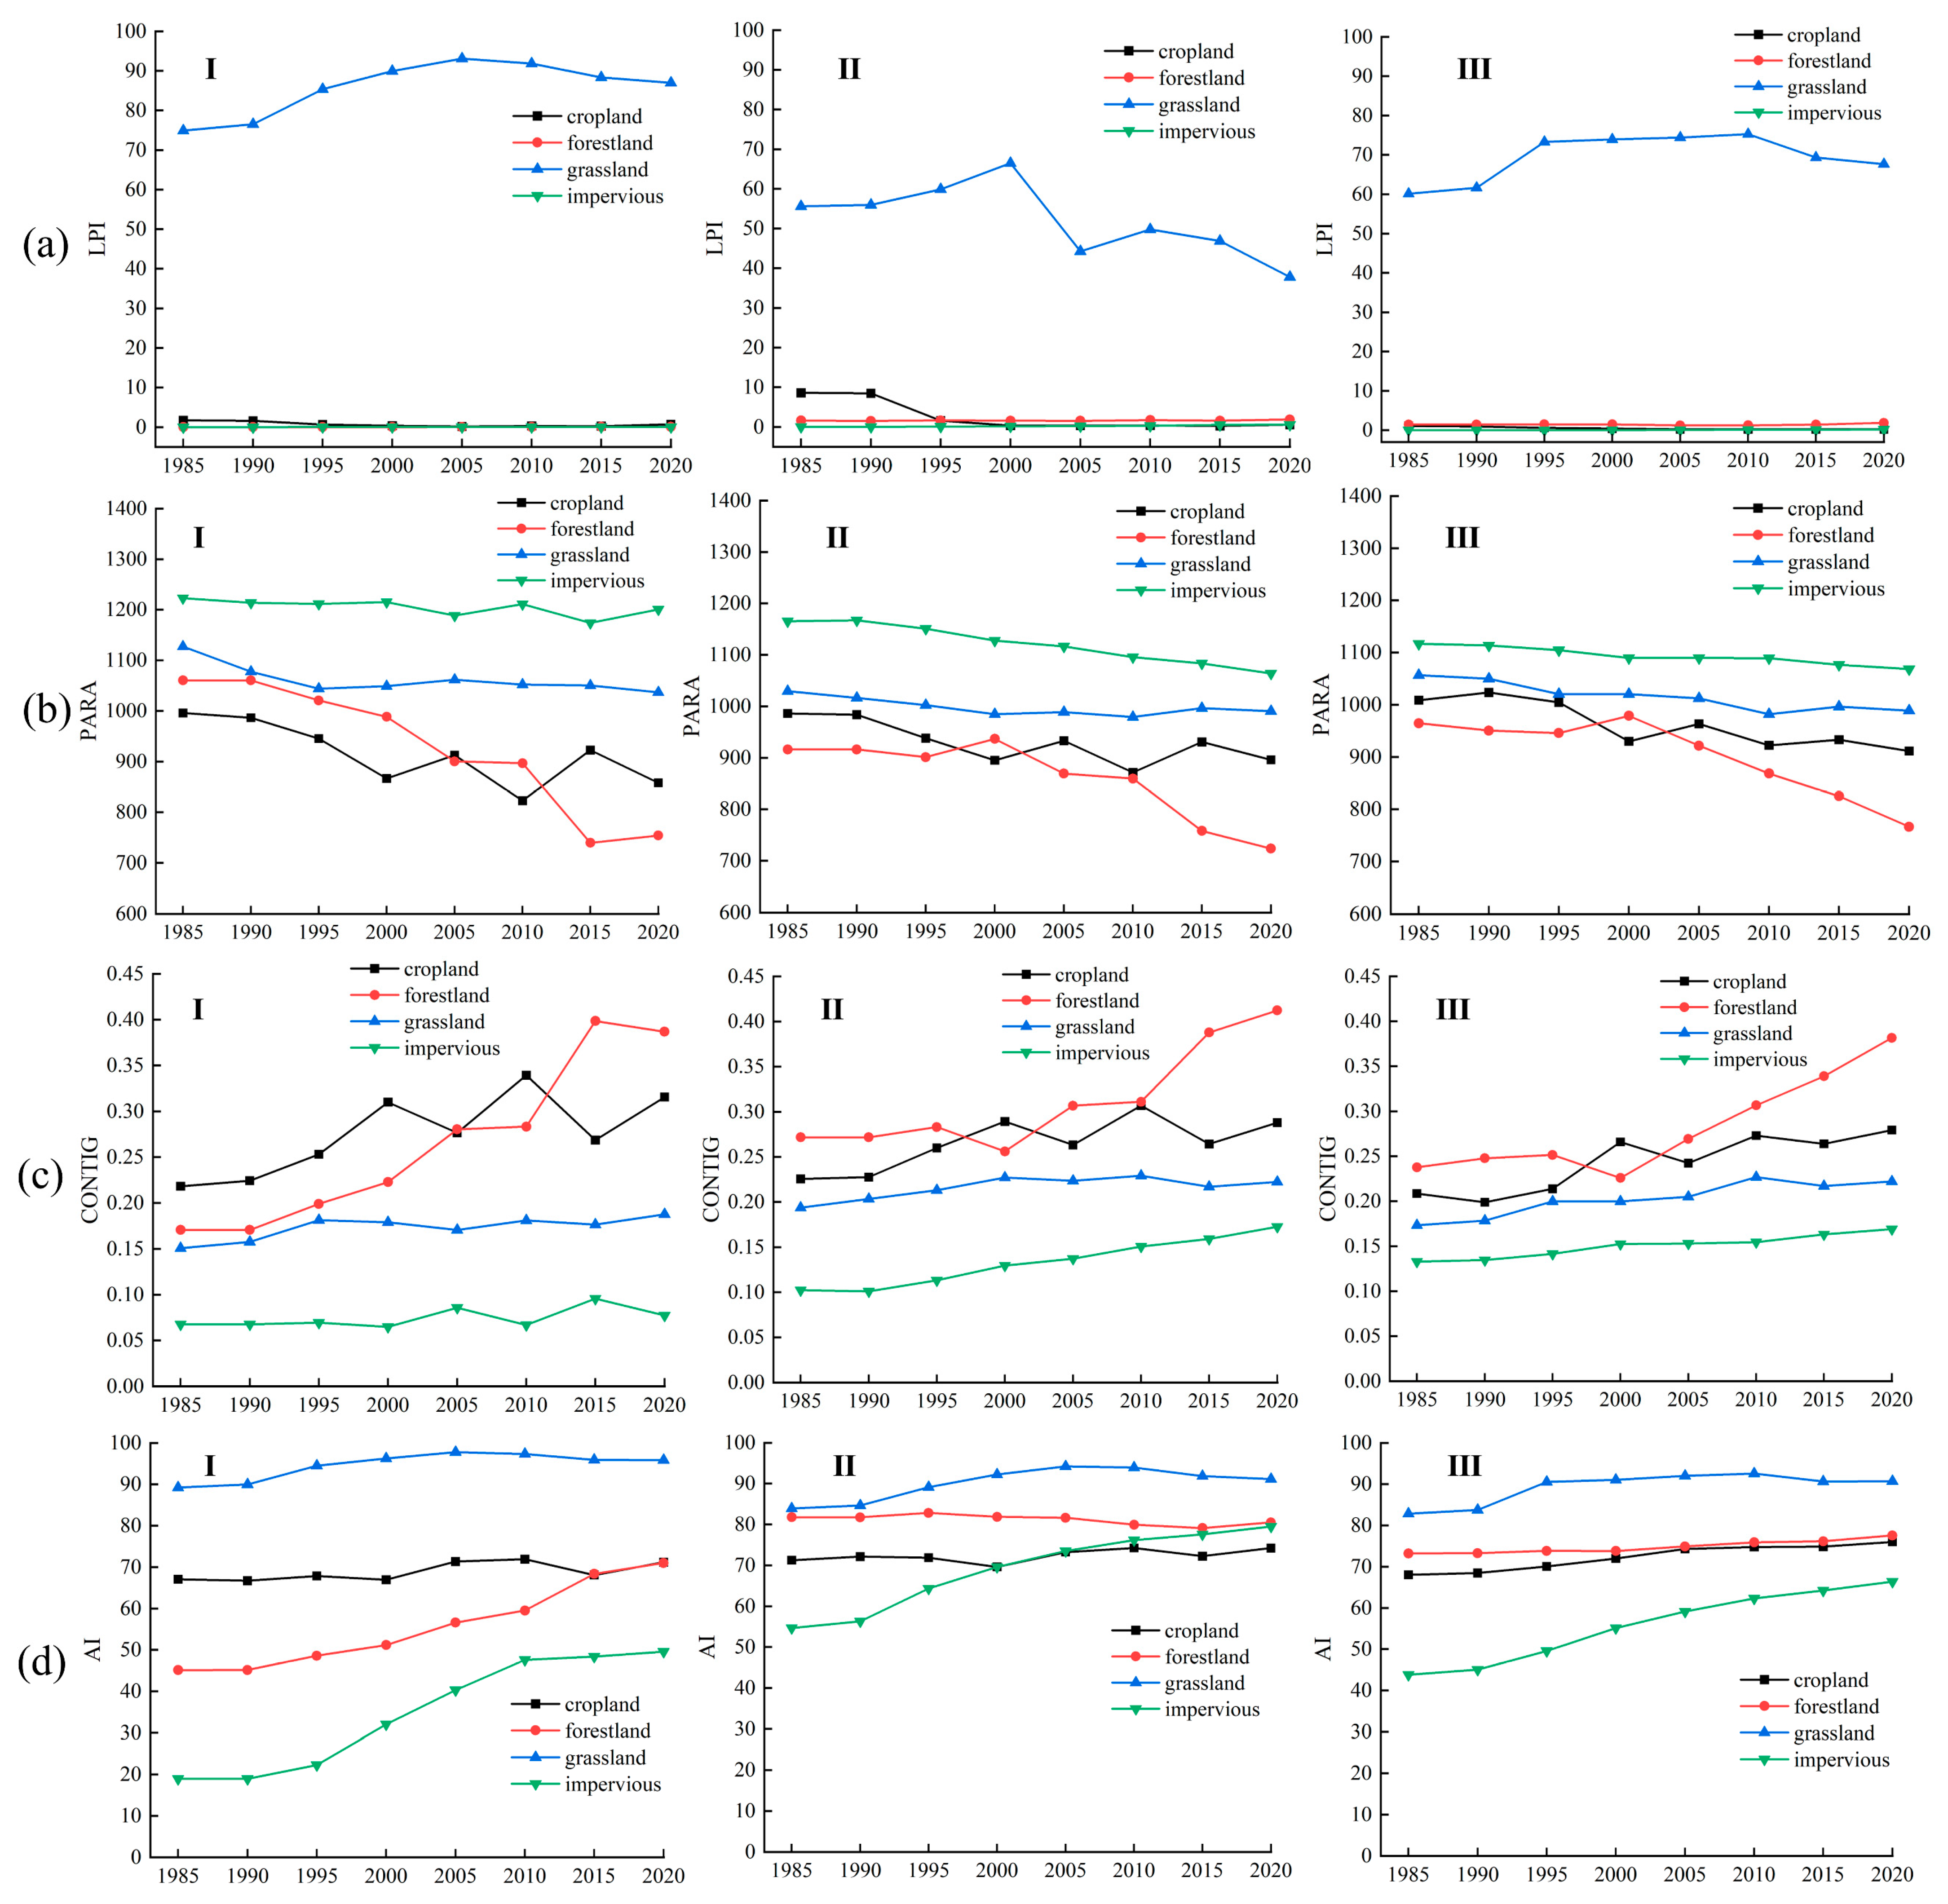
3.2. Analysis of Spatial Pattern Evolution of Land Use

To avoid statistical and monitoring errors when comparing year by year, this study used landscape pattern indices at 5-year intervals for analysis. The main focus is on the spatial structural characteristics of cropland, forest, grassland, and impervious in the upstream, middle, and downstream regions of the basin before, during, and after the implementation of ecological engineering measures.

3.2.1. Changes of Landscape Metrics at Landscape Level

At the landscape level (Figure 4), LPI increased first and then decreased in the upper, middle, and lower reaches, indicating that the dominance of the largest patch gradually increased and then decreased. Compared to the middle and lower reaches, the LPI value was highest in the upper reaches, and the LPI value was smallest in the middle reaches, indicating that the dominance of the largest patch was the highest in the upper reaches. During the study period, PAFRAC consistently decreased in the upstream, midstream, and downstream areas, indicating a trend of simplified patch shapes. From 1985 to 2020, AI gradually increased and then slightly decreased in the upstream and middle reaches, indicating that patches became more aggregated before 2005 and then became more dispersed. Among them, AI was the highest in the upstream area, indicating the highest level of patch aggregation. SHDI decreased first in the upstream, midstream, and downstream areas and then increased after 2005, indicating that land use types became simpler first and then more diverse, and the degree of fragmentation decreased first and then increased. In general, the landscape pattern in the YRB showed an overall aggregation trend during the study period. The shape of the patches tended to become more regular and simplified, which could be attributed to increased human disturbance. The regularity and simplicity of the patches may hinder species diversity.

3.2.2. Changes of Landscape Metrics at Class Level

  • Cropland
As shown in Figure 5, the LPI of cropland in the upper, middle, and lower reaches of the YRB are very low, and during the study period, they showed a trend of first decreasing significantly and then slightly increasing. During the study period, the PARA of cropland in the upstream, middle, and downstream regions fluctuated and decreased over time. In the upstream, middle, and downstream regions, the CONTIG of cropland fluctuated, showing an overall increasing trend. In the middle and upper reaches, the AI of cropland fluctuated, while in the downstream region, the AI of cropland slightly increased over time. During the study period, the cultivated land patches became more regular in shape, with enhanced connectivity. However, the aggregation trend of cropland patches was not evident.
2.
Forest
The LPI of the forest was almost zero upstream during the research period. In the midstream, the LPI of the forest gradually increased over time, but the increase was very minimal. The LPI of the forest decreased slightly at first and then grew downstream. In the middle and lower reaches, the PARA of the forest initially increased and then decreased. In the upper reaches, the PARA of the forest consistently decreased until a slight increase after 2015. The CONTIG of the forest increased gradually with time in the upstream region, while CONTIG decreased first and then increased in the middle and downstream regions. The change in AI in the middle reaches of the forest land was small, and it showed a continuous increasing trend in both the upper and lower reaches of forest land, among which the increase was larger in the upper reaches. By contrast, the upstream region of the YRB exhibited the most significant increase in connectivity and aggregation of forest patches, indicating a higher degree of human intervention in this area.
3.
Grassland
The LPI of grassland showed an increasing and then decreasing trend in the upstream, midstream, and downstream areas. Among them, the LPI of grassland in the upstream area was the highest during the study period. This suggested that grassland patches are the dominant patch type in the study area and have the strongest influence on the regional ecological landscape. Throughout the watershed, the PARA of grassland fluctuated but overall showed a declining trend. The CONTIG of grassland increased gradually in the upstream region and increased first and then decreased in the middle and downstream regions. During the research period, the changes in AI of grassland remained relatively stable, showing an initial increase, followed by a decrease in the upper, middle, and lower reaches. This suggested that grassland patches did not exhibit a significant trend toward aggregation.
4.
Impervious
The LPI of impervious was almost 0, and the magnitude of change could be considered negligible. The PARA of impervious in the upper fluctuated, while the middle and lower reaches showed a decreasing trend over time. The CONTIG of the impervious fluctuated in the upstream region, while the CONTIG of the impervious in the other two regions showed an increasing trend. The AI of impervious showed a significant increase across the entire watershed. These indicators suggest that impervious patches exhibit regularity and aggregation tendencies, which may be attributed to increased human interference with the impervious.

3.3. Trend Analysis and Mutation Point Test of Land Use

3.3.1. Trend Analysis of Land Use Change

Within the study area, due to the small proportion of shrub, water, and barren, analyzing the changes in these three land use types may result in errors. Therefore, the focus of trend analysis and change point analysis is on cropland, forest, grassland, and impervious. The trend of land use change in the YRB over multiple years was evaluated using the Mann–Kendall trend test. As shown in Table 5, the absolute values of the Z statistics for cropland, forest land, and impervious surfaces are greater than 2.58, passing the significance test at the 0.01 level. The area of cropland showed a significantly decreasing trend (Z < −2.58), while the areas of forest and impervious showed significantly increasing trends (Z > 2.58). The absolute value of the Z statistic for grassland is less than 1.96, indicating that it does not pass the significance test at the 0.05 level, showing a non-significant upward trend (0 < Z < 1.96).

3.3.2. Mutation Point Test of Land Use Change

Pettitt’s test was used to determine the critical year for detecting a change point in different land use types in the YRB. From Figure 6, the lowest (highest) points for cropland, forest, and impervious appeared in 2005, 2004, and 2004, respectively, and were tested for significant change at the 0.01 significance level. This suggested that the abrupt change points of the cropland, forest, and impervious in the YRB appeared in 2005, 2004, and 2004, respectively. The highest point for grassland appeared in 1999 and was tested for significant change at the 0.05 significance level, indicating that the abrupt change points appeared in 1999. In conclusion, these four land use types experienced abrupt changes around 2000. This may be closely related to the GfG program in the Loess Plateau in 1999.

3.4. Analysis of Driving Forces

Land use change is a complex process that involves the most intimate intersection between natural and human processes [57], and its driving forces can be summarized as natural and social systems. This article primarily relied on trend analysis and change-point detection, focusing on analyzing the driving factors of land use change in the watershed, particularly the social driving factors. Due to the fact that most of the core industries and major population centers in the YRB are located in the three regions of Ansai, Baota, and Yanchang, Ansai District and Baota District represent the middle and upper reaches of the basin, while Yanchang County represents the lower reaches of the basin.

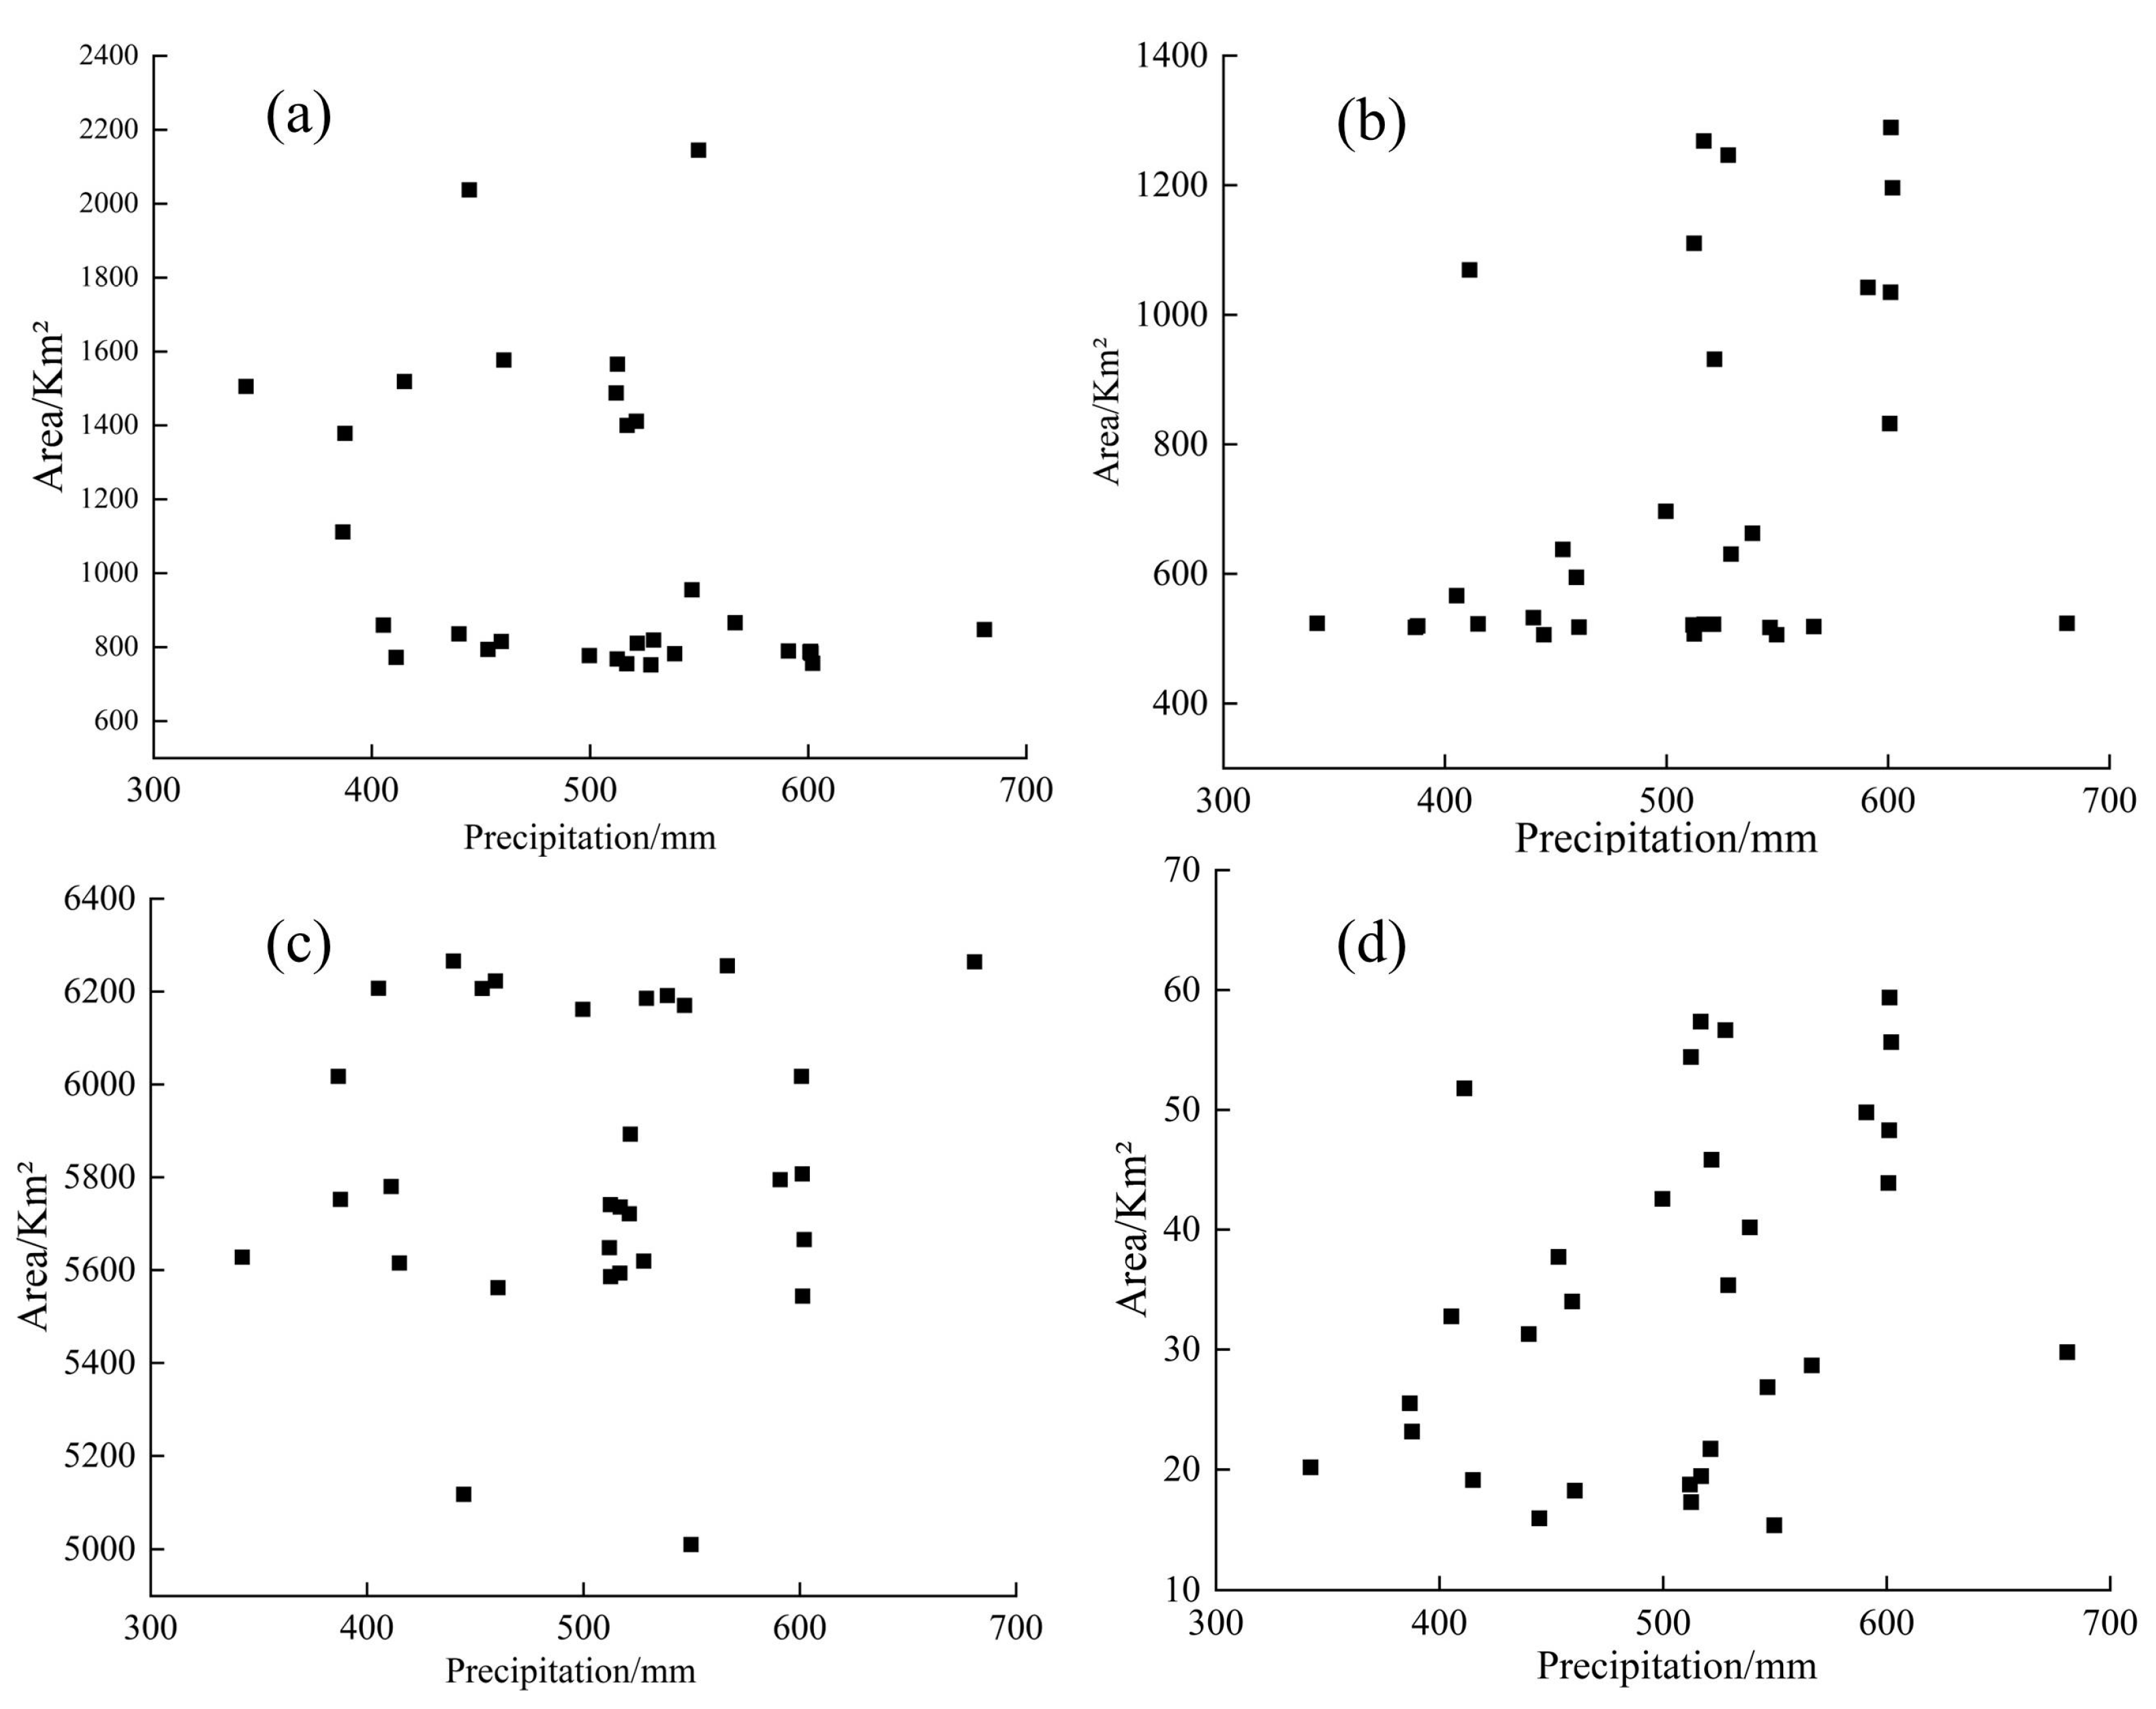
3.4.1. Natural Driving Forces

In the process of land use and its evolution, the natural environmental conditions affected the regional distribution characteristics of land use [58]. The terrain and landforms in the YRB are diverse. The upstream area belongs to a hilly and gully region, where the rainfall is relatively lower than the middle and lower reaches. Barren and cropland were mainly converted into grassland. In the middle reaches, the rainfall is relatively abundant, making it suitable for the growth of woody plants. Therefore, most of the forest land is distributed in the southern part of the middle reaches. The downstream area is characterized by fragmented loess hills, with sufficient water sources, frequent agricultural production activities, and cultivated land as the dominant land use type. Within the study area, precipitation showed an increasing trend over time, without making significant contributions to land use change (Figure 7). Many studies showed that human land use management contributes more to land use change in the region compared to natural conditions [59,60,61]. Therefore, this article focused on analyzing the driving factors from a social perspective.

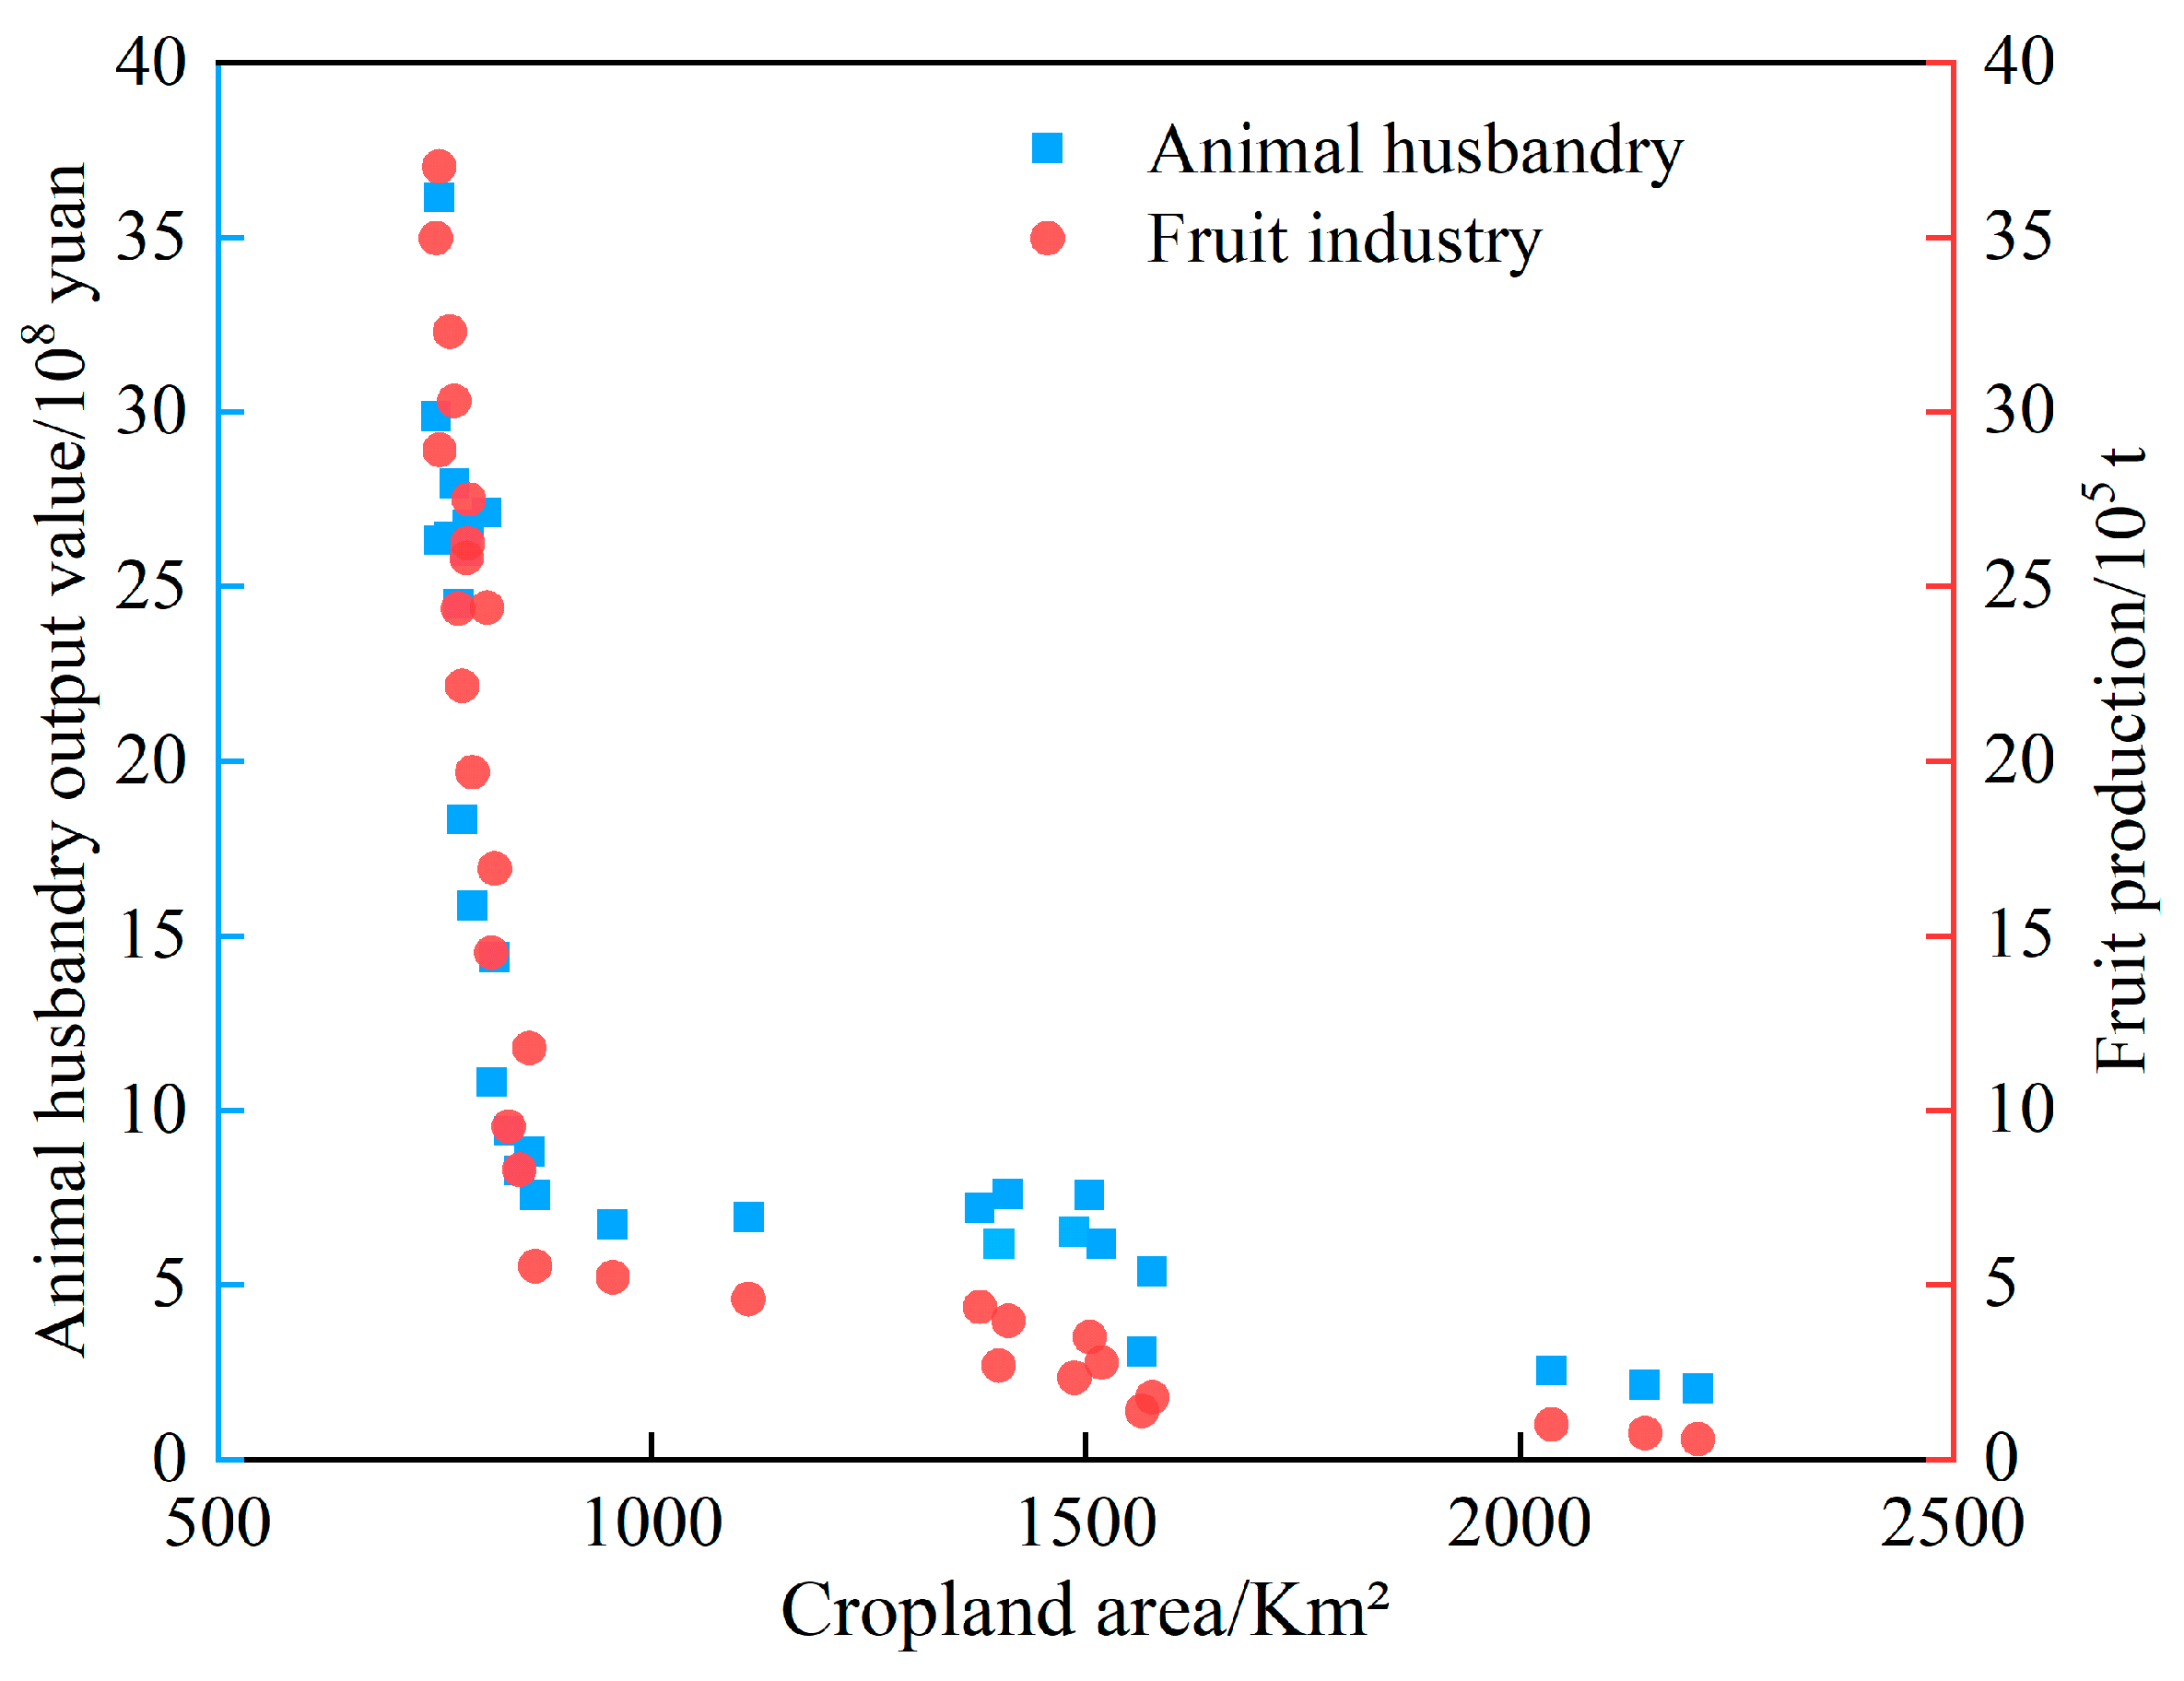
3.4.2. Social Driving Forces

In terms of policies, macro-level regulation by the national government plays a significant guiding role in land use [62]. Previous studies indicated that the substantial changes in land use types in the Loess Plateau region may be related to policies implemented by the Chinese government [63,64], such as the GfG program and the Three-North Shelterbelt Development, etc. However, most of these studies focused on examining the impact of policies on land use within a specific period without providing relatively precise results. Therefore, based on the continuous land use data from 1990 to 2020, this article employed the M-K trend and Pettitt’s test to explore the impact of land use policies on land use change. The results show that during the study period, the area of cropland and forest in the YRB showed extremely significant decreasing and increasing trends, with breakpoints occurring in 2005 and 2004, respectively (Figure 6). This can be attributed to a lag effect between the implementation of a series of ecological conservation projects and significant changes in land area. For instance, before the implementation of the GfG program in the YRB in 1999, agricultural production held a certain proportion of the regional GDP. To encourage farmers to abandon farming activities and engage in other industries, efforts and time were required for the implementation of the reforestation program. The grassland area exhibited a significant increasing trend during the study period, with a breakpoint occurring in 1999 (Figure 6). The significant change in grassland occurred relatively earlier compared to cropland and forest. Firstly, the earlier timing of significant changes in grassland area is related to human activities caused by policy implementation. In 1991, the “People’s Republic of China Law on Soil and Water Conservation” was officially promulgated and implemented. To better control soil erosion and reduce labor costs, vegetation measures and natural restoration were widely adopted. In 1999, the renowned Western Development Program was initiated, which included a series of ecological conservation projects such as natural forest protection, the GfG program, and the Three-North Shelterbelt Development, etc. The vigorous implementation of these ecological conservation projects led to significant changes in land use types in the YRB. Furthermore, the second reason is related to the characteristics of herbaceous plants themselves. The main types of herbaceous plants in the YRB include Astragalus adsurgens, Artemisia frigida, and Stipa bungeana, etc., which have a fast growth rate. Under natural recovery conditions, grassland areas can rapidly expand within a relatively short period. Moreover, the YRB is located in a warm temperate semi-arid continental monsoon climate zone, which is suitable for the growth and development of grasslands [65]. In conclusion, the land use change in the YRB is closely related to the implementation of land management policies, especially the policy of the GfG program. This research result is consistent with previous studies [66].
In terms of industrial development and population, Ansai District, Baota District, and Yanchang County occupy most of the area of the YRB, and the main industries and population in the YRB are in these three regions. Therefore, in this study, the economic and population data from these three regions were selected to represent the YRB in order to explore the factors related to land use change in the YRB. Through correlation analysis, a significant negative correlation was observed between the area of cropland and GDP, PI, SI, and TI, and the area of forest showed a significant positive correlation with GDP, PI, SI, and TI (Figure 8). The significant negative correlation between the area of cropland and GDP is due to the implementation of relevant management policies aimed at addressing soil erosion and other ecological issues. These policies led to a conversion of cropland to other land use types, which further demonstrates the dominant role of land management policies in driving land use change in this region. This finding is consistent with previous research results [66]. The overall increase in the GDP of the three administrative regions can be attributed to the exploitation and development of local natural resources such as coal and oil, as well as the growth of the construction and service industries. The significant negative correlation between cropland and PI can be attributed to the reduction in cropland area in this region under the guidance of policies. In order to promote economic development, the remaining cropland was predominantly allocated for the cultivation of high-value cash crops (Figure 9), such as apples. Additionally, through proper planning and management, the forestry and animal husbandry sectors in the YRB experienced certain levels of development and growth, which partially explains the positive correlation between forest land area and economic indicators [29]. The grassland area showed a less pronounced correlation with GDP. At the initial implementation of the GfG program, the grassland area significantly increased. However, as the program continued and economic development persisted, a portion of the grassland underwent conversion to forest land and impervious, leading to a decline in grassland area. Impervious area has a significant positive correlation with GDP. In the middle and upper reaches of the YRB, Ansai District is rich in mineral resources such as petroleum, natural gas, and coal. The expansion of various industrial sites led to a conversion of other land use types into impervious. Yan’an City, as one of China’s historical and cultural cities, has significant advantages in tourism. Numerous patriotic education sites are located in Baota District. The tourism industry can drive changes in land use through the construction of green belts, road networks, and reservoirs. In the downstream areas, Yanchang County has a relatively large proportion of primary industry output, focusing on the cultivation of apples, vegetables, and livestock farming. Consequently, cropland was converted to economic forest land or construction land (such as processing and warehousing factories). In terms of population, during the study period, the population in the YRB experienced rapid growth. The population showed a significant negative correlation with cropland area and a significant positive correlation with forest and impervious (Figure 8). This is because the continuous increase in housing, transportation, and public service facilities, driven by the demand for material survival, inevitably occupies a significant amount of cropland and grassland, etc. This led to the conversion of land use types to construction land. This highlights that population growth is an important influencing factor in land use change [67].

4. Conclusions and Policy Suggestions

Based on long-term remote sensing land use data from 1985 to 2020, this paper comprehensively expounded the spatiotemporal changes of land use characteristics in YRB, from the analysis of spatiotemporal changes in land use in typical years to the analysis of trends and abrupt changes in successive time series. The driving factors of land use change in YRB were discussed from the aspects of natural conditions, policy, economy, and population. The main conclusions that can be drawn are as follows:
(1)
The main land use types in the YRB are cropland, forest, and grassland, with 18.27%, 9.15%, and 72.02%, respectively. During the study period, cropland and forest land showed significant decreasing and increasing trends, respectively, with abrupt changes occurring in 2005 and 2004. The land use transformation mainly involved the conversion from cropland to grassland and from grassland to forest.
(2)
In the YRB, land use patches exhibited a trend of regularization, simplification, and aggregation, indicating the strengthening impact of human activities on spatial patterns. The shape of cropland and forest land patches became increasingly simplified with stronger connectivity. Grassland developed into larger patches and exhibited aggregation processes in the upstream and downstream areas. The impervious showed an aggregation trend throughout the basin.
(3)
Both social and natural factors contribute to land use change in the YRB. The growth of the economy and population is strongly associated with land use change, with the Grain for Green (GfG) program being the dominant driving force.
This article systematically analyzed land use change, providing decision-making references for the implementation of regional ecological policies and the sustainable utilization of land resources. This study used trend and change-point analysis to explain the impact of land management policies on land use from a temporal perspective. However, due to different natural conditions and cultural practices in the region, the implementation and promotion of land management policies may vary. Therefore, in the future, exploring the impact of land management policies on land use from a spatial distribution perspective could be considered. In addition, quantifying the contributions of ecological engineering and specific land use policies is an important and hot issue. Future researches need to strengthen the quantification of the contributions of ecological engineering to land use change in order to achieve sustainable land utilization.
In the future, the implementation of land use policies should consider the sustainable allocation of regional water and soil resources. In addition, on the basis of ensuring regional ecological environment security, rational and diverse land management measures should be formulated to achieve a reasonable distribution of agricultural production, ensure food security, and promote sustainable development on the Loess Plateau. Based on the findings of this study, the time of significant changes in land use can be estimated after the implementation of relevant land management policies, enabling policymakers to make more rational arrangements for policy implementation. Finally, this research provides reliable evidence for the sustainable development of land resources and the scientific management of water and soil resources in the YRB and serves as a research example for understanding land use change and its driving forces across the entire Loess Plateau.

Author Contributions

Conceptualization, J.Z. and P.G.; methodology, J.Z.; software, J.Z.; validation, J.Z., P.G. and X.M.; writing—original draft preparation, J.Z.; writing—review and editing, P.G. and C.W.; visualization, J.Z.; supervision, P.G.; project administration, P.G.; funding acquisition, P.G. All authors have read and agreed to the published version of the manuscript.

Funding

This research was funded by the National Natural Science Foundation of China (42277354; U2243211).

Data Availability Statement

The new data were created in this study are available on request.

Acknowledgments

The authors sincerely thank the anonymous reviewers for their professional review and valuable suggestions, which greatly helped improve the original version of this paper.

Conflicts of Interest

The authors declare no conflict of interest.

References

  1. Jin, X.; Jin, Y.; Mao, X. Ecological Risk Assessment of Cities on the Tibetan Plateau Based on Land Use/Land Cover Changes—Case Study of Delingha City. Ecol. Indic. 2019, 101, 185–191. [Google Scholar] [CrossRef]
  2. Liang, Y.; Song, W. Ecological and Environmental Effects of Land Use and Cover Changes on the Qinghai-Tibetan Plateau: A Bibliometric Review. Land 2022, 11, 2163. [Google Scholar] [CrossRef]
  3. Chen, Q.; Mao, Y.; Morrison, A.M. The Influence of Land Use Evolution on the Visitor Economy in Wuhan from the Perspective of Ecological Service Value. Land 2022, 11, 1. [Google Scholar] [CrossRef]
  4. Western, D. Human-Modified Ecosystems and Future Evolution. Proc. Natl. Acad. Sci. USA 2001, 98, 5458–5465. [Google Scholar] [CrossRef] [PubMed]
  5. Napoli, M.; Massetti, L.; Orlandini, S. Hydrological Response to Land Use and Climate Changes in a Rural Hilly Basin in Italy. CATENA 2017, 157, 1–11. [Google Scholar] [CrossRef]
  6. Jiang, C.; Zhang, H.; Zhang, Z.; Wang, D. Model-Based Assessment Soil Loss by Wind and Water Erosion in China’s Loess Plateau: Dynamic Change, Conservation Effectiveness, and Strategies for Sustainable Restoration. Glob. Planet. Chang. 2019, 172, 396–413. [Google Scholar] [CrossRef]
  7. Yu, S.; Xu, Z.; Wu, W.; Zuo, D. Effect of Land Use Types on Stream Water Quality under Seasonal Variation and Topographic Characteristics in the Wei River Basin, China. Ecol. Indic. 2016, 60, 202–212. [Google Scholar] [CrossRef]
  8. Dong, L.; Li, J.; Zhang, Y.; Bing, M.; Liu, Y.; Wu, J.; Hai, X.; Li, A.; Wang, K.; Wu, P.; et al. Effects of Vegetation Restoration Types on Soil Nutrients and Soil Erodibility Regulated by Slope Positions on the Loess Plateau. J. Environ. Manag. 2022, 302, 113985. [Google Scholar] [CrossRef]
  9. Wu, X.; Wang, S.; Fu, B.; Feng, X.; Chen, Y. Socio-Ecological Changes on the Loess Plateau of China after Grain to Green Program. Sci. Total Environ. 2019, 678, 565–573. [Google Scholar] [CrossRef]
  10. Smit, B.; Wandel, J. Adaptation, Adaptive Capacity and Vulnerability. Glob. Environ. Chang. 2006, 16, 282–292. [Google Scholar] [CrossRef]
  11. Wu, J.G.; Hobbs, R. Key Issues and Research Priorities in Landscape Ecology: An Idiosyncratic Synthesis. Landsc. Ecol. 2002, 17, 355–365. [Google Scholar] [CrossRef]
  12. Foley, J.A.; DeFries, R.; Asner, G.P.; Barford, C.; Bonan, G.; Carpenter, S.R.; Chapin, F.S.; Coe, M.T.; Daily, G.C.; Gibbs, H.K.; et al. Global Consequences of Land Use. Science 2005, 309, 570–574. [Google Scholar] [CrossRef]
  13. Ostwald, M.; Chen, D. Land-Use Change: Impacts of Climate Variations and Policies among Small-Scale Farmers in the Loess Plateau, China. Land Use Pol. 2006, 23, 361–371. [Google Scholar] [CrossRef]
  14. Carlson, T.N.; Arthur, S.T. The Impact of Land Use—Land Cover Changes Due to Urbanization on Surface Microclimate and Hydrology: A Satellite Perspective. Glob. Planet. Chang. 2000, 25, 49–65. [Google Scholar] [CrossRef]
  15. Long, H.; Heilig, G.K.; Li, X.; Zhang, M. Socio-Economic Development and Land-Use Change: Analysis of Rural Housing Land Transition in the Transect of the Yangtse River, China. Land Use Policy 2007, 24, 141–153. [Google Scholar] [CrossRef]
  16. Dalle, S.P.; de Blois, S.; Caballero, J.; Johns, T. Integrating Analyses of Local Land-Use Regulations, Cultural Perceptions and Land-Use/Land Cover Data for Assessing the Success of Community-Based Conservation. For. Ecol. Manag. 2006, 222, 370–383. [Google Scholar] [CrossRef]
  17. Sun, W.; Shao, Q.; Liu, J.; Zhai, J. Assessing the Effects of Land Use and Topography on Soil Erosion on the Loess Plateau in China. CATENA 2014, 121, 151–163. [Google Scholar] [CrossRef]
  18. Křováková, K.; Semerádová, S.; Mudrochová, M.; Skaloš, J. Landscape Functions and Their Change—A Review on Methodological Approaches. Ecol. Eng. 2015, 75, 378–383. [Google Scholar] [CrossRef]
  19. da Silva, A.M.; Huang, C.H.; Francesconi, W.; Saintil, T.; Villegas, J. Using Landscape Metrics to Analyze Micro-Scale Soil Erosion Processes. Ecol. Indic. 2015, 56, 184–193. [Google Scholar] [CrossRef]
  20. Herzog, F.; Lausch, A.; Muller, E.; Thulke, H.H.; Steinhardt, U.; Lehmann, S. Landscape Metrics for Assessment of Landscape Destruction and Rehabilitation. Environ. Manage. 2001, 27, 91–107. [Google Scholar] [CrossRef]
  21. Chang, X.; Huang, X.; Jiang, X.; Xiao, R. Impacts of Transportation Networks on the Landscape Patterns-A Case Study of Shanghai. Remote Sens. 2022, 14, 4060. [Google Scholar] [CrossRef]
  22. Schindler, S.; Poirazidis, K.; Wrbka, T. Towards a Core Set of Landscape Metrics for Biodiversity Assessments: A Case Study from Dadia National Park, Greece. Ecol. Indic. 2008, 8, 502–514. [Google Scholar] [CrossRef]
  23. Fan, Q.; Ding, S. Landscape Pattern Changes at a County Scale: A Case Study in Fengqiu, Henan Province, China from 1990 to 2013. CATENA 2016, 137, 152–160. [Google Scholar] [CrossRef]
  24. Friedl, M.A.; Sulla-Menashe, D.; Tan, B.; Schneider, A.; Ramankutty, N.; Sibley, A.; Huang, X. MODIS Collection 5 Global Land Cover: Algorithm Refinements and Characterization of New Datasets. Remote Sens. Environ. 2010, 114, 168–182. [Google Scholar] [CrossRef]
  25. Abdullah, S.A.; Nakagoshi, N. Changes in Landscape Spatial Pattern in the Highly Developing State of Selangor, Peninsular Malaysia. Landsc. Urban Plan. 2006, 77, 263–275. [Google Scholar] [CrossRef]
  26. Liu, J.; Zhang, Z.; Xu, X.; Kuang, W.; Zhou, W.; Zhang, S.; Li, R.; Yan, C.; Yu, D.; Wu, S.; et al. Spatial Patterns and Driving Forces of Land Use Change in China during the Early 21st Century. J. Geogr. Sci. 2010, 20, 483–494. [Google Scholar] [CrossRef]
  27. Guo, L.; Di, L.; Tian, Q. Detecting Spatio-Temporal Changes of Arable Land and Construction Land in the Beijing-Tianjin Corridor during 2000–2015. J. Geogr. Sci. 2019, 29, 702–718. [Google Scholar] [CrossRef]
  28. Zhu, Z.; Liu, B.; Wang, H.; Hu, M. Analysis of the Spatiotemporal Changes in Watershed Landscape Pattern and Its Influencing Factors in Rapidly Urbanizing Areas Using Satellite Data. Remote Sens. 2021, 13, 1168. [Google Scholar] [CrossRef]
  29. Zhou, X.; Zhou, Y. Spatio-Temporal Variation and Driving Forces of Land-Use Change from 1980 to 2020 in Loess Plateau of Northern Shaanxi, China. Land 2021, 10, 982. [Google Scholar] [CrossRef]
  30. Gorelick, N.; Hancher, M.; Dixon, M.; Ilyushchenko, S.; Thau, D.; Moore, R. Google Earth Engine: Planetary-Scale Geospatial Analysis for Everyone. Remote Sens. Environ. 2017, 202, 18–27. [Google Scholar] [CrossRef]
  31. Hansen, M.C.; Potapov, P.V.; Moore, R.; Hancher, M.; Turubanova, S.A.; Tyukavina, A.; Thau, D.; Stehman, S.V.; Goetz, S.J.; Loveland, T.R.; et al. High-Resolution Global Maps of 21st-Century Forest Cover Change. Science 2013, 342, 850–853. [Google Scholar] [CrossRef] [PubMed]
  32. Pekel, J.-F.; Cottam, A.; Gorelick, N.; Belward, A.S. High-Resolution Mapping of Global Surface Water and Its Long-Term Changes. Nature 2016, 540, 418–422. [Google Scholar] [CrossRef] [PubMed]
  33. Yang, J.; Huang, X. The 30&thinsp;m Annual Land Cover Dataset and Its Dynamics in China from 1990 to 2019. Earth Syst. Sci. Data 2021, 13, 3907–3925. [Google Scholar] [CrossRef]
  34. Li, P.; Mu, X.; Holden, J.; Wu, Y.; Irvine, B.; Wang, F.; Gao, P.; Zhao, G.; Sun, W. Comparison of Soil Erosion Models Used to Study the Chinese Loess Plateau. Earth-Sci. Rev. 2017, 170, 17–30. [Google Scholar] [CrossRef]
  35. Borrelli, P.; Robinson, D.A.; Fleischer, L.R.; Lugato, E.; Ballabio, C.; Alewell, C.; Meusburger, K.; Modugno, S.; Schütt, B.; Ferro, V.; et al. An Assessment of the Global Impact of 21st Century Land Use Change on Soil Erosion. Nat. Commun 2017, 8, 2013. [Google Scholar] [CrossRef] [PubMed]
  36. Wang, X.; Wang, B.; Xu, X.; Liu, T.; Duan, Y.; Zhao, Y. Spatial and Temporal Variations in Surface Soil Moisture and Vegetation Cover in the Loess Plateau from 2000 to 2015. Ecol. Indic. 2018, 95, 320–330. [Google Scholar] [CrossRef]
  37. Zuo, D.; Xu, Z.; Yao, W.; Jin, S.; Xiao, P.; Ran, D. Assessing the Effects of Changes in Land Use and Climate on Runoff and Sediment Yields from a Watershed in the Loess Plateau of China. Sci. Total Environ. 2016, 544, 238–250. [Google Scholar] [CrossRef]
  38. Liu, D.; Hao, S.; Liu, X.; Li, B.; He, S.; Warrington, D.N. Effects of Land Use Classification on Landscape Metrics Based on Remote Sensing and GIS. Env. Earth Sci 2013, 68, 2229–2237. [Google Scholar] [CrossRef]
  39. Zhang, J.; Qu, M.; Wang, C.; Zhao, J.; Cao, Y. Quantifying Landscape Pattern and Ecosystem Service Value Changes: A Case Study at the County Level in the Chinese Loess Plateau. Glob. Ecol. Conserv. 2020, 23, e01110. [Google Scholar] [CrossRef]
  40. Zhang, Y.; Bi, Z.; Zhang, X.; Yu, Y. Influence of Landscape Pattern Changes on Runoff and Sediment in the Dali River Watershed on the Loess Plateau of China. Land 2019, 8, 180. [Google Scholar] [CrossRef]
  41. Wang, D.; Fu, B.; Lu, K.; Xiao, L.; Zhang, Y.; Feng, X. Multifractal Analysis of Land Use Pattern in Space and Time: A Case Study in the Loess Plateau of China. Ecol. Complex. 2010, 7, 487–493. [Google Scholar] [CrossRef]
  42. Wang, C.; Zhang, G. Spatial Variation in Sediment Connectivity of Small Watershed along a Regional Transect on the Loess Plateau. CATENA 2022, 217, 106473. [Google Scholar] [CrossRef]
  43. Ling, Z.; Jiang, W.; Lu, Y.; Ling, Y.; Zhang, Z.; Liao, C. Continuous Long Time Series Monitoring of Urban Construction Land in Supporting the SDG 11.3.1—A Case Study of Nanning, Guangxi, China. Land 2023, 12, 452. [Google Scholar] [CrossRef]
  44. Feng, Z.; Liu, S.; Guo, Y.; Liu, X. Runoff Responses of Various Driving Factors in a Typical Basin in Beijing-Tianjin-Hebei Area. Remote Sens. 2023, 15, 1027. [Google Scholar] [CrossRef]
  45. Lu, M.; Tan, Z.; Yuan, C.; Dong, Y.; Dong, W. Resilience Measurements and Dynamics of Resource-Based Cities in Heilongjiang Province, China. Land 2023, 12, 302. [Google Scholar] [CrossRef]
  46. Lyu, J.; Yin, S.; Sun, Y.; Wang, K.; Luo, P.; Meng, X. Flood Runoff Simulation under Changing Environment, Based on Multiple Satellite Data in the Jinghe River Basin of the Loess Plateau, China. Remote Sens. 2023, 15, 550. [Google Scholar] [CrossRef]
  47. Wang, X.; Zhang, S.; Zhao, X.; Shi, S.; Xu, L. Exploring the Relationship between the Eco-Environmental Quality and Urbanization by Utilizing Sentinel and Landsat Data: A Case Study of the Yellow River Basin. Remote Sens. 2023, 15, 743. [Google Scholar] [CrossRef]
  48. Peng, S.; Ding, Y.; Liu, W.; Li, Z. 1&thinsp;Km Monthly Temperature and Precipitation Dataset for China from 1901 to 2017. Earth Syst. Sci. Data 2019, 11, 1931–1946. [Google Scholar] [CrossRef]
  49. Erb, K.-H.; Haberl, H.; Jepsen, M.R.; Kuemmerle, T.; Lindner, M.; Müller, D.; Verburg, P.H.; Reenberg, A. A Conceptual Framework for Analysing and Measuring Land-Use Intensity. Curr. Opin. Environ. Sustain. 2013, 5, 464–470. [Google Scholar] [CrossRef]
  50. Li, Y.; Liu, G.; Huang, C. Dynamic Changes Analysis and Hotspots Detection of Land Use in the Central Core Functional Area of Jing-Jin-Ji from 2000 to 2015 Based on Remote Sensing Data. Math. Probl. Eng. 2017, 2017, e2183585. [Google Scholar] [CrossRef]
  51. Cushman, S.A.; McGarigal, K.; Neel, M.C. Parsimony in Landscape Metrics: Strength, Universality, and Consistency. Ecol. Indic. 2008, 8, 691–703. [Google Scholar] [CrossRef]
  52. Niu, H.; Zhao, X.; Xiao, D.; Liu, M.; An, R.; Fan, L. Evolution and Influencing Factors of Landscape Pattern in the Yellow River Basin (Henan Section) Due to Land Use Changes. Water 2022, 14, 3872. [Google Scholar] [CrossRef]
  53. Shen, G.; Yang, X.; Jin, Y.; Luo, S.; Xu, B.; Zhou, Q. Land Use Changes in the Zoige Plateau Based on the Object-Oriented Method and Their Effects on Landscape Patterns. Remote Sens. 2020, 12, 14. [Google Scholar] [CrossRef]
  54. Burn, D.H.; Hag Elnur, M.A. Detection of Hydrologic Trends and Variability. J. Hydrol. 2002, 255, 107–122. [Google Scholar] [CrossRef]
  55. Yue, S.; Pilon, P.; Phinney, B.; Cavadias, G. The Influence of Autocorrelation on the Ability to Detect Trend in Hydrological Series. Hydrol. Process. 2002, 16, 1807–1829. [Google Scholar] [CrossRef]
  56. Ma, Z.; Kang, S.; Zhang, L.; Tong, L.; Su, X. Analysis of Impacts of Climate Variability and Human Activity on Streamflow for a River Basin in Arid Region of Northwest China. J. Hydrol. 2008, 352, 239–249. [Google Scholar] [CrossRef]
  57. Zhang, X.; Wang, X.; Zhou, Z.; Li, M.; Jing, C. Spatial Quantitative Model of Human Activity Disturbance Intensity and Land Use Intensity Based on GF-6 Image, Empirical Study in Southwest Mountainous County, China. Remote Sens. 2022, 14, 4574. [Google Scholar] [CrossRef]
  58. Potschin, M. Land Use and the State of the Natural Environment. Land Use Policy 2009, 26, S170–S177. [Google Scholar] [CrossRef]
  59. Liu, Z.; Wang, J.; Wang, X.; Wang, Y. Understanding the Impacts of ‘Grain for Green’ Land Management Practice on Land Greening Dynamics over the Loess Plateau of China. Land Use Policy 2020, 99, 105084. [Google Scholar] [CrossRef]
  60. Zhao, H.; He, H.; Wang, J.; Bai, C.; Zhang, C. Vegetation Restoration and Its Environmental Effects on the Loess Plateau. Sustainability 2018, 10, 4676. [Google Scholar] [CrossRef]
  61. Kou, P.; Xu, Q.; Jin, Z.; Yunus, A.P.; Luo, X.; Liu, M. Complex Anthropogenic Interaction on Vegetation Greening in the Chinese Loess Plateau. Sci. Total Environ. 2021, 778, 146065. [Google Scholar] [CrossRef]
  62. Xu, F.; Bao, H.X.H.; Li, H.; Kwan, M.-P.; Huang, X. Land Use Policy and Spatiotemporal Changes in the Water Area of an Arid Region. Land Use Policy 2016, 54, 366–377. [Google Scholar] [CrossRef]
  63. Zhang, Q.-J.; Fu, B.-J.; Chen, L.-D.; Zhao, W.-W.; Yang, Q.-K.; Liu, G.-B.; Gulinck, H. Dynamics and Driving Factors of Agricultural Landscape in the Semiarid Hilly Area of the Loess Plateau, China. Agric. Ecosyst. Environ. 2004, 103, 535–543. [Google Scholar] [CrossRef]
  64. Du, X.; Zhao, X.; Liang, S.; Zhao, J.; Xu, P.; Wu, D. Quantitatively Assessing and Attributing Land Use and Land Cover Changes on China’s Loess Plateau. Remote Sens. 2020, 12, 353. [Google Scholar] [CrossRef]
  65. Wang, F.; Hessel, R.; Mu, X.; Maroulis, J.; Zhao, G.; Geissen, V.; Ritsema, C. Distinguishing the Impacts of Human Activities and Climate Variability on Runoff and Sediment Load Change Based on Paired Periods with Similar Weather Conditions: A Case in the Yan River, China. J. Hydrol. 2015, 527, 884–893. [Google Scholar] [CrossRef]
  66. Guo, B.; Xie, T.; Subrahmanyam, M.V. The Impact of China’s Grain for Green Program on Rural Economy and Precipitation: A Case Study of Yan River Basin in the Loess Plateau. Sustainability 2019, 11, 5336. [Google Scholar] [CrossRef]
  67. Kroll, F.; Haase, D. Does Demographic Change Affect Land Use Patterns?: A Case Study from Germany. Land Use Policy 2010, 27, 726–737. [Google Scholar] [CrossRef]
Figure 1. Location of study area. Note: Land use distribution in 2020.
Land 12 01653 g001
Figure 2. Land use change in the YRB. (a) 1985; (b) 1990; (c) 2000; (d) 2010; and (e) 2020.
Land 12 01653 g002
Figure 3. Comprehensive index of land use intensity in whole basin and its upper, middle, and lower reaches in different periods.
Land 12 01653 g003
Figure 4. Changes of landscape metrics at landscape level. (a) LPI; (b) PAFRAC; (c) AI; and (d) SHDI.
Land 12 01653 g004
Figure 5. Changes in landscape metrics at the class level. Note: I: upstream, Ⅱ: midstream, and Ⅲ: downstream. (a) LPI; (b) PARA; (c) CONTIG; and (d) AI.
Land 12 01653 g005
Figure 6. Pettitt’s test of the area changes in four types of land use in YRB. (a) Cropland; (b) forest; (c) grassland; and (d) impervious.
Land 12 01653 g006
Figure 7. Scatterplots of land use area and precipitation from 1990 to 2020. (a) Cropland; (b) forest; (c) grassland; and (d) impervious.
Land 12 01653 g007
Figure 8. Spearman’s correlations of GDP, primary industry (PI), secondary industry (SI), tertiary industry (TI), population, cropland, forest, grassland, and impervious. Note: ** represents a significance level of 1%.
Land 12 01653 g008
Figure 9. Scatterplot of animal husbandry output value and fruit production relative to cropland area from 1990 to 2020.
Land 12 01653 g009
Table 1. Landscape metrics were used in this study [53].
CategoryIndicesDescription
Area metricsLargest Patch Index (LPI)The size of the largest patch.
Shape metricsPerimeter-Area Ratio (PARA)The ratio between the perimeter (boundary length) and the area of each patch, describing the regularity of patch shape.
Perimeter-Area Fractal Dimension (PAFRAC)A fractal dimension index that can reflect to a certain extent the degree of human activities interfering with landscape patterns.
Contiguity Index (CONTIG)The index measures the degree of connectivity between patches, which represents the spatial contiguity of the patches.
Distribution metricsAggregation Index (AI)The index measures the degree of spatial aggregation of patches.
Diversity metricsShannon’s Diversity Index (SHDI)Uncertainties and landscape heterogeneity of patches.
Table 2. Land use area and proportion at different times in the YRB.
Land Use Types19851990200020102020
Area/km²Ratio/%Area/km²Ratio/%Area/km²Ratio/%Area/km²Ratio/%Area/km²Ratio/%
cropland2205.8428.702144.4627.901111.4314.46777.1210.11783.2810.19
forest506.286.59505.816.58517.336.73696.309.061288.8416.77
shrub9.320.128.590.1111.530.157.000.095.920.07
grassland4947.7864.375009.9665.186016.9978.286161.5480.165543.8172.13
water1.840.021.820.023.410.041.690.024.430.06
impervious14.920.1915.370.2025.510.3342.560.5559.360.77
barren0.290.000.250.000.070.000.050.000.620.01
Table 3. Land use area and proportion in the upper, middle, and lower reaches of YRB.
RegionLand Use Types19851990200020102020
Area/km²Ratio/%Area/km²Ratio/%Area/km²Ratio/%Area/km²Ratio/%Area/km²Ratio/%
Upstreamcropland340.5824.26%319.5622.76%135.279.63%89.446.37%87.096.20%
forest1.010.07%1.010.07%1.460.10%19.161.36%88.156.28%
grassland1060.1675.51%1081.2277.01%1264.6990.07%1291.0491.95%1223.3687.13%
impervious2.040.15%2.040.15%2.630.19%4.250.30%4.520.32%
Midstreamcropland1393.0330.08%1371.0429.60%699.5115.10%477.6710.31%486.4110.50%
forest372.198.04%371.668.02%381.288.23%504.1210.88%916.0119.78%
grassland2849.8961.53%2872.3562.02%3519.4975.99%3611.9977.99%3174.768.54%
impervious8.480.18%8.80.19%16.950.37%30.670.66%45.050.97%
Downstreamcropland472.2228.61%453.8527.50%276.6516.76%210.0212.72%209.7912.71%
forest133.088.06%133.138.07%134.598.15%173.0110.48%284.6817.25%
grassland1037.7362.87%1056.3964.00%1232.874.69%1258.576.25%1145.7469.42%
impervious4.40.27%4.530.27%5.920.36%7.630.46%9.80.59%
Table 4. Land use transition matrix in different periods of the YRB.
PeriodTypesArea Proportion/%
CroplandForestShrubGrasslandWaterImpervious
1985–1990cropland27.270.000.001.390.000.01
forest0.006.570.010.000.000.00
shrub0.000.000.100.020.000.00
grassland0.600.000.0063.800.000.00
water0.000.000.000.000.020.00
barren0.000.000.000.000.000.00
impervious0.000.000.000.000.000.20
1990–2000cropland11.120.010.0015.610.010.08
forest0.036.170.090.040.000.00
shrub0.000.010.040.060.000.00
grassland2.830.290.0262.000.030.04
water0.010.000.000.000.010.00
barren0.000.000.000.000.000.00
impervious0.000.000.000.000.000.20
2000–2010cropland7.900.130.006.250.000.15
forest0.016.670.010.030.000.00
shrub0.000.040.040.070.000.00
grassland2.162.190.0473.850.000.07
water0.010.000.000.010.010.00
barren0.000.000.000.000.000.00
impervious0.000.000.000.000.000.33
2010–2020cropland7.070.110.002.750.020.14
forest0.048.990.000.010.000.00
shrub0.000.040.020.030.000.00
grassland3.057.570.0669.430.020.08
water0.000.000.000.000.020.00
barren0.000.000.000.000.000.00
impervious0.000.000.000.000.000.55
Table 5. Interannual variation trend of different land use types in YRB from 1990 to 2020.
Land Use TypesAverage/km²CVZ Value
cropland1072.3710.378−6.935
forest728.3950.3826.957
grassland5837.8410.0561.087
impervious34.7310.4148.027
Disclaimer/Publisher’s Note: The statements, opinions and data contained in all publications are solely those of the individual author(s) and contributor(s) and not of MDPI and/or the editor(s). MDPI and/or the editor(s) disclaim responsibility for any injury to people or property resulting from any ideas, methods, instructions or products referred to in the content.

