Article

Simulation of LUCC Dynamics and Estimation of Carbon Stock under Different SSP-RCP Scenarios in Heilongjiang Province

1
School of Public Administration and Law, Northeast Agricultural University, Harbin 150036, China
2
School of Resources and Environment, Northeast Agricultural University, Harbin 150036, China
3
College of Economics and Management, Northeast Agricultural University, Harbin 150036, China
*
Author to whom correspondence should be addressed.
Land 2023, 12(9), 1665; https://doi.org/10.3390/land12091665
Submission received: 25 July 2023 / Revised: 18 August 2023 / Accepted: 24 August 2023 / Published: 25 August 2023

Abstract

:
An accurate estimation of carbon stocks in terrestrial ecosystem and their future changes in relation to land use and land cover change (LUCC) is important for regional territorial spatial optimization and low-carbon development. In this paper, we integrated the System Dynamics (SD) model, PLUS model and InVEST model to simulate land use dynamics and corresponding carbon stocks in Heilongjiang Province from 2030 to 2050 under three SSP-RCP scenarios proposed by the CMIP6. The findings revealed significant variations in land use demand projections across different SSP-RCP scenarios, with increases observed in farmland, construction land and unused land while decreases in woodland and grassland, and the SSP585 scenario showed the highest increment or decrease. Under the SSP126 scenario, the expansion of farmland was due to a reduction in construction land, with little change observed in woodland and grassland, which resulted in a carbon stock increase of 102.71 × 10⁶ Mg at the highest rate; conversely, under the SSP585 scenario, rapid expansion of farmland, construction land and unused land came at the expense of forest and grassland, leading to a significant carbon stock decrease of 204.64 × 10⁶ Mg. The increase in farmland and the decrease in woodland under the SSP245 scenario was relatively moderate with little change observed in construction, resulting in a carbon stock increase of 108.10 × 10⁶ Mg. Regardless of any scenario considered here, forests remain an important carbon sink contributing significantly to carbon sequestration as well as other ecosystem services in Heilongjiang Province. Enhancing territorial spatial planning and ecological environment construction, while promoting an eco-economic development model, will significantly contribute to the achievement of carbon neutrality and regional sustainable development goals.

1. Introduction

Global warming, triggered by anthropogenic CO2 emissions, has caused extensive damage to both global ecology and economy and became the most pressing issue confronting human society [1]. Its increasing trend makes the climate change mitigation evolve from a future need to an urgent reality [2,3]. Land Use and Land Cover Change (LUCC) is a primary driver of the carbon cycle within terrestrial ecosystems and represents one of the most direct forms of anthropogenic impacts on climate change [4]. It is estimated that approximately 1/3 of global CO2 emissions since the industrial revolution could be attributed to LUCC [5]. Therefore, accurate estimations regarding carbon stock within terrestrial ecosystems along with projections related to future changes resulting from LUCC are essential for territorial spatial optimization efforts aimed at promoting low-carbon development patterns.
LUCC can directly alter vegetation carbon stock and indirectly affect soil organic carbon by altering the soil environment and the return of vegetation residues to soil [6]. The complex influence and feedback mechanism of LUCC on carbon cycling leads to diverse terrestrial ecosystem carbon stocks across regions worldwide [7,8]. Currently, modeling is the most popular approach for simulating LUCC-induced changes in ecosystem carbon stocks [9]. Previous studies have examined carbon emissions at different spatial scales including global, national, and regional scales [10,11]. Research conducted at a global scale typically creates coarse spatial grids of carbon emission ranging from 5° × 5° to 0.25° × 0.25° based on nonspatial global statistics [12,13], while land use projections processed at these resolutions largely ignore the impacts of small-scale environmental factors such as climate, topography, soils, and socio-economics on the changing patterns and processes of local LUCC [14]. Studies conducted at continental or other scales show that land use changes such as deforestation and agricultural expansion could result in significant losses of carbon stock [15,16]. However, these studies tend to focus on single land-use ecosystems without fully recognizing interactions among environmental processes and regional landscape patterns [17,18]. Improving accuracy, precision, and spatialization of carbon stock assessments associated with LUCC is necessary to meet the requirements for good policy decisions [19].
Spatio-temporal LUCC simulations can effectively analyze the intricate details of future landscape dynamics, and various LUCC scenario prediction models have been developed from different perspectives and research projects since the 1990s [20], including the Markov–Chain model [21], Neural network model [22], Cellular automata (CA) model [23], and Future Land Use Simulation (FLUS) model [24]. The CA model has been widely used in simulating complex urban systems and deforestation for its simplicity and effectiveness in characterizing spatial nonlinear stochastic LUCC processes and generating rich patterns [25,26]. The change potential of each pixel is determined by its initial state, the influences from adjacent pixels, and a set of transition rules [24]. These merits have driven continuous advancements in CA models over the past two decades, and new bottom-up integration models, such as CA-Markov [27], CLUE-S [28], and FLUS [29], have been successively proposed to enable broader applications of CA models. However, most of these improvements focus on assessing the feasibility of a single land-use type by enhancing technical modeling schemes and calibrating models, while neglecting the intricate interactions and competition among multiple land-use types [24]. Therefore, conducting simulations that account for multiple land use changes would be more beneficial in informing future land-use decisions [30]. The Patch-generation Land Use Simulation (PLUS) model, an enhanced version of the FLUS model, integrates a novel Land Expansion Analysis Strategy (LEAS) with a CA model based on Multiple Random Seeds (CARS), aiming to enhance the accuracy of simulating future landscapes by investigating the drivers behind diverse land use changes and modeling their patch-level dynamics [31,32]. However, bottom-up models often adopt a local perspective to depict the evolution of land-use systems, which may hinder the reflection of planning, policies, and climate change impacts on land-use changes, resulting in the macro-level land-use demand being disconnected from local-level land-use allocation [24]. Therefore, it is imperative to introduce top-down models that address the macro-level demands for various land-use types by taking into account planning and development factors as scenarios representing future developmental paths [33]. The System Dynamics (SD) model is an improved top-down approach that better captures the nonlinear, dynamic, and systematic characteristics of land use change [34], and its integration with a simulation model could enhance the accuracy of predicting spatial land use distribution greatly [35].
Although socioeconomic and biophysical factors have been extensively addressed, few case studies have considered the feedback between LUCC and climate change under different scenarios [36]. The future impacts of climate change on long-term land use dynamics are expected to be significant [37], making it crucial to develop land use simulation models that can effectively incorporate climate change for studying changes in terrestrial ecosystems [38]. CMIP6 has proposed multiple future development scenarios by integrating a shared socioeconomic pathway (SSP) with a representative concentration pathway (RCP) [39], demonstrating the interconnection between radiative forcing and socio-economic development and emphasizing the role of diverse socio-economic patterns in driving climate change [40]. As the world’s largest developing country, China has implemented a series of strategies, measures, and actions to effectively address climate change and actively engage in global climate governance [41]. In September 2020, President Xi Jinping made a solemn pledge to the international community at the 75th session of the United Nations General Assembly that China will strive to achieve carbon peak by 2030 and carbon neutrality by 2060. Therefore, investigating the carbon stock in China’s terrestrial ecosystems under various climate scenarios holds significant implications for reducing carbon emissions in China [42]. Consequently, an increasing number of studies are utilizing SSP-RCP scenarios to project future landscape dynamics [43,44]. It is noteworthy that China’s vast territory encompasses significant regional climatic diversities and substantial changes in land use dynamics under various SSP-RCP scenarios [45], which warrant detailed exploration to better inform land use decision-making [46].
Heilongjiang Province, situated at the center of the Northeast Rim Economic Circle, serves as a crucial industrial and commodity grain base in China while also acting as an ecological security barrier. In recent decades, with the implementation of the Northeast Revitalization Strategy, urbanization and industrialization levels have rapidly accelerated in Heilongjiang Province. As a result, socio-economic activities have intensified significantly leading to substantial land use changes and frequent carbon exchange. Taking Heilongjiang Province as a case study, this paper employs the coupled SD-PLUS model to forecast macro land use demand through local interactions among various land-use types and configures it at the grid cell level, with the aim of enhancing simulation accuracy of future landscape dynamics. Subsequently, the Integrated Valuation of Ecosystem Service and Tradeoffs (InVEST) model is utilized to investigate changes in carbon sequestration related to LUCC under SSP126, SSP245, and SSP585 scenarios. Overall, this study comprehensively analyzes the impacts of LUCC on carbon sequestration for updating China’s national carbon statistics while providing decision support for optimizing low-carbon territorial spatial patterns that balance socio-economic development with ecological protection towards sustainable regional development.

2. Materials and Methods

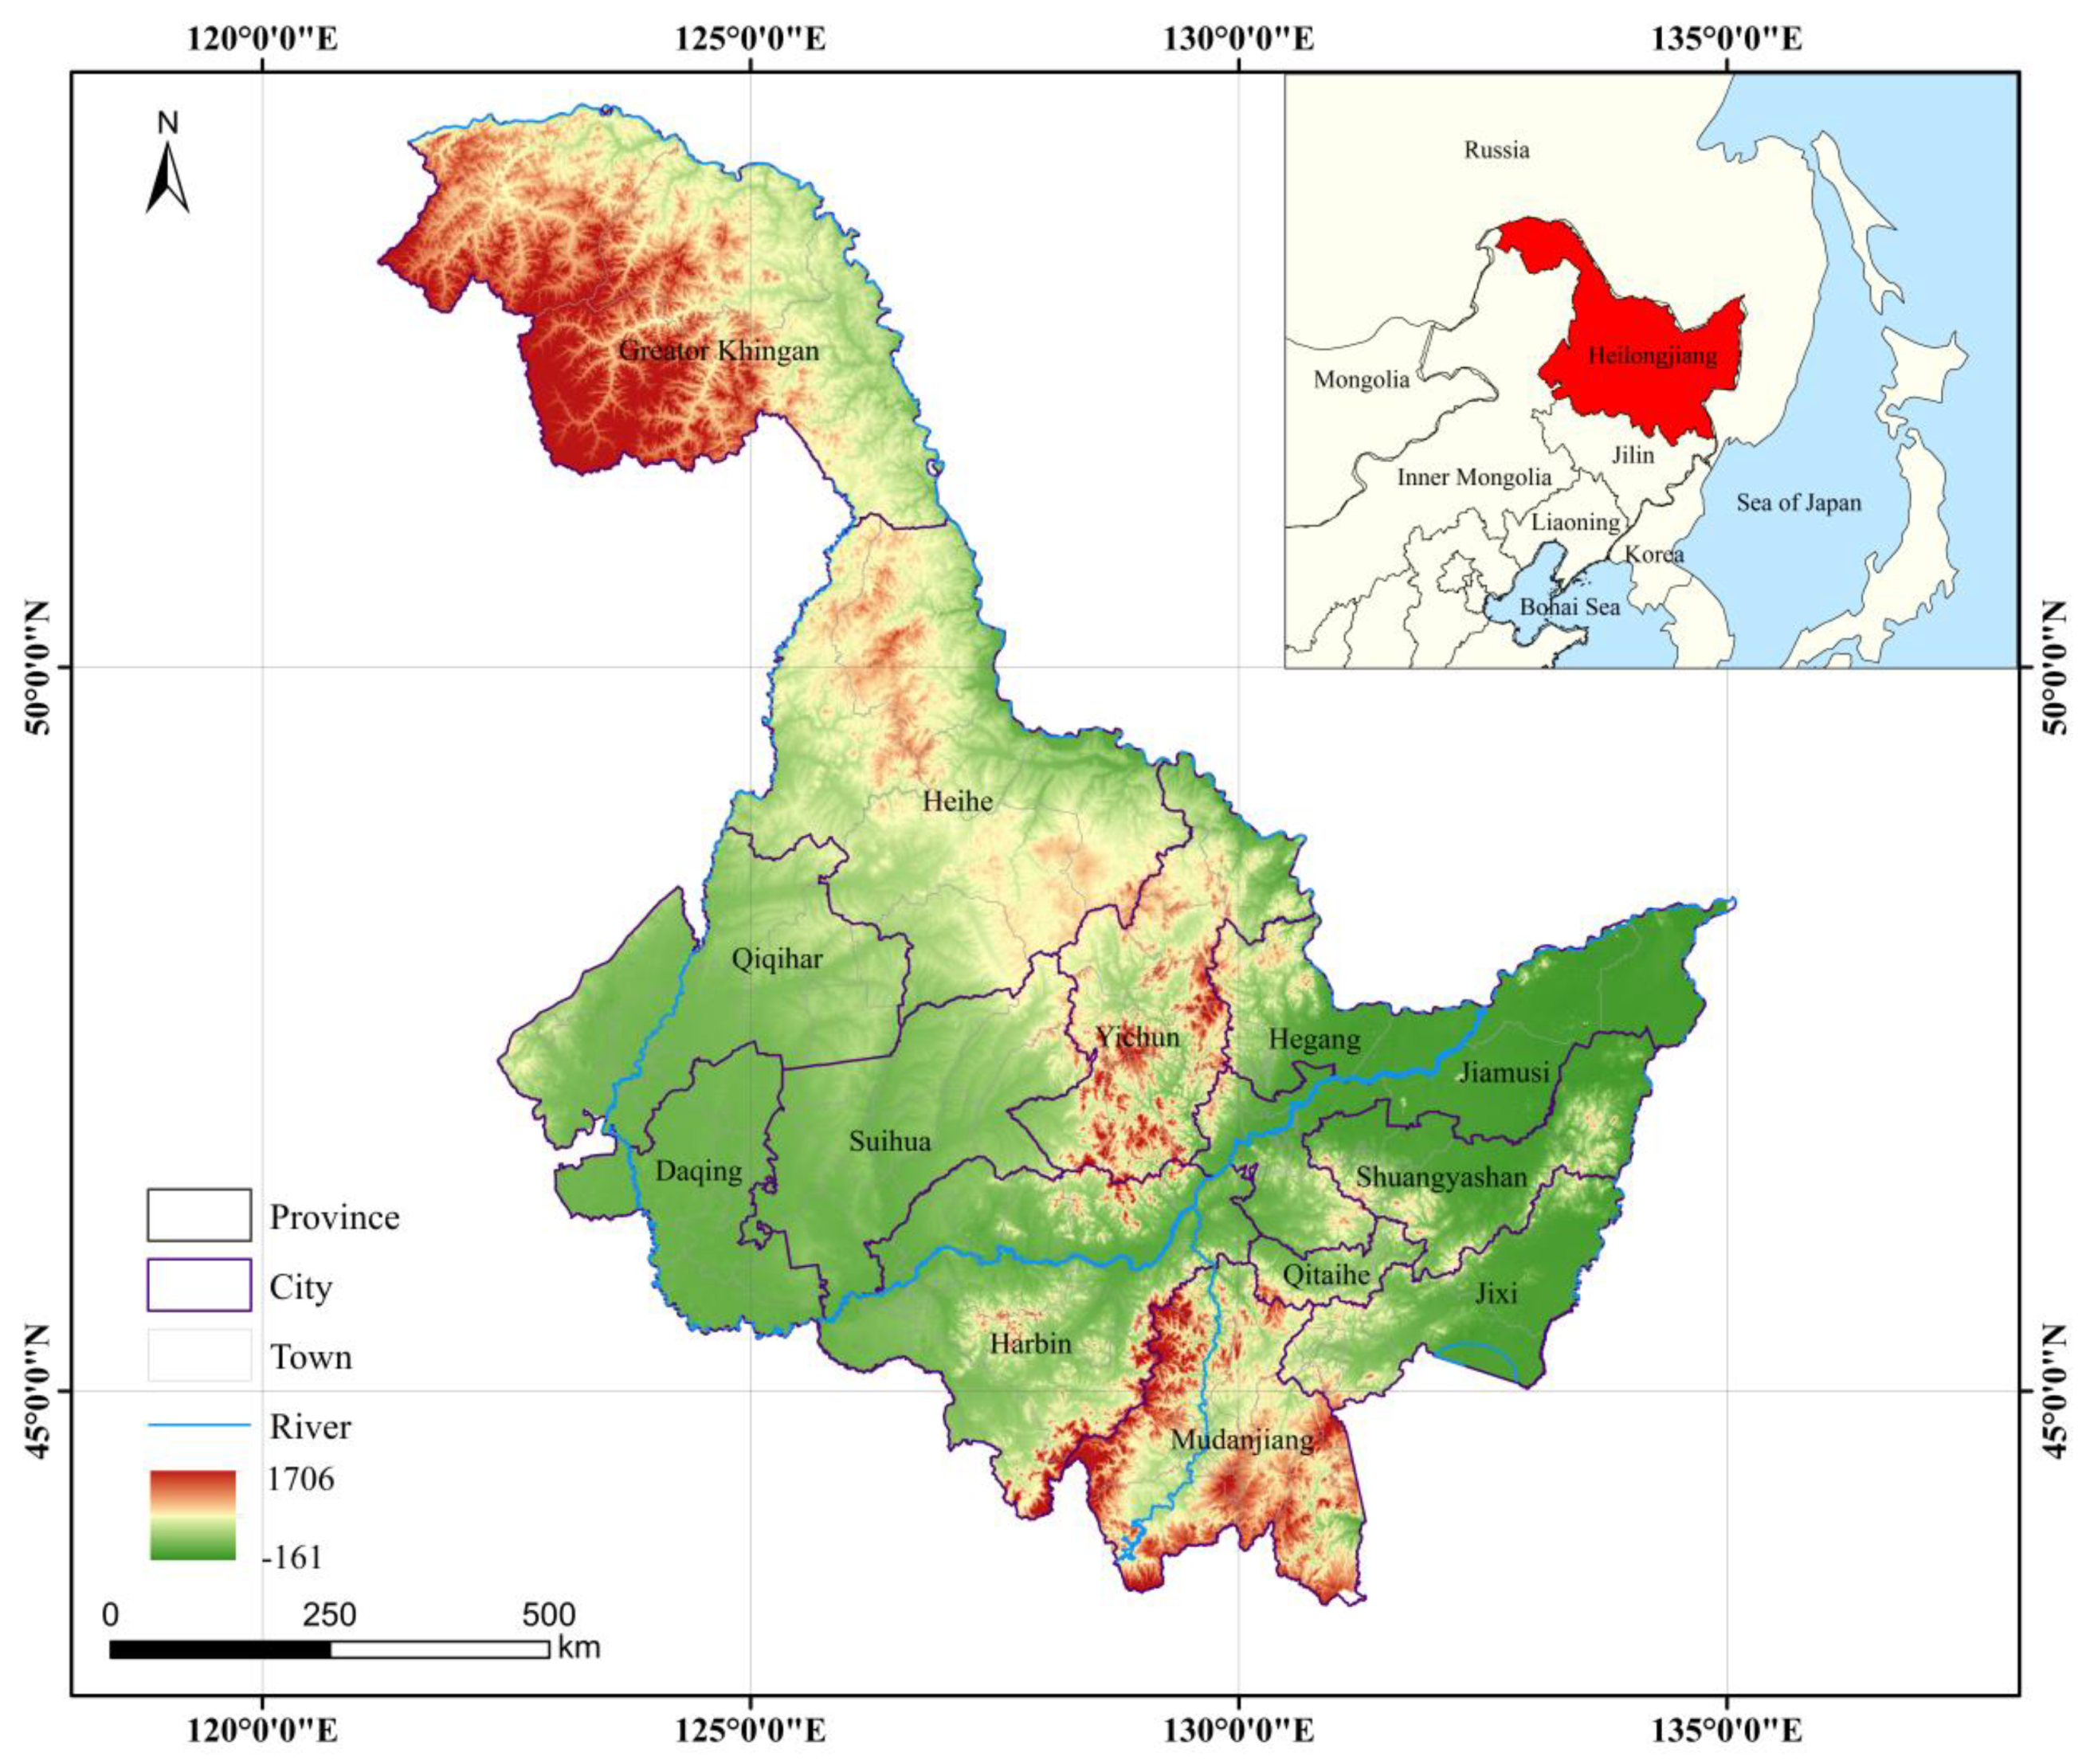
2.1. Study Area and Data Source
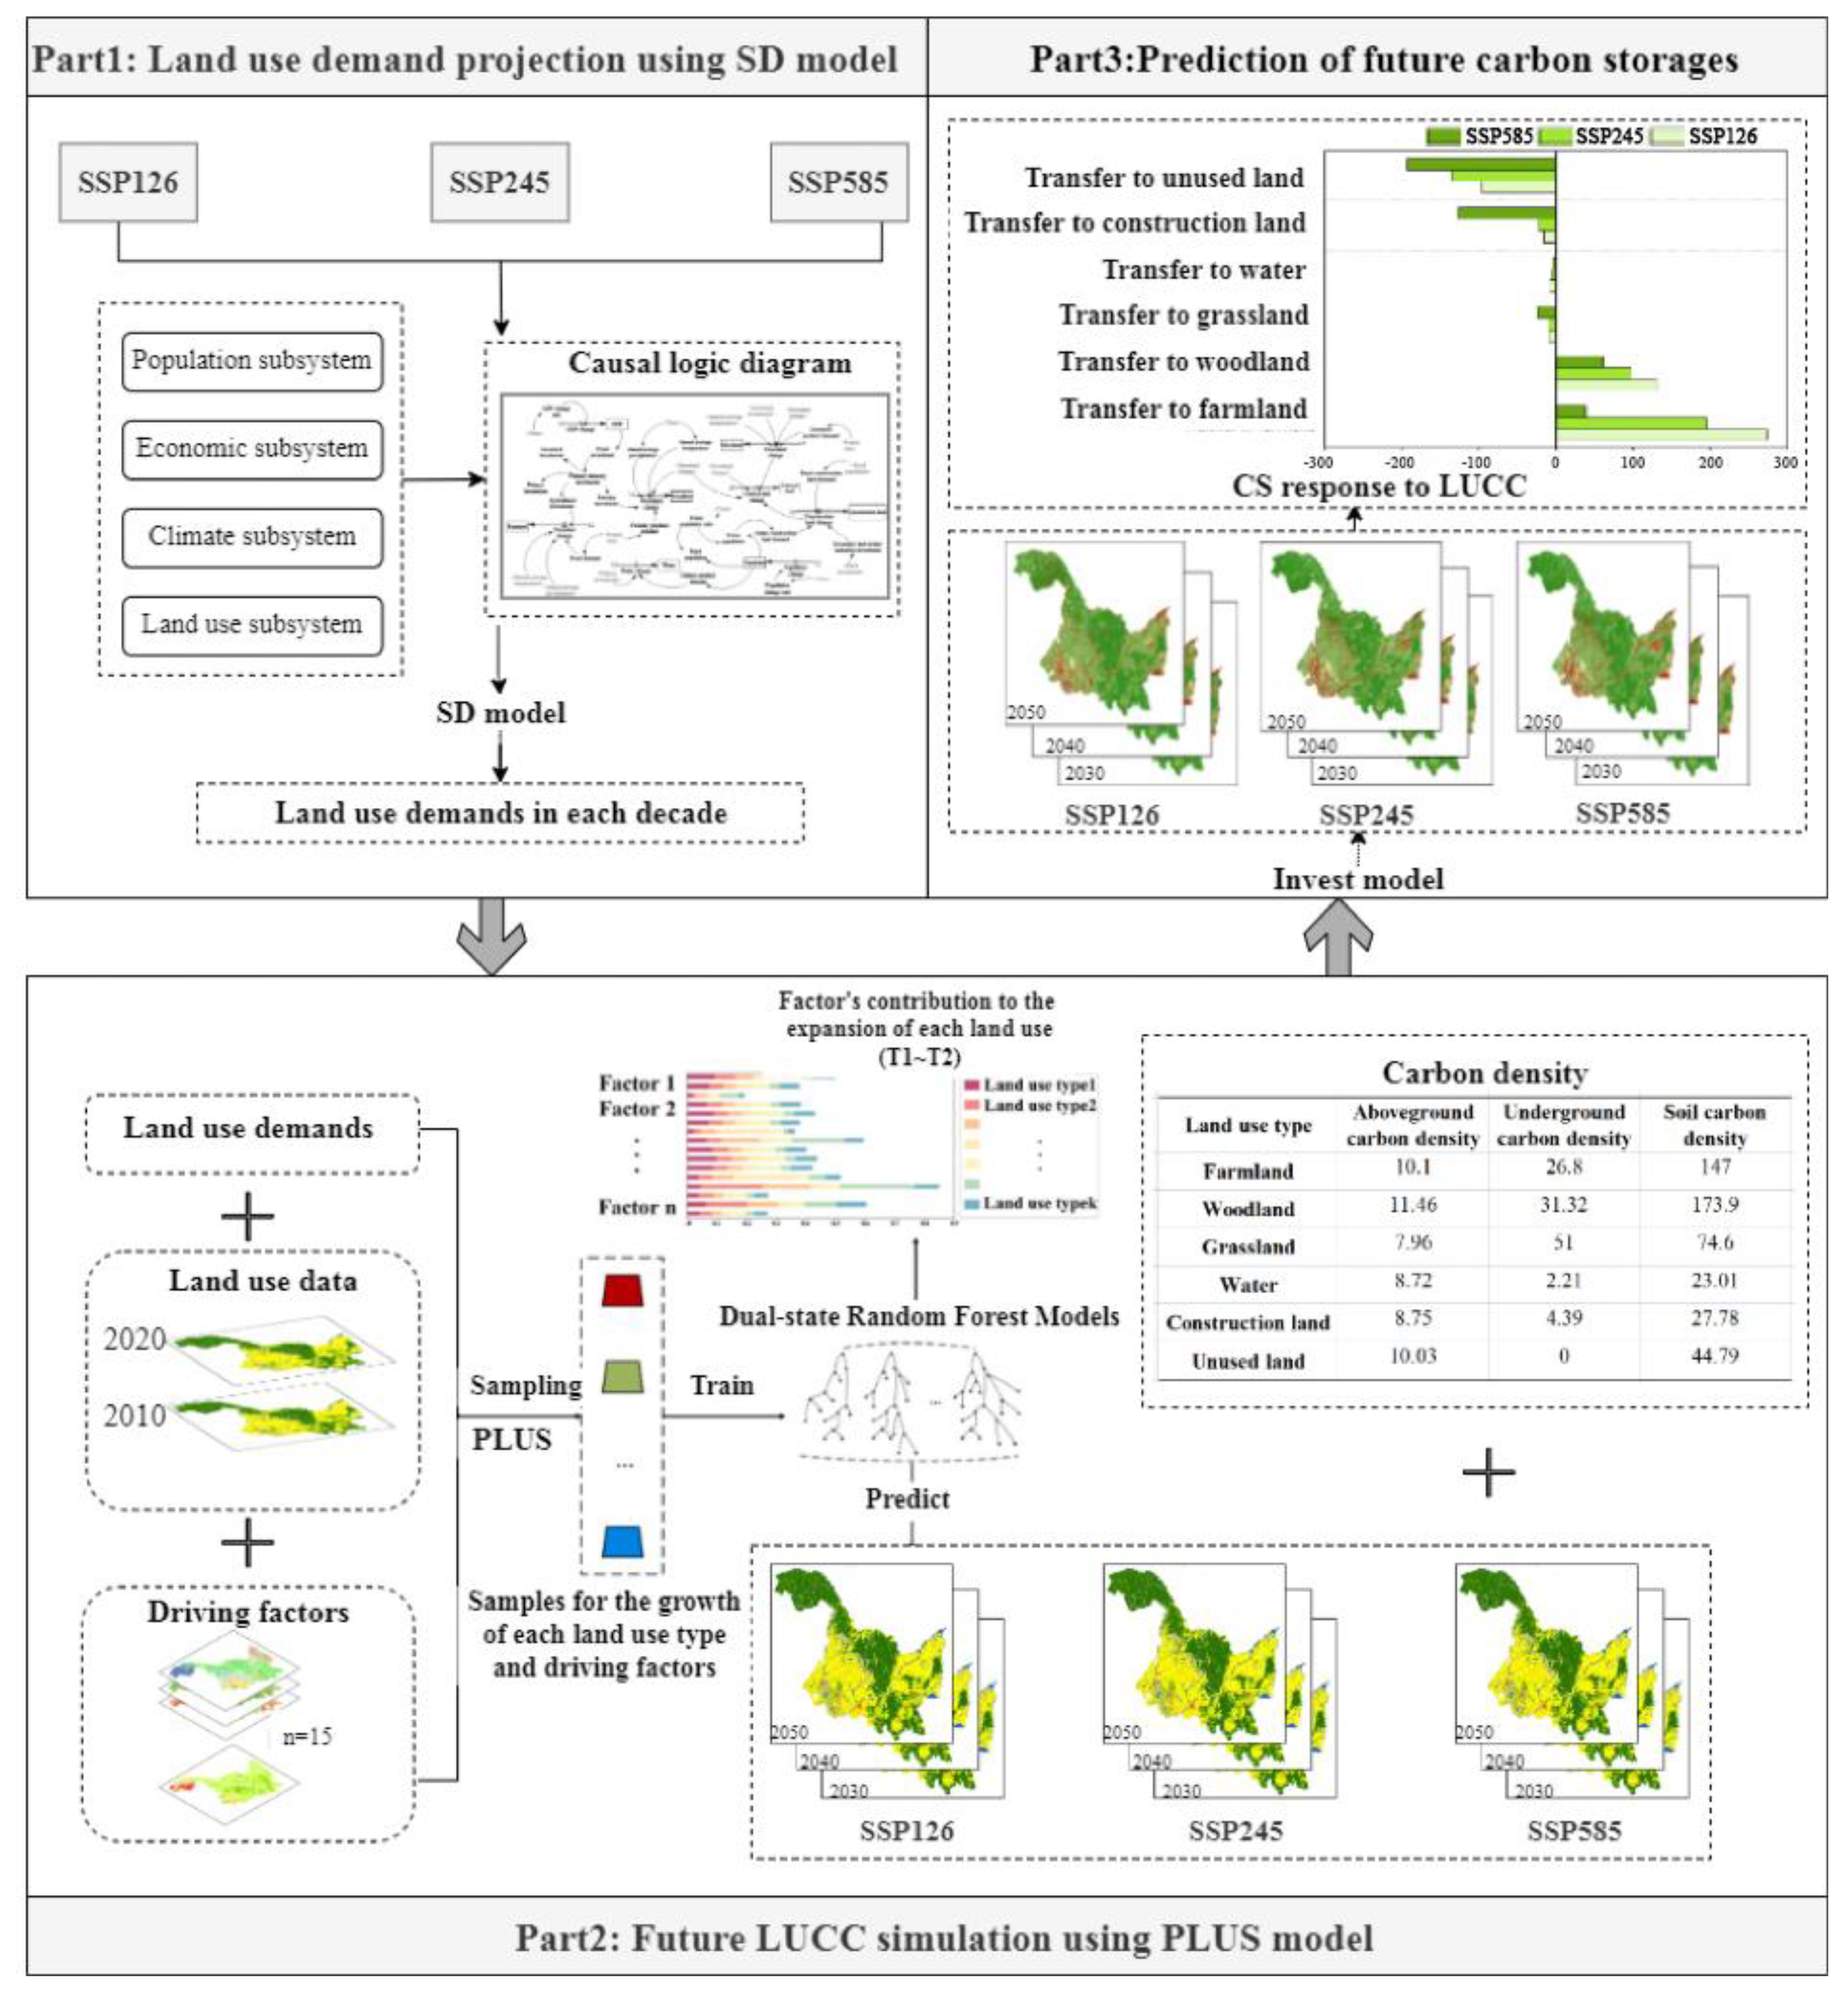
Heilongjiang Province is situated in northeastern China, bordering Russia. It spans 10 latitudes from south to north and encompasses 2 thermal belts (43°26′–53°33′ N), as well as 14 longitudes from west to east with 3 humid zones (121°11′–135°05′ E). The total area covers approximately 47.3 × 10⁴ km2, which includes Gagdaqi and Songling District (Figure 1). The topography exhibited higher elevations in the northwest, north, and southeast regions, while lower elevations were observed in the northeast and southwest areas. It fell within the cold-temperate and temperate continental monsoon climate zone, characterized by an average annual temperature ranging from −5 °C to 5 °C and an annual precipitation between 400~650 mm. Its unique geographical location as a sensitive area for global change between two major climatic zones and at the southern edge of northern peatlands and Eurasian tundra has resulted in regionally specific changes in carbon stocks caused by LUCC. Therefore, studying these changes is crucial for developing a low-carbon territorial spatial pattern and promoting carbon peak and neutrality when considering its ecological strategic position within China.
The data required for the study are encapsulated in Table 1. (1) The LUCC data for 2010 and 2020 were obtained from the Resources and Environmental Sciences and Data Center, Chinese Academy of Sciences (http://www.resdc.cn, accessed on 6 November 2022). They underwent reclassification into six land use types using ArcGIS10.6, namely farmland, woodland, grassland, water, construction land, and unused land to facilitate future LUCC and carbon stock simulations. (2) Meteorological data were acquired from Heilongjiang Meteorological Bureau by interpolating 72 meteorological observations spanning from 2000 to 2020 inclusive to derive annual mean temperature and rainfall values (http://hlj.cma.gov.cn/, accessed on 8 November 2022). Topographic information was sourced from GS Cloud (https://www.gscloud.cn, accessed on 8 November 2022), while soil data were obtained from the Resource and Environment Science and Data Center of Chinese Academy of Sciences (http://www.resdc.cn, accessed on 9 November 2022). (3) Socioeconomic data comprised two parts: Part one originated from the Heilongjiang Statistical Yearbook which facilitated utilization within the SD model for predicting land use demand (http://tjj.hlj.gov.cn, accessed on 6 November 2022); Part two served as driving factors in the PLUS model for emulating future LUCC. GDP, Population density and were procured from the Resources and Environmental Sciences and Data Center, Chinese Academy of Sciences; The railway and highway were extracted from the OpenStreet Map. The main trunk streams were selected to represent water areas (http://www.ngcc.cn/ngcc/, accessed on 10 November 2022). Euclidean distance calculations were performed using ArcGIS 10.6 for the aforementioned factors. All spatial datasets were converted into raster format with a resolution of 30 m × 30 m.

2.2. Methodologies

The research framework was illustrated in Figure 2. Firstly, the SD model was employed to integrate economic, demographic, climatic and land use variables for predicting the land use demand under different SSP-RCP scenarios for 2020–2050; Secondly, the PLUS model was used to simulate the spatial distribution of future land use dynamics; Lastly, based on the simulation outcomes obtained from the coupled SD-PLUS model, the future carbon stock under different scenarios were evaluated using the InVEST model.

2.2.1. Defining Future Climate Scenarios

CMIP6 project integrates various scenarios of SSPs and RCPs to elucidate the influential role of diverse socio-economic development models in shaping climate change [47]. Heilongjiang province is China’s grain production base and traditional heavy industry base, as well as an ecological barrier. Based on this consideration, we chose three representative scenarios, namely SSP126, SSP245 and SSP585. The SSP126 scenario represents a sustainable future with low mitigation pressure and radiate forcing, the SSP245 scenario represents a future that maintains current socio-economic and scientific-technical trends with medium radiate forcing, and the SSP585 scenario represents a high fossil fuel-dominated development path under high radiate forcing.
The parameters were derived from four dimensions: GDP, population, temperature, and precipitation. Initially, they were adjusted based on the kilometer grid-scale projections of China’s future population and GDP under five distinct development models of the SSP. Subsequently, these parameters were inputted into an SD model to simulate potential climate changes in Northeast China under various SSP-RCP scenarios. Specific parameter configurations for different SSP-RCP scenarios were presented in Table 2.

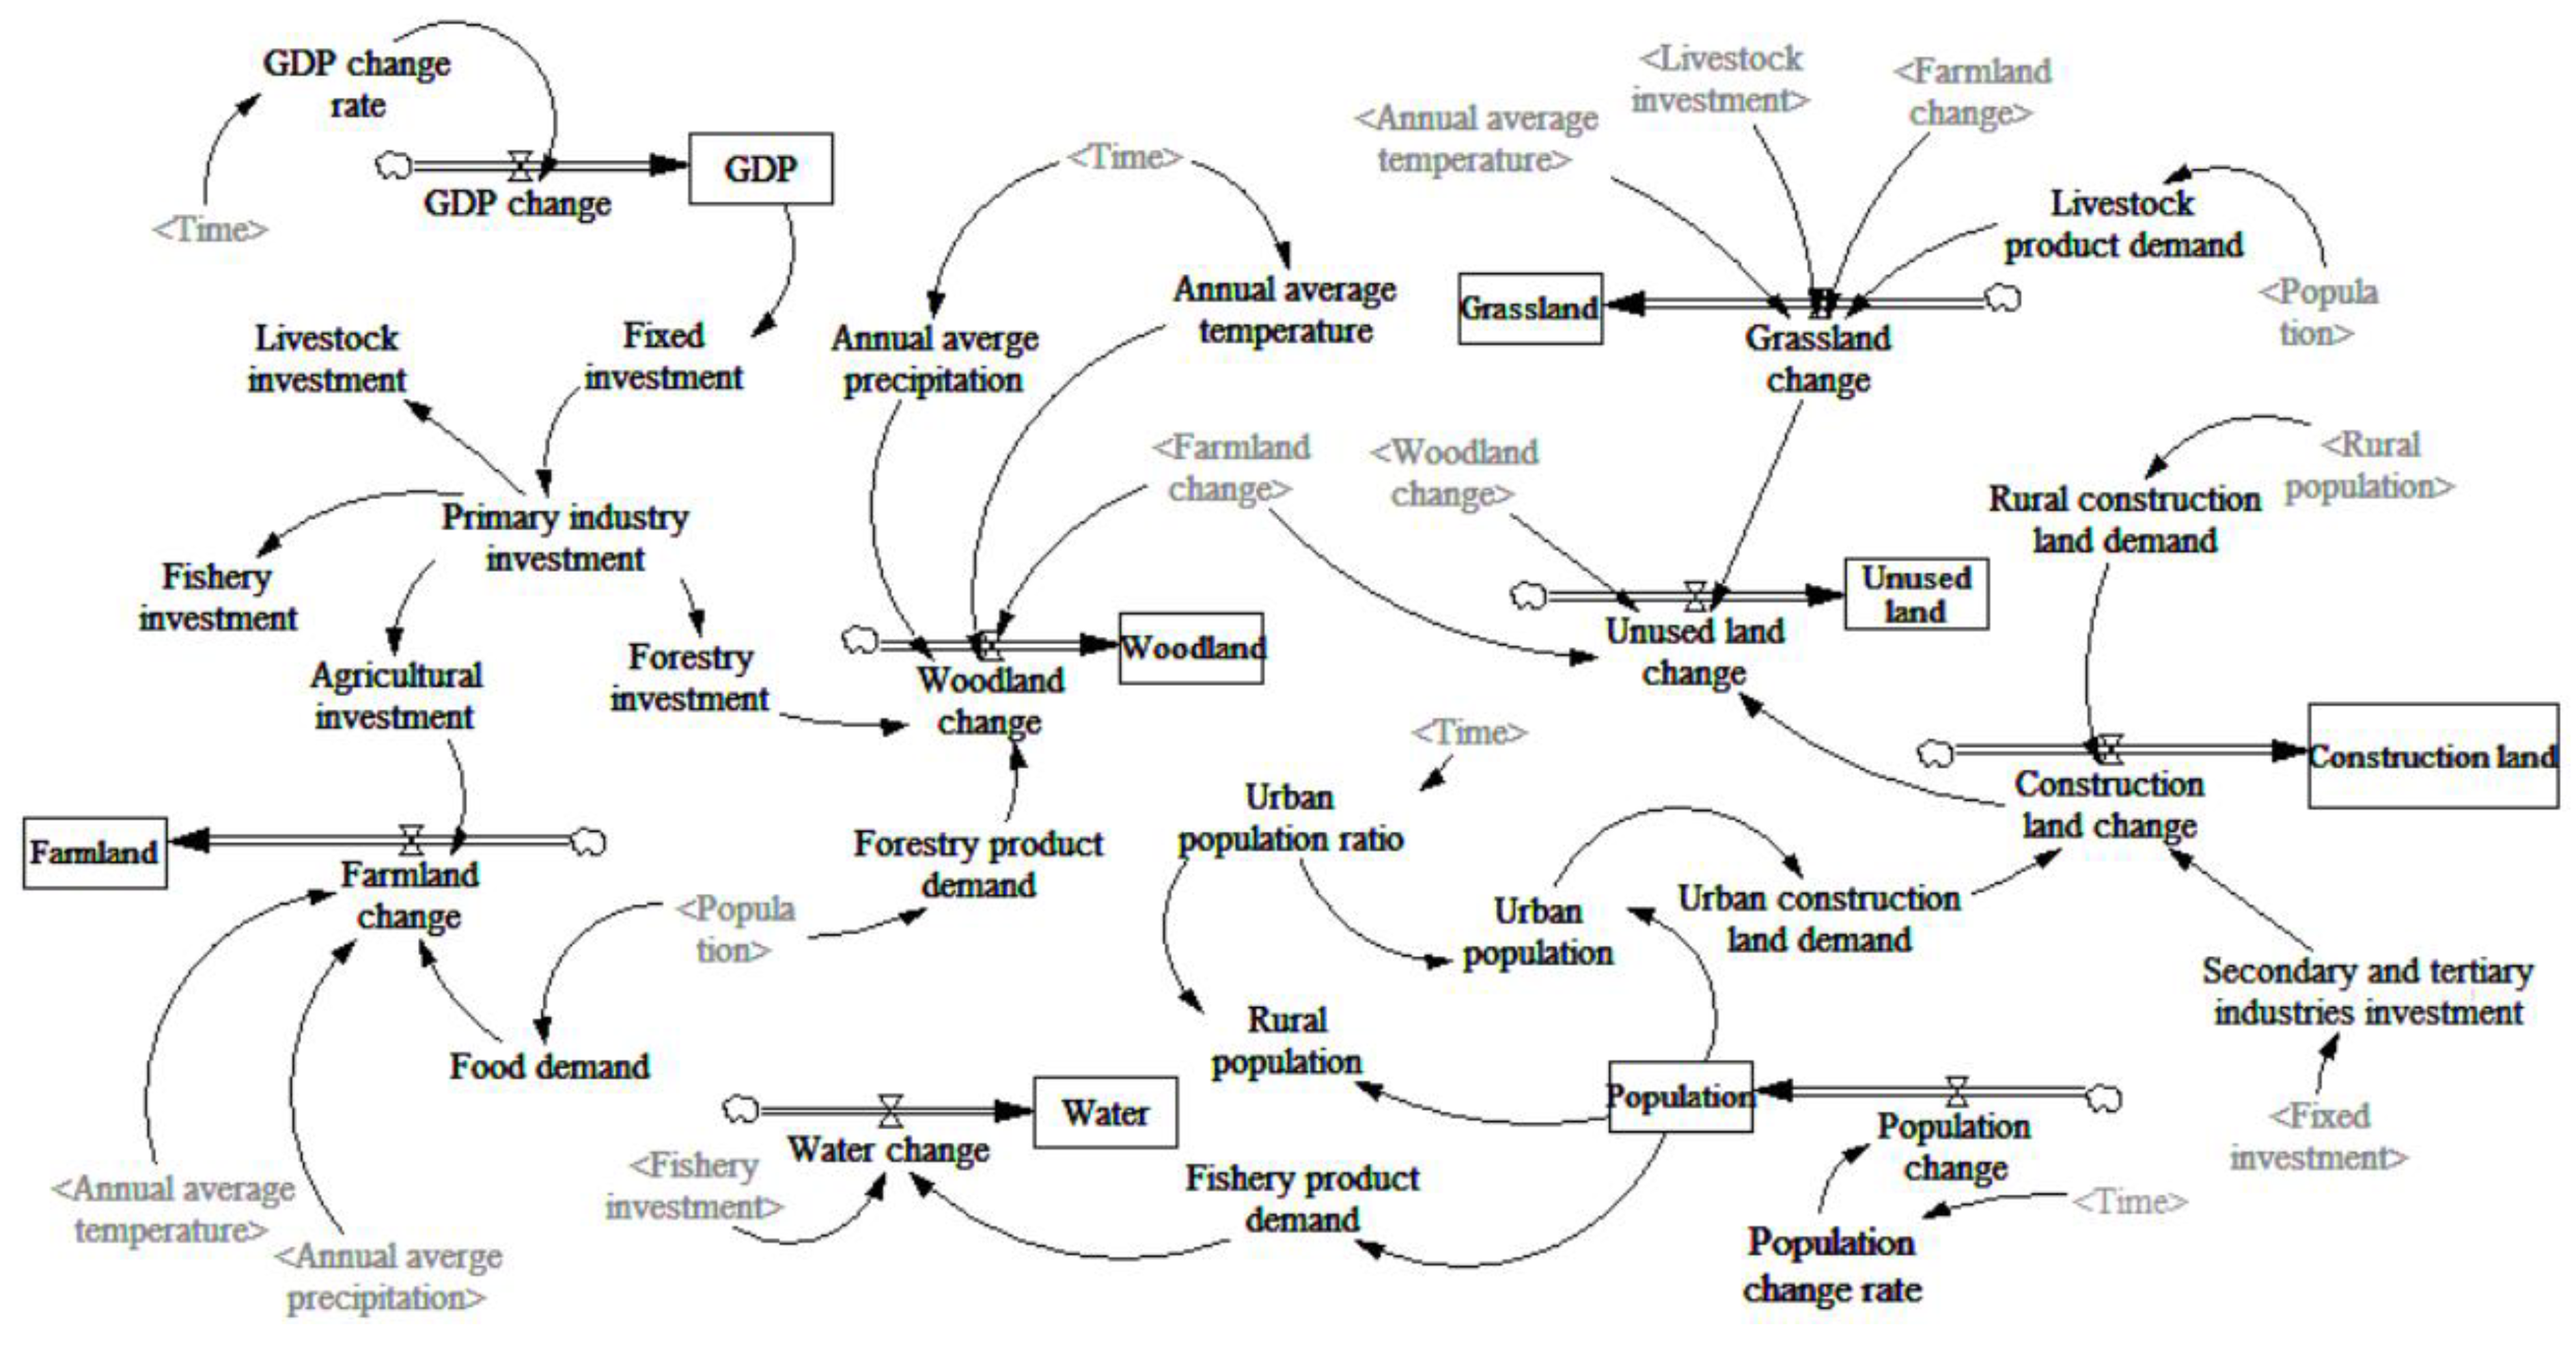
2.2.2. Land Use Demand Projection Using SD Model

In this paper, the SD model was constructed using four subsystems-economy, population, climate, and land use. The economic subsystem had a significant impact on LUCC through increased investment in various industries that promoted the expansion of farmland and construction land. GDP growth rate was chosen as the flow variable corresponding to the state variable GDP. Other indicators included fixed asset investment and agriculture, forestry and fishery output which revealed the linkage between economic growth, national income allocation and input factors. The population subsystem played an indispensable role as changes in it drove changes in other sectors with total population, rural population, urban population, and urbanization rate being its main state variables. An increase in population led to an indirect effect on land use change due to increased demand for agricultural and livestock products while urbanization resulted in an increased demand for land for urban construction. The climate subsystem exerted a long-term influence on the dynamics of natural landscapes, including farmland, grasslands, and woodlands. For instance, vegetation restoration and its function in natural landscapes were subject to temperature variations. Similarly, moderate precipitation ensured that vegetation meet its water demand while adjusting its coverage area accordingly. Therefore, mean annual temperature and precipitation served as state variables for this subsystem. Finally, all land use types were used as state indicators of the land use subsystem aiming to obtain information on changes in land use.
The Vensim 3.2 software was used to conduct a SD model. Firstly, the mathematical relationships between variables were established through multiple simulations after analyzing the interactions among subsystems and variables. Secondly, the robustness of the model was evaluated by comparing simulation results with reality during the historical simulation stage from 2000–2020. Next, parameters for different scenarios were imported into the SD model using 2021 as the base year to project land use demand for future scenarios from 2030–2050. Note that parameters needed verification and correction to improve accuracy in predicting future land use demand. In this paper, relative error was used to check simulation results. The formula was as follows:
δ = ( L L * ) L × 100 %
where δ was the relative error, reflecting the confidence level of the simulated value; L was the real value; L * was the simulated value corresponding to L .

2.2.3. Future LUCC Simulation Using PLUS Model

The PLUS model consisted of two primary modules: the LEAS-based rule-mining framework and the CARS-based CA. The LEAS module extracted land expansion over two periods, calculated development probability for each land-use type, and determined driver contributions using the Random Forest algorithm. Meanwhile, the CARS module simulated automatic patch generation and spatio-temporal dynamics under developmental probability constraints through stochastic seed generation and threshold downscaling mechanisms.
The default values recommended by the software were used for the parameters in both the Random Forest module and the CARS simulation module, as described in [35]. Specifically, the number of mTry was set to a value less than 15. In the transfer matrix, a value of 0 indicated no transformation occurred while a value of 1 indicated transformation. The domain weights were determined based on the extended area ratio of land-use types, as showed in Table 3.

2.2.4. Carbon Stock Estimation Using InVEST Model

There were four basic carbon pools in the InVEST model, namely above-ground biogenic carbon, below-ground biogenic carbon, soil carbon, and dead organic carbon. The total formula for calculating the amount of stored carbon was as follows:
C total = C above + C below + C soil + C dead
C totali = ( C abovei + C belowi + C soili + C deadi ) × A i
where Ctotal was the total carbon stock; Cabove was the carbon stock of aboveground biomass, including the carbon stock of all living plants (e.g., bark, branches, leaves); Cbelow was the carbon stock of below ground biomass, including the carbon stock of living root parts of plants; Csoil was the carbon stock of soils; Cdead was the carbon stock of dead organic matter; Ai was the area of land-use type i, and Cabovei, Cbelowi, Csoili, and Cdeadi was the corresponding carbon density of land-use type i.
The precision of carbon stock simulations was contingent upon the accuracy of carbon density. In this study, carbon density data were primarily derived from actual measurements in Heilongjiang Province and surrounding areas, supplemented by the literature sources. Local meteorological factors were taken into account for correction purposes, resulting in a comprehensive database of carbon densities across various land-use types (refer to Table 4).

3. Results

3.1. Future Land Use Demand Projection Using SD Model

The logical interplay among the four subsystems of economy, population, climate, and land use that influence future land use demand was illustrated in Figure 3, while Table 5 presented the precision of the SD model for the historical period (2000–2020).
The disparities between the simulation outcomes and actual patterns were minimal, with relative deviations of less than 10% except for water, indicating a high level of accuracy in the model’s simulations and its ability to predict future land use changes. Based on this foundation, Figure 4 illustrates projected land use demands for Heilongjiang Province under varying climatic scenarios from 2030–2050.
Overall, the most significant changes were observed in farmland, woodland, construction land, and unused land. Farmland, construction land and unused land increased under SSP126, SSP245, and SSP585 scenarios while woodland, grassland, and water all decreased to varying degrees with the largest increment or decrement under the SSP585 scenario. Under the SSP126 scenario, ecological lands such as woodland and grassland were well protected with little decrement while expansion of farmland and construction land was restricted obviously which represents a sustainable development pattern. Under the SSP585 scenario, however, the expansion and growth rate of farmland, construction land, and unused land were the most significant, while there was also a substantial reduction and decline rate in woodland and grassland, indicating an unsustainable development model. Change under the SSP245 scenario was intermediate between these two.

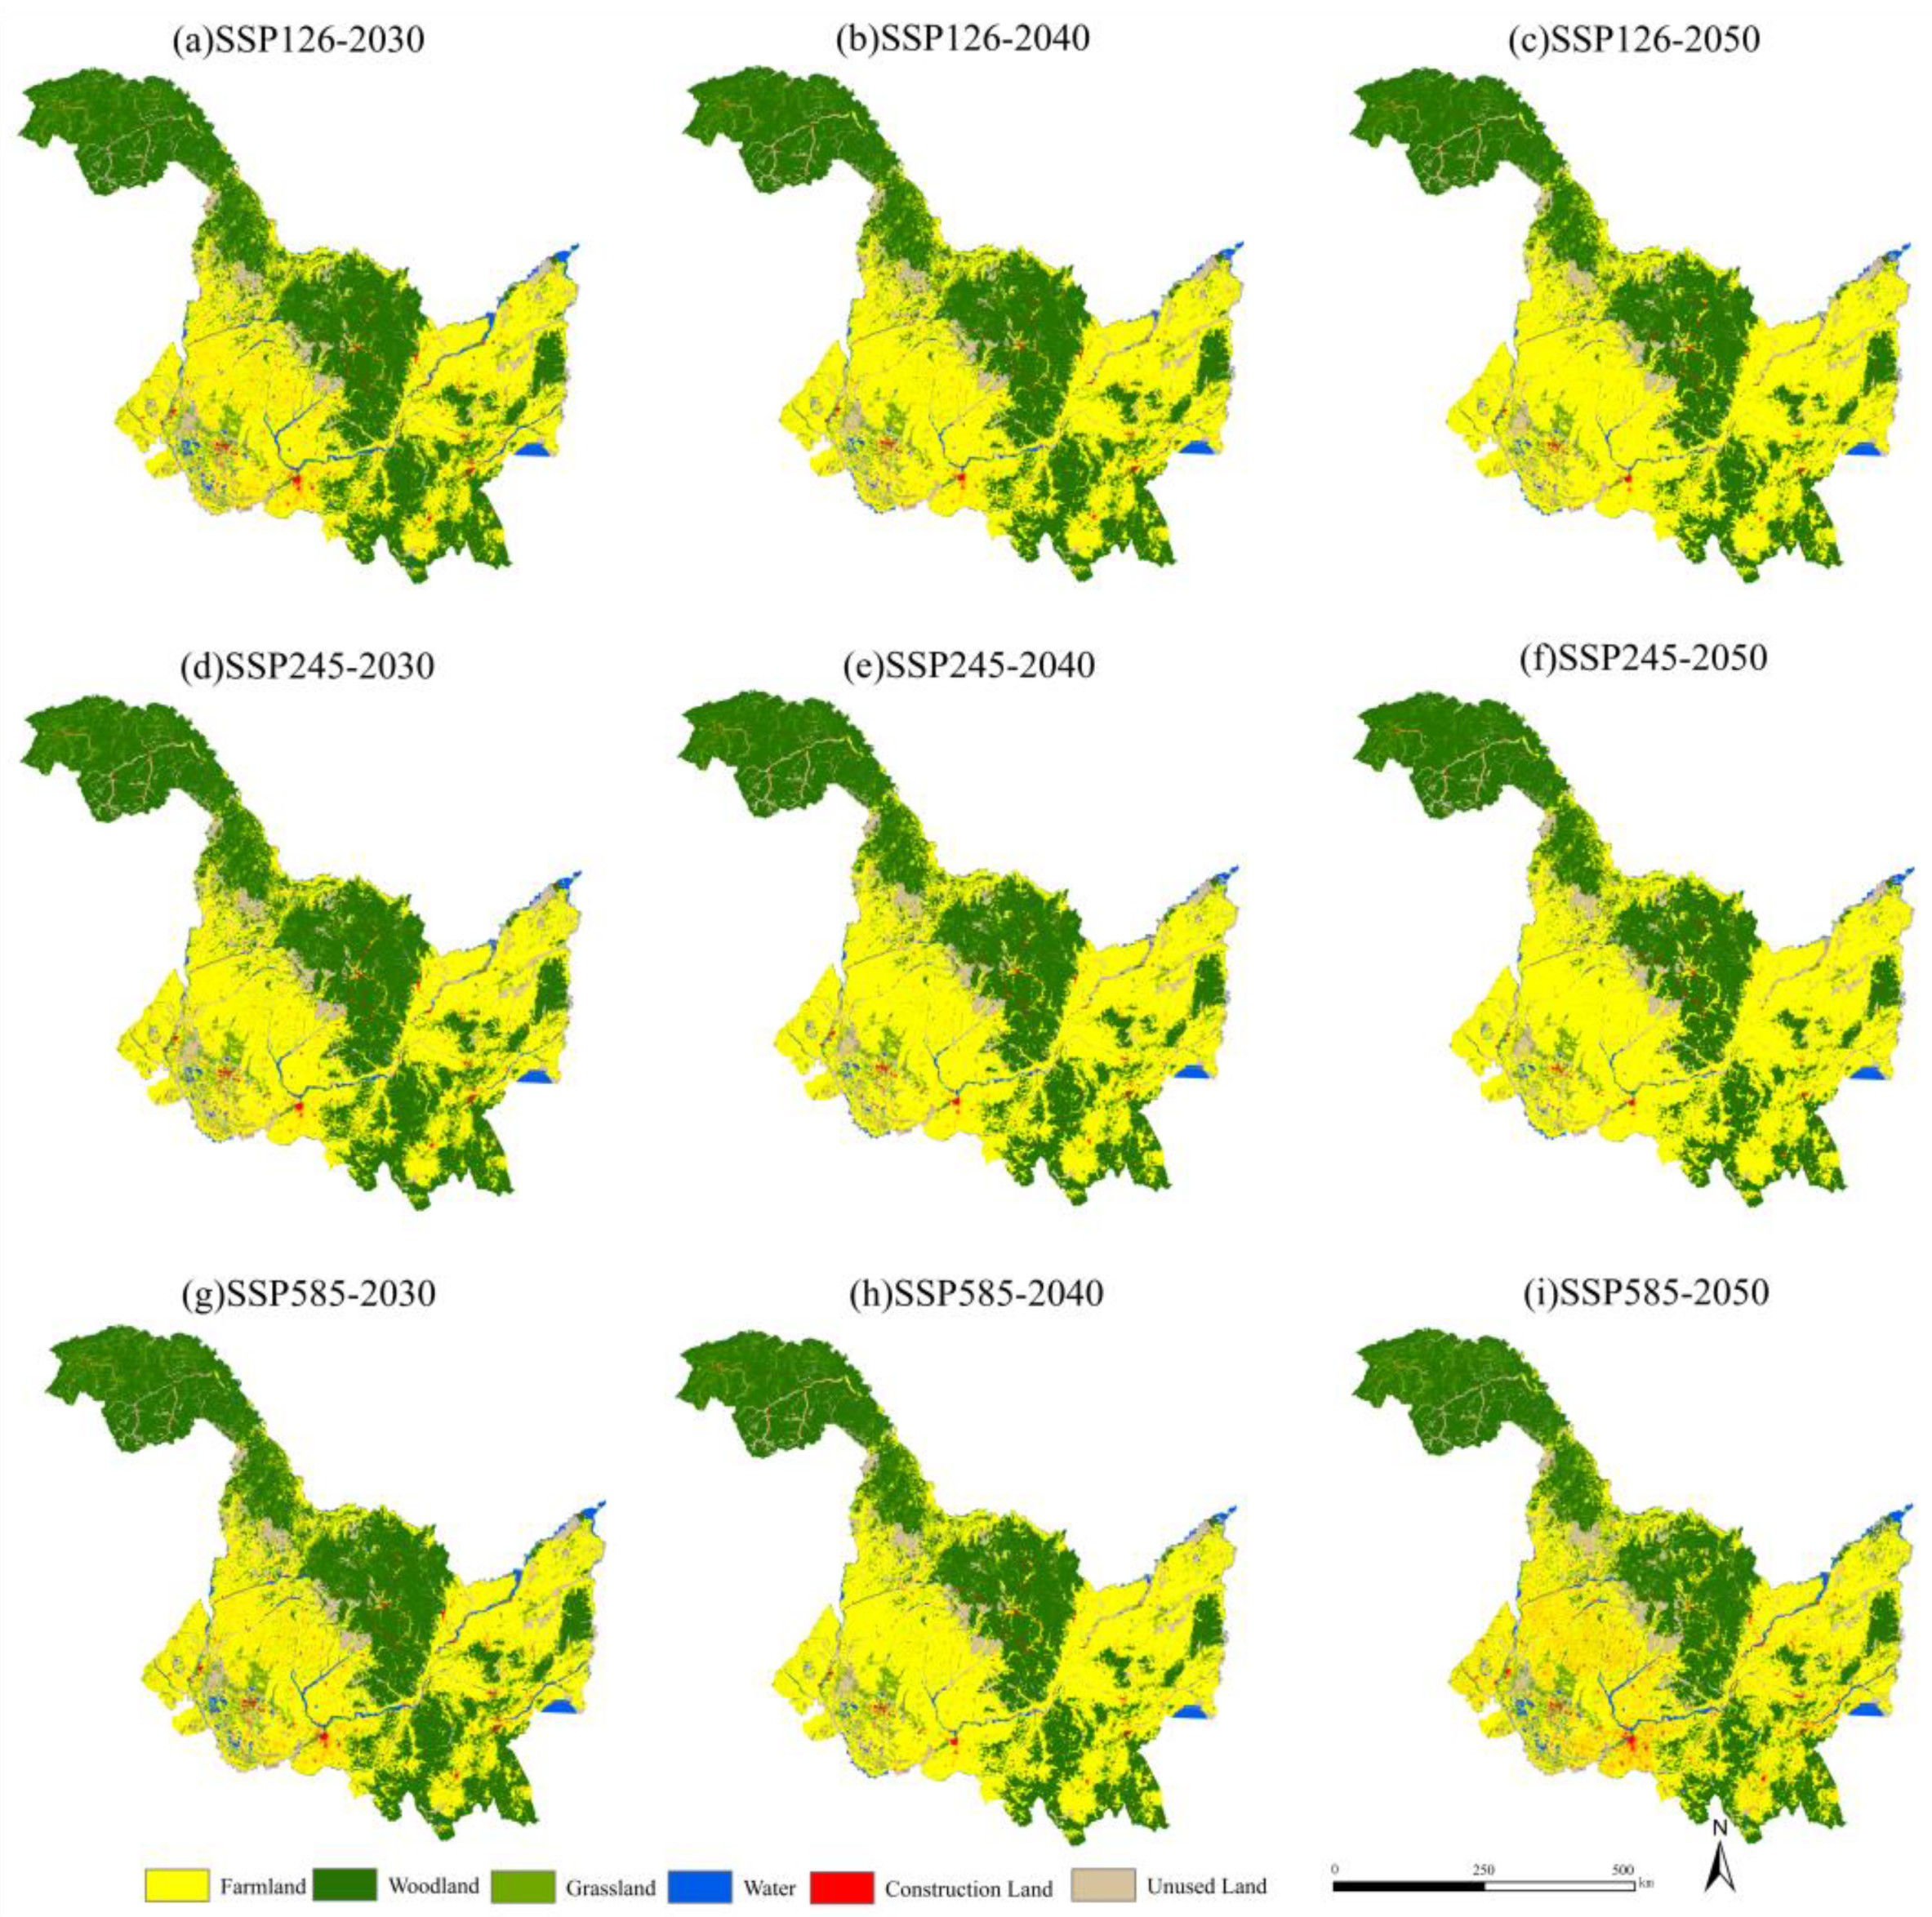
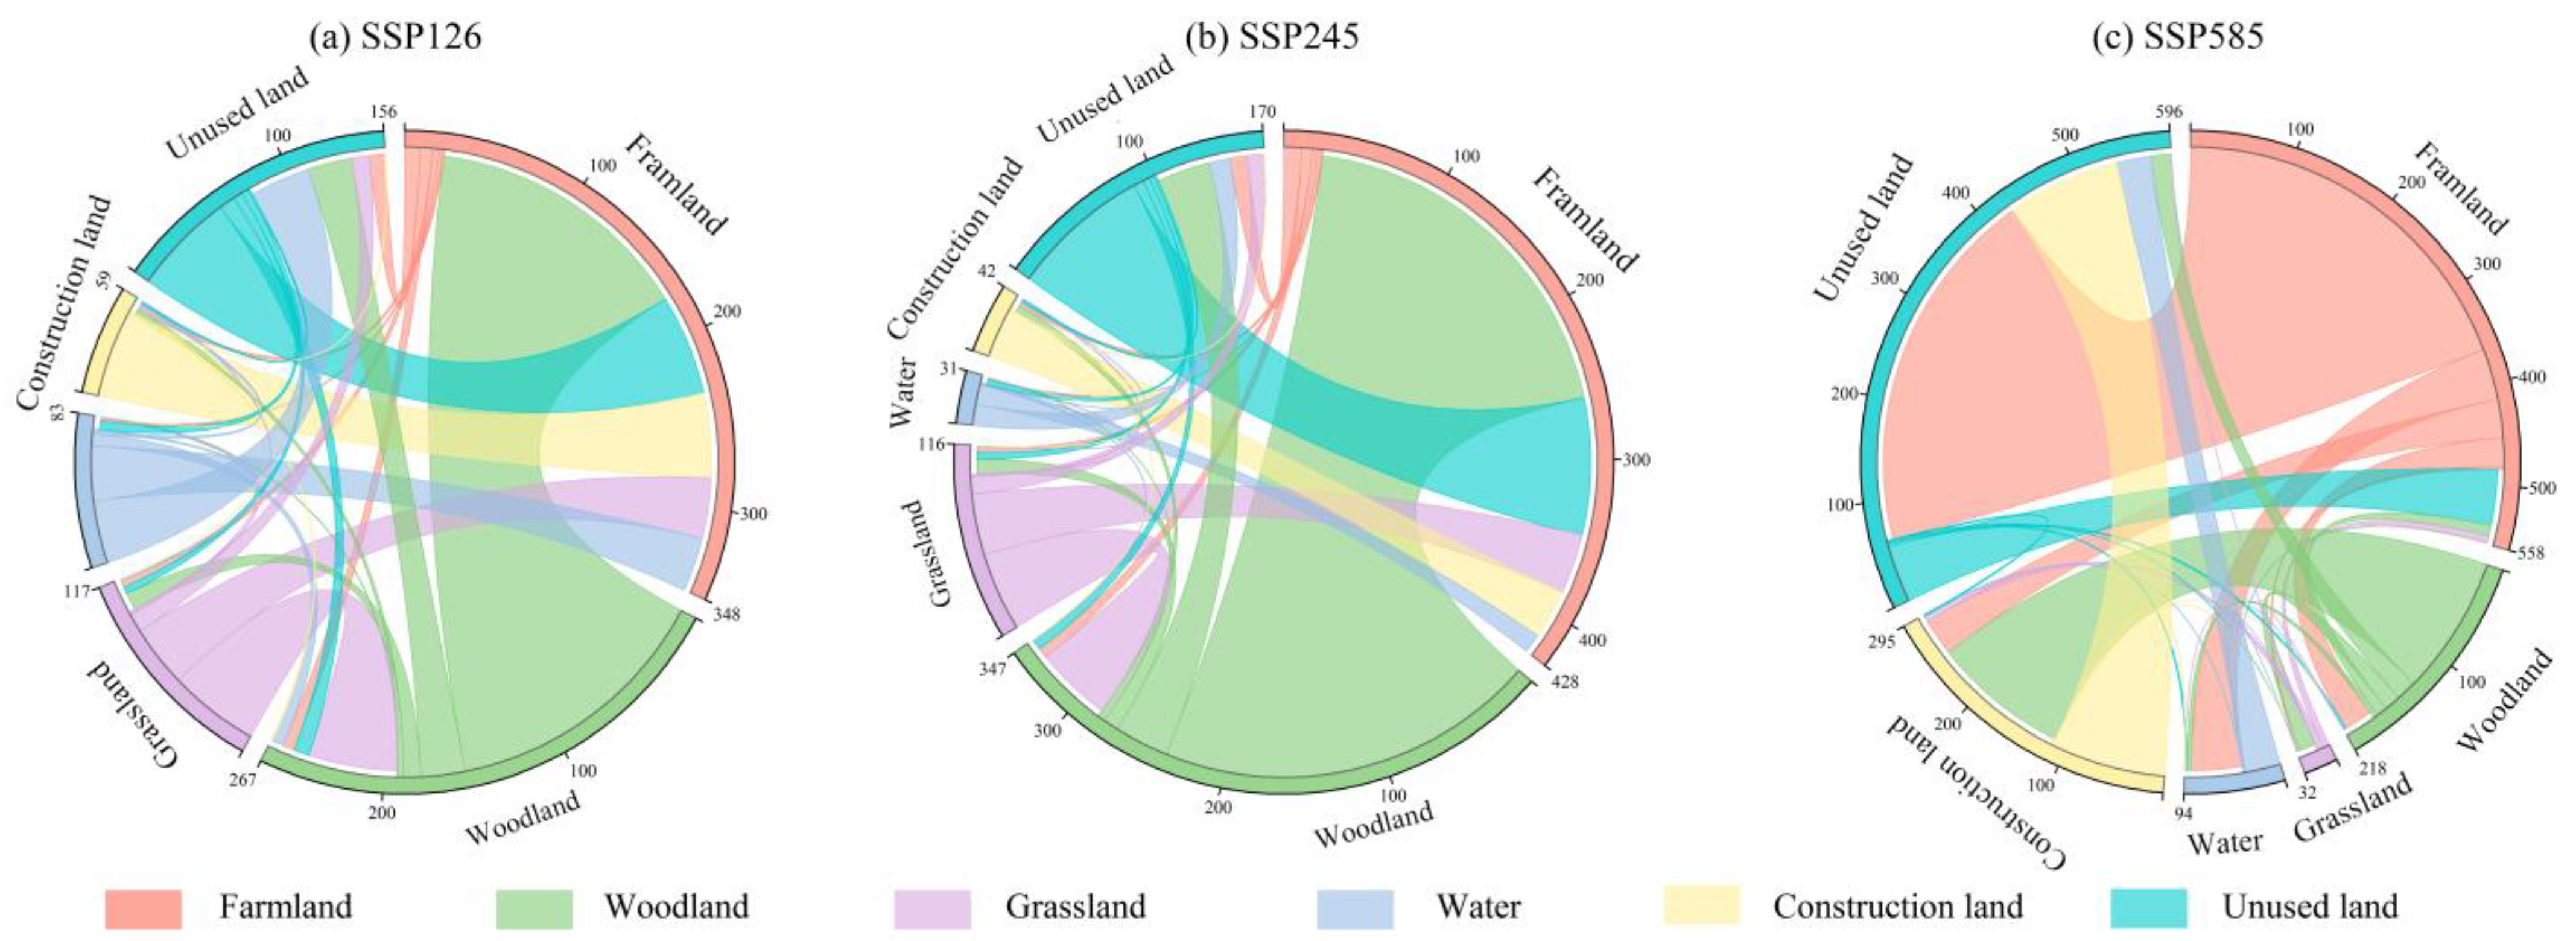
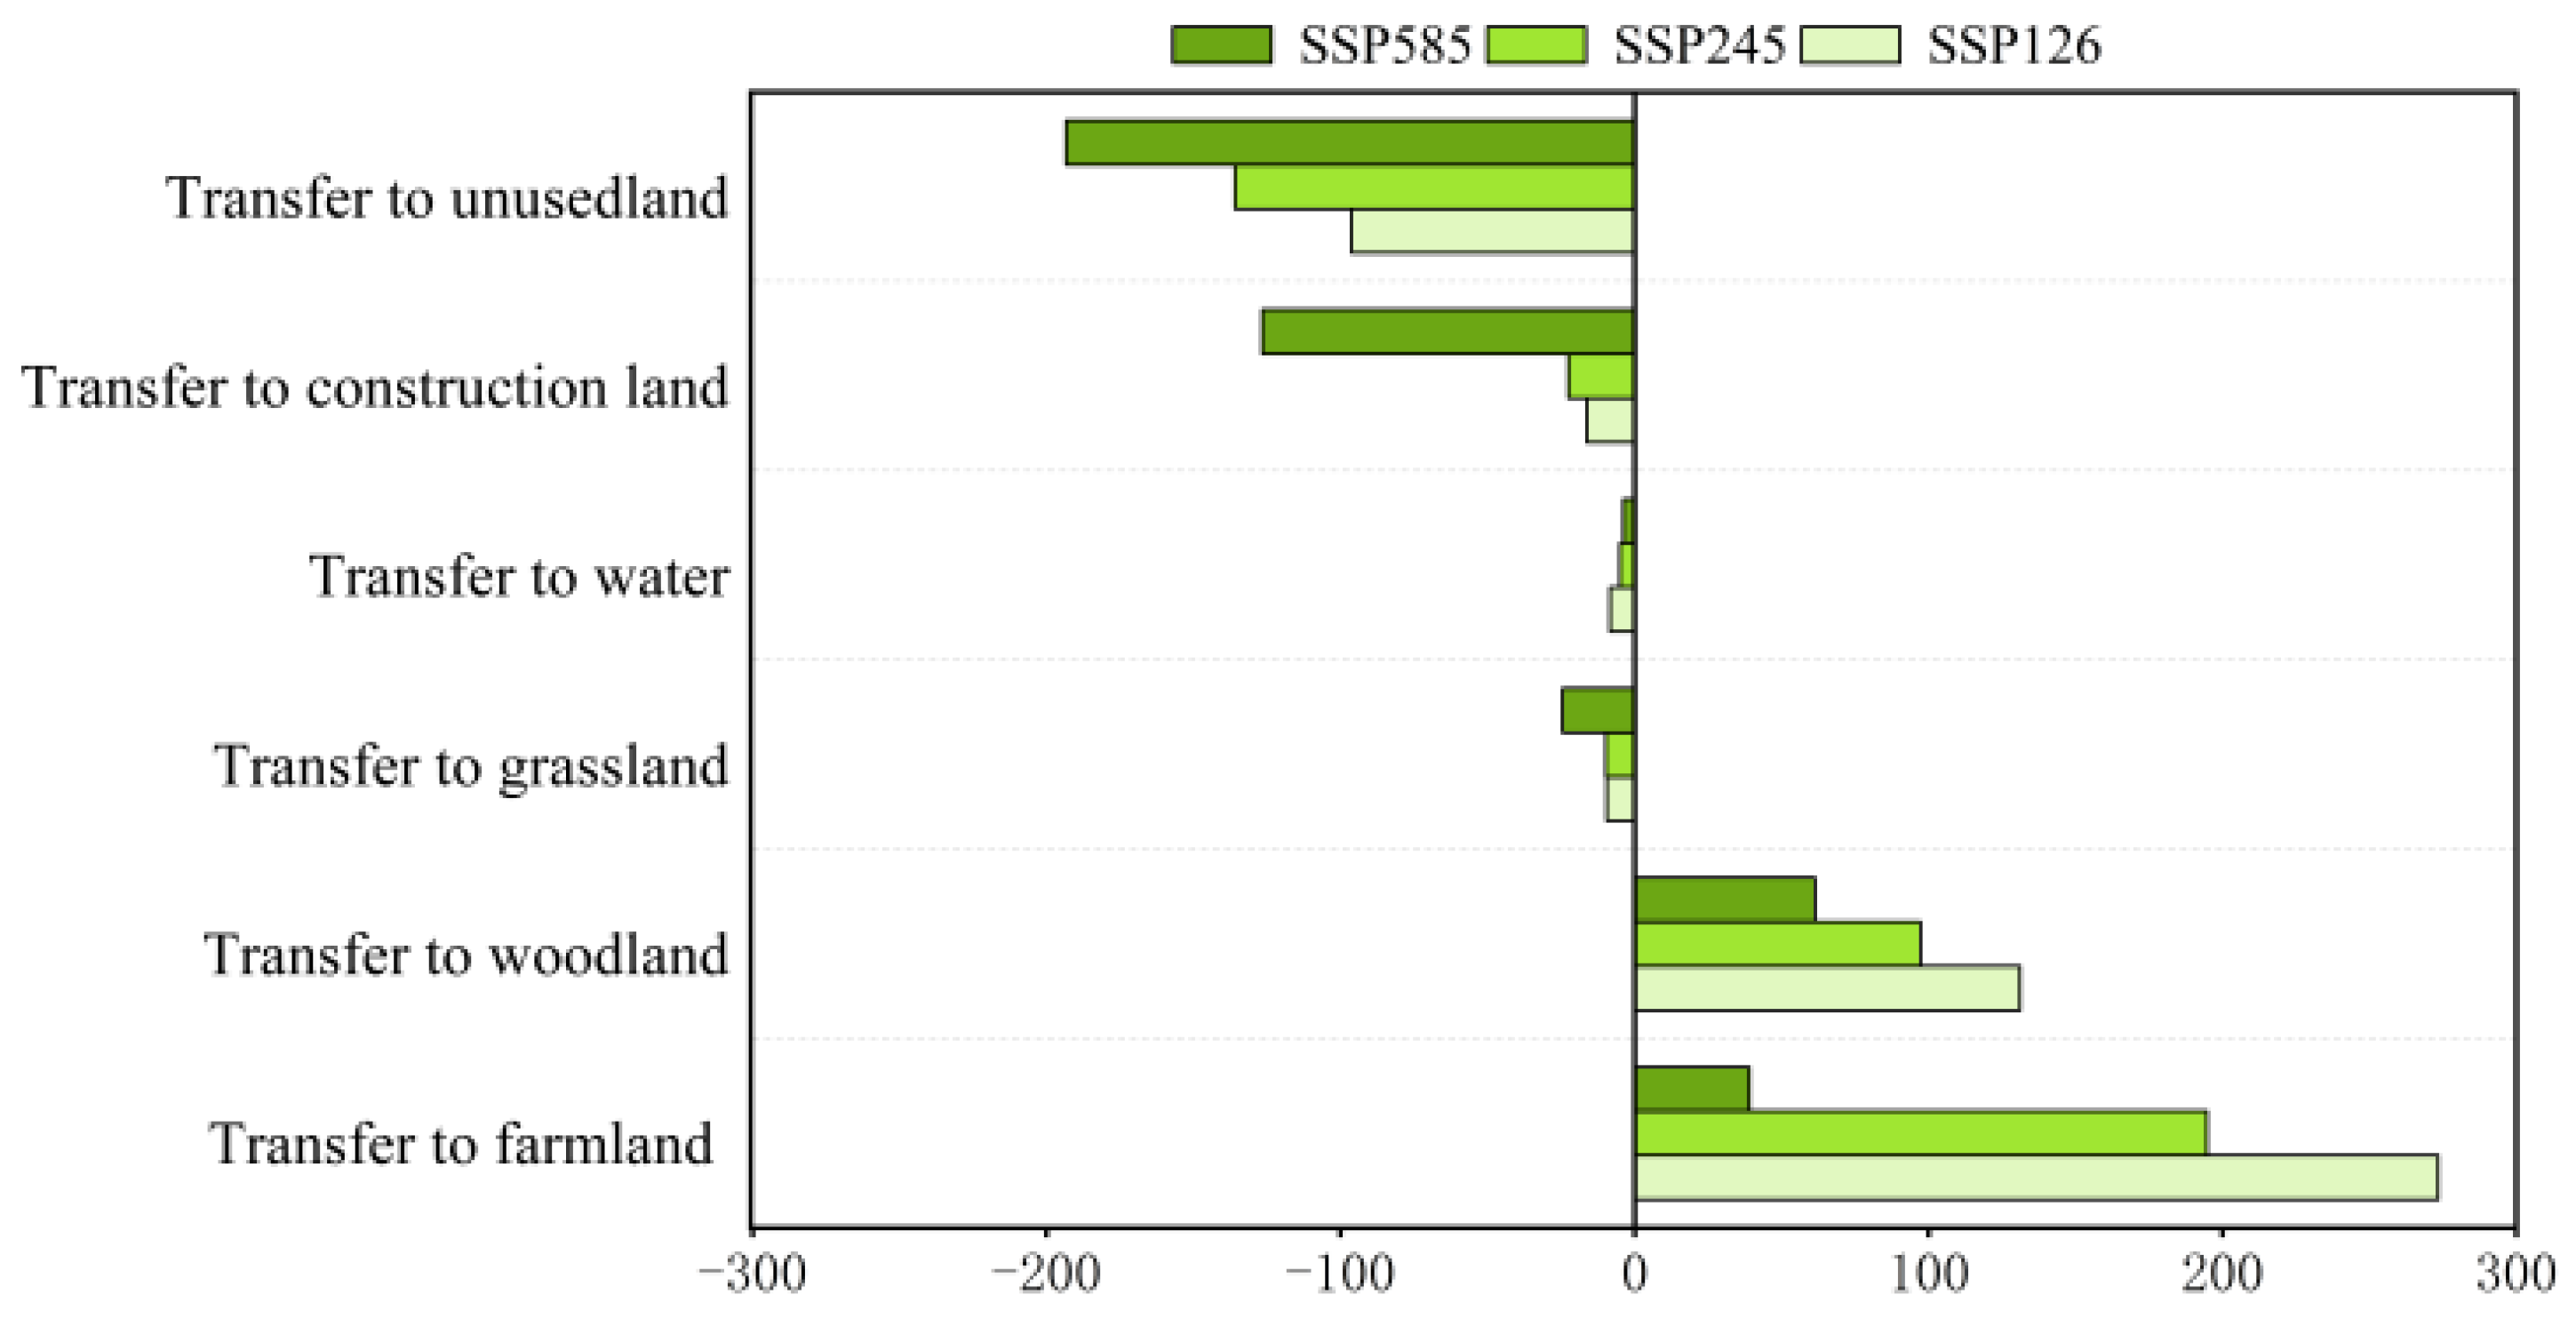
3.2. Simulation of Future Land Use Distribution

Based on the principles of data availability and importance, 11 driving factors including elevation, soil type, GDP, national road, and main stream were selected and incorporated into the PLUS model (Figure 5). The suitability potential of each land use type was identified using a neural network algorithm to obtain an emulation outcome of LUCC in 2020. This was then compared with the actual landscape pattern in 2020 to assess the reliability of the PLUS model (Table 6). Once prediction accuracy met requirements, land use demands under various SSP-RCP scenarios for 2030, 2040, and 2050 were inputted into the PLUS model to simulate spatial and temporal changes in future LUCC based on actual land use in 2020.
The PLUS model demonstrated an overall accuracy of 92.03% and a kappa coefficient of 0.82, indicating reliable and statistically significant simulation accuracy above the threshold of 0.75. Therefore, we conclude that the PLUS model was a plausible tool for predicting future land use spatial structure. Figure 6 illustrated the projected landscape patterns during 2030–2050 under three SSP-RCP scenarios.
The predominant landscapes in Heilongjiang comprised farmland and woodland, which accounted for over 70% of the total area. Unused land and grassland followed, constituting approximately 7–9% and 4–6% of the total area, respectively. Water bodies and construction land represented the smallest proportion, accounting for about 2–5% of the total area. Overall, farmland and unused land exhibited an expanding trend while woodland and grassland displayed a declining trend across all scenarios. The conversion of land areas amounted to 514.65 × 10⁴ hm2, 566.73 × 10⁴ hm2, and 865.25 × 10⁴ hm2 under the SSP126, SSP245, and SSP585 scenarios, respectively. Under the SSP126 scenario, farmland expanded by a total of 303.21 × 10⁴ hm2, with particularly significant growth in the eastern part of the survey region due to woodland expansion. Meanwhile, construction land in urbanized areas in the western part decreased by 44.02 × 10⁴ hm2 and was reclaimed as farmland. Woodland and grassland in Hinggan Mountains, Laoyao Mountains, and Wanda Mountains were better protected with insignificant changes in area observed. Unused land and water remained relatively stable. Under the SSP245 scenario, there was a significant increase in farmland in the Sanjiang Plain and Songnen Plain, totaling 379.2 × 10⁴ hm2, resulting in an accelerated loss of woodland (222.52 × 10⁴ hm2), grassland (80.37 × 10⁴ hm2), and unused land (32.42 × 10⁴ hm2). However, water and construction land remained relatively stable. Under the SSP585 scenario, the expansion of farmland was 140.55 × 10⁴ hm2, which was significantly smaller compared to the other two scenarios. However, there was a substantial increase in construction land by about 35.58 × 10⁴ hm2, particularly observed in the Harbin–Daqing–Qiqihar urban agglomeration located in the western part of the survey region. This rapid expansion of both farmland and construction land resulted in a significant reduction in woodland by 248.03 × 10⁴ hm2 in the central area.

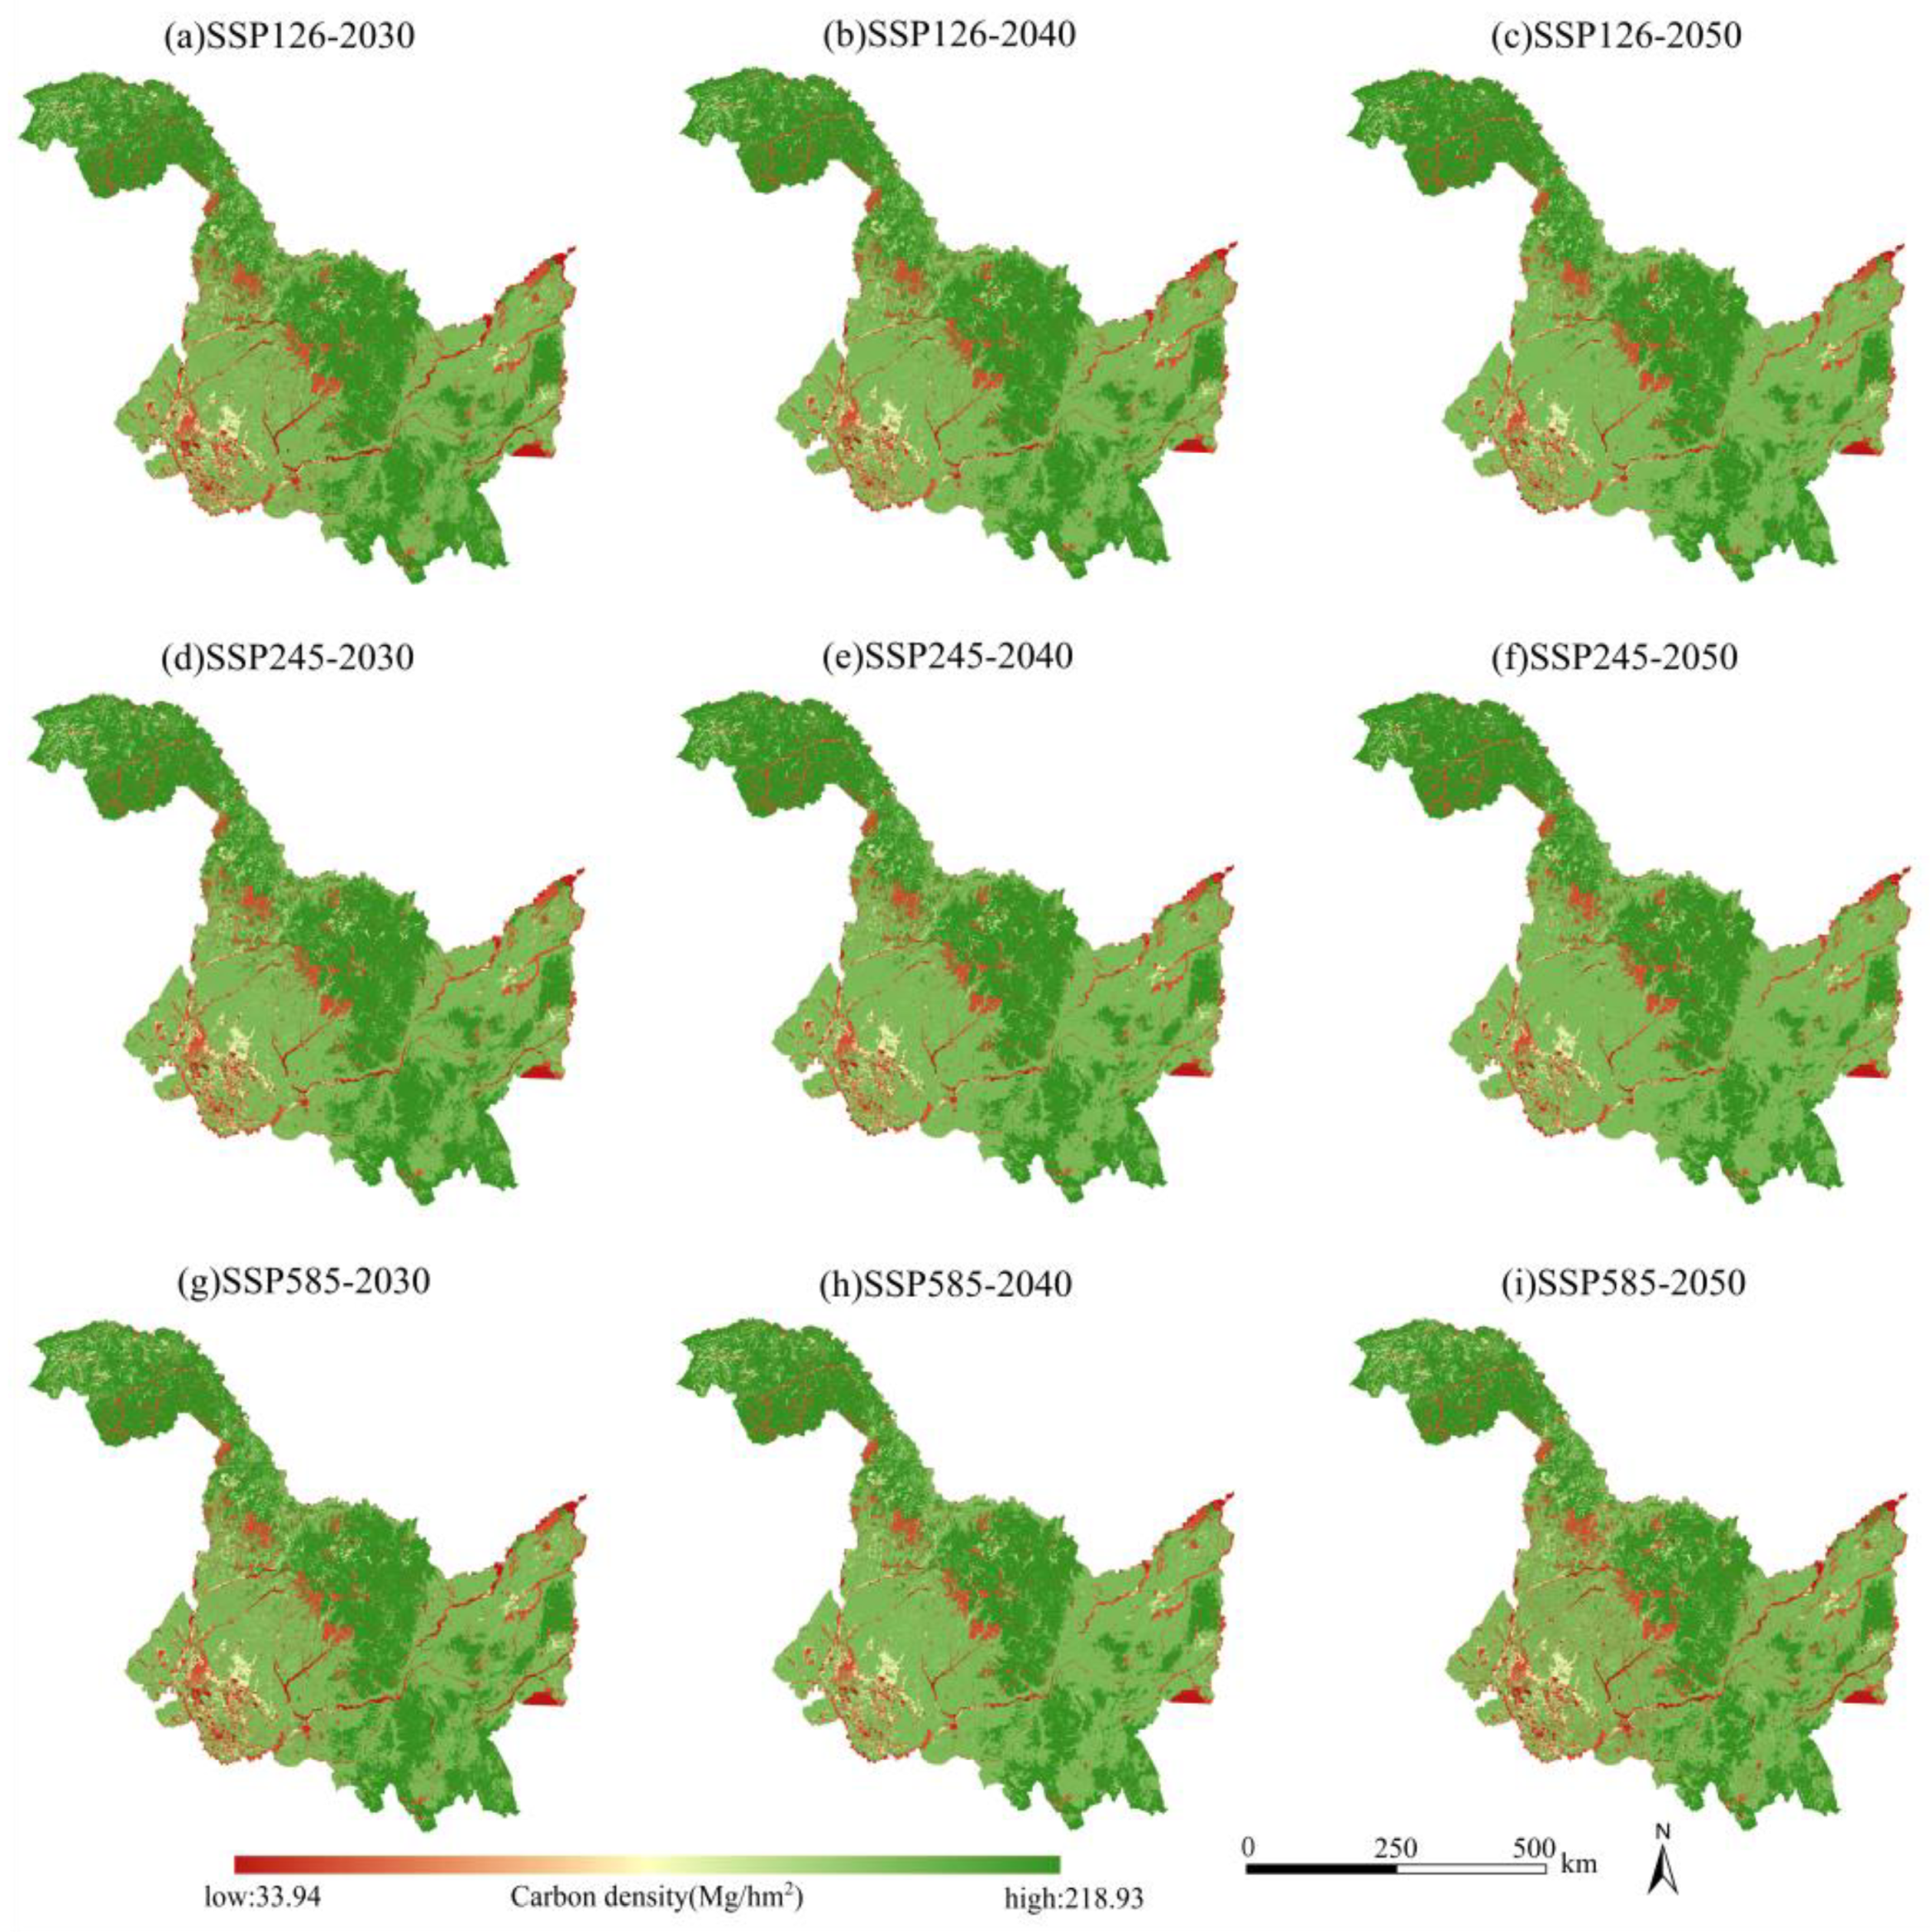
3.3. Prediction of Future Carbon Stock Based on the Invest Model

The carbon density data (Table 4) and the future LUCC data (Figure 6) were enter into the InVEST model to acquire the changes in carbon density under different SSP-RCP scenarios from 2030 to 2050 (Figure 7). Under the SSP126 and SSP245 scenarios, there was a continuous increase in carbon stock. By 2050, the total carbon stock under the SSP126 scenario reached 8196.34 × 106 Mg, showing an increase of 102.71 × 10⁶ Mg compared to that in 2020, with an average carbon density of 181.17 Mg/hm2; while under the SSP245 scenario, it reached a total of 8201.72 × 106 Mg, indicating an increase of 108.10 × 10⁶ Mg with an average carbon density of 120 Mg/hm2. Although the carbon stock under the SSP245 scenario was higher than that under the SSP126 scenario, it had a lower rate of increase compared to that observed for the latter scenario which was more crucial for terrestrial ecosystem’s carbon sequestration efforts. Under the SSP585 scenario, the total carbon stock in 2050 was 7888.99 × 106 Mg, which decreased by 204.64 × 10⁶ Mg compared to that in 2020, and the average carbon density was 174.38 Mg/hm2.

4. Discussion

4.1. Land Use Simulation Based on SD-PLUS Model

Enhancing the precision of LUCC simulation holds significant potential for improving the carbon stock assessment in terrestrial ecosystems [48]. Furthermore, ensuring accurate spatialization of carbon stock is crucial for facilitating regional development of low-carbon territorial spatial patterns [49]. CA models have been widely used as the primary research approach for future LUCC simulations [50,51]. However, traditional CA models suffer from significant limitations as they rely solely on historical land use patterns to predict future changes through Markov chains [52]. While these models may be effective in short-term predictions, their long-term simulations often overlook the influence of external factors such as economic and climatic changes on LUCC dynamics [24], leading to inadequate simulation accuracy. In contrast, SD models address this limitation by incorporating socioeconomic and natural drivers such as population, economy, climate, and land use into polynomial regressions to project future land demand accurately [34], aligning more closely with real-world development patterns [53]. The PLUS model incorporates an extended LEAS to spatially distribute land demand at a micro level, combining the strengths of both TAS and PAS strategies employed by other CA models, thereby compensating for the limitations of these models in simulating patch-level land use changes [31]. It outperforms models such as CLUE-S or FLUS in terms of location accuracy, quantity prediction, and landscape similarity [54,55]. Some previous studies have integrated SD and FLUS models for future LUCC simulations, demonstrating that the SD-FLUS model exhibits superior simulation precision and generates more realistic landscapes compared to other models [56]. However, when comparing the performance of the SD-PLUS model with that of the SD-FLUS model, we observe that the former significantly outperforms the latter with an overall accuracy of 0.92 and a Kappa coefficient of 0.82, both higher than those achieved by the latter at 0.75 and 0.67 respectively.

4.2. Changes in Carbon Stock and Its Response to LUCC

Land use change, resulting from both natural and socio-economic factors, constitutes a pivotal process that directly or indirectly induces changes in carbon stocks [19,57]. In this study, a land use shift chord diagram (Figure 8) was utilized to illustrate the transitions in land use patterns, while its impact on carbon stock was comprehensively analyzed (Figure 9), providing a detailed understanding of carbon stock changes specifically in Heilongjiang Province. Overall, the SSP126 scenario showed the largest increase in carbon stock, while the SSP245 scenario had a non-significant increase and the SSP585 scenario had a significant decrease. Under SSP126, farmland expanded while construction land decreased with little impact on ecological land such as forests and grasslands, making it an ideal model for economic development without compromising ecology [58]. In contrast, under SSP245, expansion of farmland came at the expense of woodland and grassland, which was not a coordinated economic-ecological development model despite arable vegetation’s carbon sequestration potential under certain conditions [59,60,61]. Finally, under SSP585, farmland and construction land were greatly extended at the cost of forest and grassland—an unsustainable development pattern. The decreasing trend of forest is therefore identified as being responsible for most carbon loss observed in Heilongjiang Province even if carbon stock increases in farmland [9]. Land use/land cover change has led to significant changes in carbon sinks or carbon sources of terrestrial ecosystems. The expansion of construction land and the decrease in ecological land can lead to the depletion of a large number of carbon pools [62]. On the contrary, the implementation of ecological projects can greatly promote the carbon sequestration capacity of terrestrial ecosystems while increasing the forest and grassland coverage. However, it must be admitted that it is not feasible to implement ecological projects in all regions. Therefore, we suggest that the spatial planning and zoning management of the land should be strengthened in the study area. That is, ecological protection should be implemented in the northern Xing’an Mountains, the Wanda Mountains, Zhangguangcai Mountains and Laoye Mountains in the southeast to play the role of ecological barriers; the encroachment of construction land on farmland and ecological land should be strictly controlled in the rapidly expanding urban agglomeration of Harbin–Daqing–Qiqihar. In addition, Heilongjiang Province is rich in black soil resources, and the carbon density is generally higher than that of other regions, which belongs to the soil with excellent carbon sequestration capacity. Therefore, eco-friendly farming methods should be promoted in typical black soil planting areas such as Songnen Plain and Sanjiang Plain, and soil erosion control such as black sloping farmland should be strengthened in the rolling hilly areas. At the same time, the transition from the original economic development mode to the ecological economy can alleviate the conflict between economic growth and environmental protection. These efforts will make a significant contribution to the realization of regional carbon neutrality goals and sustainable development goals.

4.3. Limitations and Implications

In this study, we employed the SD-PLUS model to simulate land use changes under three SSP-RCP scenarios for 2030–2050 and utilized the InVEST model to predict corresponding carbon stock changes. The primary objectives were to enhance the accuracy of land use dynamic simulation, investigate the impact of complex transitions between land use types on carbon stock under different SSP-RCP scenarios, and provide effective decision support for future territorial spatial planning and land use management. However, several limitations should be acknowledged: (1) We focused solely on three widely used and representative scenarios (SSP126, SSP245, and SSP585), neglecting other potential scenarios [48,63]. (2) Land use management practices such as forest fire prevention, grassland restoration management, and pest control were not considered due to article length constraints and data accessibility challenges [64,65,66]. (3) Land use change was a multifaceted dynamic process influenced by various factors; our study only accounted for 15 driving factors such as climate, population, economy while disregarding regional planning and policy factors that may have compromised the simulation accuracy of the SD-PLUS model to some extent. (4) Due to data acquisition limitations in this research endeavor, carbon density data required for the InVEST model was obtained solely through references rather than actual sampling data; moreover, vegetation type and soil type influences were overlooked [67]. Additionally, only soil organic carbon pool was taken into account while ignoring the significant effect of LUCC on soil inorganic carbon content [68,69]. Future studies should aim at incorporating more diverse SSP-RCP scenarios integrating impacts of land use managements on carbon stock along with combining field investigations with predictive models in order to improve overall accuracy.

5. Conclusions

Enhancing the precision of LUCC simulation and ensuring accurate spatialization of carbon stock are crucial for territorial spatial optimization efforts aimed at promoting low-carbon development patterns. In this study, we developed a framework that integrated the top-down model of SD with a bottom-up simulation model of PLUS to simulate the spatial dynamics of LUCC and carbon stock in Heilongjiang Province for 2030–2050 under different SSP-RCP scenarios with the help of InVEST model. The results demonstrated that this coupled SD-PLUS model performed well with an overall accuracy of 0.92 and a Kappa coefficient of 0.82, meeting the initial assumptions. The land use demand projection varied greatly under different SSP-RCP scenarios, with significant characteristics of sharp expansion in farmland and decrease in woodland. Under SSP126 scenario, expansion in farmland was contributed by reduction in construction land while woodland and grassland changed little, representing a sustainable future development pattern with a carbon stock increase of 102.71 × 10⁶ Mg at its highest rate. Conversely, under SSP585 scenario, rapid extension in farmland, construction land, and unused land were achieved at the expense of forests and grasslands, resulting in unsustainable development pattern with a carbon stock decrease of 204.64 × 10⁶ Mg. The increase in farmland along with moderate decrease in woodland and stability in construction land under SSP245 scenario resulted in an increased carbon stock by about 108.10 × 10⁶ Mg. Despite some nice achievements, future research endeavors should address certain limitations, including incorporating a wider range of SSP-RCP scenarios, examining the impacts of land use management, and integrating field investigations to enhance overall accuracy. This framework offers novel perspectives that are valuable for regional decision-making on low-carbon development towards achieving “carbon neutrality” objectives while providing insights for other regional studies.

Author Contributions

Conceptualization, F.G. and X.X.; methodology, X.X.; software, J.S.; resources, X.L. and L.Z.; data curation, Y.Z.; writing—original draft preparation, X.X.; writing—review and editing, F.G.; visualization, X.X.; supervision, J.L. All authors have read and agreed to the published version of the manuscript.

Funding

This research received no external funding.

Data Availability Statement

Not applicable.

Acknowledgments

We thank our colleagues for their insightful comments on an earlier version of this manuscript.

Conflicts of Interest

The authors declare that they have no known competing financial interests or personal relationships that could have appeared to influence the work reported in this paper.

References

  1. Zhu, G.F.; Qiu, D.D.; Zhang, Z.A.X.; Sang, L.Y.; Liu, Y.W.; Wang, L.; Zhao, K.L.; Ma, H.Y.; Xu, Y.; Wan, Q. Land-use changes lead to a decrease in carbon storage in arid region, China. Ecol. Indic. 2021, 127, 10. [Google Scholar] [CrossRef]
  2. Tarpeh, W.A.; Chen, X. Making wastewater obsolete: Selective separations to enable circular water treatment. Environ. Sci. Ecotechnol. 2021, 5, 8. [Google Scholar] [CrossRef] [PubMed]
  3. Ito, A.; Nishina, K.; Noda, H.M. Impacts of future climate change on the carbon budget of northern high-latitude terrestrial ecosystems: An analysis using ISI-MIP data. Polar Sci. 2016, 10, 346–355. [Google Scholar] [CrossRef]
  4. Schimel, D.S.; House, J.I.; Hibbard, K.A.; Bousquet, P.; Ciais, P.; Peylin, P.; Braswell, B.H.; Apps, M.J.; Baker, D.; Bondeau, A.; et al. Recent patterns and mechanisms of carbon exchange by terrestrial ecosystems. Nature 2001, 414, 169–172. [Google Scholar] [CrossRef] [PubMed]
  5. Houghton, R.A.; Hackler, J.L.; Lawrence, K.T. The U.S. Carbon budget: Contributions from land-Use change. Science 1999, 285, 574–578. [Google Scholar] [CrossRef] [PubMed]
  6. Chuai, X.W.; Huang, X.J.; Wang, W.J.; Zhang, M.; Lai, L.; Liao, Q.L. Spatial Variability of Soil Organic Carbon and Related Factors in Jiangsu Province, China. Pedosphere 2012, 22, 404–414. [Google Scholar] [CrossRef]
  7. Houghton, R.J. Magnitude, distribution and causes of terrestrial carbon sinks and some implications for policy. Clim. Policy 2002, 2, 71–88. [Google Scholar] [CrossRef]
  8. Arneth, A.; Sitch, S.; Pongratz, J.; Stocker, B.D.; Ciais, P.; Poulter, B.; Bayer, A.D.; Bondeau, A.; Calle, L.; Chini, L.P.; et al. Historical carbon dioxide emissions caused by land-use changes are possibly larger than assumed. Nat. Geosci. 2017, 10, 79–84. [Google Scholar] [CrossRef]
  9. Chen, Y.X.; Huang, B.Y.; Zeng, H. How does urbanization affect vegetation productivity in the coastal cities of eastern China? Sci. Total Environ. 2022, 811, 10. [Google Scholar] [CrossRef]
  10. Feddema, J.J.; Oleson, K.W.; Bonan, G.B.; Mearns, L.O.; Buja, L.E.; Meehl, G.A.; Washington, W.M. The importance of land-cover change in simulating future climates. Science 2005, 310, 1674–1678. [Google Scholar] [CrossRef]
  11. Mendoza-Ponce, A.; Corona-Nunez, R.; Kraxner, F.; Leduc, S.; Patrizio, P. Identifying effects of land use cover changes and climate change on terrestrial ecosystems and carbon stocks in Mexico. Glob. Environ. Change Hum. Policy Dimens. 2018, 53, 12–23. [Google Scholar] [CrossRef]
  12. Marland, G.; Rotty, R.; Treat, N.J. CO2 from fossil fuel burning: Global distribution of emissions. Tellus B 1985, 37, 243–258. [Google Scholar] [CrossRef]
  13. Le Page, Y.; West, T.O.; Link, R.; Patel, P. Downscaling land use and land cover from the Global Change Assessment Model for coupling with Earth system models. Geosci. Model Dev. 2016, 9, 3055–3069. [Google Scholar] [CrossRef]
  14. Thomson, A.M.; Kyle, G.P.; Zhang, X.; Bandaru, V.; West, T.O.; Wise, M.A.; Izaurralde, R.C.; Calvin, K.V. The contribution of future agricultural trends in the US Midwest to global climate change mitigation. Glob. Environ. Change Hum. Policy Dimens. 2014, 24, 143–154. [Google Scholar] [CrossRef]
  15. Calle, L.; Canadell, J.G.; Patra, P.; Ciais, P.; Ichii, K.; Tian, H.Q.; Kondo, M.; Piao, S.L.; Arneth, A.; Harper, A.B.; et al. Regional carbon fluxes from land use and land cover change in Asia, 1980–2009. Environ. Res. Lett. 2016, 11, 12. [Google Scholar] [CrossRef]
  16. Vasenev, V.I.; Stoorvogel, J.J.; Leemans, R.; Valentini, R.; Hajiaghayeva, R.A. Projection of urban expansion and related changes in soil carbon stocks in the Moscow Region. J. Clean. Prod. 2018, 170, 902–914. [Google Scholar] [CrossRef]
  17. Zhou, J.J.; Zhao, Y.R.; Huang, P.; Zhao, X.; Feng, W.; Li, Q.Q.; Xue, D.X.; Dou, J.; Shi, W.; Wei, W.; et al. Impacts of ecological restoration projects on the ecosystem carbon storage of inland river basin in arid area, China. Ecol. Indic. 2020, 118, 13. [Google Scholar] [CrossRef]
  18. Newbold, T.; Hudson, L.N.; Hill, S.L.L.; Contu, S.; Lysenko, I.; Senior, R.A.; Borger, L.; Bennett, D.J.; Choimes, A.; Collen, B.; et al. Global effects of land use on local terrestrial biodiversity. Nature 2015, 520, 45–50. [Google Scholar] [CrossRef]
  19. Feng, Y.J.; Chen, S.R.; Tong, X.H.; Lei, Z.K.; Gao, C.; Wang, J.F. Modeling changes in China’s 2000–2030 carbon stock caused by land use change. J. Clean. Prod. 2020, 252, 12. [Google Scholar] [CrossRef]
  20. Fan, Z. Simulation of land cover change in Beijing-Tianjin-Hebei region under different SSP-RCP scenarios. Acta Geogr. Sin. 2022, 77, 228–244. [Google Scholar]
  21. Kumar, S.; Radhakrishnan, N.; Mathew, S. Land use change modelling using a Markov model and remote sensing. Geomat. Nat. Hazards Risk 2014, 5, 145–156. [Google Scholar] [CrossRef]
  22. Pijanowski, B.C.; Brown, D.G.; Shellito, B.A.; Manik, G.A.J. Using neural networks and GIS to forecast land use changes: A land transformation model. Comput. Environ. Urban Syst. 2002, 26, 553–575. [Google Scholar] [CrossRef]
  23. Subedi, P.; Subedi, K.; Thapa, B.J. Application of a hybrid cellular automaton–Markov (CA-Markov) model in land-use change prediction: A case study of Saddle Creek Drainage Basin, Florida. Appl. Ecol. Environ. Sci. 2013, 1, 126–132. [Google Scholar] [CrossRef]
  24. Liu, X.P.; Liang, X.; Li, X.; Xu, X.C.; Ou, J.P.; Chen, Y.M.; Li, S.Y.; Wang, S.J.; Pei, F. A future land use simulation model (FLUS) for simulating multiple land use scenarios by coupling human and natural effects. Landsc. Urban Plan. 2017, 168, 94–116. [Google Scholar] [CrossRef]
  25. Kok, K.; Winograd, M.J. Modelling land-use change for Central America, with special reference to the impact of hurricane Mitch. Ecol. Model. 2002, 149, 53–69. [Google Scholar] [CrossRef]
  26. Hu, X.T.; Li, Z.H.; Cai, Y.M.; Wu, F. Urban construction land demand prediction and spatial pattern simulation under carbon peak and neutrality goals: A case study of Guangzhou, China. J. Geogr. Sci. 2022, 32, 2251–2270. [Google Scholar] [CrossRef]
  27. Karimi, H.; Jafarnezhad, J.; Khaledi, J.; Ahmadi, P. Monitoring and prediction of land use/land cover changes using CA-Markov model: A case study of Ravansar County in Iran. Arab. J. Geosci. 2018, 11, 9. [Google Scholar] [CrossRef]
  28. Verburg, P.; Overmars, K.J. Dynamic simulation of land-use change trajectories with the CLUE-s model. Model. Land-Use Change Prog. Appl. 2007, 90, 321–337. [Google Scholar]
  29. Liang, X.; Liu, X.P.; Li, X.; Chen, Y.M.; Tian, H.; Yao, Y. Delineating multi-scenario urban growth boundaries with a CA-based FLUS model and morphological method. Landsc. Urban Plan. 2018, 177, 47–63. [Google Scholar] [CrossRef]
  30. Sohl, T.L.; Claggett, P.R. Clarity versus complexity: Land-use modeling as a practical tool for decision-makers. J. Environ. Manag. 2013, 129, 235–243. [Google Scholar] [CrossRef]
  31. Liang, X.; Guan, Q.F.; Clarke, K.C.; Liu, S.S.; Wang, B.Y.; Yao, Y. Understanding the drivers of sustainable land expansion using a patch-generating land use simulation (PLUS) model: A case study in Wuhan, China. Comput. Environ. Urban Syst. 2021, 85, 14. [Google Scholar] [CrossRef]
  32. Gao, L.A.; Tao, F.; Liu, R.R.; Wang, Z.L.; Leng, H.J.; Zhou, T. Multi-scenario simulation and ecological risk analysis of land use based on the PLUS model: A case study of Nanjing. Sustain. Cities Soc. 2022, 85, 11. [Google Scholar] [CrossRef]
  33. Mahiny, A.S.; Clarke, K.C. Guiding SLEUTH land-use/land-cover change modeling using multicriteria evaluation: Towards dynamic sustainable land-use planning. Environ. Plan. B Plan. Des. 2012, 39, 925–944. [Google Scholar] [CrossRef]
  34. Tan, J.B.; Li, A.N.; Lei, G.B.; Xie, X.Y. A SD-MaxEnt-CA model for simulating the landscape dynamic of natural ecosystem by considering socio-economic and natural impacts. Ecol. Model. 2019, 410, 11. [Google Scholar] [CrossRef]
  35. Wu, M.; Ren, X.Y.; Che, Y.; Yang, K. A Coupled SD and CLUE-S Model for Exploring the Impact of Land Use Change on Ecosystem Service Value: A Case Study in Baoshan District, Shanghai, China. Environ. Manag. 2015, 56, 402–419. [Google Scholar] [CrossRef] [PubMed]
  36. Oliver, T.H.; Morecroft, M.D. Interactions between climate change and land use change on biodiversity: Attribution problems, risks, and opportunities. Wiley Interdiscip. Rev. Clim. Chang. 2014, 5, 317–335. [Google Scholar] [CrossRef]
  37. Bussi, G.; Janes, V.; Whitehead, P.G.; Dadson, S.J.; Holman, I.P. Dynamic response of land use and river nutrient concentration to long-term climatic changes. Sci. Total Environ. 2017, 590, 818–831. [Google Scholar] [CrossRef]
  38. Yang, H.; Huang, J.L.; Liu, D.F. Linking climate change and socioeconomic development to urban land use simulation: Analysis of their concurrent effects on carbon storage. Appl. Geogr. 2020, 115, 12. [Google Scholar] [CrossRef]
  39. Eyring, V.; Bony, S.; Meehl, G.A.; Senior, C.A.; Stevens, B.; Stouffer, R.J.; Taylor, K.E. Overview of the Coupled Model Intercomparison Project Phase 6 (CMIP6) experimental design and organization. Geosci. Model Dev. 2016, 9, 1937–1958. [Google Scholar] [CrossRef]
  40. Li, J.Y.; Chen, X.; Kurban, A.; Van de Voorde, T.; De Maeyer, P.; Zhang, C. Coupled SSPs-RCPs scenarios to project the future dynamic variations of water-soil-carbon-biodiversity services in Central Asia. Ecol. Indic. 2021, 129, 15. [Google Scholar] [CrossRef]
  41. Gao, Y. China’s response to climate change issues after Paris Climate Change Conference. Adv. Clim. Chang. Res. 2016, 7, 235–240. [Google Scholar] [CrossRef]
  42. Ge, Q.S.; Dai, J.H.; He, F.N.; Pan, Y.; Wang, M.M. Land use changes and their relations with carbon cycles over the past 300 a in China. Sci. China Ser. D Earth Sci. 2008, 51, 871–884. [Google Scholar] [CrossRef]
  43. Liao, W.L.; Liu, X.P.; Xu, X.Y.; Chen, G.Z.; Liang, X.; Zhang, H.H.; Li, X. Projections of land use changes under the plant functional type classification in different SSP-RCP scenarios in China. Sci. Bull. 2020, 65, 1935–1947. [Google Scholar] [CrossRef] [PubMed]
  44. Liu, H.; Liu, Y.X.; Wang, C.X.; Zhao, W.W.; Liu, S.L. Landscape pattern change simulations in Tibet based on the combination of the SSP-RCP scenarios. J. Environ. Manag. 2021, 292, 15. [Google Scholar] [CrossRef] [PubMed]
  45. Fang, J.Y.; Yu, G.R.; Liu, L.L.; Hu, S.J.; Chapin, F.S. Climate change, human impacts, and carbon sequestration in China. Proc. Natl. Acad. Sci. USA 2018, 115, 4015–4020. [Google Scholar] [CrossRef] [PubMed]
  46. Dong, N.; You, L.; Cai, W.J.; Li, G.; Lin, H. Land use projections in China under global socioeconomic and emission scenarios: Utilizing a scenario-based land-use change assessment framework. Glob. Environ. Change Hum. Policy Dimens. 2018, 50, 164–177. [Google Scholar] [CrossRef]
  47. Yun, X.B.; Tang, Q.H.; Li, J.B.; Lu, H.; Zhang, L.; Chen, D.L. Can reservoir regulation mitigate future climate change induced hydrological extremes in the Lancang-Mekong River Basin? Sci. Total Environ. 2021, 785, 9. [Google Scholar] [CrossRef]
  48. Wang, Z.Y.; Li, X.; Mao, Y.T.; Li, L.; Wang, X.R.; Lin, Q. Dynamic simulation of land use change and assessment of carbon storage based on climate change scenarios at the city level: A case study of Bortala, China. Ecol. Indic. 2022, 134, 11. [Google Scholar] [CrossRef]
  49. Liu, J.L.; Peng, K.L.; Zuo, C.C.; Li, Q. Spatiotemporal variation of land-use carbon emissions and its implications for low carbon and ecological civilization strategies: Evidence from Xiamen-Zhangzhou-Quanzhou metropolitan circle, China. Sustain. Cities Soc. 2022, 86, 13. [Google Scholar] [CrossRef]
  50. Yen, G.; Li, X. A constrained CA model for the simulation and planning of sustainable urban forms by using GIS. Environ. Plan. B Plan. Des. 2001, 28, 733–753. [Google Scholar]
  51. Sante, I.; Garcia, A.M.; Miranda, D.; Crecente, R. Cellular automata models for the simulation of real-world urban processes: A review and analysis. Landsc. Urban Plan. 2010, 96, 108–122. [Google Scholar] [CrossRef]
  52. Fu, X.; Wang, X.H.; Yang, Y.J. Deriving suitability factors for CA-Markov land use simulation model based on local historical data. J. Environ. Manag. 2018, 206, 10–19. [Google Scholar] [CrossRef] [PubMed]
  53. Zhang, Z.; Li, J.M. Spatial suitability and multi-scenarios for land use: Simulation and policy insights from the production-living-ecological perspective. Land Use Pol. 2022, 119, 13. [Google Scholar] [CrossRef]
  54. Jiang, X.; Duan, H.; Liao, J.; Song, X.; Xue, X. Land use in the Gan-Lin-Gao region of middle reaches of Heihe River Basin based on a PLUS-SD coupling model. Arid Zone Res. 2022, 39, 1246–1258. [Google Scholar]
  55. Yu, Y.; Guo, B.; Wang, C.L.; Zang, W.Q.; Huang, X.Z.; Wu, Z.W.; Xu, M.; Zhou, K.D.; Li, J.; Yang, Y. Carbon storage simulation and analysis in Beijing-Tianjin-Hebei region based on CA-plus model under dual-carbon background. Geomat. Nat. Hazards Risk 2023, 14, 24. [Google Scholar] [CrossRef]
  56. Wang, X.; Che, L.; Zhou, L.; Xu, J.G. Spatio-temporal Dynamic Simulation of Land use and Ecological Risk in the Yangtze River Delta Urban Agglomeration, China. Chin. Geogr. Sci. 2021, 31, 829–847. [Google Scholar] [CrossRef]
  57. Wang, Y.H.; Dai, E.F.; Yin, L.; Ma, L. Land use/land cover change and the effects on ecosystem services in the Hengduan Mountain region, China. Ecosyst. Serv. 2018, 34, 55–67. [Google Scholar] [CrossRef]
  58. Wu, M.W.; Wu, J.Q.; Zang, C.F. A comprehensive evaluation of the eco-carrying capacity and green economy in the Guangdong-Hong Kong-Macao Greater Bay Area, China. J. Clean. Prod. 2021, 281, 16. [Google Scholar] [CrossRef]
  59. Rees, R.M.; Bingham, I.J.; Baddeley, J.A.; Watson, C.A. The role of plants and land management in sequestering soil carbon in temperate arable and grassland ecosystems. Geoderma 2005, 128, 130–154. [Google Scholar] [CrossRef]
  60. Wang, C.L.; Jiang, Q.O.; Shao, Y.Q.; Sun, S.Y.; Xiao, L.; Guo, J.B. Ecological environment assessment based on land use simulation: A case study in the Heihe River Basin. Sci. Total Environ. 2019, 697, 14. [Google Scholar] [CrossRef]
  61. Li, Y.R.; Li, Y.; Fan, P.C.; Long, H.L. Impacts of land consolidation on rural human-environment system in typical watershed of the Loess Plateau and implications for rural development policy. Land Use Pol. 2019, 86, 339–350. [Google Scholar]
  62. Liu, G.; Zhang, F. Land Zoning Management to Achieve Carbon Neutrality: A Case Study of the Beijing–Tianjin–Hebei Urban Agglomeration, China. Land 2022, 11, 551. [Google Scholar] [CrossRef]
  63. Li, S.Y.; Miao, L.J.; Jiang, Z.H.; Wang, G.J.; Gnyawali, K.R.; Zhang, J.; Zhang, H.; Fang, K.; He, Y.; Li, C. Projected drought conditions in Northwest China with CMIP6 models under combined SSPs and RCPs for 2015–2099. Adv. Clim. Chang. Res. 2020, 11, 210–217. [Google Scholar] [CrossRef]
  64. Flannigan, M.; Stocks, B.; Turetsky, M.; Wotton, M. Impacts of climate change on fire activity and fire management in the circumboreal forest. Glob. Chang. Biol. 2009, 15, 549–560. [Google Scholar] [CrossRef]
  65. Bai, Y.F.; Cotrufo, M.F. Grassland soil carbon sequestration: Current understanding, challenges, and solutions. Science 2022, 377, 603–608. [Google Scholar] [CrossRef] [PubMed]
  66. Chaplin-Kramer, R.; Sharp, R.P.; Mandle, L.; Sim, S.; Johnson, J.; Butnar, I.; Canals, L.M.I.; Eichelberger, B.A.; Ramler, I.; Mueller, C.; et al. Spatial patterns of agricultural expansion determine impacts on biodiversity and carbon storage. Proc. Natl. Acad. Sci. USA 2015, 112, 7402–7407. [Google Scholar] [CrossRef] [PubMed]
  67. Zhang, Y.; Shi, X.; Tang, Q. Carbon storage assessment in the upper reaches of the Fenhe River under different land use scenarios. Acta Ecol. Sin. 2021, 41, 360–373. [Google Scholar]
  68. Yu, P.J.; Li, Q.; Jia, H.T.; Li, G.D.; Zheng, W.; Shen, X.J.; Diabate, B.; Zhou, D.W. Effect of Cultivation on Dynamics of Organic and Inorganic Carbon Stocks in Songnen Plain. Agron. J. 2014, 106, 1574–1582. [Google Scholar] [CrossRef]
  69. Cihacek, L.; Ulmer, M. Effects of tillage on inorganic carbon storage in soils of the northern Great Plains of the US. In Agricultural Practices and Policies for Carbon Sequestration in Soil; CRC Press: Boca Raton, FL, USA, 2016; pp. 87–94. [Google Scholar]
Figure 1. Location of the study area.
Land 12 01665 g001
Figure 2. The research framework.
Land 12 01665 g002
Figure 3. The SD model’s causal relationship diagram of land use demand in Heilongjiang.
Land 12 01665 g003
Figure 4. SD model prediction results under different SSP-RCP scenarios (hm2 × 104).
Land 12 01665 g004
Figure 5. Driving factors affecting LUCC.
Land 12 01665 g005
Figure 6. Simulation of LUCC under different scenarios.
Land 12 01665 g006
Figure 7. Simulation of carbon stock under different scenarios.
Land 12 01665 g007
Figure 8. Land use transfer chord map of multi-scenario from 2030 to 2050.
Land 12 01665 g008
Figure 9. Effects of land-use change on carbon stock under different scenarios.
Land 12 01665 g009
Table 1. Data description.
CategoryDataSourceYearType
Land use/cover dataLand use/coverResource and Environmental Science Data Centre of the Chinese Academy of Sciences (https://www.resdc.cn/, accessed on 6 November 2022)2010, 2020raster (30 m)
SD model dataGross Domestic Product«Heilongjiang Statistical Yearbook» (http://tjj.hlj.gov.cn/, accessed on 6 November 2022)2000–2020numeric
Fixed Assets Investment
Agricultural/Forestry/Livestock/Fishery production value
Total/Rural/Urban population
Urbanization rate
PLUS driving factor dataAnnual average temperatureHeilongjiang Provincial Meteorological Bureau
(http://hlj.cma.gov.cn/, accessed on 8 November 2022)
2000–2020raster (30 m)
Annual average precipitation
GDPResource and Environmental Science Data Centre of the Chinese Academy of Sciences (https://www.resdc.cn/, accessed on 6 November 2022)2015raster (1 km)
Population density
Soil typeHarmonized World Soil Database (HWSD)v 1.2 (http://westdc.westgis.ac.cn/, accessed on 6 November 2022)2008raster (1 km)
DEMGeospatial Data Cloud platform
(http://www.gscloud.cn/, accessed on 8 November 2022)
2020raster (30 m)
Slope
Distance to riverNational Geomatics Center of China
(http://www.ngcc.cn/ngcc/, accessed on 10 November 2022)
2015Vector
Distance to roadOpen Street Map
(https://www.openstreetmap.org/, accessed on 10 November 2022)
Table 2. Parameter setting under scenarios from 2020–2050.
Parameter Type2020–20302030–20402040–2050
SSP126SSP245SSP585SSP126SSP245SSP585SSP126SSP245SSP585
GGR (%)6.400%5.000%7.500%3.900%2.500%4.800%1.900%1.400%2.500%
PGR (%)2.770%4.420%3.560%−0.640%1.950%0.450%−2.550%1.240%−1.030%
PC (mm)2.8003.2004.0002.8003.2004.0002.8003.2004.000
TC (°C)0.0060.0260.0590.0060.0260.0590.0060.0260.059
Note: GGR: average annual GDP growth rate; PGR: average annual population growth rate; TC: annual average; temperature change; PC: annual precipitation change.
Table 3. Parameter setting of domain weights.
Land Use TypeFarmlandWoodlandGrasslandWaterConstruction LandUnused Land
Weight0.0680.0120.0220.4810.3890.028
Table 4. Carbon density of different land use type in Heilongjiang Province (t·hm−2).
Land Use TypeC_AboveC_BelowC_SoilC_Dead
Farmland10.1026.80147.000.00
Woodland11.4631.32173.902.25
Grassland7.9651.0074.602.84
Water8.722.2123.010.00
Construction land8.754.3927.781.16
Unused land10.030.0044.790.00
Table 5. SD model simulation accuracy test.
Land Use TypeActual Value in 2020
(hm2 × 104)
Predicted Value in 2020
(hm2 × 104)
Simulation Error
(%)
Farmland1747.911778.57−1.75
Woodland1918.511728.269.92
Grassland220.05231.83−5.35
Water102.18125.77−23.09
Construction land106.53113.65−6.68
Unused land429.45445.74−3.79
Table 6. PLUS model simulation accuracy test.
Land Use TypeActual Value in 2020
(hm2 × 104)
Predicted Value in 2020
(hm2 × 104)
Simulation Error
(%)
Farmland1747.911725.791.27
Woodland1918.511907.560.57
Grassland220.05224.65−2.09
Water102.18116.18−13.71
Construction land106.53107.26−0.69
Unused land429.45421.161.93
Disclaimer/Publisher’s Note: The statements, opinions and data contained in all publications are solely those of the individual author(s) and contributor(s) and not of MDPI and/or the editor(s). MDPI and/or the editor(s) disclaim responsibility for any injury to people or property resulting from any ideas, methods, instructions or products referred to in the content.

