Article

Research on Spatial–Temporal Characteristics and Driving Factors of Urban Development Intensity for Pearl River Delta Region Based on Geodetector

1
School of Information Engineering, China University of Geosciences, Beijing 100083, China
2
Department for Earth System Science, Tsinghua University, Beijing 100084, China
3
China Land Surveying and Planning Institute, Beijing 100035, China
*
Author to whom correspondence should be addressed.
Land 2023, 12(9), 1673; https://doi.org/10.3390/land12091673
Submission received: 28 July 2023 / Revised: 21 August 2023 / Accepted: 25 August 2023 / Published: 27 August 2023

Abstract

:
The Pearl River Delta (PRD) is one of the most dynamic economic regions in the Asia-Pacific region. At present, it still faces many problems, such as the over-exploitation of urban land and unbalanced development. Through the study of the spatial–temporal characteristics of the development intensity of the PRD region and its driving factors, the key points and difficulties of urban development can be intuitively found. In previous studies, geodetector was widely used to determine the impact of driving factors. This paper uses several different research methods, including the Moran index, the semi-variability index, hot and cold spots, etc., based on the land use data of the PRD region in 1990, 2000, 2010, and 2020 to analyze the spatial–temporal characteristics of the development intensity. Combined with the socio-economic data of the statistical yearbook, factor detection and interaction detection of the 10 driving factors of development intensity are carried out based on geodetector, and reasonable optimization suggestions are put forward for the current situation of the region. The main conclusions are as follows: (1) The overall development intensity of the PRD region shows an upward trend, showing a “core periphery” spatial pattern of high center and low periphery centered around the Pearl River estuary. (2) The spatial distribution of cold and hot spots shows agglomeration, mainly in the form of high aggregation and low aggregation. (3) The driving factors for the development intensity for the PRD region in the past 30 years mainly include population agglomeration level, industrial structure level, economic strength level, terrain slope, etc. Among them, any two factors have a stronger interaction than a single factor, and all are enhanced by two factors. The dominant factors of interaction in different periods are different.

1. Introduction

Urbanization in a broad sense is a process of socio-economic change, including an increase in the non-agricultural population, the continuous expansion of the urban population, the continuous expansion of urban land to the suburbs, the continuous increase in the number of cities, and the process of urban social, economic, and technological transformation entering rural areas [1]. China is currently in a high-speed period of urbanization, which has exposed problems such as resource shortage and population surges [2]. How to allocate land resources reasonably and improve land use efficiency are problems that are increasingly attracting widespread attention from all sectors of society. Driven by the development goals of today’s society, economy, industry, and policies, the scale of urban construction land expansion continues to expand, leading to an increase in land development intensity. Understanding and mastering the process and driving factors of construction land expansion are crucial for the effective planning of urban growth and management to mitigate related adverse impacts.
At present, the rectification of urban construction land in China is still in its initial stage, and the various laws, regulations, and institutional mechanisms related to urban construction land are not yet perfect, lacking corresponding experienced guidance. Currently, domestic research methods mainly adopt empirical statistical models, such as principal component analysis [3,4], correlation analysis [5,6], econometric models [7], data envelopment analysis (DEA) models [8], Spatial Error Model (SEM), Spatial Late Model (SLM) [9], coupled coordination models [10], etc., and their research area is mainly concentrated in the eastern coastal areas of China [11,12,13,14,15]. On the basis of statistical analysis, some domestic and foreign scholars have added the multidimensional analysis of urban expansion, such as considering the impact of current policy systems on it [16,17], or focusing on spatial distribution characteristics, such as changes in the “core peripheral” area [17,18] and the migration of the center of gravity [19,20]. In addition, the current mainstream method for exploring the driving factors of construction land expansion is the geodetector model proposed by Wang Jinfeng et al. [21], with research hot spots focused on areas such as the Yangtze River Delta urban agglomeration [19,22], Beijing [23], and the Northwest urban agglomeration [24]. Some scholars have also expanded their research areas to the whole country [25] or added spatiotemporal characteristic factors [26].
Domestic scholars’ research on urban construction land mainly includes resource carrying capacity, allocation, and the transformation and expansion of construction land, while research and analysis on its expansion, development intensity, and space–time pattern are still in a relatively simple stage [27,28,29,30,31]. The research of foreign scholars mainly focuses on the construction and control of the indicator system for the development intensity of construction land, with results focused on the growth and expansion of urban construction land [32,33,34,35,36,37,38,39]. Based on the above, for the expansion of construction land, the focus should be on analyzing the driving factors of its expansion, development intensity, and spatiotemporal pattern, combined with the indicator system of construction land development intensity. This will be feasible and effective for analyzing the urbanization process in China. This study will focus on analyzing and exploring the development intensity of construction land in the PRD region, revealing and analyzing the regular pattern of urban development intensity of the region and providing theoretical references for land resource allocation, industrial structure adjustment, and regional sustainable development in the region; meanwhile, by analyzing the driving factors of development intensity and their inter-relationships, a new perspective and methodological approach are provided for evaluating the expansion of construction land in the PRD region.
This research takes the nine core cities of the PRD urban agglomeration as the research object, conducts a comprehensive calculation of the development intensity of the construction land of the PRD urban agglomeration, and analyzes and studies the spatial and temporal characteristics and driving factors of the urban development intensity of the region in the past 30 years based on geographical detectors, spatial autocorrelation analysis, and other means. Firstly, based on domestic and international research and the theoretical analysis of geographic detectors, ArcGIS is used to process geographic and statistical data. Secondly, the processed data are analyzed for land use, and the overall characteristics and land change analyses are conducted through the two dimensions of time and space to summarize the laws of land use and its changes and development. Third, the development intensity of construction land is calculated and the spatial and temporal pattern characteristics of the calculation results are analyzed, in addition to analyzing the longitudinal change and variation coefficient from the perspective of time and analyzing the Moran’s I and cold and hot spot characteristics from the perspective of space. Fourthly, using geographic detectors, factor detection and interactive detection are conducted on the ten driving factors of development intensity adopted, and the main factors affecting the development intensity of construction land are analyzed. Finally, the above analysis results are summarized and reasonable optimization suggestions are explored for the development of construction land in the PRD region based on its current development status.

2. Materials and Methods

2.1. Study Area

The PRD region is located in the south-central part of Guangdong Province, China at the lower reaches of the Pearl River near the South China Sea, 112°45′–113°50′ east longitude, 21°31′–23°10′ north latitude. It is a composite delta formed by the sediment brought by the Xijiang River, Beijiang River, and Dongjiang River and their tributaries, the Tanjiang River, Suijiang River, and Zengjiang River, in the estuary of the Pearl River. The PRD region is one of the most dynamic economic zones in the Asia-Pacific region. It is also one of the three regions with the strongest comprehensive strength in China [40], and its development plays a leading role. This paper selects the PRD Economic Zone proposed by the Guangdong Provincial Party Committee at the third plenary session of the seventh session as the research area, including 9 cities: Guangzhou, Shenzhen, Dongguan, Zhuhai, Foshan, Zhongshan, Huizhou, Jiangmen, and Zhaoqing (Figure 1).

2.2. Data

Digital Elevation Model (DEM) raster data were gained from Advanced Spaceborne Thermal Emission and the Reflection Radiometer Global Digital Elevation Model; land use raster data were gained from The China Multi-period Land Use Remote Sensing Monitoring Dataset (CNLUCC), which is a national-scale multi-period land use/land cover thematic database constructed through manual visual interpretation using Landsat remote sensing images from the United States as the main information source. The main data are shown in Table 1. The data processing process is roughly divided into the following four steps:
(1)
Import spatial data into ArcMap for unified geographic projection.
(2)
Convert the vector data into raster data to unify the data format.
(3)
Using the Administrative division data of the PRD region, the corresponding data of the PRD region are cut out from the DEM data and land use data of Guangdong Province and are divided according to different cities.
(4)
Preliminary calculations are performed on statistical yearbook data and census data to obtain different economic factor indicators.

2.3. Methods

2.3.1. Development Intensity

According to the land use data, the urban construction land area (which contains the constructed area and the area occupied by urban uses) and the total urban floor area of each city in the PRD region in the corresponding year were obtained, which were substituted into the following formula:
E = s 1 s 2 × 100 %
where E represents the development intensity of the city, S 1 represents the construction land area (due to the availability of data, the land use data we were able to obtain include the area of urban built-up areas and the area used for cities (other types include forest land, grassland, water bodies, etc.)), and S 2 represents the total land area [7,19,24].

2.3.2. Differences in Regional Development Intensity

Using the coefficient of variation to measure the regional differences in the development intensity of urban construction land in the PRD region, the formula is as follows:
C v = 1 x ¯ i = 1 n x i x ¯ 2 n 1 × 100 %
where C v is the coefficient of variation, X i is the intensity of construction land development in each city, x ¯ is the average development intensity of construction land in the region, and n represents the number of cities.

2.3.3. Spatial Autocorrelation Analysis

Spatial autocorrelation analysis is widely used in land use, especially utilizing the global spatial autocorrelation index and local spatial autocorrelation index. Moran’s I is used to measure global spatial autocorrelation, and the formula is as follows:
I = n Σ i n Σ j n w i J ˙ y i y ¯ y j y ¯ Σ i n Σ j n w i j Σ i n y i y ¯ 2
where y i represents the value of point i , y j represents the value of point j , y ¯ is the average of all values, w i j is the spatial weight, and n is the total number of units. The range of Moran’s I is [–1, 1], which means that when Moran’s I is less than 0, it is negatively correlated, when Moran’s I is equal to 0, it is an independent random distribution, and when Moran’s I is greater than 0, it is positively correlated.
The Getis index is used to measure local spatial autocorrelation and identify high-value clusters and low-value clusters at different spatial locations, and its formula is as follows:
G = z i i w i j z j
where z i is the standard quantity for the mean, z j is the standard quantity for the standard deviation, and w i j is the spatial weight.
The Getis index was standardized, which was then used for hot spot analysis:
z G = G E G var G
where E G represents the mathematical expectation of G and var G represents the variance of G . The G-statistic returned for each feature in the dataset is the z-score. For positive z-scores that are statistically significant, the higher the z-score, the tighter the high values (hot spots) are clustered. For statistically significant negative z-scores, the lower the z-score, the tighter the low values (cold spots) are clustered.

2.3.4. Geodetector

Geodetector, proposed by Wang Jinfeng et al. [21], is a set of statistical methods used to detect spatial variability and reveal the driving force behind it. Its core idea is based on the assumption that if an independent variable has an important influence on a dependent variable, then the spatial distribution of the independent variable and the dependent variable should be similar. Geodetector can not only test the spatial differentiation of a single variable, but also test the consistency of the spatial distribution of two variables to detect the possible causal relationship between the two variables. As a spatial statistical method, geodetector can detect both numerical data and qualitative data. It is widely used to test the relationship between geographical phenomena and their underlying drivers. It has been applied to various geographically related research topics, such as ecological and landscape connectivity, environmental risks, and built-up land expansion.
Geodetector includes four detectors: factor detector, interaction detector, risk detector, and ecological detector. This paper mainly uses the factor detector and interaction detector of geodetector to explore the influencing factors and their interaction with the spatial pattern evolution of urban construction land development intensity in the PRD.
Factor detector
The principle of the factor detector is if the spatial distribution of variable Y and variable X tends to be consistent, then they are related to each other. The power of the q value measures the relationship between Y and X, and its formula is
q = 1 1 N σ 2 h = 1 L N h σ h 2
where N is the number of samples, L is the number of sub-regions ( h = 1, 2, …, L ), σ 2 is the global variance, σ h 2 is the sub-region variance, and q is the dominant factor of the development intensity of urban construction land. Its range is [0, 1]. If q = 0, it means that Y is not uniformly stratified in space, that is, there is no correlation between Y and X. The larger the value of q , the greater its impact on the development intensity of urban construction land. If q = 1, then Y has perfect spatial stratification heterogeneity, that is, Y is completely determined by X. The q value indicates the degree of the spatially stratified heterogeneity of Y, that is, how much of Y can be explained by X.
Interaction detector
Another unique advantage of geodetector is the detection of two-factor interactions on the dependent variable. The general identification method of interactions is to add the product term of two factors in the regression model and test its statistical significance. Two-factor superposition includes both multiplicative relationships and other relationships, and it can be detected by geodetector as long as there is a relationship. The interaction detector in geodetector is used to identify the interaction between different risk factors, X s, that is, to assess whether the factors X 1 and X 2 will increase or decrease the explanatory power of the dependent variable Y when they work together, or whether these factors have a positive effect on Y and whether these effects are independent of each other. The idea is to take the intersection of the plots corresponding to X 1 and X 2 and look at the q value of the single case and the intersection case, respectively, which can be divided into the following situations outlined below (Table 2).

2.3.5. Development Intensity Potential Drivers

Based on the current state of land use [41,42], the potential driving factors of land development intensity are mainly divided into two categories, natural environment factors and socio-economic factors, among which socio-economic factors include economic development, population level, industrial structure, and other categories.
According to the above-mentioned PRD, it is a composite delta formed by the accumulation of sediment brought by several major water systems in the estuary of the PRD. Altitude ( X 1 ) and slope ( X 2 ) are used as evaluation indicators of natural environment characteristics; gross regional product value ( X 3 ) and Gross Domestic Product (GDP) ( X 4 ) are used as evaluation indicators of economic development level; population density ( X 5 ) and urban population ratio ( X 6 ) are used as the evaluation indices of population agglomeration level; the proportion of secondary and tertiary industries ( X 7 ) is used as the evaluation index of industrial structure level; per capita disposable income ( X 8 ) is used as the evaluation index of economic strength level; average social investment in fixed assets ( X 9 ) is used as the evaluation index of land investment intensity; and per capita construction land area ( X 10 ) is used as the evaluation index of land use degree (Table 3). With SPASS 19.0 software, the Kaiser–Meyer–Olkin (KMO) and Bartlett tests were carried out on the 10 factors in 1990, 2000, 2010, and 2020, and the calculated KMO values were all greater than the threshold value of 0.5, indicating that there was a correlation between the variables. And the results of Bartlett’s sphericity test were all significant at the 0.01 level, indicating that the variables can be subjected to a factor analysis and interaction analysis.
The elevation refers to the distance from a certain point along a vertical line to the base plane, which is equivalent to the altitude. The slope represents the degree to which the surface unit is steep and gentle. The Gross Domestic Product (GDP) of a region refers to the final result of the production activities of all resident units in a certain period of time, and its value is equal to the sum of the added values of various industries. The GDP per capita is calculated by comparing the regional GDP realized in a regional accounting period (usually one year) with the permanent population (or registered residence population) of the country. Population density refers to the number of people per unit of land area (km2). The proportion of the urban population refers to the urbanization rate, which generally adopts demographic indicators, namely the proportion of the urban population to the total population (including agricultural and non-agricultural); The proportion of secondary and tertiary industries refers to the proportion of the output value of the secondary industry (processing and manufacturing industry) and the tertiary industry (modern service industry or commerce) in a certain region to the regional Gross Domestic Product. The per capita disposable income of urban residents refers to the portion of income that reflects the total cash income of households that can be used to arrange their daily lives. Social fixed asset investment is the workload of building and purchasing fixed assets in the form of currency, while average social investment in fixed assets is the social fixed asset investment divided by the area of the region. Per capita construction land area refers to the area (km2) of urban construction land within a city (town) divided by the number of permanent residents within that area.

3. Results

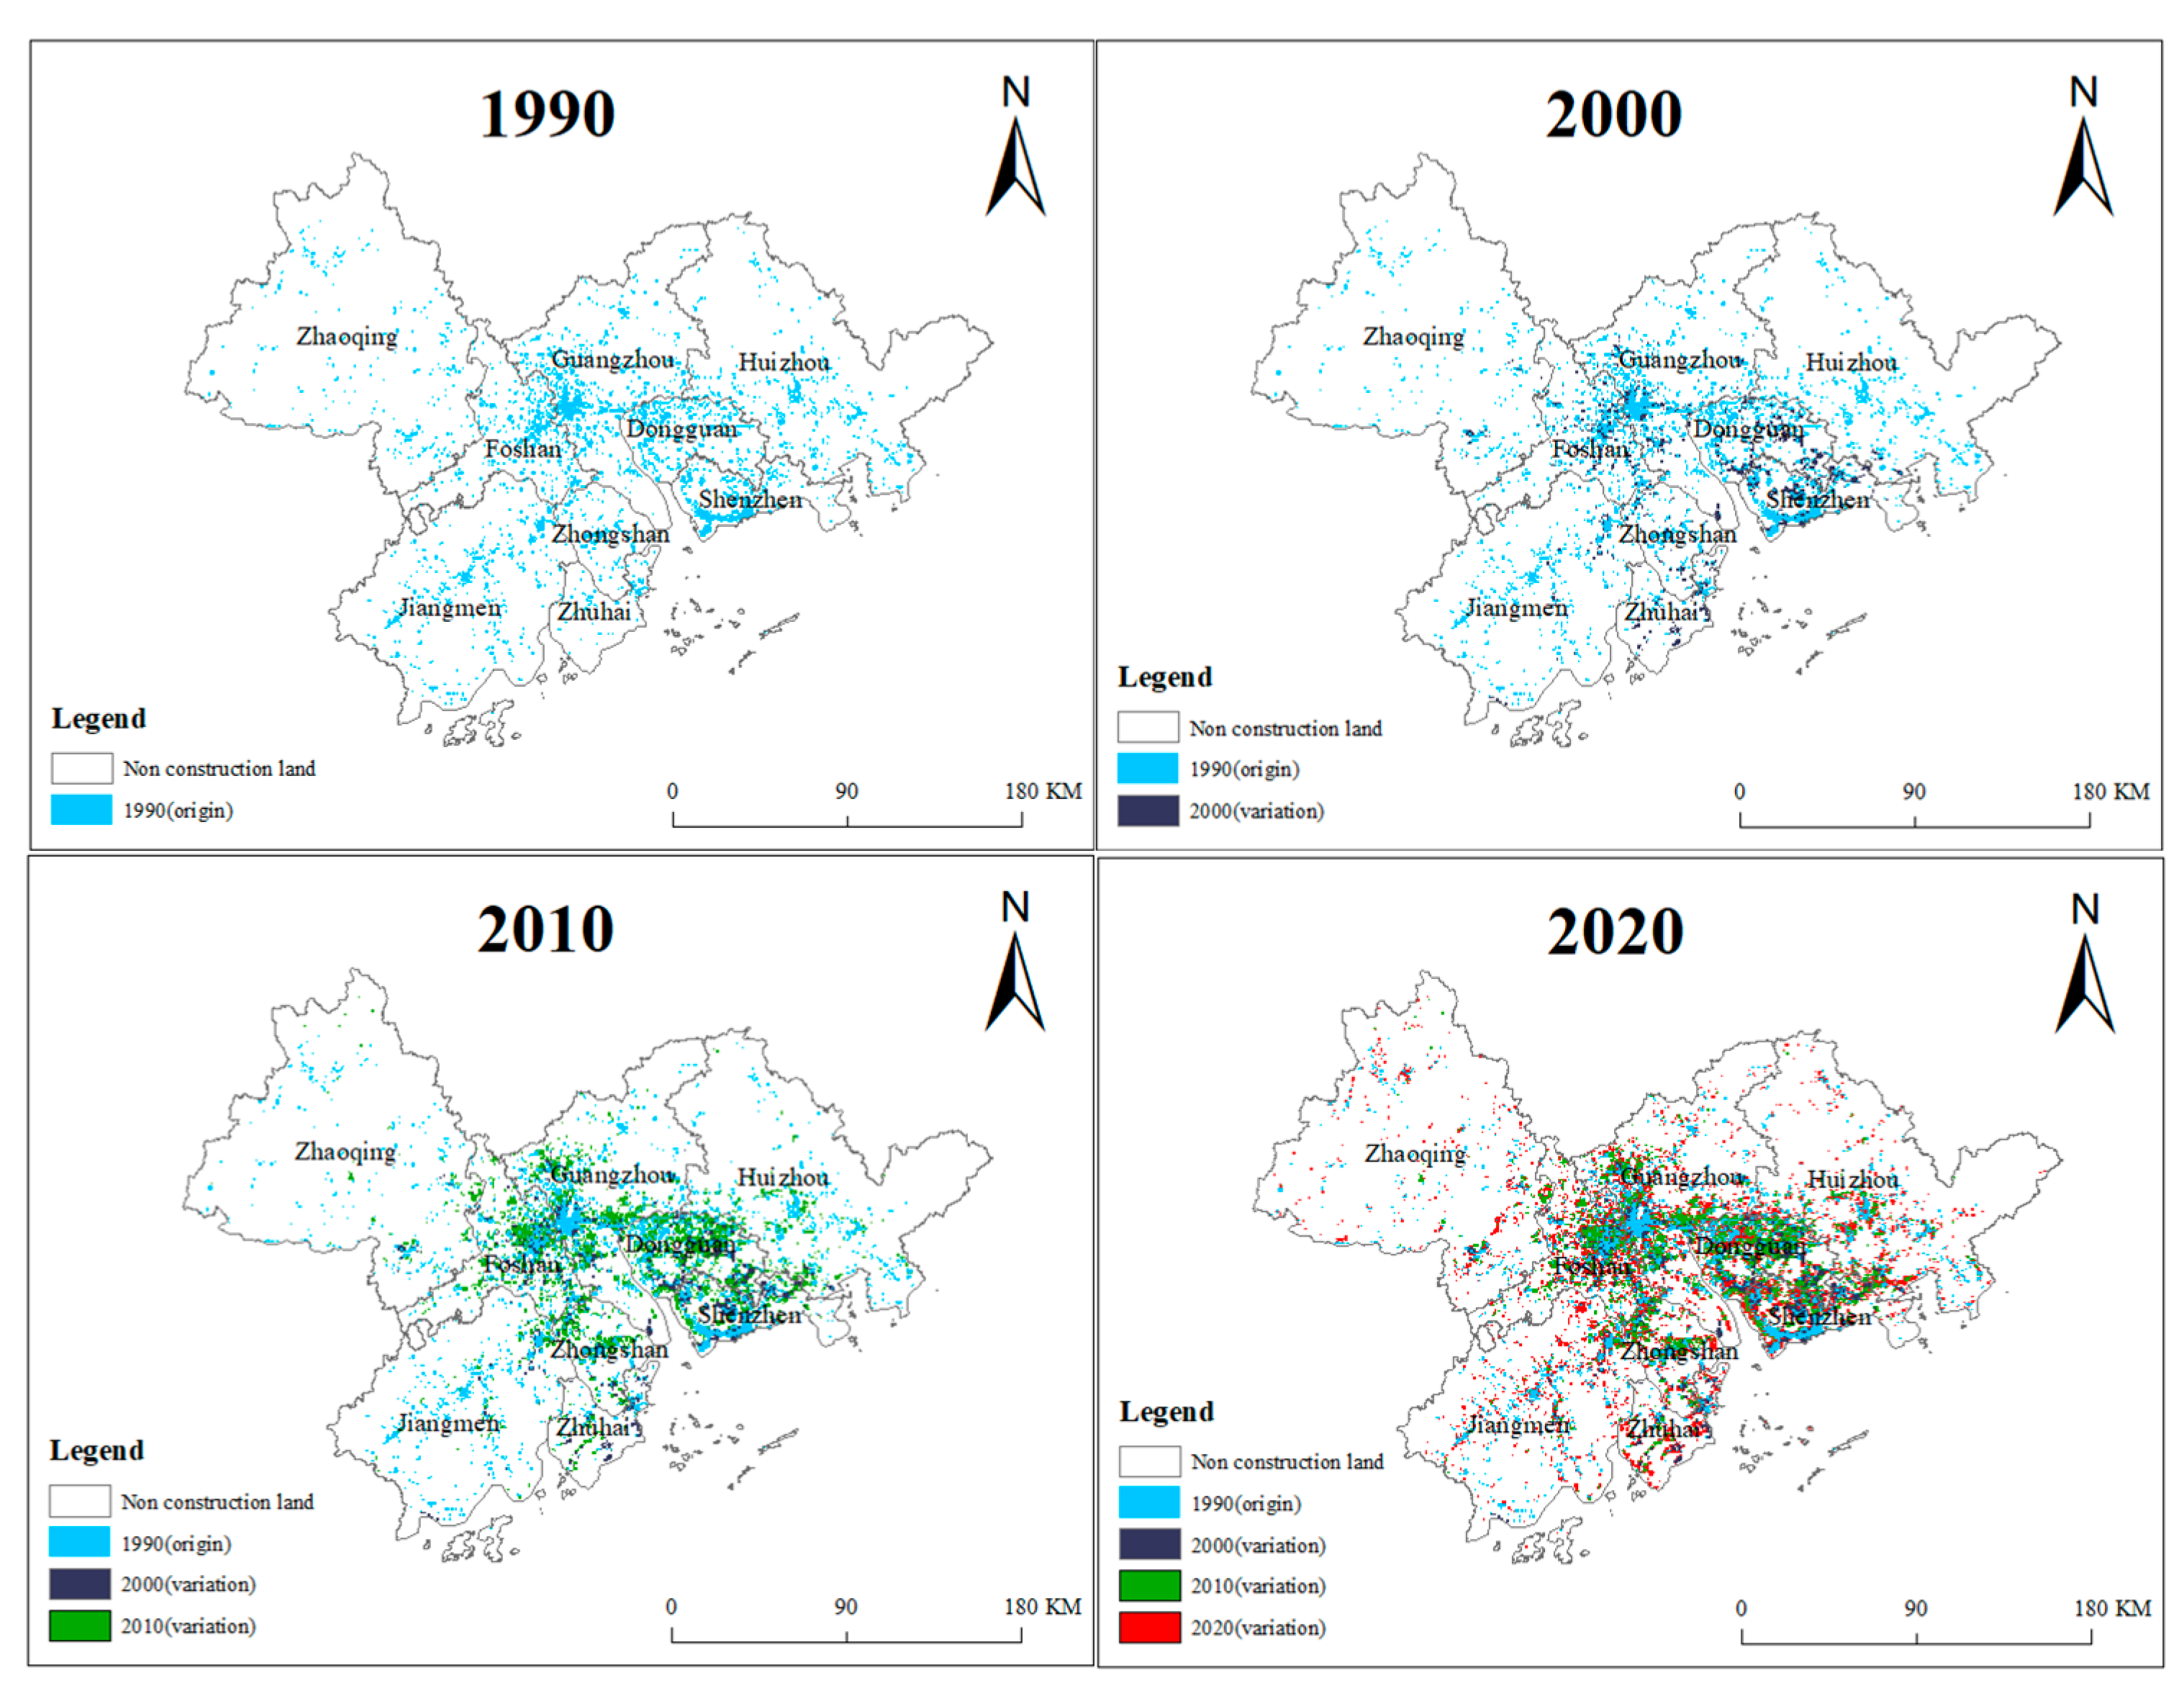
3.1. Land Use Changes

According to Table 4, it can be seen that during the 30 years from 1990 to 2020, the area of construction land increased significantly, while other types of land declined, of which the area of cultivated land and unused land decreased significantly compared to before. Specifically, from 1990 to 2000, cultivated land, woodland, and grassland decreased slightly, and the water area increased by 383 km2, mainly due to the expansion of wetland areas in the PRD located in the Pearl River estuary and its western region. The urban construction land around it also decreased. From 2000 to 2010, due to human activities such as soil erosion, extensive embankment construction, and coastal reclamation, the water area began to decrease, and the construction land instead increased significantly, accounting for an increase of 4.83%. Accelerated population density increased sharply and the area of arable land, woodland, and grassland was also greatly reduced and developed into construction land. From 2010 to 2020, the proportion of construction land to arable land decreased, while an increased pattern was shown in grassland area, and the area of unused land was greatly reduced. Overall, the most significant change in the past 30 years has been in construction land, while the water area increased first and then decreased. In particular, the wetlands in the west of the Pearl River estuary have almost all been converted into construction land and cultivated land, indicating that in the process of construction land development attention should be paid to the protection of wetlands.
From Figure 2, it can be seen that the initial construction land in 1990 was relatively small, and mainly concentrated in areas such as Shenzhen, Guangzhou, Dongguan, and Foshan. The growth rate of construction land from 1990 to 2000 was not significant, and it is still mainly distributed in the four cities mentioned above. The growth rate was the highest from 2000 to 2010, and a trend of diffusion began to appear in surrounding cities such as Zhongshan and Zhuhai. From 2010 to 2020, there was a slight increase in the central urban agglomeration, and the expansion of construction land was mainly concentrated in surrounding cities such as Zhaoqing, Huizhou, and Jiangmen.

3.2. Changes in the Spatial Pattern of Development Intensity

Calculations from Table 4 show that the total average development intensities of urban construction land in the PRD region in 1990, 2000, 2010, and 2020 were 5.80%, 7.83%, 12.66%, and 14.93%, respectively. Combined with the existing data characteristics, the ArcGIS natural discontinuity classification method, and international standards, the development intensity of major cities is divided into five levels: lower value (<5%), low value (5–10%), median value (10–20%), higher values (20–30%), and high values (>30%). The development intensity of some of the years did not reach the higher value and the high value, which is a unified classification standard and will not be subdivided. According to international practice, a region’s land development intensity reaching 30% is already a warning line [7,43]. If the intensity exceeds this level, people’s living environment will be affected. In this study, 30% is used as the critical value of the high value and the higher value, which is convenient for displaying the development intensity. Cities that exceed this threshold are identified, and attention must be paid to these cities.
According to Figure 3, the overall development intensity of the PRD region has shown an upward trend in the past 30 years, and the trend is particularly significant in the major cities in the center. In 1990, the development intensity of construction land in the PRD region was mainly distributed between 3% and 17%, among which cities with lower values accounted for the most (44%), followed by low and medium values, and the overall development intensity was at a relatively low level. In 2000, except for Zhaoqing City and Huizhou City, the development intensity of all cities jumped to the next level, among which the median city accounted for the largest proportion (44%), and two cities with higher values appeared: Dongguan City and Shenzhen City. The overall changes are obvious, and the development of construction land covers a wide range. The urban changes shown in the 2010 map are not significant, but combined with the actual data, the development efficiency was the highest between 2000 and 2010, which shows that the development area of several major cities in the center has increased significantly and the development intensity of Dongguan and Shenzhen has reached more than 30%. The development intensity of Foshan and Zhongshan also increased rapidly, becoming high-value cities; in this year, the proportion of various cities was even, and the proportion of low-value cities was the least (11%). In 2020, the development intensity of Foshan City and Zhongshan City also exceeded 30%, and the high-value cities increased from two to four, becoming the city type with the largest proportion (44%). Guangzhou City and Zhuhai City have become relatively high-value cities, and their development intensities are approaching the warning line. The development intensity in Zhaoqing City is still low, accounting for the lowest proportion (11%). In terms of time span, the development intensity of the six major cities has increased significantly in the past 30 years. In terms of spatial distribution, cities near the center (i.e., the Pearl River estuary) generally have a high development intensity, and the development intensity of Dongguan and Shenzhen City has reached more than 40%, which is seriously over-developed. The overall situation is centered around the Pearl River estuary, and the “core-periphery” spatial pattern is high in the center and low in the periphery. Therefore, the closer to the city center, the stronger the gathering ability and the larger the scale. The central city has the geographical advantages of the Pearl River and its estuary. At the same time, the population size and economic level are also developing rapidly, and there are unique natural and social development factors.

3.3. Regional Development Intensity Difference Analysis

According to the development intensity data of each city in 1990, 2000, 2010, and 2020, Formula (2) can be used to calculate the regional development intensity difference (variation coefficient) of the PRD region. The calculation results are shown in Table 5.
The calculation results show that in the past 30 years, the regional development intensity difference in the PRD region has shown a trend of “increasing first and then decreasing”, indicating that the development of various regions was relatively unbalanced between 2000 and 2010. If each region pays more attention to balanced development, the difference can be gradually reduced.

3.4. Spatial Agglomeration Characteristic of Development Intensity

Due to the small number of cities in the PRD, a k-NN weight matrix based on distance weights was established, and the value of k was uniformly set to 4 for a univariate Moran’s I analysis. The analysis results are shown in Figure 4.
According to the analysis results, the Moran index of the four years is greater than 0, and the values are 0.403, 0.357, 0.430, and 0.471, which indicates that the development intensity of the construction land in the PRD region has a significant positive correlation feature, and the spatial distribution shows agglomeration. The four quadrants I, II, III, and IV represent high–high clustering, high–low clustering, low–low clustering, and low–high clustering, respectively. Combined with the overall characteristics of the four-year data, the points falling in quadrants I and III account for the main part, which shows that the development intensity of the PRD region is mainly reflected in high–high clustering and low–low clustering and that there is a strong agglomeration effect between high-value areas and surrounding high-value areas and low-value areas and surrounding low-value areas. The distribution of points in quadrants II and IV is less, indicating that there are few cases where the development intensity of the area is significantly different from that of the surrounding areas. At the same time, the distribution of points in quadrants I and III is relatively uniform, and there is no clustering or dispersal in a certain quadrant.

3.5. Characteristics of Hot and Cold Spots of Development Intensity

Due to the small number of urban samples, the use of a significant Z-score classification cannot achieve a good display effect. Therefore, the Z-score is used as the classification standard, and it is divided into four categories from high to low according to the natural discontinuity point classification method: cold spots, sub-cold spot, sub-hot spot, and hot spot. The analysis results are shown in Figure 5.
According to the analysis results, the overall spatial characteristics from 1990 to 2020 are as follows: hot spots are mainly distributed in Zhongshan City, Dongguan City, and their surrounding cities in the northeast and central part of the PRD region; cold spots are mainly distributed in Zhaoqing City in the west, and some are also distributed in Jiangmen City and Zhuhai City in the southwest. This shows that in terms of economic allocation of resources, etc., the cities near the Pearl River estuary (led by Dongguan and Shenzhen) have over-performed and overflowed, driving the urban construction and development of surrounding cities. Due to its relatively inland location and relatively small population, the economic development of areas such as Zhaoqing in the western region is restricted to some extent, forming low value clusters. From the perspective of time characteristics, there were many hot spots from 1990 to 2000, distributed in Zhongshan City, Dongguan City, Shenzhen City, and Huizhou City. Jiangmen City and Zhuhai City became cold spots again, and returned to being sub-cold spots in 2020. This was mainly due to the relatively unbalanced development intensity of the PRD region from 2000 to 2010, showing a trend of “high in the east and low in the west”, resulting in a large difference in economic development between the western region and the central-eastern regions. From 2010 to 2020, the development of many construction lands in central cities reached saturation, and the government paid more attention to the balance of development and the appropriate development of construction land, resulting in the reduction in differences in hot and cold spots of development intensity.

3.6. Changes in Potential Drivers of Development Intensity

We imported the calculated socio-economic data, population data, and natural environment data into ArcMap and used the natural breakpoint classification method to classify them into five categories from low to high values. Taking 2020 as an example, the data were visually classified onto maps (Figure 6).
Taking 2020 as an example to analyze the results of factor detection, the influencing factors of individual factors on the development intensity change in the PRD region were ranked in descending order of determining power (q value): X 7 > X 5 > X 6 > X 8 > X 10 > X 2 > X 1 > X 3 > X 4 > X 9 . The q value indicates the degree to which the independent variable explains the dependent variable, and the significance level (p value) indicates the degree of significance of the variable relative to other independent variables. The smaller the value, the greater the degree of significance. Through comparison, five factors with less influence, namely X 2 , X 1 , X 3 , X 4 , and X 9 , were removed, and it was found that the driving factors leading the development intensity of the PRD region in 2020 were the proportion of secondary and tertiary industries ( X 7 ), population density ( X 5 ), urban population ratio ( X 6 ), per capita disposable income ( X 8 ), and per capita construction land area ( X 10 ), among which the proportion of secondary and tertiary industries ( X 7 ) and population density ( X 5 ) played a major role.
Similarly, by analyzing the factor detection results of the other three years, we obtained the proportion of secondary and tertiary industries ( X 7 ), population density ( X 5 ), urban population ratio ( X 6 ), per capita disposable income ( X 8 ), and slope ( X 2 ). The impact on development intensity is more significant. Based on the results of the four-year analysis, it was found that the level of population agglomeration in the past 30 years has been the dominant factor affecting the development intensity of the PRD region, while the level of industrial structure, economic strength, and terrain gradient also play a supporting role (Figure 7).

3.7. Exploiting Interactions between Intensity Drivers

Taking the development intensity of each city in the PRD as the dependent variable and the corresponding cities X 1 X 10 as the independent variable, the potential driving factors of the development intensity of the PRD region in 1990, 2000, 2010, and 2020 were used to interact between factor detection, obtain the detection results, and extract the proportion of secondary and tertiary industries ( X 7 ), population density ( X 5 ), urban population ratio ( X 6 ), per capita disposable income ( X 8 ), slope ( X 2 ) as the five dominant factors used to analyze the detection results (Table 6).
Overall, any two of the five factors in the four years showed a two-factor enhanced interaction, indicating that these factors had a synergistic and mutually reinforcing effect on development intensity. In 1990, the population density had the strongest interaction with the proportion of the urban population and per capita disposable income. This may be due to the increase in the income of urban residents during this period and a large influx of the rural population into cities, which led to an increase in the proportion of the urban population and a corresponding increase in population density. With the growing land demand, urban land has been further expanded. In 2000, the interaction between slope and per capita disposable income was the most significant, and the level of economic strength and terrain slope were mutually reinforcing. This may be due to the significant impact of the natural environment on production and life during this period. For example, in areas with relatively gentle slopes, suitable land use expansion and large-scale economic output are beneficial to residents’ housing, transportation, and daily life, and thus promote the development of cities. In 2010, the interaction between the slope and the proportion of the secondary and tertiary industries was the strongest, and the interaction between the proportion of the secondary and tertiary industries, population density, and urban population ratio was also very high, which indicates that the slope, industrial structure level, and population agglomeration level had the greatest impact on development intensity during this period. The interaction is extremely strong, probably because natural factors have a strong impact on the secondary and tertiary industries. Areas with flat terrain are conducive to the formation and development of major secondary and tertiary industries, such as construction, industry, and service industries. The expansion of the scale and the increase in employment opportunities led to the continuous accumulation of population in this area and the continuous development of urban construction land. In 2020, the slope had the strongest interaction with population density and the proportion of secondary and tertiary industries. At the same time, the interaction between per capita disposable income and population density was also increasing. The interactive influence of the proportion of the secondary and tertiary industries was also increasing. This may be because the economic development was more mature in this period, and the connection and interaction between various factors were also closer, which also has a greater impact on the development of the city.

4. Discussion

4.1. Specific Analysis of the Indicator Representations of the above Types of Leading Factors

  • Population concentration level
From the above analysis results, it can be concluded that the level of population agglomeration is the main factor of changes in the development intensity of the PRD region, which is specifically expressed in the proportion of population density and urban population (i.e., urbanization rate). Population density is used to reflect the density of population distribution and also reflects the development level of urbanization to a certain extent. There is a significant positive correlation between population density and urban development intensity. The greater the population density, the faster the urbanization process and the greater the urban development intensity. Taking Shenzhen and Dongguan as examples, in 2020 their population density is the highest in the PRD region, and their development intensity is also the highest. This shows that the cities in this region are developing rapidly, and at the same time, they are constantly attracting an influx of migrants in search of employment opportunities and higher wages. The proportion of the urban population also reflects the migration of rural population to cities and represents the level of urbanization in the region. The increase in the proportion of the urban population will inevitably lead to the expansion of urban land, but will also affect the population carrying capacity, bringing hidden dangers of population overload to corresponding cities. It is worth noting that population, as a driving force for urban expansion, is also influenced by urbanization and economic strength, which are the driving forces for attracting new populations. The result is that while population affects urban expansion, it is also affected by the reaction of urbanization and economy, that is, population and economy interact and integrate to affect the process of urbanization [44].
2.
Level of industrial structure
The proportion of secondary and tertiary industries plays an important supporting role in the development intensity of the PRD region. The three industrial structures are the division of the industrial structure according to the order of social production activities, in which the attributes of the first industry are taken from nature, the second industry is the processing of products taken from nature, and all other economic activities belong to the third industry. The higher the proportion of secondary and tertiary industries, the higher the efficiency of economic output and the higher the level of urban development. Taking Shenzhen City, Dongguan City, and Guangzhou City as examples in 2020, the secondary and tertiary industries account for a very high proportion of the total; the operation level, material production, and people’s quality of life in these cities are all at a high level; and the tertiary industry is the key to solving the employment problem. This drives the inflow of the population from surrounding areas, and at the same time increases the demand for various types of land for production and living in such cities and accelerates urban expansion.
3.
Level of economic strength
The level of economic strength also plays an important role in the development intensity of the PRD region. Per capita disposable income is often used to measure changes in a region’s living standards. The higher the per capita disposable income, the higher the living standard of residents. In 2020, Guangdong and Shenzhen had the highest per capita disposable income, and the degree of economic concentration was also at a high level. As the living standards of residents improve, cities become more attractive to people in surrounding areas, which continuously improves cities’ population carrying capacity and demand and thus accelerates the development of urban construction land.
4.
Slope
As a characteristic factor of the natural environment, terrain slope also affects the development intensity of the PRD region. The “Code for Vertical Planning of Urban Land Use CJJ 83-99” clearly stipulates that the maximum slope of various types of urban construction land shall not exceed 25%, and the “Principles of Urban Planning (Third Edition)” also concentrates on the suitable slope of various urban construction lands at 0–10%; therefore, it can be seen that the slope plays a key role in urban construction and residents’ life. Among the urban agglomerations in the PRD, Zhaoqing City and Huizhou City have relatively large slopes and large terrain fluctuations, and the corresponding development intensity is also at a low level, while Foshan City and Zhongshan City have small slopes and relatively flat terrain, which are suitable for residents to live and work. Their development intensities were also at their highest levels in 2020.

4.2. Comprehensive Analysis and Optimization Suggestions

  • In terms of the natural environment, the slope factor has had a strong interaction with other factors in the past 30 years. It can be seen from the current situation of the study area that 1/5 of the area in the Pearl River Delta is dotted with hills, platforms, and residual hills, of which the eastern, western, and northern mountains and hills are widely distributed. According to the relevant policies proposed in the “National Land and Resources Planning Outline (2017–2030)”, urban development should match the resource and environmental carrying capacity of the region. However, in the Pearl River Delta urban agglomeration, several cities such as Shenzhen and Dongguan have severely exceeding development intensity. There is still a large amount of development space in the peripheral cities of Zhaoqing, Huizhou, and Jiangmen. While playing the role of the main functional area, some industries in the central city should be transferred to the surrounding areas for development, fully leveraging the advantages of terrain and location, the rational use of land resources, and improving land utilization efficiency in order to achieve the substitution of large for small and common development. This will also efficiently utilize limited resources, protect the ecological environment, adhere to the principle of prioritizing ecological development, implement the dual evaluation of land and resources, strictly adhere to the red line of ecological protection and arable land protection, and attach importance to the ecological civilization construction of the Pearl River Delta urban agglomeration.
  • In terms of socio-economic aspects, the level of population agglomeration, industrial structure, and economic strength are the main influencing factors for the development intensity of the Pearl River Delta urban agglomeration. It is necessary to accelerate the pace of joint development between large and small cities and cities and rural areas, reasonably allocate population proportions, and form a moderate population agglomeration. To meet the needs of humanity, we must address the difficulties and key points of urban management, optimize the development of central cities while cultivating the development of surrounding cities, leverage the resources and location advantages of industries, achieve the integration of urban and rural development, and achieve “multi planning integration”. As one of the leading areas in domestic economic development, the Pearl River Delta urban agglomeration should play a leading role in innovation, innovate the concept and method of urban planning, accelerate scientific and technological innovation, and provide more convenient production and living standards for residents.

4.3. Deficiencies and Prospects

This paper takes the PRD region as the research object and studies the spatial–temporal characteristics, spatial pattern, spatial–temporal differences, and driving factors of its development intensity, which can serve as a reference for the delineation of ecological protection red lines and the optimization of urban development boundaries. At the same time, there are still some shortcomings in this paper, which are hoped to be improved upon through follow-up research and study:
  • The number of major cities in the PRD region selected in this paper is relatively small, the exploration of some spatial changes is still at a relatively macro and overall level, and the results of the cluster analysis are not refined enough. The overall research scope is small, and the change trends of some cities are not significant enough; therefore, some conclusions are not universal.
  • The discussion of development intensity in this article is still at a relatively superficial level. Later, through in-depth study, more detailed indicators such as building density can be mastered, and the development process can be simulated, reproduced, and forecasted.
  • Due to the long history, the data accuracy of some statistical yearbooks in 1990 is limited, which may lead to inaccurate analysis results of some geographic detections in that year. It is hoped that the accuracy of various data will be further improved in the future.
  • In the process of analyzing the driving factors, due to the limitations in statistical data in each year, the number of selected influencing factors is small. It is hoped that in the follow-up research, more and more suitable influencing factors will be selected in combination with the local actual situation, and at the same time that the PRD region will put forward more comprehensive and objective suggestions for urban development optimization.

5. Conclusions

This paper calculates the development intensity for the PRD region in 1990, 2000, 2010, and 2020, uses the coefficient of variation to measure the regional differences in development intensity, and uses the Moran’s I and Getis indices to carry out a spatial autocorrelation analysis and cold and hot spot mapping to analyze time–space characteristics. Finally, with the help of factor detection and interaction detection using geodetector, this paper discusses the influencing factors and interactions of the spatial pattern evolution of urban construction land development intensity for the PRD region, and draws the following main conclusions:
(1)
In the past 30 years, the urban agglomeration in the PRD region was mainly covered by forest land, and its coverage rate was as high as 50%; the area of unused land and grassland was the least, less than 3%. The area of construction land increased from 3133 km2 in 1990 to 8119 km2 in 2020, while the remaining land types (cultivated land, forest land, grassland, water area, and unused land) showed a decreasing trend in general.
(2)
In the past 30 years, the overall development intensity of the PRD region has shown an upward trend, and the trend is particularly significant in the central cities. The average development intensities of the urban agglomeration in the four years are 5.80%, 7.83%, 12.66%, and 14.93%. In terms of spatial distribution, this presents a “core-peripheral” spatial pattern centered in the vicinity of the Pearl River estuary, with the center high and the periphery low, and the closer to the city center, the stronger the gathering ability and the larger the scale. In the past 30 years, the regional development intensity difference in the PRD region has shown a trend of “increasing first and then decreasing”. The development of various regions was relatively unbalanced during 2000–2010; when more attention was paid to balanced development, the difference was gradually reduced.
(3)
The Moran index values of the development intensity of PRD region in 1990, 2000, 2010, and 2020 were all greater than 0, and their values were 0.403, 0.357, 0.430, and 0.471, respectively, which indicates that the construction land of the PRD region, which indicates the development intensity of the city, has a significant positive correlation feature. The spatial distribution shows agglomeration, mainly showing high–high clustering and low–low clustering distribution; hot spots and sub-hot spots are mainly distributed in the northeastern and central parts of the PRD region, and the cold spots and sub-cold spots are mainly distributed in Zhaoqing City in the west and also in Jiangmen City and Zhuhai City in the southwest in some years. They are all stable in terms of the spatial distribution feature.
(4)
The analysis of factor detection and interaction detection through geodetector shows that the driving factors for the development intensity of the PRD region in the past 30 years mainly include population density, the urban population ratio, the proportion of secondary and tertiary industries, per capita disposable income, and slope. These five types of factors have a synergistic effect on the development intensity, showing a dual-factor enhancement. The dominant factors of interaction are different in different periods, and the slope has the strongest overall interaction with other factors over the past 30 years.
On the basis of previous research, this article uses geodetector to calculate the various influencing factors of development intensity for the PRD region. Currently, it mainly focuses on socio-economic factors. In the future, various ecological indicators such as temperature, precipitation, carbon sequestration, etc., can be introduced to analyze construction land development from an environmental perspective and evaluate the ecosystem by using models such as InVEST. In addition, public value is also another direction that is worth exploring in depth. In future research, we will fully evaluate the risks and costs of these suggestions on urban public value, consider the rationality of each suggestion, and provide more scientific decision-making support.

Author Contributions

Conceptualization, H.Y., D.L. and C.Z.; methodology, H.Y. and D.L.; validation, H.Y., C.Z. and L.Y.; data curation, B.Y.; visualization, H.Y. and S.Q.; writing—original draft, H.Y. and D.L.; writing—review and editing, H.Y., D.L., X.W. and C.Z.; funding acquisition, D.L. All authors have read and agreed to the published version of the manuscript.

Funding

This research was funded by the Third Xinjiang Scientific Expedition of the Key Research and Development Program of the Ministry of Science and Technology of the People’s Republic of China (No. 2022xjkk1100).

Data Availability Statement

Not applicable.

Acknowledgments

Thanks are given to the reviewers and editors for their constructive suggestions and comments.

Conflicts of Interest

The authors declare no conflict of interest.

References

  1. Fang, C. Important Progress and Prospects of China’s Urbanization and Urban Agglomeration in the 40 Years of Reform and Opening up. Econ. Geogr. 2018, 38, 1–9. [Google Scholar]
  2. Fan, J.; Zhou, K.; Chen, D. Innovation and Application Practice of Economic Geography Research on Optimizing the Spatial Development Pattern of Land in the Construction of Ecological Civilization. Econ. Geogr. 2013, 1, 1–8. [Google Scholar]
  3. Sun, H.; Huang, Z.; Xu, D.D.; Shi, X.; Liu, H.; Tan, L.; Ge, J. The Spatial Characteristics and Drive Mechanism of Coupling Relationship between Urbanization and Eco-Environment in the Pan Yangtze River Delta. Econ. Geogr. 2017, 37, 163–170. [Google Scholar]
  4. Shen, Q.X.; Li, C.G.; Sun, Y.A.; Song, Y. Evolution of New Urban Space Based on the Use Land and Population Analysis—A Case Study of Changchun. Econ. Geogr. 2018, 38, 44. [Google Scholar]
  5. Liu, Y.J.; Yu, H.S.; Liu, D.G.; Zhu, L.Y. Spatial differentiation mechanism of development intensity pattern evolution of construction land in Northeast China. Acta Geogr. Sin. 2018, 73, 14. [Google Scholar]
  6. Chen, J.; Gao, J.; Xu, M.; Chen, W. Characteristics and Mechanism of Construction Land Expansion in Nanjing Metropolitan Area. Geogr. Res. 2014, 33, 12. [Google Scholar]
  7. Zhao, Y.L.; Liu, Y.Z.; Long, K.S. Analysis of the characteristics and influencing factors of urban land development intensity in the Yangtze River Delta. Resour. Environ. Yangtze River Basin 2012, 21, 1480. [Google Scholar]
  8. Zhang, R.T.; Jiao, H.F. Evolution and driving mechanism of spatio-temporal pattern of city development efficiency in Pan-Yangtze River Delta. Econ. Geogr. 2014, 34, 7. [Google Scholar]
  9. Huang, B.R.; Zhang, H.Z.; Song, D.J.; Ma, Y.H. Analysis of the driving force of construction land expansion in mainland China from 2000 to 2010. Ecol. J. 2017, 37, 10. [Google Scholar]
  10. Wu, D.F.; He, Y.; Liu, Y.Y.; Liu, Y.H. Coordinated Analysis of Urban Development Intensity and Resource and Environment Carrying Capacity—Taking the Pearl River Delta as an Example. J. Nat. Resour. 2020, 35, 82–94. [Google Scholar]
  11. Peng, S.G.; Wang, Y.H.; Chen, C.; Wang, J.; Li, G. Analysis on Rationality of Industrial Land Scale and Expansion Driving Force in Shandong Province. Resour. Sci. 2016, 38, 11. [Google Scholar]
  12. Li, X.F.; Deng, H.B. Spatial differences and temporal and spatial evolution of new urbanization coordination in the Yangtze River Economic Belt. Resour. Environ. Yangtze River Basin 2016, 25, 8. [Google Scholar]
  13. Ding, J.; Wang, K.Y. Spatio-temporal evolution and driving mechanism of industrial production space in the Pearl River Delta urban agglomeration. Geogr. Res. 2018, 37, 14. [Google Scholar]
  14. Chen, P.Y.; Zhu, X.G. Regional Economic Differences and Spatial Pattern Evolution in Fujian Province. Reg. Res. Dev. 2009, 28, 6. [Google Scholar]
  15. Liu, Y.S.; Yang, R. The spatial characteristics and formation mechanism of China’s county-level urbanization. Acta Geogr. Sin. 2012, 67, 10. [Google Scholar]
  16. Cilliers, S.; Du Toit, M.; Cilliers, J.; Drewes, E.; Retief, F. Sustainable urban landscapes: South African perspectives on transdisciplinary possibilities. Landsc. Urban Plan. 2014, 125, 260–270. [Google Scholar] [CrossRef]
  17. Wei, Y.D.; Han, L.; Wenze, Y. Urban land expansion and regional inequality in transitional China. Landsc. Urban Plan. 2017, 163, 17–31. [Google Scholar] [CrossRef]
  18. Liu, Y.; Cao, X.; Li, T. Identifying Driving Forces of Built-Up Land Expansion Based on the Geographical Detector: A Case Study of Pearl River Delta Urban Agglomeration. Int. J. Environ. Res. Public Health 2020, 17, 1759. [Google Scholar] [CrossRef]
  19. Xia, S.Y.; Zhao, Y.; Xu, X.; Song, Y.Y.; Wen, Q. The spatio-temporal pattern and influencing factors of the development degree of the pan-Yangtze River Delta urban agglomeration. Reg. Res. Dev. 2019, 38, 7. [Google Scholar]
  20. Wang, Z.Y.; Li, J.X.; Shi, X.L.; Gao, Y.; Wang, H.F.; Shao, S.Y.; Zhao, M.Q. Analysis on Spatial and Spatial Characteristics of Urban Construction Land Spatial Expansion in Zhejiang Province. J. Ningbo Univ. 2020, 33, 9. [Google Scholar]
  21. Wang, J.; Xu, C. Geodetector: Principle and prospective. Acta Geogr. Sin. 2017, 72, 116–134. [Google Scholar]
  22. Cai, F.F.; Pu, L.J. Temporal and spatial characteristics and formation mechanism of urban and rural construction land evolution in Nantong City. Resour. Sci. 2014, 36, 10. [Google Scholar]
  23. Xu, Q.R.; Zheng, X.Q. A Mechanism Analysis Method of Urban Expansion Based on Geodetector. J. Surv. Mapp. 2015, 44, 6. [Google Scholar]
  24. Li, Z.Y.; Shi, P.J. Analysis on Spatial Pattern Changes and Influencing Factors of Urban and Rural Construction Land Development Intensity in Lanzhou-Xining Urban Agglomeration. J. Ecol. Rural Environ. 2020, 36, 9. [Google Scholar]
  25. Zhao, X.F.; Li, Y.Y.; Zhao, Y.T.; Tian, Z.Q. Spatial-temporal differences in land development based on geodetector and their driving factors. Resour. Environ. Yangtze River Basin 2018, 27, 9. [Google Scholar]
  26. Li, J.; Sun, Z. Urban Function Orientation Based on Spatiotemporal Differences and Driving Factors of Urban Construction Land. J. Urban Plan. Dev. 2020, 146, 05020011. [Google Scholar] [CrossRef]
  27. Fan, J.; Zhao, D.T. Measurement of coordination between land urbanization and population urbanization and its influencing factors. Econ. 2012, 5, 61–67. [Google Scholar]
  28. Guo, W.H.; Hao, J.M.; Qin, L.; Meng, P.; Hou, M.P.; Li, T. Discussion on the construction land evaluation index in the process of urbanization in China. Resour. Sci. 2005, 27, 7. [Google Scholar]
  29. Wang, J.; Zhao, M. Influencing factors and multiple controls of planning and construction land use standards. Mod. Urban Res. 2011, 9, 30–38. [Google Scholar]
  30. Lv, C.L.; Chen, Y. A study on the spatiotemporal differences of urbanization in Gansu province. Ecol. Econ. 2011, 1, 49–54. [Google Scholar]
  31. Chen, F.G.; Zhang, H.O.; Wu, Q.T.; Chen, W.L. Research on the coordinated development of population urbanization and land urbanization in my country. Hum. Geogr. 2010, 5, 53–58. [Google Scholar]
  32. Zhou, B.Z.; Bao, H.S. Evaluation on exploitative intensity of land resources in the Yangtze River Delta. Sci. Geogr. Sin. 2000, 20, 218–223. [Google Scholar]
  33. Liu, J.Y.; Liu, W.C.; Kuang, W.H.; Ning, J. Remote Sensing-based Analysis of the Spatiotemporal Characteristics of Built-up area across China Based on the Plan for Major Function-oriented Zones. Acta Geogr. Sin. 2016, 71, 355–369. [Google Scholar]
  34. Wang, J.F.; Li, X.H.; Christakos, G.; Liao, Y.L.; Zhang, T.; Gu, X.; Zheng, X.Y. Geographical Detectors-Based Health Risk Assessment and its Application in the Neural Tube Defects Study of the Heshun Region, China. Int. J. Geogr. Inf. Sci. 2010, 24, 107–127. [Google Scholar] [CrossRef]
  35. Cao, X.; Liu, Y.; Li, T.; Liao, W. Analysis of Spatial Pattern Evolution and Influencing Factors of Regional Land Use Efficiency in China Based on ESDA-GWR. Sci. Rep. 2019, 9, 520. [Google Scholar] [CrossRef]
  36. Wang, X.; Wang, S.; Song, Y.; Hu, H. Space Recognition and Influence Mechanism of Urban Construction Land Evolution of Changchun City. Sci. Geogr. Sin. 2015, 35, 873–881. [Google Scholar]
  37. Liu, Y.L.; Li, J.W.; Hou, H.P.; Liu, Y.F. Study on urbanization rate of urban-rural construction landand its influencing factors: A case study of Hubei Province. Geogr. Res. 2014, 33, 132–142. [Google Scholar]
  38. Fang, S.; Gertner, G.Z.; Sun, Z.; Anderson, A.A. The impact of interactions in spatial simulation of the dynamics of urban sprawl. Landsc. Urban Plan. 2005, 73, 294–306. [Google Scholar] [CrossRef]
  39. Huang, B.; Zhang, H.; Song, D.; Ma, Y. Driving forces of built-up land expansion in China from 2000 to 2010(Article). Shengtai Xuebao/Acta Ecol. Sin. 2017, 37, 4149–4158. [Google Scholar]
  40. Yao, H.S.; Xu, X.Q. Continue to promote reform, open up and innovate to create a new situation for the development of the Pearl River Delta—Interpretation of the Outline of the Pearl River Delta Regional Reform and Development Plan (2008–2020). Spec. Zone Econ. 2009, 7, 2. [Google Scholar]
  41. Yu, L.; Du, Z.; Dong, R.; Zheng, J.; Tu, Y.; Chen, X.; Hao, P.; Zhong, B.; Peng, D.; Zhao, J.; et al. FROM-GLC Plus: Toward near real-time and multi-resolution land cover mapping. GISci. Remote Sens. 2022, 59, 1026–1047. [Google Scholar] [CrossRef]
  42. Gong, P.; Chen, B.; Li, X.; Liu, H.; Wang, J.; Bai, Y.; Chen, J.; Chen, X.; Fang, L.; Feng, S.; et al. Mapping essential urban land use categories in China (EULUC-China): Preliminary results for 2018. Sci. Bull. 2020, 65, 182–187. [Google Scholar] [CrossRef]
  43. Hou, F.F. Research on Spatiotemporal Differentiation and Limit Evaluation of Land Development Intensity in Xi’an City Based on GIS. Master’s Thesis, Chang’an University, Xi’an, China, 2019. [Google Scholar]
  44. Gupta, A.; Van Nieuwerburgh, S.G.; Kontokosta, C. Take the Q train: Value capture of public infrastructure projects. J. Urban Econ. 2022, 129, 103422. [Google Scholar] [CrossRef]
Figure 1. The location of the study area.
Land 12 01673 g001
Figure 2. Distribution of changes in construction land every ten years.
Land 12 01673 g002
Figure 3. Spatial distribution of development intensity.
Land 12 01673 g003
Figure 4. Moran scatter plot of development intensity.
Land 12 01673 g004
Figure 5. Development intensity cold and hot spot evolution map.
Land 12 01673 g005
Figure 6. Classification and spatial distribution of driving factors in 2020.
Land 12 01673 g006
Figure 7. Factor detection of potential driving factors for development intensity.
Land 12 01673 g007
Table 1. Data type, information, and source.
Data TypeData InformationData Sources
Spatial
data
DEM raster data with a 30 m resolutionGeospatial Data Cloud Platform
Land use raster data with a resolution of 1 km in 1990, 2000, 2010, and 2020Resource and Environment Science and Data Center, geographical information monitoring cloud platform
Pearl River Delta Administrative division vector data with a 1 km resolutionResource and Environment Science and Data Center
Statistical dataSocio-economic data of Guangdong Province by yearGuangdong Statistical Yearbook
Guangdong Provincial census data by yearGuangdong Census Bulletin
Table 2. Interaction between two independent variables and the dependent variable.
IllustrationCriterionInteraction
Land 12 01673 i001 q ( X 1 ∩X2) < Min( q ( X 1 ), q ( X 2 ))nonlinear attenuation
Land 12 01673 i002Min( q ( X 1 ), q ( X 2 )) < q ( X 1 X 2 ) < Max( q ( X 1 ), q ( X 2 ))single-factor nonlinear attenuation
Land 12 01673 i003 q ( X 1 X 2 ) > Max( q ( X 1 ), q ( X 2 ))double-factor enhancement
Land 12 01673 i004 q ( X 1 X 2 ) = q ( X 1 ) + q ( X 2 )independence
Land 12 01673 i005 q ( X 1 X 2 ) > q ( X 1 ) + q ( X 2 )nonlinear enhancement
Note: Blue: Min( q ( X 1 ), q ( X 2 )): Take the minimum value between q ( X 1 ) and q ( X 2 ); Green: Max( q ( X 1 ), q ( X 2 )): Take the maximum value between q ( X 1 ) and q ( X 2 ); Yellow: q ( X 1 ) + q ( X 2 ): Sum q ( X 1 ) and q ( X 2 ); Red: q ( X 1 X 2 ): Interaction between q ( X 1 ) and q ( X 2 ).
Table 3. Detection indicators for potential driving factors of development intensity.
Index IdIndexCharacterize
X 1 altitudenatural environment
X 2 slopenatural environment
X 3 gross regional product valueeconomic development
X 4 per capita GDPeconomic development
X 5 population densitypopulation agglomeration
X 6 urban population ratiopopulation agglomeration
X 7 proportion of secondary and tertiary industriesindustrial structure
X 8 per capita disposable incomeeconomic strength
X 9 average social investment in fixed assetsland investment
X 10 per capita construction land arealand use
Table 4. Land use change pattern of PRD region.
YearIndexLand Use Type
arable landwood
land
grasslandwaterconstruction landunused
1990area/km215,74130,14911293878313327
proportion%29.1255.772.097.175.800.05
2000area/km214,52629,92810784264423128
proportion%26.8755.371.997.897.830.05
2010area/km212,76129,4119854044684526
proportion%23.6054.391.827.4812.660.05
2020area/km212,26029,0701080384181197
proportion%22.5553.461.997.0614.930.01
1990–2000variation−1215−221−5138610981
2000–2010variation−1765−517−93−2202614−2
2010–2020variation−501−34195−2031274−19
1990–2020variation−3481−1059−49−374986−20
Table 5. Difference in regional development intensity.
YearDifference Degree%
199062.19
200070.89
201074.04
202066.39
Table 6. Interaction detection of potential driving factors for development intensity.
YearC = A∩BA + BComparing ResultsInteractivity
1990 X 2 X 5 = 0.991 X 2 (0.498) + X 5 (0.548)C > A, B; C < A + B X 2 X 5
X 2 X 6 = 0.885 X 2 (0.498) + X 6 (0.757)C > A, B; C < A + B X 2 X 6
X 2 X 7 = 0.739 X 2 (0.498) + X 7 (0.513)C > A, B; C < A + B X 2 X 7
X 2 X 8 = 0.991 X 2 (0.498) + X 8 (0.835)C > A, B; C < A + B X 2 X 8
X 5 X 6 = 1.000 X 5 (0.548) + X 6 (0.757)C > A, B; C < A + B X 5 X 6
X 5 X 7 = 0.958 X 5 (0.548) + X 7 (0.513)C > A, B; C < A + B X 5 X 7
X 5 X 8 = 0.855 X 5 (0.548) + X 8 (0.835)C > A, B; C < A + B X 5 X 8
X 6 X 7 = 0.885 X 6 (0.757) + X 7 (0.513)C > A, B; C < A + B X 6 X 7
X 6 X 8 = 1.000 X 6 (0.757) + X 8 (0.835)C > A, B; C < A + B X 6 X 8
X 7 X 8 = 0.958 X 7 (0.513) + X 8 (0.835)C > A, B; C < A + B X 7 X 8
2000 X 2 X 5 = 0.997 X 2 (0.429) + X 5 (0.979)C > A, B; C < A + B X 2 X 5
X 2 X 6 = 0.680 X 2 (0.429) + X 6 (0.279)C > A, B; C < A + B X 2 X 6
X 2 X 7 = 0.882 X 2 (0.498) + X 7 (0.784)C > A, B; C < A + B X 2 X 7
X 2 X 8 = 1.000 X 2 (0.498) + X 8 (0.702)C > A, B; C < A + B X 2 X 8
X 5 X 6 = 0.999 X 5 (0.979) + X 6 (0.279)C > A, B; C < A + B X 5 X 6
X 5 X 7 = 0.994 X 5 (0.979) + X 7 (0.784)C > A, B; C < A + B X 5 X 7
X 5 X 8 = 0.997 X 5 (0.979) + X 8 (0.702)C > A, B; C < A + B X 5 X 8
X 6 X 7 = 0.880 X 6 (0.279) + X 7 (0.784)C > A, B; C < A + B X 6 X 7
X 6 X 8 = 0.947 X 6 (0.279) + X 8 (0.702)C > A, B; C < A + B X 6 X 8
X 7 X 8 = 0.826 X 7 (0.784) + X 8 (0.702)C > A, B; C < A + B X 7 X 8
2010 X 2 X 5 = 0.875 X 2 (0.584) + X 5 (0.716)C > A, B; C < A + B X 2 X 5
X 2 X 6 = 0.875 X 2 (0.584) + X 6 (0.660)C > A, B; C < A + B X 2 X 6
X 2 X 7 = 1.000 X 2 (0.584) + X 7 (0.938)C > A, B; C < A + B X 2 X 7
X 2 X 8 = 0.904 X 2 (0.584) + X 8 (0.757)C > A, B; C < A + B X 2 X 8
X 5 X 6 = 0.874 X 5 (0.716) + X 6 (0.660)C > A, B; C < A + B X 5 X 6
X 5 X 7 = 0.984 X 5 (0.716) + X 7 (0.938)C > A, B; C < A + B X 5 X 7
X 5 X 8 = 0.997 X 5 (0.716) + X 8 (0.757)C > A, B; C < A + B X 5 X 8
X 6 X 7 = 0.980 X 6 (0.660) + X 7 (0.938)C > A, B; C < A + B X 6 X 7
X 6 X 8 = 0.977 X 6 (0.660) + X 8 (0.757)C > A, B; C < A + B X 6 X 8
X 7 X 8 = 0.976 X 7 (0.938) + X 8 (0.757)C > A, B; C < A + B X 7 X 8
2020 X 2 X 5 = 1.000 X 2 (0.564) + X 5 (0.868)C > A, B; C < A + B X 2 X 5
X 2 X 6 = 0.995 X 2 (0.564) + X 6 (0.830)C > A, B; C < A + B X 2 X 6
X 2 X 7 = 1.000 X 2 (0.564) + X 7 (0.964)C > A, B; C < A + B X 2 X 7
X 2 X 8 = 0.858 X 2 (0.564) + X 8 (0.698)C > A, B; C < A + B X 2 X 8
X 5 X 6 = 0.980 X 5 (0.868) + X 6 (0.830)C > A, B; C < A + B X 5 X 6
X 5 X 7 = 0.971 X 5 (0.868) + X 7 (0.964)C > A, B; C < A + B X 5 X 7
X 5 X 8 = 1.000 X 5 (0.868) + X 8 (0.698)C > A, B; C < A + B X 5 X 8
X 6 X 7 = 0.975 X 6 (0.830) + X 7 (0.964)C > A, B; C < A + B X 6 X 7
X 6 X 8 = 0.869 X 6 (0.830) + X 8 (0.698)C > A, B; C < A + B X 6 X 8
X 7 X 8 = 0.995 X 7 (0.964) + X 8 (0.698)C > A, B; C < A + B X 7 X 8
Note: A↑↑B indicates A and B two-factor enhancement.
Disclaimer/Publisher’s Note: The statements, opinions and data contained in all publications are solely those of the individual author(s) and contributor(s) and not of MDPI and/or the editor(s). MDPI and/or the editor(s) disclaim responsibility for any injury to people or property resulting from any ideas, methods, instructions or products referred to in the content.

