Essay

Impact of Land Cover Changes on Soil Type Mapping in Plain Areas: Evidence from Tongzhou District of Beijing, China

1
School of Land Science and Technology, China University of Geosciences, Beijing 100083, China
2
Key Laboratory of Land Consolidation and Rehabilitation, Ministry of Natural Resources, Beijing 100035, China
*
Author to whom correspondence should be addressed.
Land 2023, 12(9), 1696; https://doi.org/10.3390/land12091696
Submission received: 29 July 2023 / Revised: 19 August 2023 / Accepted: 22 August 2023 / Published: 29 August 2023

Abstract

:
The flat terrain in the plain areas of Beijing, China makes the land easily accessible for cultivation and farming, providing vast opportunities for agricultural development. Meanwhile, these areas are also crucial for urban construction and economic growth. Soil type mapping plays a key role in understanding soil characteristics and guiding land management practices. However, accurately mapping soil types in plain regions can be challenging due to their low spatial variability and diverse land use types. Although land cover changes due to phenomena such as urbanization, agricultural expansion, and conversion of natural vegetation can significantly affect soil properties and distribution patterns, their impacts on soil type mapping remain unclear. This study investigated the impacts of land cover changes in plain areas on the accuracy of soil type mapping, hoping to provide effective assistance for soil type mapping in plain areas by analyzing their coupling relationship. Focusing on the 20 year land cover changes in Tongzhou District, this study utilizes a unified approach that combines expert knowledge, mixed sampling methods, and RF mapping techniques, while incorporating environmental covariates that have minimal period influence and synergistically using NDVI and land cover data from the same year. Transition matrices are used to reveal land cover changes, confusion matrices, and their derived indicators to analyze changes in soil type mapping accuracy, and coupling analysis is conducted between soil type change areas and land cover change areas. The results show that Tongzhou District has experienced rapid development over the past 20 years, with the area of construction land nearly doubling. Additionally, 29% of arable land has been converted into construction land, resulting in an increase in the accuracy of the soil map from 58.99% to 66.91% over the 20 year period. The soil type change area during this period accounts for 16.5% of the total area, with 51.9% of the changed areas overlapping with land cover change areas. These overlapping regions are predominantly influenced by human activities. In terms of cultivated land types in the study area, the quantity of arable land has decreased by approximately 29% over 20 years, while the proportion of Sandy loam calcareous fluvo-aquic soil and Light loam calcareous fluvo-aquic soil, which constitute nearly half of the soil type, has increased. These data demonstrate the coupling relationship between land cover changes and soil type variations. It is evident that improving the extent of land use in plain areas enhances the credibility of soil type mapping. Meanwhile, human activities impact land cover, which, in turn, affects and reflects changes in the soil type.

1. Introduction

Soil type refers to a level in soil classification, which is a grouping of soil with similar attributes divided according to the pedogenic process, degree of development, and characteristics of soil. Soil type mapping plays a significant role in agriculture, environmental protection, and land planning [1]. By providing detailed information about soil characteristics and spatial distribution, soil type mapping can guide farmers and land managers in developing rational land cover and crop cultivation strategies to maximize crop yield and quality [2]. Typically, plain areas in China have relatively low spatial variability in soil, and differences between soil type and properties may not be very distinct. This makes the accurate classification and mapping of soil challenging [3,4,5]. Human activities, such as crop cultivation, irrigation, and fertilization, can have complex impacts on soil, resulting in more intricate and irregular spatial distribution of soil properties [6,7]. Different land cover types have significant influences on soil formation, evolution, and properties [8]. For instance, different land cover types, such as cropland, grassland, forest, and wetland, can lead to variations in organic matter content and water-holding capacity, which, in turn, affect the chemical, physical, and biological properties of soil [9,10,11]. These differences are reflected in soil type mapping, with different land cover types often exhibiting distinct spatial distribution patterns in the soil [12]. Studying the impact of land cover changes on soil type mapping can help explore ways to improve mapping accuracy in plain areas and provide valuable guidance for land protection and management measures [13]. Additionally, it contributes to optimizing land cover structure, enhancing the sustainability of agricultural production, and offering scientifically informed decision-making support for policymakers to promote sustainable development in plain regions [14].
Many scholars have dedicated their efforts to exploring the impact and correlations between land cover changes and soil mapping [15]. For example, Zhang et al. [16] proposed a method to identify agricultural land cover history by overlaying land cover data from 1980 to 2018, and their model, which incorporates agricultural land cover history, improved the mapping accuracy of soil organic carbon compared to models that only utilized natural variables, providing more spatial details attributed to land development. Taveira et al. [17] sampled and classified soil profiles from regional soil surveys and compared their land cover capabilities with different management levels displayed on maps. The results revealed that higher land cover capability in the Minas Gerais state corresponded to higher accuracy in soil type mapping. Due to the complex and diverse relationships between land cover changes and soil properties, as well as the interactions among different land cover types, geographic environments, and management practices, there are still research gaps and challenges in this field [18]. In this study, expert knowledge was used to extract virtual points, and it was combined with other sampled points as mixed points. In addition to using consistent environmental covariates such as parent material, texture, groundwater depth, distance to water bodies, and elevation as auxiliary variables, random forest (RF) was employed for Soil type mapping from 2000 to 2020 at 5 year intervals, ensuring the use of corresponding land cover types and NDVI as environmental covariates. This study uses transition matrices to reveal land cover changes in plain areas of Beijing, China, confusion matrices, and their derived evaluation indicators to demonstrate the impacts of land cover changes on soil type mapping accuracy in plain areas, and it couples the analyses of land cover changes and soil type changes to reflect their correlation. Accurately grasping changes in soil type is of great significance for guiding local land use planning and protection, as well as rational utilization of soil resources. By analyzing the coupling between land cover type changes and soil type changes in Tongzhou District, this study can provide references to improve the accuracy of soil type prediction and mapping in plain areas of Beijing, China, and it can support the formulation of scientific land use management policies and the sustainable use of land resources.

2. Materials and Methods

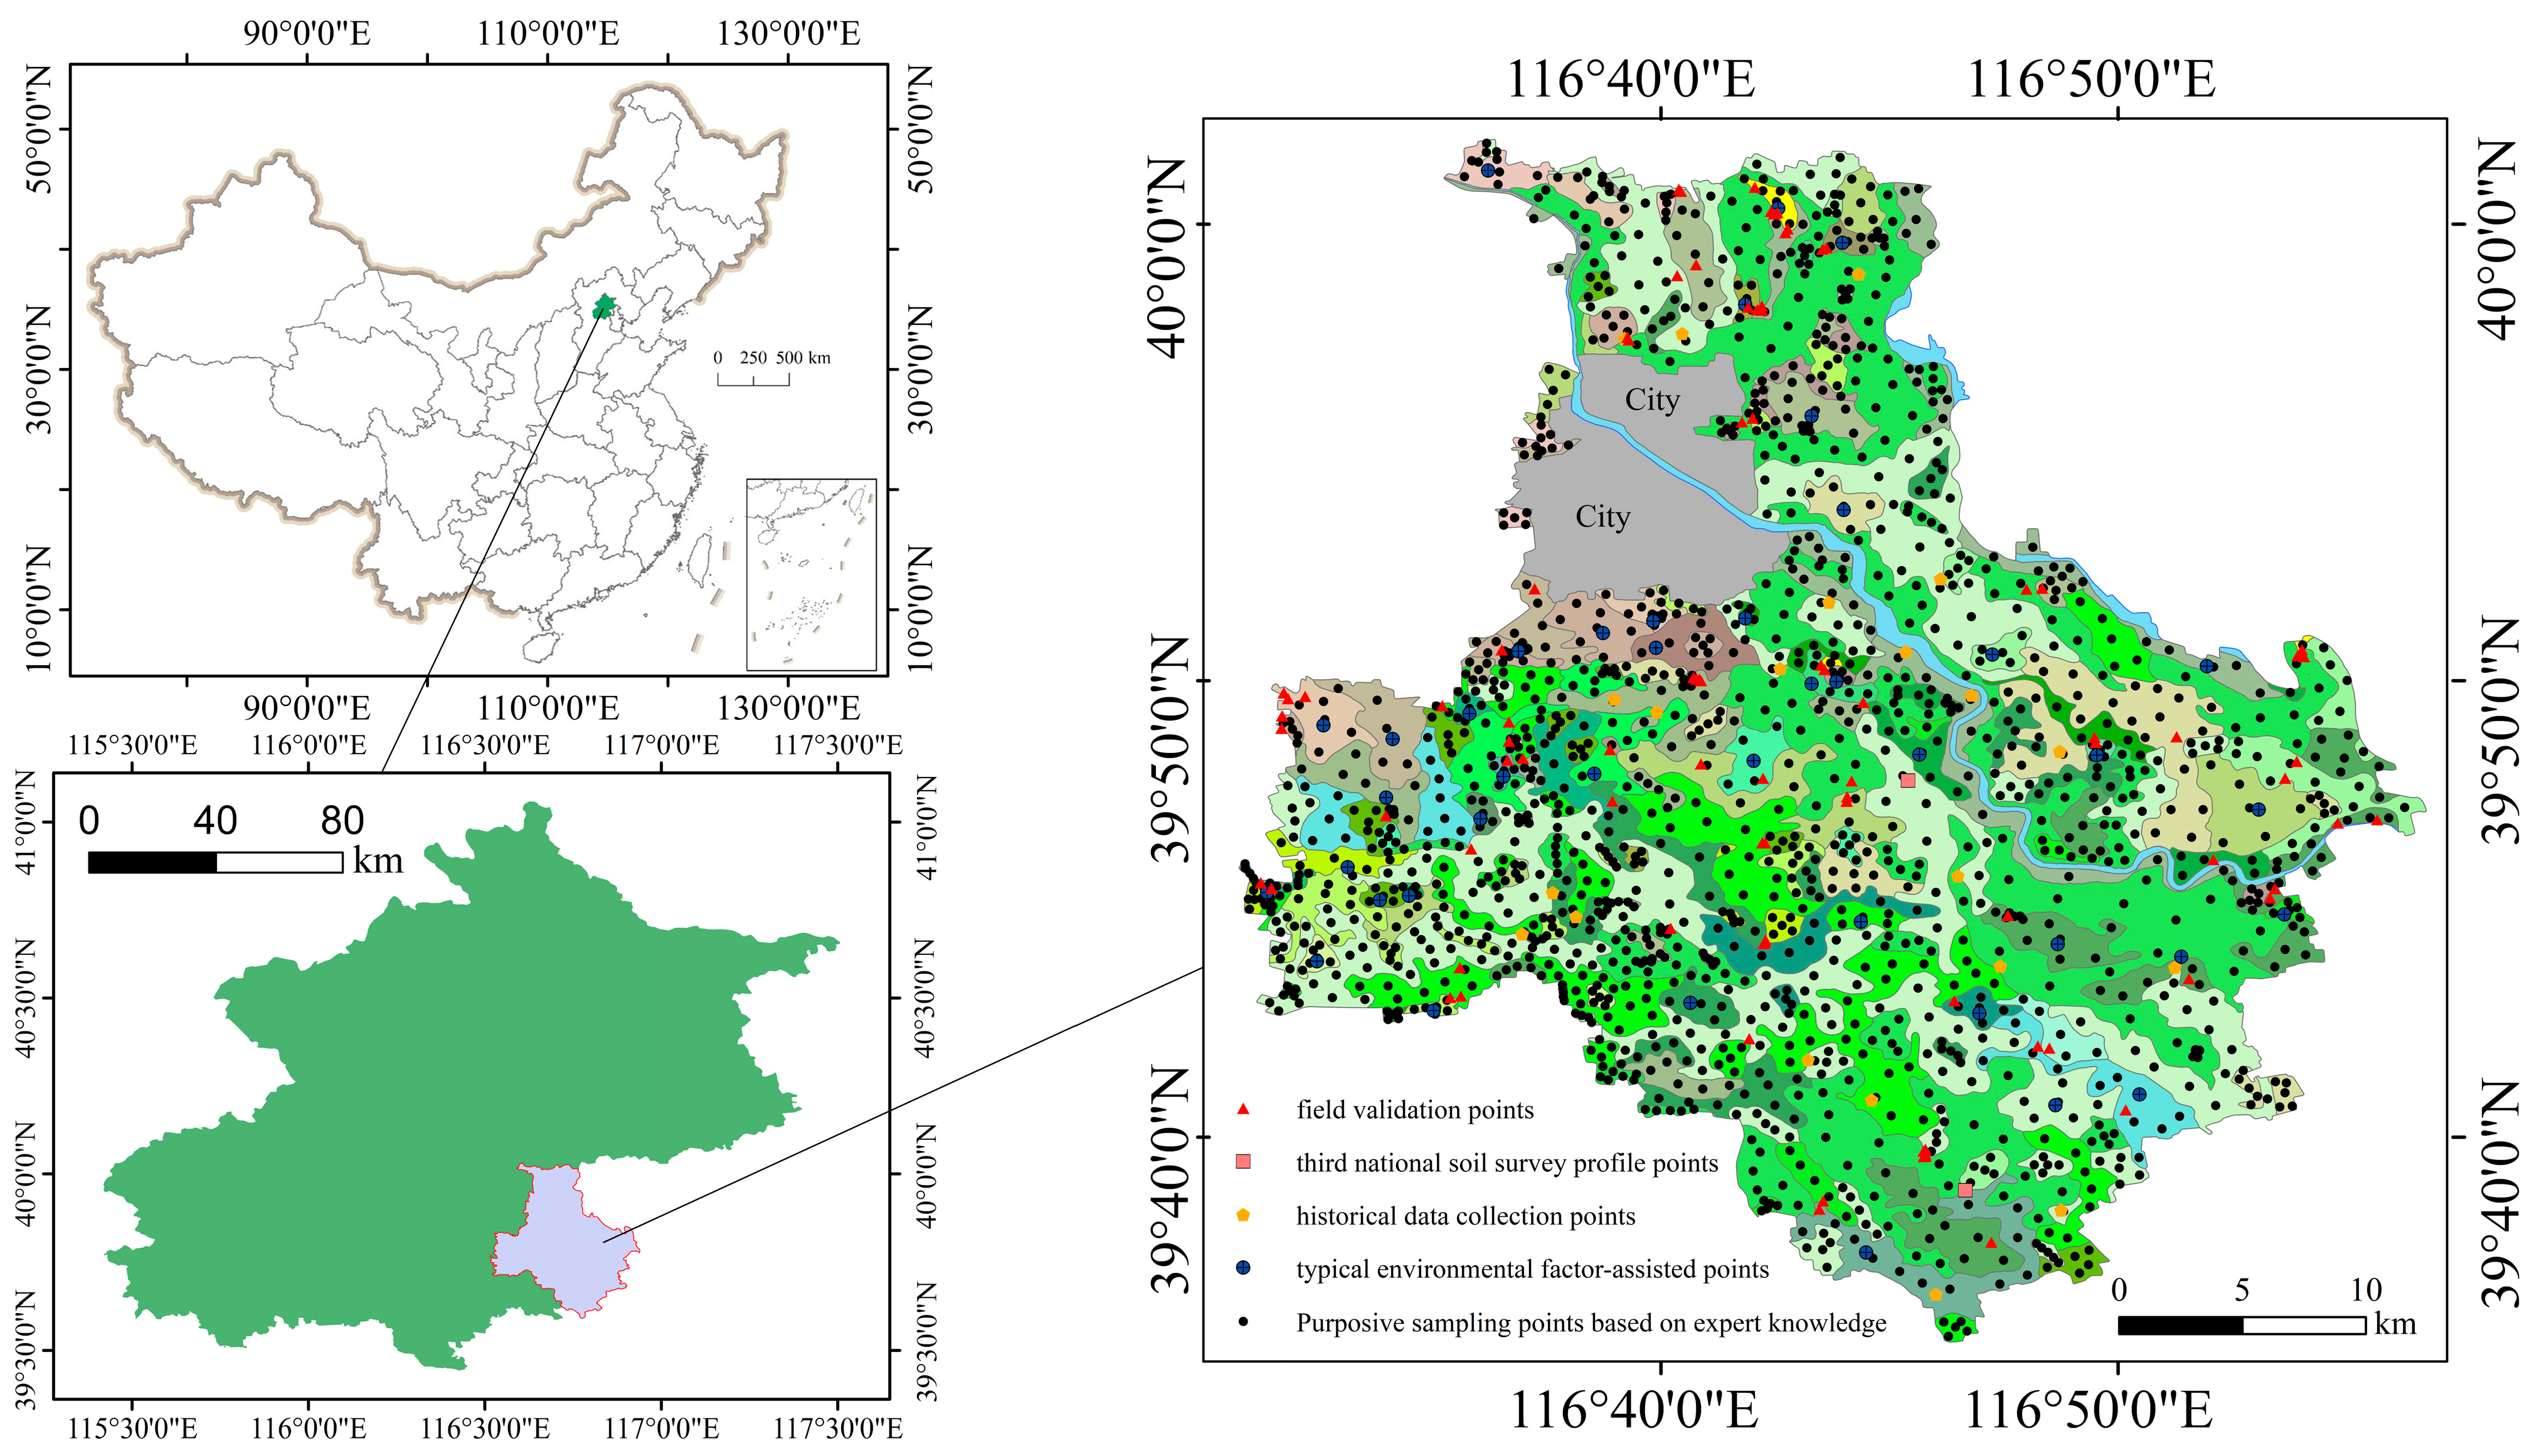
2.1. Overview of the Study Area

According to Figure 1, Tongzhou District is situated in the southeastern region of Beijing, China. It lies between lat. 39°36′ N to 40°02′ N and long. 116°32′ E to 116°56′ E. The district covers an area of 903 km2, predominantly consisting of alluvial fans and floodplains formed by the Yongding River, Chaobai River, and Wenyu River [19]. The land surface in Tongzhou District is covered by deep deposits of Quaternary sediments, forming modern alluvial fan plains and impact low plains. The land cover in Tongzhou District exhibits diversity, encompassing various land use types, including agriculture, forestry, urbanization, industrialization, transportation, and water resources [20]. According to available data [21], the land cover distribution in Tongzhou District is as follows: arable land covers 37.02%, orchards cover 3.81%, forests cover 8.62%, grassland covers 0.13%, urban and industrial land covers 33.43%, transportation land covers 5.31%, water resources and facilities cover 9.47%, and other land covers 2.21%. These surface characteristics and land use types provide essential baseline data and background information for soil type mapping in Tongzhou District. The district consists of 3 soil classes, 8 sub-classes, 13 soil orders, and 42 soil types, including Fluvo-aquic soil, Cinnamon soil, and Aeolian soil, with Fluvo-aquic soil being the dominant soil type in Tongzhou District (The soil types mentioned in the text are named according to the Chinese soil classification system [22]).

2.2. Data Sources and Processing

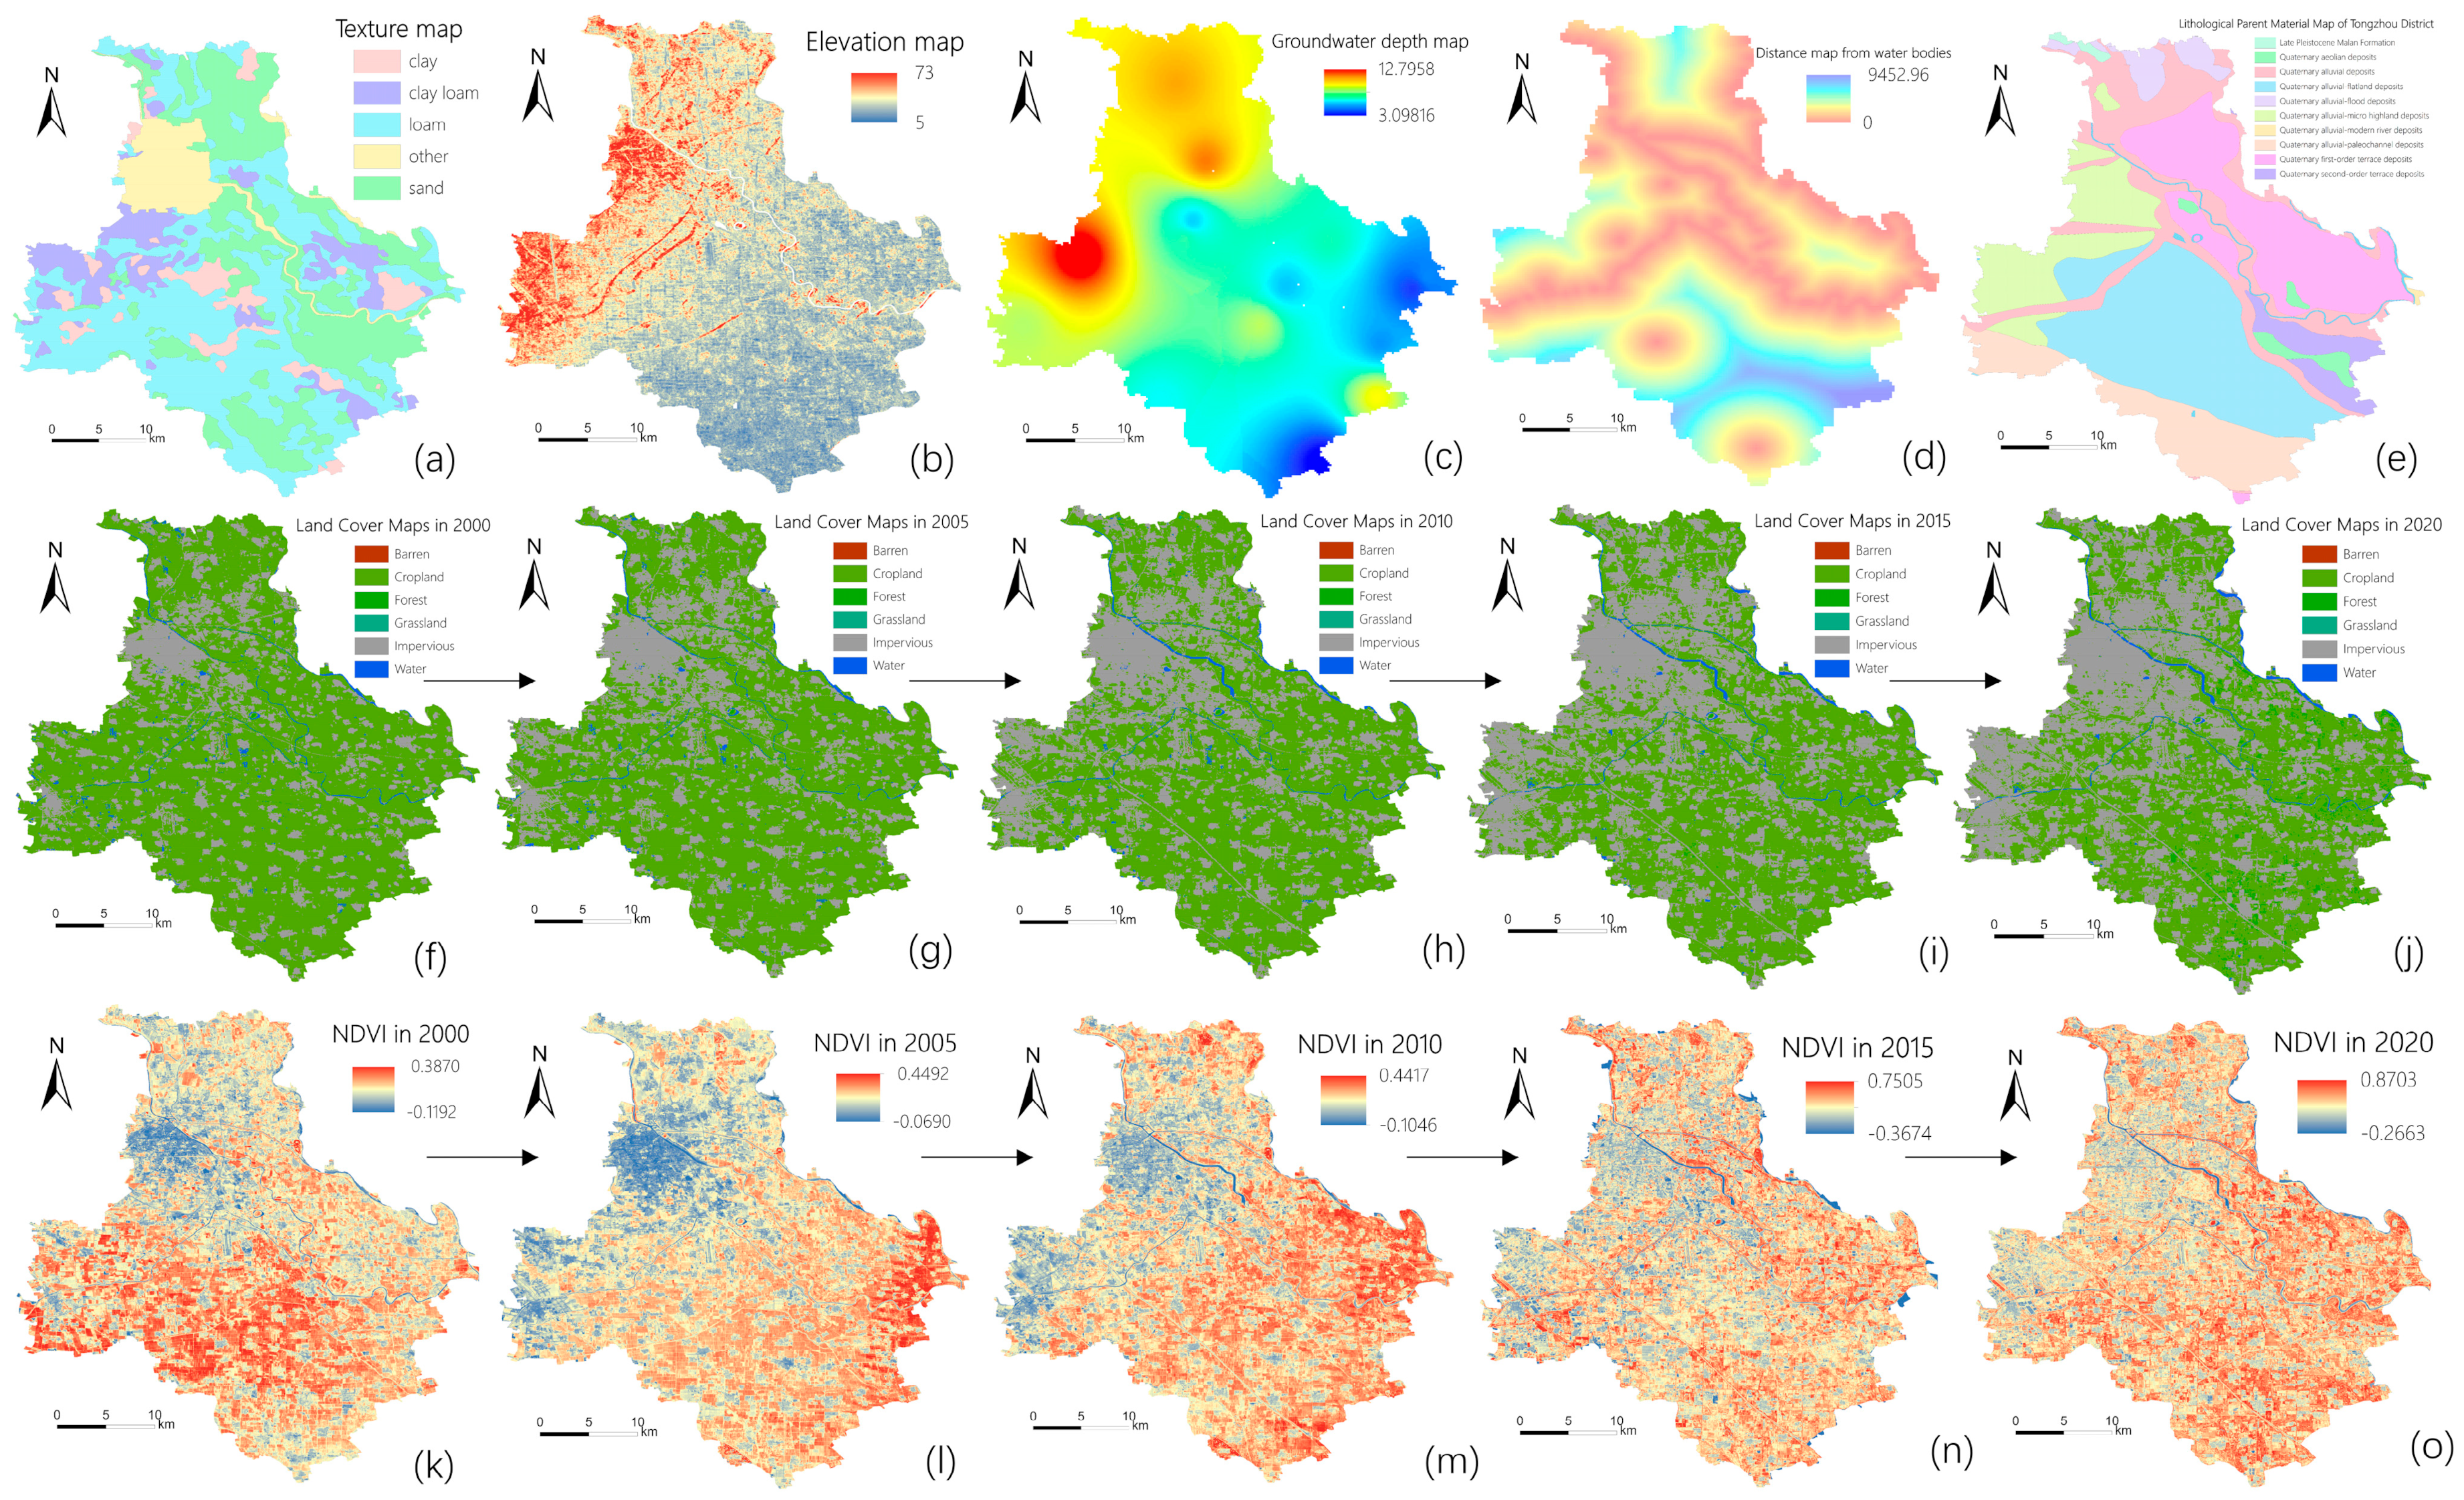
2.2.1. Handling Environmental Covariates

Environmental covariates can help explain the spatial distribution of soil properties [23]. By collecting and analyzing environmental factors related to soil properties, such as topography, climate, vegetation, and land cover, the associations between soil properties and these environmental factors can be revealed [24,25]. As shown in Figure 2, to ensure data consistency, this study selects factors such as parent material, groundwater depth, land cover type, distance to water bodies, texture, and elevation that have not undergone significant changes over the past 20 years as environmental covariates. Based on this, when conducting soil type mapping in different years in the study area, the corresponding NDVI and current land cover data are used for mapping, ensuring that the NDVI and land cover data are from the same data source to ensure the reliability and accuracy of the research results [26]. Among them, the calibration soil type map, texture, elevation, and distance to water bodies are derived from the dataset of the National Earth System Science Center, and the parent material information is obtained from 1:25,000 geological maps of the region. The groundwater monitoring results are sourced from the Water Authority of Tongzhou District, Beijing. The depth-to-groundwater data points are subjected to inverse distance interpolation to generate the groundwater depth map for Tongzhou District. NDVI data is derived from processed Landsat series data from Google Earth Engine (GEE) for the corresponding year, covering the entire year and undergoing a series of processing steps. The current land cover data are collected from stable samples extracted from the Chinese Land Use/Land Cover Dataset (CLULCD) using GEE, as well as visual interpretation samples from satellite time series data, Google Earth, and Google Maps. Multiple temporal indicators were constructed using all available Landsat data, and they were fed into a RF classifier in GEE to obtain the classification results. All the above data are processed with a resolution of 30 m to ensure the uniformity of the data.

2.2.2. The Section on Soil Sampling

Due to the use of conventional environmental covariate-assisted sampling methods that require real-time remote sensing data, the positions of sampling points may vary across different years [27,28,29]. To ensure data consistency, this study uses mixed sampling points, of which the vast majority are “virtual sampling points” extracted with the assistance of environmental covariates, while the rest are historical data collection points and field validation points. The “virtual sampling points” include purposive sampling points based on expert knowledge and typical environmental factor-assisted points. The field validation points include third national soil survey profile points and field validation points. Expert knowledge can provide prior information about the distribution of soil properties and, guided by expert experience and domain knowledge, enable the targeted selection of representative and critical sampling points, thus improving sampling efficiency and cost-effectiveness [30,31]. Therefore, this study chooses virtual sampling points, extracted with the assistance of expert knowledge, as the primary source of sampling points.

2.2.3. Source of Sampling Points

The calibrated soil type map was obtained by conducting indoor verification on theoriginal soil type map to address issues related to inconsistent names for the same soil and identical names for different soil. After overlaying the validated soil type map with the land cover map and image, the boundary divisions were further refined. In this study, a targeted sampling approach based on expert knowledge was employed, where the validated soil type map, current land cover map, and image map were overlaid. Soil experts, using their knowledge in soil science, made judgments based on the overlaid maps to identify virtual points that potentially represent regional environmental factors in the vicinity of the plot center. Leaf vein structures were used for point selection in large plots, ensuring that each plot obtained a representative virtual point for each soil type while guaranteeing a minimum of five virtual points per plot. Ultimately, 1564 virtual points representing plot characteristics were obtained after manual screening. In addition to these virtual points, other sources of sampling points included field validation points, third national soil survey profile points, historical data collection points, and typical environmental factor-assisted points. Typical environmental factor-assisted points were obtained by overlaying the input environmental covariates and mapping the distribution of typical ranges of each environmental covariate in the same geographic space. Then, the frequency distribution analysis of the environmental covariates was conducted after overlaying them with the validated indoor soil type map. The typical value ranges for each key environmental covariate were derived. After outputting the distribution areas or multiple patches of typical environmental conditions for each soil type, the center point of each patch was extracted as a typical point for that soil type, resulting in a total of 41 typical environmental factor-assisted points. The third national soil survey profile points referred to the profile points collected during the unified third national soil survey in China, totaling two points. Historical data collection points referred to 21 points obtained through the query and processing of soil data from books such as the Soil of Tong County, Soil Atlas of China, Soil of Beijing, and Soil Series of China (Beijing and Tianjin Volume). Field validation points were obtained by conducting field sampling in key areas of doubt to update the indoor validated soil type map, totaling 95 sampling points. As shown in Figure 1, the soil information from the validated soil type map was extracted based on the information of the sampling points to obtain the mapping points for this study.

2.3. Modeling and Mapping Methods

This study adopts the RF model for soil type mapping. RF is a machine learning algorithm based on ensemble learning, composed of multiple decision trees. Each decision tree is independently generated and increases the diversity of the model through random sampling with replacement and random feature selection on the input samples [32,33]. RF can handle missing data and effectively capture the complex non-linear relationships between soil properties and environmental factors. Its robustness allows it to handle outliers and noise, improving the stability and reliability of soil type mapping [34].
The RF modeling in this study was implemented by the R programming language. First, the required R packages, including raster, sp, randomForest, and caret, are loaded. Then the sample data is read, and the columns of id, soil type, longitude, and latitude are extracted. The soil type column is converted to a factor type. The gridded environmental covariates are read as a raster stack, and the values of covariates at the sample locations are extracted and added to the sample data. When constructing the random forest model, the train function is used, with the input including the soil type as the response variable and other covariates. The environmental raster stack is predicted using the trained model to obtain the soil type distribution map and the uncertainty map. To evaluate the model performance, training and test sets are created, models are built for each soil type using the training set, predictions are made on the test set, and the confusion matrix is constructed to obtain classification evaluation metrics.

2.4. Evaluation Methods for Mapping Results

The Confusion Matrix is a tool used in machine learning and statistics to evaluate the performance of classification models [35]. It visualizes and summarizes the relationship between the predicted results of a classification model and the true labels [36]. The Confusion Matrix and its derived evaluation metrics provide a comprehensive way to assess the performance of classification models. In soil type mapping, classification models such as random forest and support vector machine, implemented in R v4.1.2 and Python v3.8 software, are used to predict soil type in different regions, making the evaluation of classification model accuracy crucial for determining the correctness of soil type [37]. The following are derived evaluation metrics:
Precision is the most commonly used performance metric for classification. It represents the accuracy of the model, i.e., the number of correctly identified instances divided by the total number of samples. Generally, higher precision indicates better model performance [38].
Accuracy = (TP + TN)/(TP + FN + FP + TN)
Remark 1. 
True Positive (TP): The model correctly predicts positive instances as positive.
False Negative (FN): The model incorrectly predicts positive instances as negative.
False Positive (FP): The model incorrectly predicts negative instances as positive.
True Negative (TN): The model correctly predicts negative instances as negative.
In statistics, a Confidence Interval (CI) is used to estimate the range of a population parameter, and the 95% CI is a commonly used interval [39]. A 95% CI indicates a 95% confidence level for the estimated parameter, meaning that, in repeated sampling, about 95% of the confidence intervals will contain the true parameter value. It is expressed as follows:
95 %   CI = μ 1.96 × σ n ,   μ + 1.96 × σ n
Remark 2. 
where μ is the mean, σ is the standard deviation, and n is the sample size of a single experiment.
No Information Rate (NIR), also known as the baseline accuracy or random accuracy, refers to the accuracy achieved when making predictions based solely on the majority class in a classification task [40]. NIR is useful in evaluating classification models because it provides a baseline reference for comparing whether the model’s accuracy has substantially improved. If the model’s accuracy is significantly lower than the NIR, further model optimization or the consideration of improved data processing methods may be necessary to enhance the model’s performance.
p-Value [Acc > NIR] refers to the probability of the observed accuracy being significantly higher than the NIR when conducting a hypothesis test. p-Value is a statistical measure used to assess the significance of the difference between the observed sample data or statistics and the null hypothesis under the assumption that the null hypothesis is true [41]. If the p-Value is smaller than a pre-defined significance level (usually 0.05), the null hypothesis can be rejected, and it can be concluded that the accuracy is significantly higher than the NIR. Conversely, if the p-Value is greater than the significance level, the null hypothesis cannot be rejected, indicating that the difference between the accuracy and the NIR may be due to random factors rather than a true improvement in model performance [42].
Kappa (Cohen’s Kappa) is a statistical measure used to assess the performance of a classification model, particularly for evaluating the consistency between observers or the consistency between a model and observers in a classification task [43]. The formula is as follows:
K = p o p e 1 p e
Remark 3. 
Where  p o  is the sum of the number of correctly classified samples for each class divided by the total number of samples, representing the overall classification accuracy.
p o = i = 1 C T i n
p e = i = 1 C a i × b i n 2
Remark 4. 
Where C is the total number of categories, T i  represents the number of samples correctly classified for each category, a i  represents the number of true samples for each category, b i  represents the number of predicted samples for each category, and n is the total number of samples.

3. Results

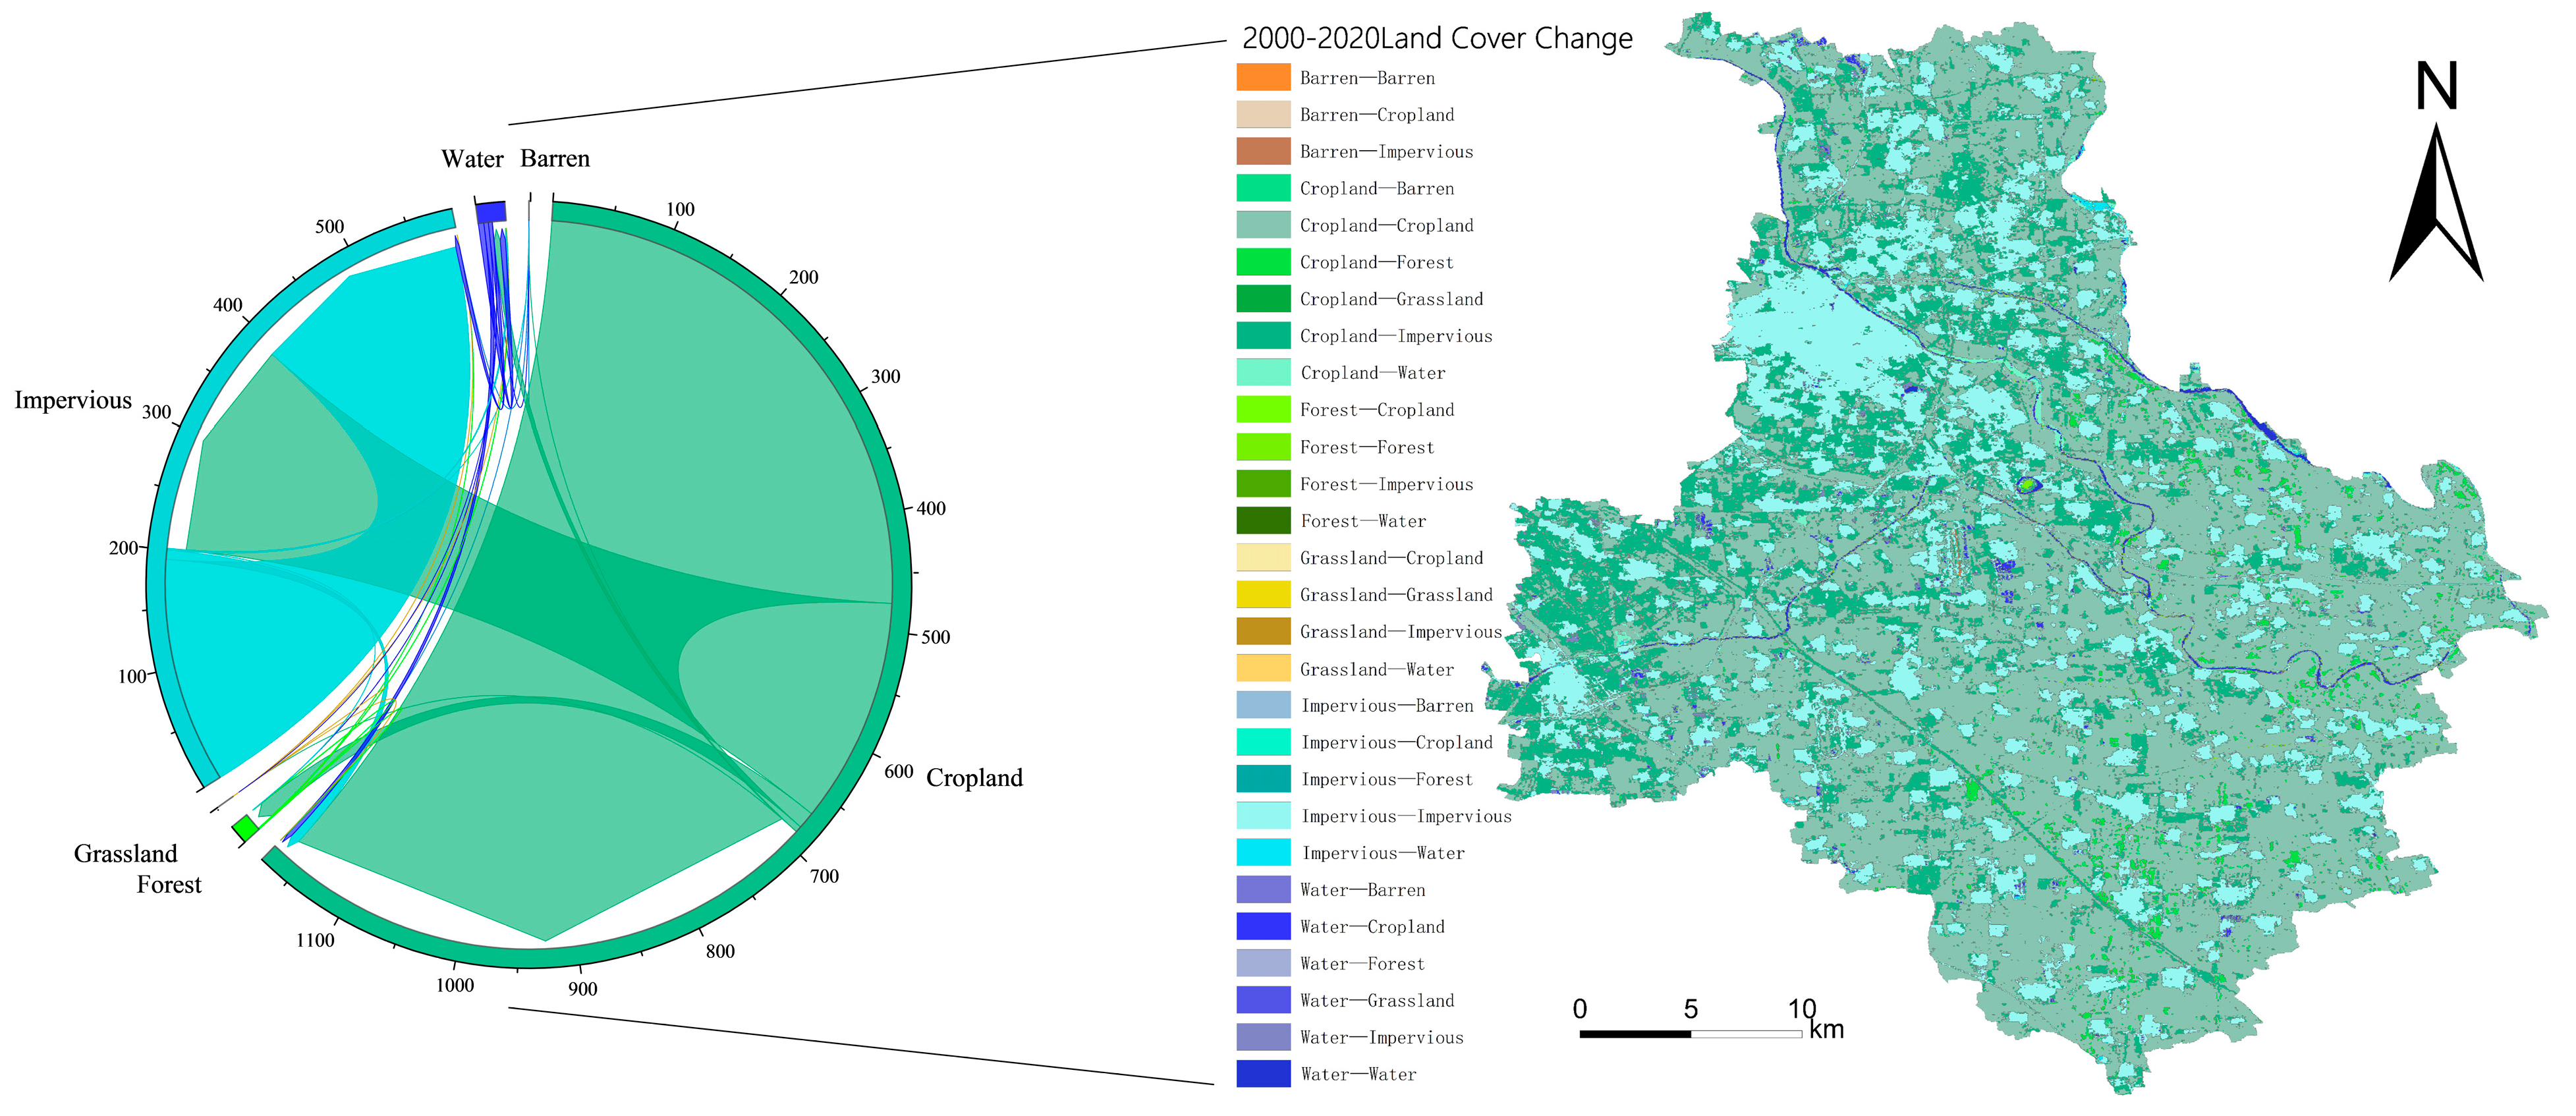
3.1. Analysis of Land Cover Changes

Since the reform and opening up, China has undergone rapid development, and the highly accessible plain areas have experienced significant land cover changes under human influence. As one of the key sub-centers of Beijing, Tongzhou District has expanded rapidly over the past 20 years. With the increase in population and limited land resources in the central urban areas of Beijing, Tongzhou District has become an important area for urbanization in Beijing [44]. The government has increased investment in urban planning and infrastructure construction in Tongzhou District, promoting its urbanization process. As shown in Figure 3, a large area of cropland in the western part of Tongzhou District has been transformed into urban area during the 20 year urbanization process, and the new urban areas have become connected to the main urban areas. Although there has been some expansion of built-up areas in the eastern part, the overall change is not significant.
As indicated in Table 1, cropland is the largest land type in Tongzhou District and maintains a leading position in terms of overall quantity. Although the cropland area has decreased by about 29% in the past 20 years, it remains the primary land type in Tongzhou District. The area of impervious surfaces has significantly increased over the past 20 years, from approximately 201.12 km2 in 2000 to around 387.33 km2 in 2020, showing a growth of 92.59%. This increase is mainly due to the conversion of cropland, reflecting the rapid development of urbanization in Tongzhou District. The forest area has increased from approximately 1.09 km2 in 2000 to around 14.98 km2 in 2020. This indicates that Tongzhou District has been working on protecting and increasing green spaces. The overall changes in other land types are not significant, showing no clear trend of growth or decline. The areas of these land types have remained relatively stable over the past 20 years. In summary, the land cover changes in Tongzhou District over the past 20 years have shown a trend of decreasing cropland, increasing impervious surfaces, and increasing forest areas. This reflects the impact of urbanization on land use and indicates that Tongzhou District has made efforts and achievements in pursuing sustainable development and building a green and ecological city.

3.2. Soil type Prediction Mapping and Accuracy Analysis in Different Years

According to Table 2, the accuracy varies among different years but remains at a relatively high level. Normalized Improvement Ratio (NIR) represents the accuracy of predicting classifications without any classification information. In this case, the NIR is 0.1871, indicating that the proportion of accurately predicted classifications, based solely on prior probabilities, is 0.1871. This suggests that the inclusion of environmental covariates effectively improves the predictive ability of the model, demonstrating a significant impact of the selected environmental covariates on soil formation. The p-value [Acc > NIR] < 2.2 × 10⁻¹⁶ indicates that the actual accuracy is significantly higher than the accuracy based solely on prior probabilities, and the difference is highly significant. This confirms that the difference between accuracy and NIR is not due to random factors but, rather, reflects a genuine improvement in model performance.
In terms of trends, Tongzhou District has experienced an increasing level of land use intensity during the urbanization process. The impervious area has nearly doubled, and the Kappa value of the soil type map has also increased, indicating an improvement in the consistency of soil type map classification during this period. The accuracy has increased from 58.99% in 2000 to 66.91% in 2020. The 95% CI represents the range of uncertainty for estimating accuracy. Each confidence interval is a range, with the lower and upper limits representing the estimated lower and upper bounds of accuracy. To avoid the influence of chance and randomness, the observation of the 95% CI intervals reveals that the overall accuracy of the soil type map is also on an upward trend. This suggests a positive correlation between land use intensity and soil type mapping accuracy. As the land use intensity in the study area strengthens, the accuracy of soil type mapping in the study area will also increase. This is because human activities tend to develop land in a way that is most suitable for human use, and the utilization patterns indirectly reflect the properties of the soil, which are ultimately manifested in land cover. Table 2 shows an index table of soil type maps in different years.
Soil type change in this study is defined as transitions of dominant soil type within the same region over the 20 year period. The soil type change map (Figure 4) shows that the soil type changes were primarily concentrated in the urban regions of Tongzhou District, indicating the influence of human activities on soil evolution. In most of the remaining area, the dominant soil type remained relatively stable during the study period. Overall, the epicenter of the changing areas is located in the western part of Tongzhou District. This is because the western region is closer to the center of Beijing, and it was the first to be affected by urban expansion. In the past 20 years, the government has continuously enhanced the utilization capacity of land [45]. For suitable arable land, the government designates the areas as cropland, while for unsuitable soil, such as sandy soil and marshy soil, reasonable transformation measures have been taken to better serve urban development [46]. In the process of historical evolution, the sandy soil areas have been largely afforested and transformed into forest land, which helps prevent sand erosion and improve land quality. The former marshy areas have been completely integrated into the urban area through land leveling and other engineering measures. These examples demonstrate that soil type changes in Tongzhou District are influenced, to some extent, by human activities, especially urban expansion and adjustments in land use policies. By transforming and utilizing different soil types, the government adapts to the needs of urban development and improves land utilization efficiency. These efforts contribute to the protection of land resources, the improvement of the ecological environment, and support for sustainable urban development. It also reflects the trend of soil cover changes influencing soil type changes under human influence.

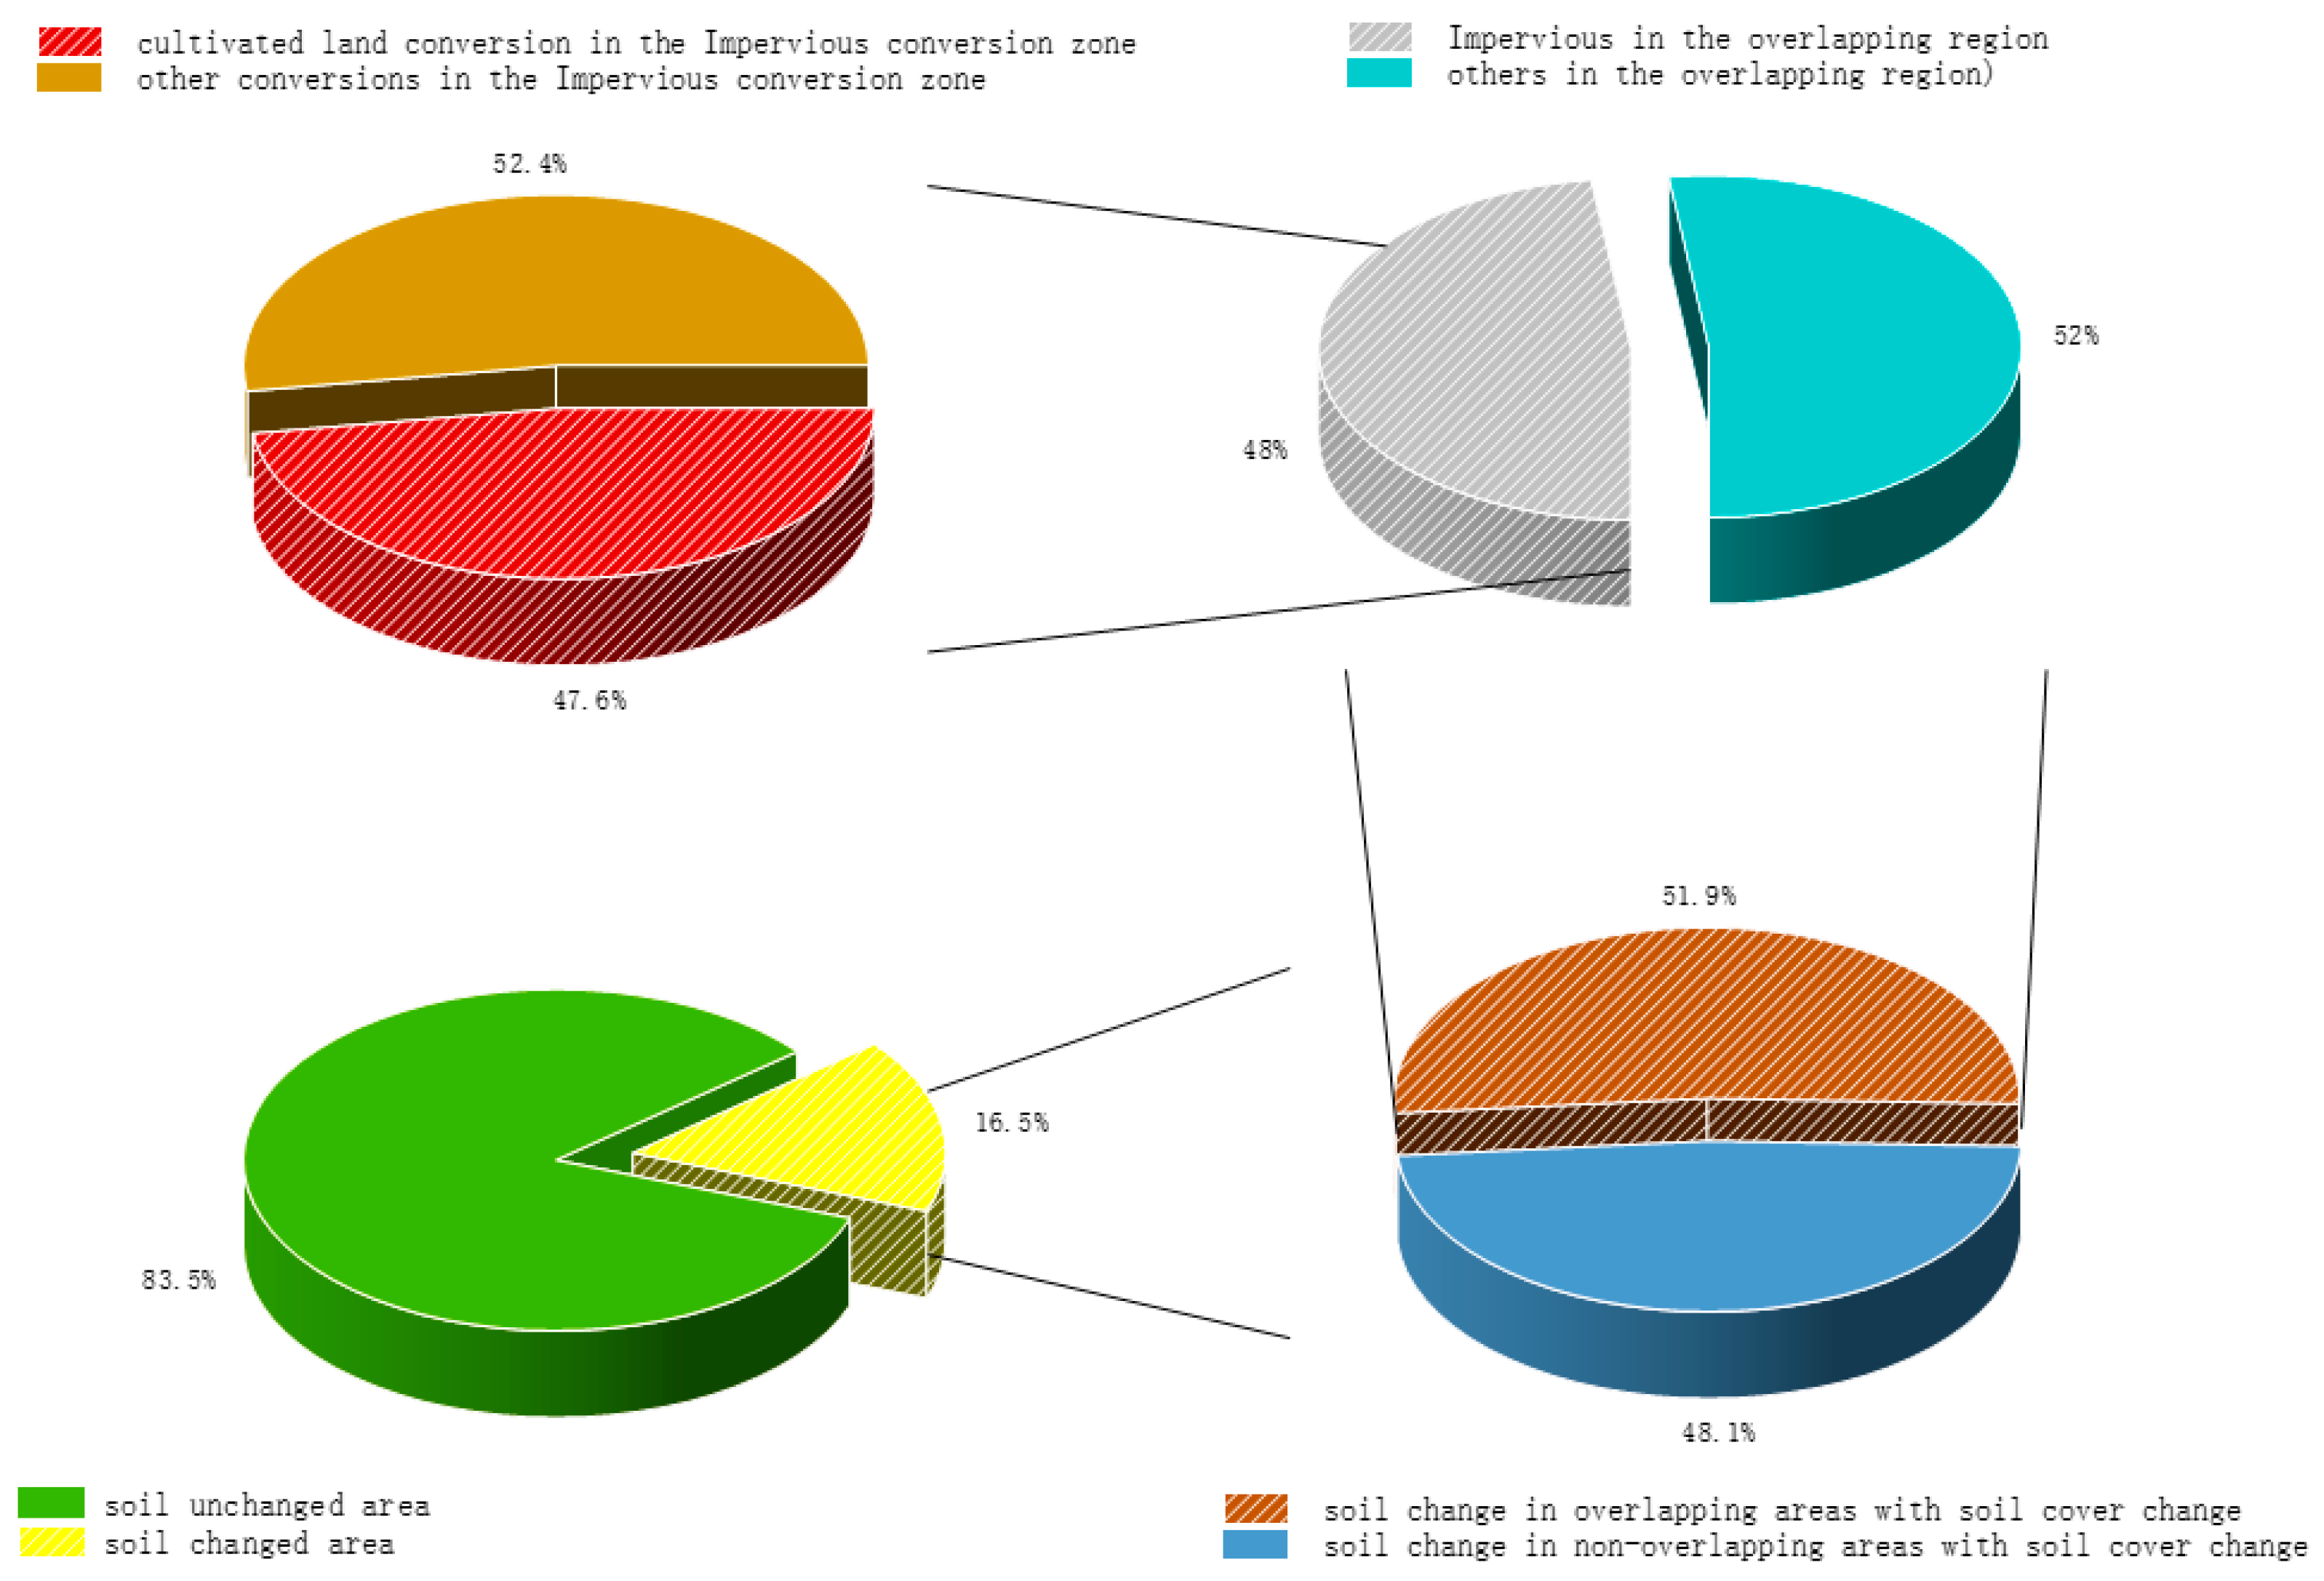
3.3. Coupling Analysis of Land Cover Changes and Soil type Changes in the Same Space

According to Figure 5, analyzing from the same spatial location, the soil type change area in Tongzhou District, from 2000 to 2020, accounts for 16.5% of the total area. Overall, there have not been significant changes in soil type, and most of the soil type has remained relatively stable. However, among the 16.5% of soil areas that experienced type changes, 51.9% of the areas overlap with land cover change areas, indicating a certain degree of synergy between land cover change and soil type change, suggesting that changes in land cover have influenced soil type. Further observation of the overlapping areas reveals that 48% of the changes are related to the changes in impervious areas. Impervious areas are typically the focus of human activities and show significant soil modifications. Therefore, nearly half of the overlapping areas are associated with changes in built-up areas, demonstrating the significant impact of construction and redevelopment on changes in soil type. Additionally, it is worth noting that, among all the land cover types transitioning to impervious, cropland accounts for 47.6%. This means that a portion of land previously used for agricultural cultivation has been converted into built-up areas, and the remaining 52.4% mostly consists of pre-existing impervious areas, indicating that Tongzhou District has primarily chosen agricultural land parcels for urban expansion during its development. These findings indicate the coupling between land cover change and soil type change. The conversion of cropland to impermeable surfaces represents a considerable proportion. These findings emphasize the significant influence of human activities on soil type change and highlight the importance of considering soil conservation and sustainable utilization in urban development and land use planning.

3.4. Analysis of Proportional Changes in Soil Type within Cropland over a 20-Year Period

Cropland is the foundation of agricultural production, and it directly relates to food security, human survival, and development. It is also an important component of ecosystems, contributing to maintaining healthy soil and the sustainable utilization of water resources [47,48]. As shown in Figure 6, analyzing from the perspective of cropland, it can be observed that the quantity of cropland decreased by approximately 29% over the 20 year period, but the main soil type of cropland remained almost unchanged. Sandy loam calcareous fluvo-aquic soil and Light loam calcareous fluvo-aquic soil accounted for almost half of the cropland’s soil type, and their proportion increased during the evolution of the total cropland quantity reduction over the 20 year period. This is because Sandy loam calcareous fluvo-aquic soil is widely distributed in Tongzhou District, and it is more likely to be utilized by farmers. Light loam calcareous fluvo-aquic soil has moderate permeability, strong capillary force, and certain drought resistance [49]. It is rich in soil nutrients and has good soil structure, allowing for the coordinated development of water, nutrients, gases, and heat factors within the soil, thus exhibiting a high level of fertility suitable for high-yield crop growth [50]. Under the influence of human activities, the soil type of cropland gradually approach suitable types for cultivation. On one hand, farmers choose suitable land for cultivation, and on the other hand, land engineering transforms cropland soil into a suitable soil structure for cultivation [51,52]. Human activities and environmental changes are the direct factors leading to land cover changes, and land cover changes can directly and indirectly impact soil type changes. Taking cropland as an example, human activities act on cropland, causing its soil type to transition towards suitable types for cultivation, and over time, more soil types suitable for cultivation are used for cropland. This direct factor leads to changes in land cover, reflecting the coupling between land cover and soil type changes.

4. Discussion

The innovation of this study lies in the use of expert knowledge-assisted sampling methods to improve the consistency of sampling in different years, as well as the use of corresponding NDVI and land use types as covariates, according to the year, to ensure the reliability of the results. In addition, this study also uses the random forest model to model and predict soil type, which fully taps the complex nonlinear relationships between various environmental covariates and soil formation, making soil type prediction more accurate.
Tongzhou District, Beijing, China, as the study area, is representative in plain regions for its diverse land use types, conflicts between agriculture and urbanization, human impacts on land cover, and variability of soil types [53]. Taking Tongzhou District in Beijing as an example, this study comprehensively revealed the evolution of land use changes and soil type mapping in plain areas over the past 20 years. The results show that, with the strengthening of land use intensity in the study area, the accuracy of soil type mapping also increases. This provides a scientific basis for further exploring the driving factors of land use changes on soil type changes, and it guides plain areas in Beijing to improve the accuracy of soil type prediction by optimizing land use structure. Further studies can be conducted to explore the driving factors of land cover impacts on soil type changes based on this [54,55]. To address the issue of low credibility of soil type mapping in plain areas, land cover-related environmental covariates can be considered in areas with high land use intensity [56]. Meanwhile, high-resolution remote sensing data and ground-based observations can also be introduced to improve the accuracy and details of soil type mapping [57].
The study found that land cover changes can alter soil type distribution, which is mainly attributable to policy orientation and economic development trends [58,59]. For example, the large-scale conversion of cropland to construction land in Tongzhou District has led to significant changes in the distribution of Cinnamon soil and Aeolian soil. These soil type changes may have certain impacts on agricultural production. Future studies can continue to focus on the impacts of soil type changes, caused by different land use transformations, on crop yield and quality to further clarify the impacts of soil type changes on agricultural production and provide the basis for land use management.

5. Conclusions

Based on the analysis and results of this study, the following conclusions can be drawn for the plain regions:
  • With the construction land area in Tongzhou District nearly doubling, about 29% of the cultivated land has been transformed into construction land, and the overall accuracy of soil type prediction has also increased from 58.99% to 66.91%, illustrating that enhancing land use intensity can improve soil prediction accuracy.
  • While human activities influence land cover changes, land cover also affects and reveals soil type changes. Human activities tend to lead land use towards suitable soil types, and soil types guide human activities towards maximizing the value of land use.
  • There is a coupling relationship between land cover change and soil type change. This study found that about 51.9% of the soil type change areas in Tongzhou District were spatially consistent with the land use change areas in the same period, among which the change of Cinnamon soil was the most significant, indicating that urban expansion was the key factor leading to these soil type changes.

Author Contributions

Conceptualization, X.W. and K.W.; methodology, K.W.; software, X.W.; validation, Z.Z., X.W. and H.Z.; formal analysis, H.Z.; investigation, S.H.; resources, K.W.; data curation, X.W.; writing—original draft preparation, X.W.; writing—review and editing, X.W.; visualization, X.W.; supervision, K.W.; project administration, K.W.; funding acquisition, K.W. All authors have read and agreed to the published version of the manuscript.

Funding

This study was supported by the National Natural Science Foundation of China (42171261).

Data Availability Statement

The data presented in this study are available on request from the corresponding author.

Acknowledgments

We would like to express our gratitude to Long Kang from China University of Geosciences (Beijing) for the valuable suggestions provided on the manuscript. We also extend our appreciation to the journal’s editors and anonymous reviewers for their constructive feedback, which significantly enhanced the quality of the paper.

Conflicts of Interest

The authors declare no conflict of interest.

References

  1. McBratney, A.; Field, D.J.; Koch, A. The dimensions of soil security. Geoderma 2014, 213, 203–213. [Google Scholar] [CrossRef]
  2. Adhikari, K.; Hartemink, A.E. Linking soils to ecosystem services—A global review. Geoderma 2016, 262, 101–111. [Google Scholar] [CrossRef]
  3. Zhu, A.X.; Liu, F.; Li, B.; Pei, T.; Qin, C.; Liu, G.; Wang, Y.; Chen, Y.; Ma, X.; Qi, F.; et al. Differentiation of Soil Conditions over Low Relief Areas Using Feedback Dynamic Patterns. Soil Sci. Soc. Am. J. 2010, 74, 861–869. [Google Scholar] [CrossRef]
  4. Liu, F.; Geng, X.; Zhu, A.X.; Fraser, W.; Waddell, A. Soil texture mapping over low relief areas using land surface feedback dynamic patterns extracted from MODIS. J. Geoderma 2012, 171, 44–52. [Google Scholar] [CrossRef]
  5. Zhao, M.S.; Rossiter, D.G.; Li, D.C.; Zhao, Y.G.; Liu, F.; Zhang, G.L. Mapping soil organic matter in low-relief areas based on land surface diurnal temperature difference and a vegetation index. J. Ecol. Indic. 2014, 39, 120–133. [Google Scholar] [CrossRef]
  6. Hengl, T.; Toomanian, N.; Reuter, H.I.; Malakouti, M.J. Methods to Interpolate Soil Categorical Variables from Profile Observations: Lessons from Iran. Geoderma 2007, 140, 417–427. [Google Scholar] [CrossRef]
  7. Hengl, T.; Heuvelink, G.B.M.; Stein, A. A generic framework for spatial prediction of soil variables based on regression kriging. Geoderma 2004, 120, 75–93. [Google Scholar] [CrossRef]
  8. Adugna, A.; Abegaz, A. Effects of land use changes on the dynamics of selected soil properties in northeast Wellega, Ethiopia. Soil 2016, 2, 63–70. [Google Scholar] [CrossRef]
  9. Zhang, L.; Zhen, Q.; Cheng, M.; Ouyang, Z. The Main Drivers of Wetland Changes in the Beijing-Tianjin-Hebei Region. Int. J. Environ. Res. Public Health 2019, 16, 2619. [Google Scholar]
  10. McBratney, A.B.; Mendonça Santos, M.L.; Minasny, B. On Digital Soil Mapping. Geoderma 2003, 117, 3–52. [Google Scholar] [CrossRef]
  11. Chen, S.; Mulder, V.L.; Heuvelink, G.B.; Poggio, L.; Caubet, M.; Dobarco, M.R.; Walter, C.; Arrouays, D. Model averaging for mapping topsoil organic carbon in France. Geoderma 2020, 366, 114237. [Google Scholar] [CrossRef]
  12. Ahmad, S.; Kalra, A.; Stephen, H. Estimating soil moisture using remote sensing data: A machine learning approach. Adv. Water Resour. 2010, 33, 69–80. [Google Scholar] [CrossRef]
  13. Taghizadeh-mehrjardi, R.; Schmidt, K.; Zeraatpisheh, M.; Behrens, T. Soil organic carbon mapping using state-of-the-art machine learning algorithms and deep neural networks in different climatic regions of Iran. Geophys. Res. Abstr. 2019, 21, 1164573. [Google Scholar]
  14. Baltensweiler, A.; Walthert, L.; Hanewinkel, M.; Zimmermann, S.; Nussbaum, M. Machine learning based soil maps for a wide range of soil properties for the forested area of Switzerland. Geoderma Reg. 2021, 27, e00437. [Google Scholar] [CrossRef]
  15. Zhang, J.; Schmidt, M.; Heung, B.; Bulmer, C.; Knudby, A. Using an ensemble learning approach in digital soil mapping of soil pH for the Thompson-Okanagan region of British Columbia. Can. J. Soil Sci. 2022, 102, 579–596. [Google Scholar] [CrossRef]
  16. Zhang, Z.; Zhang, H.; Xu, E. Enhancing the digital mapping accuracy of farmland soil organic carbon in arid areas using agricultural land use history. J. Clean Prod. 2022, 334, 130232. [Google Scholar] [CrossRef]
  17. Taveira, L.R.S.; de Menezes, M.D.; dos Santos Teixeira, A.F.; Curi, N. Mapping land use capability in tropical conditions adapting criteria to different levels of agricultural management. J. Ciência Agrotecnol. 2018, 42, 631–642. [Google Scholar] [CrossRef]
  18. Skaloš, J.; Engstová, B. Methodology for mapping non-forest wood elements using historic cadastral maps and orthophoto maps as a basis for management. J. Environ. Manag. 2010, 91, 831–843. [Google Scholar] [CrossRef]
  19. Cui, L.; Wang, J.; Sun, L.; Lv, C. Construction and optimization of green space ecological networks in urban fringe areas: A case study with the urban fringe area of Tongzhou district in Beijing. J. Clean Prod. 2020, 276 Pt 2, 124266. [Google Scholar] [CrossRef]
  20. Dai, L.L.; Zhan, Z.X.; Shu, Y.S.; Rong, X. Land Use Change in the Cross-Boundary Regions of a Metropolitan Area: A Case Study of Tongzhou-Wuqing-Langfang. Land 2022, 11, 153. [Google Scholar] [CrossRef]
  21. Adhikari, K.; Hartemink, A.E.; Minasny, B.; Bou Kheir, R.; Greve, M.B.; Greve, M.H. Digital Mapping of Soil Organic Carbon Contents and Stocks in Denmark. PLoS ONE 2014, 9, e105519. [Google Scholar] [CrossRef] [PubMed]
  22. Chinese Soil Taxonomy Research Group. Keys to Chinese Soil Taxonomy, 3rd ed.; University of Science and Technology of China Press: Hefei, China, 2001. [Google Scholar]
  23. Telak, L.J.; Pereira, P.; Bogunovic, I. Management and seasonal impacts on vineyard soil properties and the hydrological response in continental Croatia. Catena 2021, 202, 105267. [Google Scholar] [CrossRef]
  24. Piikki, K.; Wetterlind, J.; Söderström, M.; Stenberg, B. Perspectives on validation in digital soil mapping of continuous attributes—A review. Soil Use Manag. 2021, 37, 7–21. [Google Scholar] [CrossRef]
  25. Dong, Z.Y.; Wang, Z.M.; Liu, D.W.; Song, K.S.; Ding, Z. Mapping wetland areas using Landsat-derived NDVI and LSWI: A case study of West Songnen Plain, Northeast China. J. Indian Soc. Remot. 2014, 42, 569–576. [Google Scholar] [CrossRef]
  26. Yang, J.; Huang, X. The 30 m annual land cover dataset and its dynamics in China from 1990 to. J. Earth Syst. Sci. Date 2019, 13, 3907–3925. [Google Scholar] [CrossRef]
  27. Yang, L.; Li, X.; Shi, J.; Shen, F.; Zhou, C. Evaluation of conditioned Latin hypercube sampling for soil type mapping based on a machine learning method. J. Geoderma 2020, 369, 114337. [Google Scholar] [CrossRef]
  28. Wang, B.; Waters, C.; Orgill, S.; Gray, J.; Cowie, A.; Clark, A.; Liu, D.L. High resolution mapping of soil organic carbon stocks using remote sensing variables in the semi-arid rangelands of eastern Australia. Sci. Total Environ. 2018, 630, 367–378. [Google Scholar] [CrossRef] [PubMed]
  29. Miller, B.A.; Koszinski, S.; Wehrhan, M.; Sommer, M. Comparison of spatial association approaches for landscape mapping of soil organic carbon stocks. J. Soil. 2015, 1, 217–233. [Google Scholar] [CrossRef]
  30. Song, X.; Liu, F.; Zhang, G.; Li, D.; Zhao, Y.; Yang, J. Mapping Soil Organic Carbon Using Local Terrain Attributes: A Comparison of Different Polynomial Models. Pedosphere 2017, 27, 681–693. [Google Scholar] [CrossRef]
  31. Ng, W.; Minasny, B.; Mendes, W.D.S.; Demattê, J.A.M. The influence of training sample size on the accuracy of deep learning models for the prediction of soil properties with near-infrared spectroscopy data. Soil 2020, 6, 565–578. [Google Scholar] [CrossRef]
  32. Speiser, J.L.; Miller, M.E.; Tooze, J.; Ip, E. A comparison of random forest variable selection methods for classification prediction modeling. Expert Syst. Appl. 2023, 134, 93–101. [Google Scholar] [CrossRef] [PubMed]
  33. Moller, A.B.; Beucher, A.; Pouladi, N.; Greve, M.H. Oblique geographic coordinates as covariates for digital Soil type mapping. Soil 2019, 6, 269–289. [Google Scholar] [CrossRef]
  34. Abowarda, A.S.; Bai, L.; Zhang, C.; Long, D.; Sun, Z. Generating surface soil moisture at 30 m spatial resolution using both data fusion and machine learning toward better water resources management at the field scale. J. Remote Sens. Environ. 2021, 255, 112301. [Google Scholar] [CrossRef]
  35. Sun, H.W.D. Assessment of landslide susceptibility mapping based on Bayesian hyperparameter optimization: A comparison between logistic regression and random forest. J. Eng. Geol. 2021, 281, 105972. [Google Scholar] [CrossRef]
  36. Florinsky, I.V.; Eilers, R.; Manning, G.; Fuller, L.G. Prediction of soil properties by digital terrain modelling. Environ. Model. Softw. 2002, 17, 295–311. [Google Scholar] [CrossRef]
  37. Wadoux, A.M.J.C.; Minasny, B.; McBratney, A.B. Machine Learning for Digital Soil Mapping: Applications, Challenges and Suggested Solutions. Earth-Sci. Rev. 2020, 210, 103359. [Google Scholar] [CrossRef]
  38. Khaledian, Y.; Miller, B.A. Selecting Appropriate Machine Learning Methods for Digital Soil Mapping. Appl. Math. Model. 2020, 81, 401–418. [Google Scholar] [CrossRef]
  39. Ping, J.L.; Dobermann, A. Variation in the precision of soil organic carbon maps due to different laboratory and spatial prediction methods. Soil Sci. 2006, 171, 374–387. [Google Scholar]
  40. Gholizadeh, A.; Žižala, D.; Borůvka, L. Soil organic carbon and texture retrieving and mapping using proximal, airborne and Sentinel-2 spectral imaging. J. Remote Sens. Environ. 2018, 218, 89–103. [Google Scholar] [CrossRef]
  41. Davies, M.M.; Van Der Laan, M.J. Optimal Spatial Prediction Using Ensemble Machine Learning. Int. J. Biostat. 2016, 12, 179–201. [Google Scholar] [CrossRef]
  42. Feyisa, G.L.; Meilby, H.; Fensholt, R.; Proud, S.R. Automated Water Extraction Index: A new technique for surface water mapping using Landsat imagery. J. Remote Sens. Environ. 2014, 140, 23–35. [Google Scholar] [CrossRef]
  43. Bogunovic, I.; Pereira, P.; Kisic, I.; Sajko, K.; Sraka, M. Tillage management impacts on soil compaction, erosion and crop yield in Stagnosols (Croatia). Catena 2018, 160, 376–384. [Google Scholar] [CrossRef]
  44. Song, W.; Li, H. Spatial pattern evolution of rural settlements from 1961 to 2030 in Tongzhou District, China. J. Land Use Policy 2020, 99, 105044. [Google Scholar] [CrossRef]
  45. Xue, Y. Spatial accessibility between commercial and ecological spaces: A case study in Beijing, China. Open Geosci. 2023, 14, 264–274. [Google Scholar] [CrossRef]
  46. Lu, Q.; Chang, N.B.; Joyce, J. Predicting long-term urban growth in Beijing (China) with new factors and constraints of environmental change under integrated stochastic and fuzzy uncertainties. J. Stoch. Environ. Res. Risk A 2017, 32, 2025–2044. [Google Scholar] [CrossRef]
  47. Zhou, Y.; Li, X.; Liu, Y. Cultivated land protection and rational use in China. J. Land Use Policy 2021, 106, 105454. [Google Scholar] [CrossRef]
  48. Liu, Y.; Zhou, Y. Reflections on China’s food security and land use policy under rapid urbanization. J. Land Use Policy 2021, 109, 105699. [Google Scholar] [CrossRef]
  49. Aitkenhead, M.J.; Coull, M.C. Mapping Soil Carbon Stocks across Scotland Using a Neural Network Model. Geoderma 2016, 262, 187–198. [Google Scholar] [CrossRef]
  50. Ding, S.; Xin, X.; Yang, W.; Zhang, X.; Zhu, A.; Huang, S.; Yang, J.; Ren, G.; Li, M. Transformation of fertilizer nitrogen in fluvo-aquic soils with different textures and its influencing factors. J. Plant Soil 2022, 471, 541–558. [Google Scholar] [CrossRef]
  51. Özşahin, E.; Eroğlu, İ. Soil erosion risk assessment due to land use/cover changes (LUCC) in Bulgaria from 1990 to 2015. Alınteri Zirai Bilim. Derg. 2019, 34, 1–8. [Google Scholar] [CrossRef]
  52. Shen, X.; Wang, L.; Yang, Q.; Xiu, W.; Li, G.; Zhao, J.; Zhang, G. Dynamics of Soil Organic Carbon and Labile Carbon Fractions in Soil Aggregates Affected by Different Tillage Managements. Sustainability 2021, 13, 1541. [Google Scholar] [CrossRef]
  53. Li, H.; Song, W. Evolution of rural settlements in the Tongzhou District of Beijing under the new-type urbanization policies. J. Habitat Int. 2020, 101, 102198. [Google Scholar] [CrossRef]
  54. Zhou, T.; Geng, Y.; Chen, J.; Pan, J.; Haase, D.; Lausch, A. High-resolution digital mapping of soil organic carbon and soil total nitrogen using DEM derivatives, Sentinel-1 and Sentinel-2 data based on machine learning algorithms. Sci. Total Environ. 2020, 729, 138244. [Google Scholar] [CrossRef] [PubMed]
  55. da Silva Changas, C.; De Carvalho, W., Jr.; Bhering, S.; Filho, B.C. Spatial prediction of soil surface texture in a semiarid region using random forest and multiple linear regressions. Catena 2016, 139, 232–240. [Google Scholar]
  56. Mosleh, Z.; Salehi, M.H.; Jafari, A.; Borujeni, I.E.; Mehnatkesh, A. The effectiveness of digital soil mapping to predict soil properties over low-relief areas. Environ. Monit. Assess. 2016, 188, 195. [Google Scholar] [CrossRef] [PubMed]
  57. Yang, Y.; Zhang, S.; Liu, Y.; Xing, X.; De Sherbinin, A. Analyzing historical land use changes using a historical land use reconstruction model: A case study in Zhenlai County, northeastern China. Sci. Rep. 2017, 7, 41275. [Google Scholar] [CrossRef] [PubMed]
  58. Valkanou, K.; Karymbalis, E.; Bathrellos, G.; Skilodimou, H.; Tsanakas, K.; Papanastassiou, D.; Gaki-Papanastassiou, K. Soil Loss Potential Assessment for Natural and Post-Fire Conditions in Evia Island, Greece. Geoscience 2022, 12, 367. [Google Scholar] [CrossRef]
  59. Zhang, Y.; Xu, C.; Xia, M. Can Land Consolidation Reduce the Soil Erosion of Agricultural Land in Hilly Areas? Evidence from Lishui District, Nanjing City. Land 2021, 10, 502. [Google Scholar] [CrossRef]
Figure 1. Study Area and Soil Samples (Sampling Point Locations with Calibration Soil type Map as the Base Map).
Land 12 01696 g001
Figure 2. A set of environmental covariates Images (ae) that represent the texture map, elevation map, groundwater depth map, distance from water bodies map, and parent material map, respectively. Images (fj) depict land cover maps for every 5 year interval from 2000 to 2020, while images (ko) represent NDVI maps for the same time period.
Land 12 01696 g002
Figure 3. Trend of land cover changes in Tongzhou District from 2000 to 2020.
Land 12 01696 g003
Figure 4. Soil type change trend in Tongzhou District. ((ae) represent soil prediction maps for every 5 years from 2000 to 2020, while (f) shows the soil type change regions in Tongzhou District from 2000 to 2020. Due to the large number of soil types (42) in Tongzhou District, it is not feasible to display all of them in the legend. Therefore, the legend focuses on the five largest soil types and includes Cinnamon soil, and Aeolian soil).
Land 12 01696 g004
Figure 5. Soil type Change and Land Cover Change Coupling Analysis Percentage Map.
Land 12 01696 g005
Figure 6. Percentage of top 10 soil types in cropland for the 20 year period.
Land 12 01696 g006
Table 1. The 2000–2020 Land Cover Transfer Matrix ( km 2 ).
2020BarrenCroplandForestGrasslandImperviousWaterTotal
2000
Barren0.00550.00230.00000.00000.07590.00000.0837
Cropland0.0045476.402614.43150.0138192.16935.3429688.3646
Forest0.00000.41030.36080.00000.07680.24081.0887
Grassland0.00000.00950.00000.00050.04190.00190.0538
Impervious0.00278.03040.07760.0000191.68571.3196201.1160
Water0.00793.84670.11130.00013.27634.682311.9247
Total0.0207488.701814.98120.0144387.325911.5876902.6316
Table 2. Index table of soil type map in different years.
IndexAccuracy95% CINo Information Ratep-Value [Acc > NIR]Kappa
Year
20000.5899(0.5296, 0.6483)0.1871<2.2 × 10−160.5451
20050.6265(0.5789, 0.6723)0.1871<2.2 × 10−160.5876
20100.6043(0.5442, 0.6622)0.1871<2.2 × 10−160.5656
20150.6403(0.5808, 0.6967)0.1871<2.2 × 10−160.6046
20200.6691(0.6104, 0.7241)0.1871<2.2 × 10−160.6342
Disclaimer/Publisher’s Note: The statements, opinions and data contained in all publications are solely those of the individual author(s) and contributor(s) and not of MDPI and/or the editor(s). MDPI and/or the editor(s) disclaim responsibility for any injury to people or property resulting from any ideas, methods, instructions or products referred to in the content.

