Article

System Dynamics-Based Game Theoretical Analysis for Watershed Eco-Compensation Design: A Case Study in Tuojiang River, Sichuan Province, China

Faculty of Geosciences and Environmental Engineering, Southwest Jiaotong University, Chengdu 611756, China
*
Author to whom correspondence should be addressed.
Land 2023, 12(9), 1698; https://doi.org/10.3390/land12091698
Submission received: 27 June 2023 / Revised: 22 August 2023 / Accepted: 28 August 2023 / Published: 30 August 2023

Abstract

:
Eco-compensation is an important policy tool to trade off economic development and environmental protection in a watershed. This study introduced the gross ecosystem product (GEP) accounting system to identify the eco-compensation provider (ECP) and eco-compensation receiver (ECR) of a river basin. Then, a cooperative game model and a non-cooperative game model between the ECP and the ECR were established, in which system dynamics was incorporated into the game theoretical analysis to aid selection of the optimal compensation scheme. The study further demonstrated the model applications by taking the Tuojiang River Basin as a case. The results showed that the accounted GEP increased from CNY 32.2 billion in 2018 to CNY 35.5 billion in 2020, with a growth rate of 10.2%. Deyang City, as an ECP, had a cumulative difference of CNY 11.759 billion between its accounted GEP and actual GEP output over the three years. Neijiang City, Zigong City, and Luzhou City were taken as the ECR, receiving the GEP revenues as CNY 11.289 billion, 7.661 billion, and 1.497 billion, respectively. Chengdu City changed from the ECP to the ECR and ultimately to the ECP. However, Ziyang City and Meishan City changed from the ECP to the ECR. The eco-compensations increased to varying degrees during 2018–2020 in both game scenarios, with ECP payments and ECR revenues increasing by 16.5% and 4.6% in the non-cooperative game and by 5.0% and 50.8% in the cooperative game. Particularly, the eco-compensation obtained by the cooperative game had better environmental and economic performance, as there was a total of CNY 7.049 billion being saved. However, there was no savings of compensation by the non-cooperative game. It is expected that the results may provide insight into the design of the eco-compensation standard for a river basin.

1. Introduction

River basin poses negative externalities exception for their ecosystem services, that is, the upper stream may transfer the responsibility for pollution control downstream, aggravating the conflicts between economic development and environmental protection [1,2]. As an effective policy mechanism to mitigate such conflict, eco-compensation aims to coordinate multi-stakeholders’ interests through economic compensation, thus facilitating the conservation and sustainable use of ecosystem services [3,4].
Eco-compensation was first introduced by Larson [5], who believed that ecological restoration can be achieved by property rights owners financially compensating areas where ecological or environmental quality has been damaged. Chomitz [6] further argued that eco-compensation is a requisite for policymakers to maintain the security of ecosystem services. On this basis, the compensation is dominated by the government, using fiscal and taxation policy to compensate for environmental protection. However, a watershed is an independent system with complete hydrological and ecological functions [7]. If only the government bears all the negative external costs of the watershed, the consumers of ecological services are likely to evade their obligations [1,8]. Pattanayak et al. [9] introduced the concepts of ecological compensation provider (ECP) and ecological compensation receiver (ECR), clarifying their rights and responsibilities. In practice, watershed management is often based on hydrology, water quality, water quantity, etc., with the upstream as the ECP and the downstream as the ECR, which leads to the compensation from upstream to downstream. However, such division may ignore the socio-economic value of the ecosystem services [10]. Not only does the management have limited compensatory effects, but it can also create conflicts among stakeholders that hinder the sustainable development of watershed resources [11].
Another important issue is how to formulate a reasonable eco-compensation scheme. Since game theory has been widely used to analyze the optimal strategic action of regions or countries involved in conflicting interests, it has also been applied to the design of eco-compensation mechanisms in watersheds [12]. The game is further divided into a non-cooperative game and a cooperative game. The former focuses on individual behavior, i.e., all actors maximize their own interests through rational competition [13], whilst the latter gives emphasis on coordination and is concerned with maximizing group interests [14]. In non-cooperative games, bargaining game is an effective modeling approach for conflict resolution among stakeholders in a watershed [15]. Bargaining is the process by which local governments in a watershed negotiate compensation with the ECP and ECR to meet the requirements for the best possible water quality and quantity [16]. Bai et al. [17] constructed a bargaining game model of eco-compensation in watersheds with cost–risk interactions by taking indicators such as water quality, water quantity, and pollution treatment costs into account. To improve the design of eco-compensation, Qin et al. [18] further considered the issue related to bargaining information asymmetry resulted from individual rationality. Zhang et al. [19] proposed a dynamic Bayesian equilibrium bargaining model based on the compatibility of incentives and constraints and obtained an eco-compensation scheme suitable for the optimal water quantity and quality in a watershed.
Non-cooperative games are more susceptible to information dominance by players, which may lead to an uneven distribution of eco-compensation among stakeholders [20]. Accordingly, related studies have introduced the cooperative game, i.e., all players form an interest alliance to maximize the eco-compensation of a watershed, aiming to improve the water quality and water use efficiency [21]. Based on equity principles, Shi et al. [22] constructed a watershed cooperation game model dominated by water quality and quantity, confirming that the compensatory benefits generated by the involved stakeholders’ cooperation can significantly improve the quality of the water environment. Han et al. [23] derived the optimal eco-compensation scheme by building a cooperative game model based on hydrological, geographic, and environmental indicators of a watershed. Based on water quality and quantity, Gao et al. [24] concluded that increasing ecological subsidies is able to maximize the interests of all the players by conducting a cooperative game analysis between the upstream, downstream government, and central government. However, continuing to subsidize becomes more of a financial burden. For this reason, Ding et al. [20] proposed a game model regarding government–business cooperation to enhance the sustainability of compensation based on environmental performance targets. However, the effectiveness of cooperative games can be limited by differences in watershed economic development, pollution control, and management models, that make it difficult to achieve a long-term and solid alliance [16]. Moreover, previous studies have not considered the relationship between the supply and demand of ecosystem services, resulting in a vague definition of eco-compensation relationships.
This study introduced the gross ecosystem product (GEP) accounting system to discriminate the ECP and ECR in regard to ecosystem services in a river basin. By analyzing the difference between the accounted GEP and the actual GEP output that can be allocated to the stakeholders, the changes between ECP and ECR were identified. Given the varying degrees of the individual rationality of stakeholders in watershed management, this may lead to an uneven allocation of GEP in the watershed. This study further selected the optimal eco-compensation program by different forms of game theoretical analysis. The results are expected to lay a foundation for China to formulate eco-compensation standards for watersheds.

2. Materials and Methods

2.1. Study Area

Tuojiang River is a first-class tributary of the upper Yangtze River (28°88′ N–30°29′ N, 105°44′ E–108°20′ E), flowing through seven cities of Sichuan Province, namely Deyang, Chengdu, Meishan, Ziyang, Neijiang, Zigong, and Luzhou, with a total length of 712 km and a total area of 3.29 million square kilometers (Figure 1). Each of these seven cities has a resident population of over 290,000 and an average GDP of CNY 73.70 billion [25,26]. According to the Second National Census of Pollution Sources Statistics, the total amount of wastewater discharged by industrial enterprises in the Tuojiang River Basin reached 140 million tons, facing huge pressure on pollution control [27]. Given the high density of population and industry, the development of a feasible eco-compensation program is critical to improving environmental quality and enhancing ecosystem services.

2.2. ECP and ECR Identification

GEP is the sum of the economic value of final goods and services provided by ecosystems for economic and social development [28]. On the basis of the technical guidelines of GEP [29] and the characteristics of the Tuojiang River Basin, this study established a GEP accounting system, shown in Figure 2. This system is constituted of three hierarchies, including products, regulating services, and cultural services. These three criteria consist of eight indicators, including water protection, soil and water protection, flood regulation and storage, carbon sequestration, air cleaning, water quality improvement, climate regulation, and natural landscape. The accounting is given as follows [30,31]:
G E P T = M p + R s + C s
where G E P T is the accounted result, M p is the accounted result of products, R s is the accounted result of regulating service and C s is the accounted result of cultural service. The detailed accountings for M p , R s and C s are shown in the Supplementary File S1.
This study accounted for the theoretical GEP for the seven cities in the Tuojiang River Basin during 2018 to 2020. Corresponding consumption data for agriculture, forestry, animal husbandry, fishery products, water resources, and tourism were from the Sichuan provincial statistical yearbook 2018–2020 [32,33,34]. The water quality data were derived from monthly monitoring data during 2018 to 2020 from 24 state-controlled cross sections in the Tuojiang River Basin. Data on water conservation, water transfer, and storage in reservoirs and ponds, water transfer, and storage in lakes, soil nutrient content, soil carbon sequestration, pollutant emissions, and annual evapotranspiration were obtained from field surveys.
According to the statistical bulletin on national economic and social development in Sichuan Province 2018–2020 [35,36,37], in combination with the basin area occupied by each city, the actual GEP output regarding each city is given as follows:
G E P A = i = 1 j = 1 n α j × A i
where G E P A is the actual GEP output, α j is the proportion of the j t h city to the total area of the river basin, j = 7 ; and A i is the actual output of the i t h indicator, i = 8 .
If the difference between G E P A and G E P T is greater than 0, i.e., the actual output is higher than the accounted result, it indicates that the city may be over-exploiting the ecosystem services and should be deemed as an ECP and vice versa as an ECR.

2.3. Game Modeling

With regard to the game model construction, the player is not simply defined based on the division of upstream and downstream in a watershed. This study introduced the GEP accounting system to identify the ECP and ECR, who are considered as the players for the game. This may better embody the “Polluter Pays” concept, as well as highlight the fact that watershed as an ecosystem has great socio-economic value. Second, given the varying degrees of individual rationality regarding the players, this study provided two classical games to aid the selection of optimal eco-compensation program. Moreover, the model was set upon necessary assumptions, to be consistent with the main conflicts regarding the eco-compensation design, such as how to trade off fairness and efficiency.

2.3.1. A Non-Cooperative Game Model

This study builds a non-cooperative game model based on bargaining, and the basic assumptions are as follows:
(1)
The main player in the game is the local government, which may be the ECP or the ECR, depending on the difference between G E P A and G E P T . The central government is the administrator of the allocation of eco-compensation.
(2)
Local governments are considered rational economic actors. As far as ECP are concerned, the aim is to maximize the use of ecosystem service for economic benefits while paying minimum eco-compensation. In the case of ECR, the aim is to protect the quality of the water environment while promoting economic development.
(3)
Each player in the game knows all of the other’s information and there is no unequal or unfair information.
(4)
There is a time cost associated with each round of negotiations. For every round of negotiations that is delayed, both players suffer economic losses. Therefore, a discount factor σ (0 ≤ σ ≤ 1) is introduced into the game to reflect the time cost. The closer the discount factor converges to 1, the smaller the economic loss caused by the negotiation.
The objective function of the ECP and ECR is:
m a x E G E P = i = 1 m G i C x                 E G E P E T R x 0
m i n D G E P = R x j = 1 n G j                 D G E P D T C x 0
where E G E P is the GEP provided by the ECP; G i is the GEP provided by the i t h ECP; C x is the eco-compensation provided by the ECP after the x t h round of negotiation; E T is the expected GEP provided by the ECP; D T is the expected GEP received by the ECR; D G E P is the GEP provided by the ECR; G i is the GEP provided by the j t h ECO; R x is the eco-compensation received by the ECR after the x t h round of negotiation.
In the bargaining, the ECP has maximized GEP output as its strategic action objective, while ECR has minimized GEP output as its strategic action objective. The bargaining will continue until the solutions of E G E P * and D G E P * satisfy the following conditions:
E G E P * E T D G E P * D T
where E G E P * and D G E P * are the optimal strategic actions for the ECP and the ECR, respectively.
According to backward induction, ECP gives the allocable GEP in the t t h round of negotiation, and ECR obtains the optimal E G E P * . In the ( t 1 ) t h round of negotiation, the corresponding GEP provided by ECP ( G E P E C P ( t 1 ) ) is:
G E P E C S ( t 1 ) = σ 1 × E G E P *
At this point, ECP only accepts a price not less than G E P E C S ( t 1 ) given by the ECR, and ECR receives the GEP in the ( t 1 ) t h round of negotiation ( G E P E C O t 1 ) :
G E P E C O ( t 1 ) = T G E P σ 1 × E G E P *
In the ( t 2 ) t h round of negotiation, ECR receives G E P E C R ( t 2 ) :
G E P E C O ( t 2 ) = σ 2 × ( T G E P σ 1 × E G E P * )
In the ( t 2 ) t h round of negotiation, ECP receives G E P E C S ( t 2 ) :
G E P E C S ( t 2 ) = T G E P σ 2 × ( T G E P σ 1 × E G E P * )
Assuming that the game is an infinite game, the price given by ECP in the t t h round of negotiation should be equal to the price given in the ( t 2 ) t h round of negotiation, the Equations (6)–(9) can be simplified as follows:
E G E P * = 1 σ 2 1 σ 1 σ 2 × T G E P
where T G E P is the total GEP of the river basin. According to the optimal strategy E G E P * by ECP, it can be concluded that the eco-compensation is:
C = i = 1 m G i E G E P *
If the GEP is given by the ECP in the t t h round of negotiation, the ECR will receive the optimal GEP as D G E P * :
D G E P * = 1 σ 1 1 σ 1 σ 2 × T G E P
The corresponding eco-compensation is:
R = D G E P * j = 1 n G j

2.3.2. A Cooperative Game Model

There are three players in the cooperative game: ECP, ECR, and the central government. The ECP and ECR are consistent with that defined in the non-cooperative game, who are dominated by the central government. Given the variety of coalition possibilities that exist, and this study only discusses the cooperation scenario composed of the three players simultaneously { E C P ,   E C R ,   c e n t r a l   g o v e r n m e n t } .
The assumptions of the cooperative game are as follows:
(1)
Definition: Let I be the set of the involved players and S be the set of all cooperative sub-coalitions, S I ; i be the set of players who have not involved in the cooperation, i I ; v ( S ) represents the GEP revenue corresponding to S, which satisfies the following conditions: when there is no cooperation, the revenue is 0; when there is cooperation, there will be no further degradation on environmental quality of the watershed;
(2)
Validity: x i is defined as the contribution of the i t h player from the total GEP. It satisfies the following condition: i = 1 n x i = v ( I ) , that is, the sum of the GEP allocated to each city is equal to the total GEP of the river basin;
(3)
Symmetry: Distribution of GEP per player does not change over time of cooperation;
(4)
Redundancy: An involved player will not benefit from cooperation if they do not contribute to the coalition.
The cooperation efficiency α   ( 0 α 1 ) is introduced to assess the closeness of cooperation among players. Assuming that v is the characteristic function of the game and N is the number of players in the alliance, the cooperative game can be expressed as G   ( N ,   v ) . S is a subset of N   ( S N ) , i.e., non-empty alliances in the game. v S represents the revenue obtained by the coalition S. In this study, the Shapley value is used to solve for the contribution x i of the i t h player, which is expressed as follows [3]:
x i = S N w ( S ) [ v ( S ) v S i ]
w S = ( n S ) ! ( S 1 ) ! n !
where v ( S i ) is the total revenue of S when the i t h player is removed; w S is the weight of S , and n is the number of players.
At the same time, the Shapley value φ i should satisfy the following three conditions:
Individual rational conditions:
φ i v i ,     i N
Group rational conditions:
i S φ i v S ,     S N
Efficiency conditions:
i N φ i = v N
According to the contribution to the GEP, the eco-compensation for ECP and ECR can be expressed as follows:
C = x E C S G E P E C P × α
R = G E P E C R × α x E C O
where C is the eco-compensation provided by the ECP; R is the eco-compensation received by the ECR; G E P is the revenue from the basin economic development, and α is the cooperation efficiency.

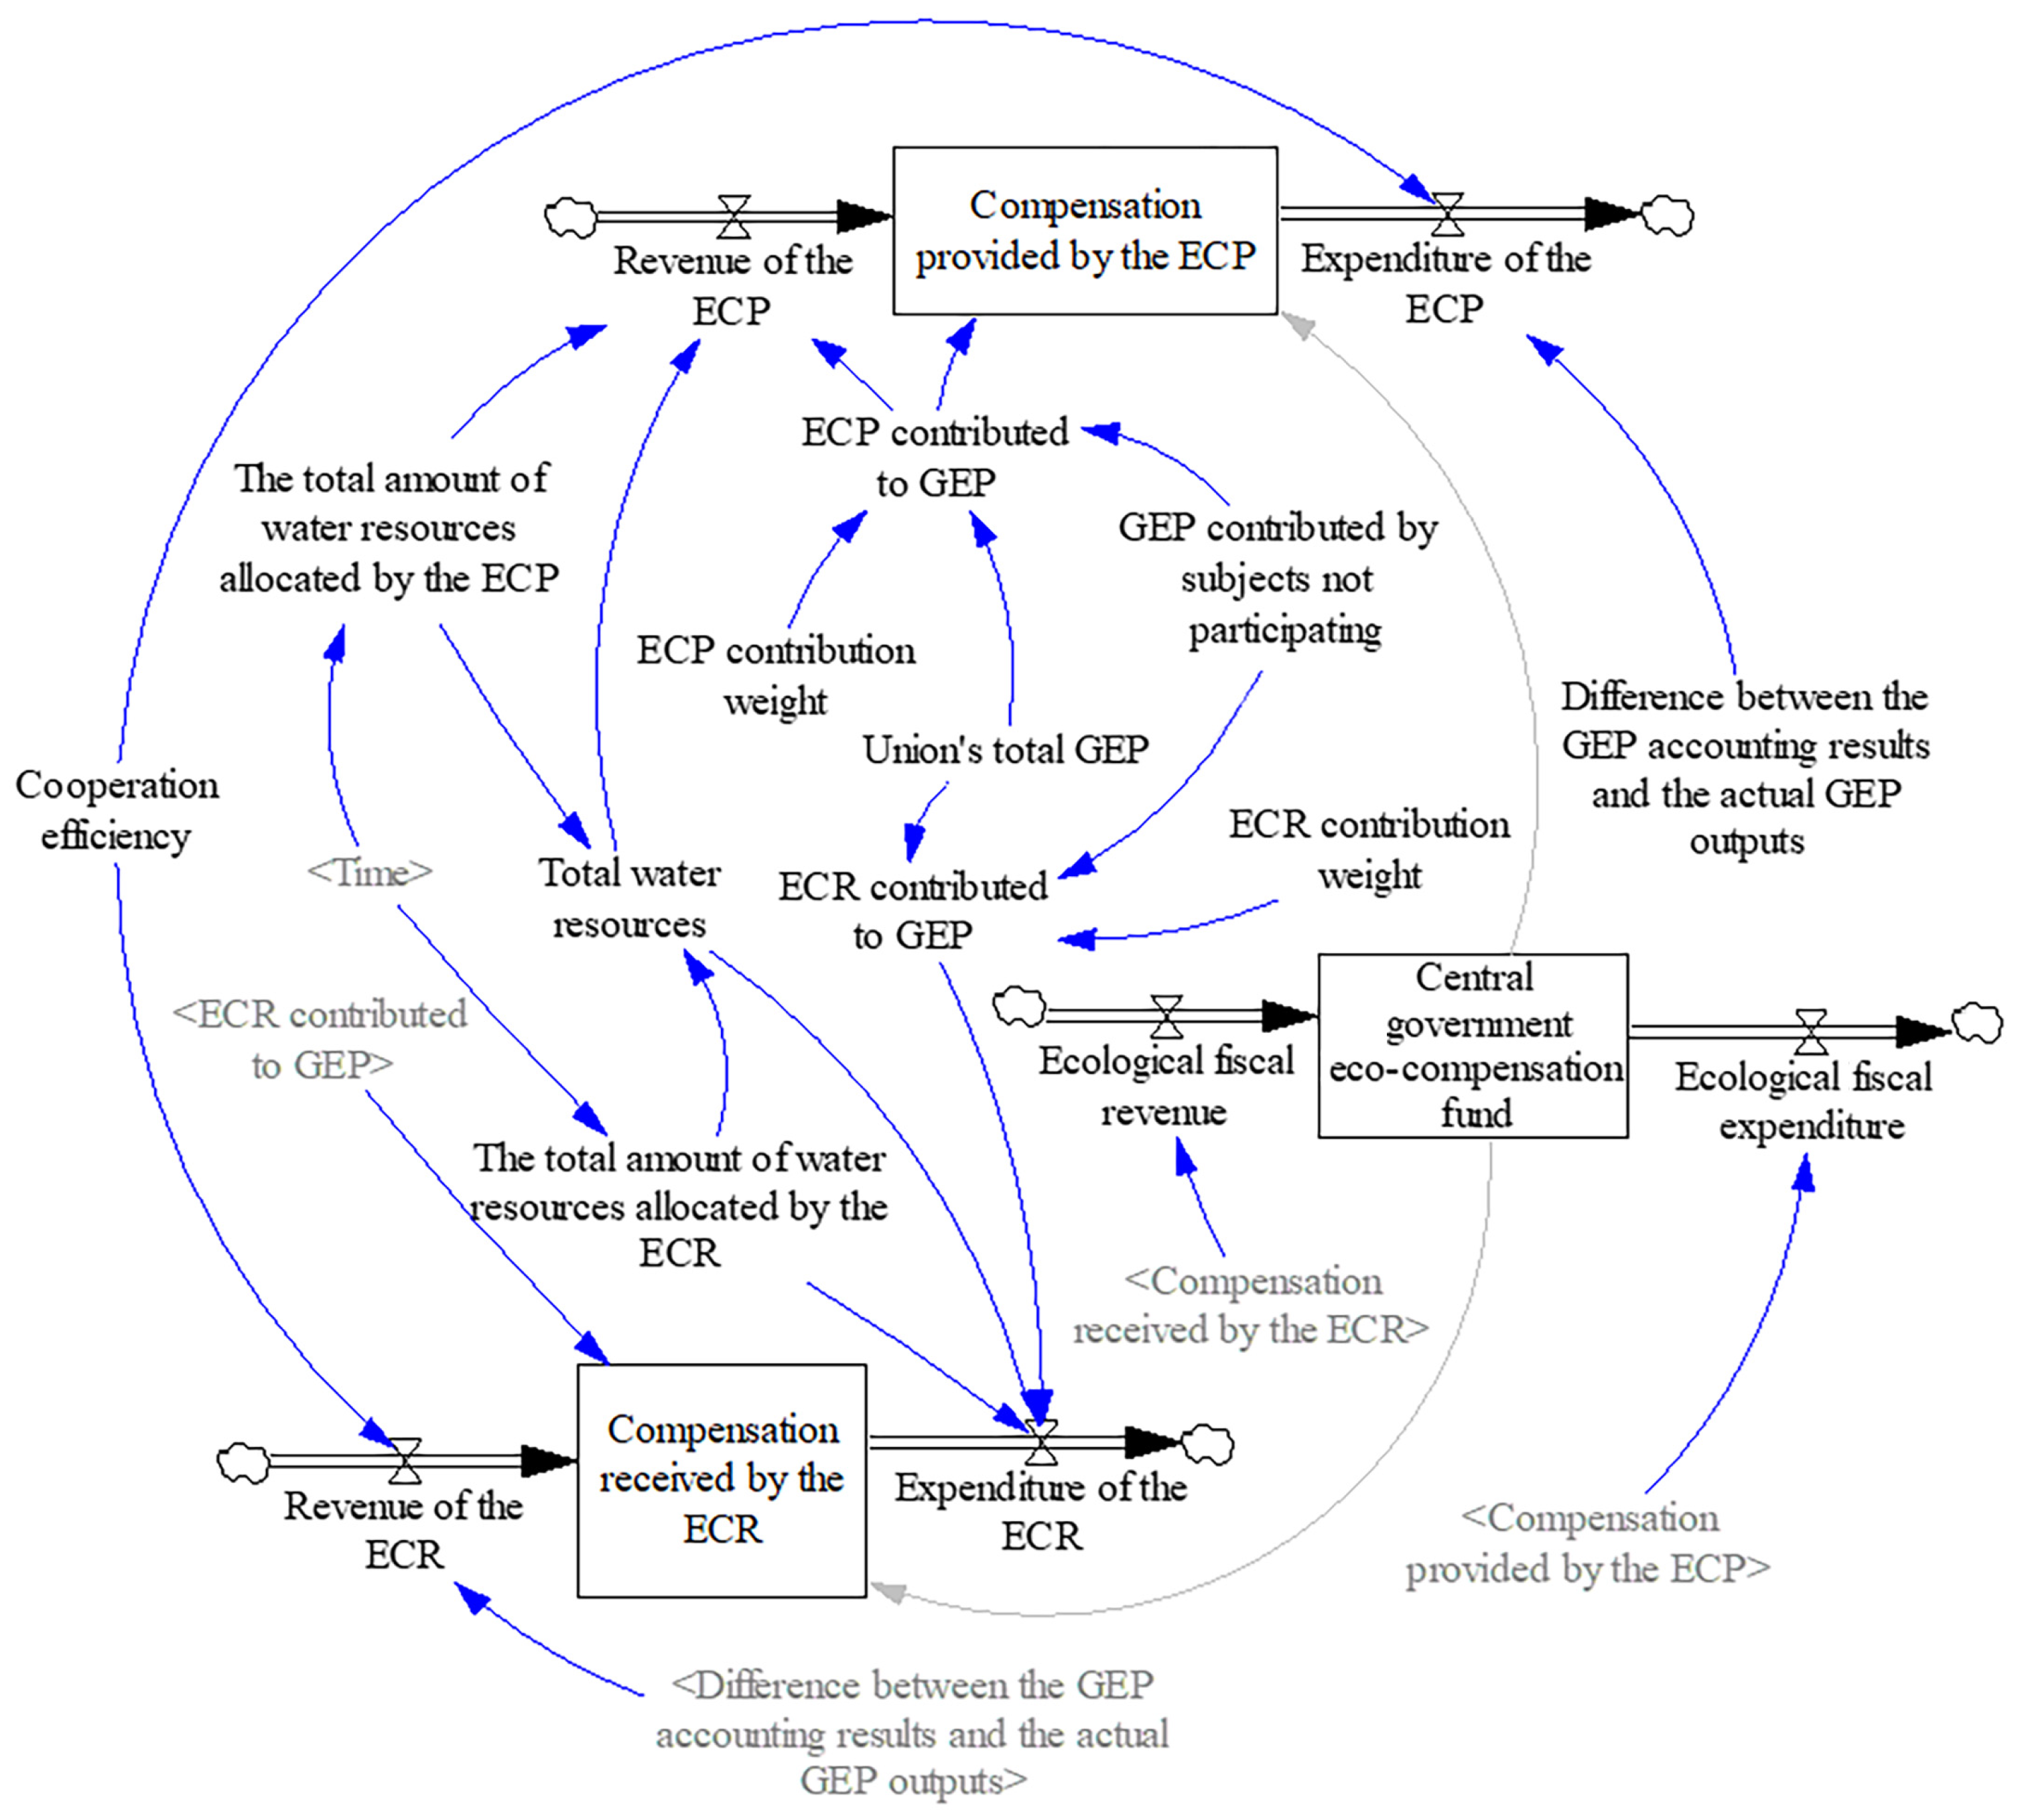
3. System Dynamics Modeling

The key variables in the game model, as well as the relationships among the variables, are represented by the causal feedback loops of system dynamics. The flow diagrams of eco-compensation stocks for the two game scenarios were constructed, as shown in Figure 3 and Figure 4, respectively. All types of parameters and input data are shown from Tables S1 to S4 in the Supplementary File S2. Among them, the non-cooperative game scenario includes an enhanced feedback loop (compensation provided by the ECP → ecological fiscal revenue → central government eco-compensation fund) and a balanced feedback loop (compensation received by the ECR → ecological fiscal expenditure → central government eco-compensation fund).
Cooperative game scenario includes three enhanced feedback loops: ① compensation provided by the ECP → ECP contributed to GEP; ② compensation provided by the ECP → ECP contributed to GEP → revenue of the ECP; ③ compensation provided by the ECP → ecological fiscal expenditure → central government eco-compensation fund. Three balanced feedback loops: ① compensation received by the ECR →ECR contributed to GEP; ② compensation received by the ECR → ecological financial revenue → central government eco-compensation fund; ③ compensation received by the ECR → ECR contributed to GEP → expenditure of the ECR.

4. Results and Discussion

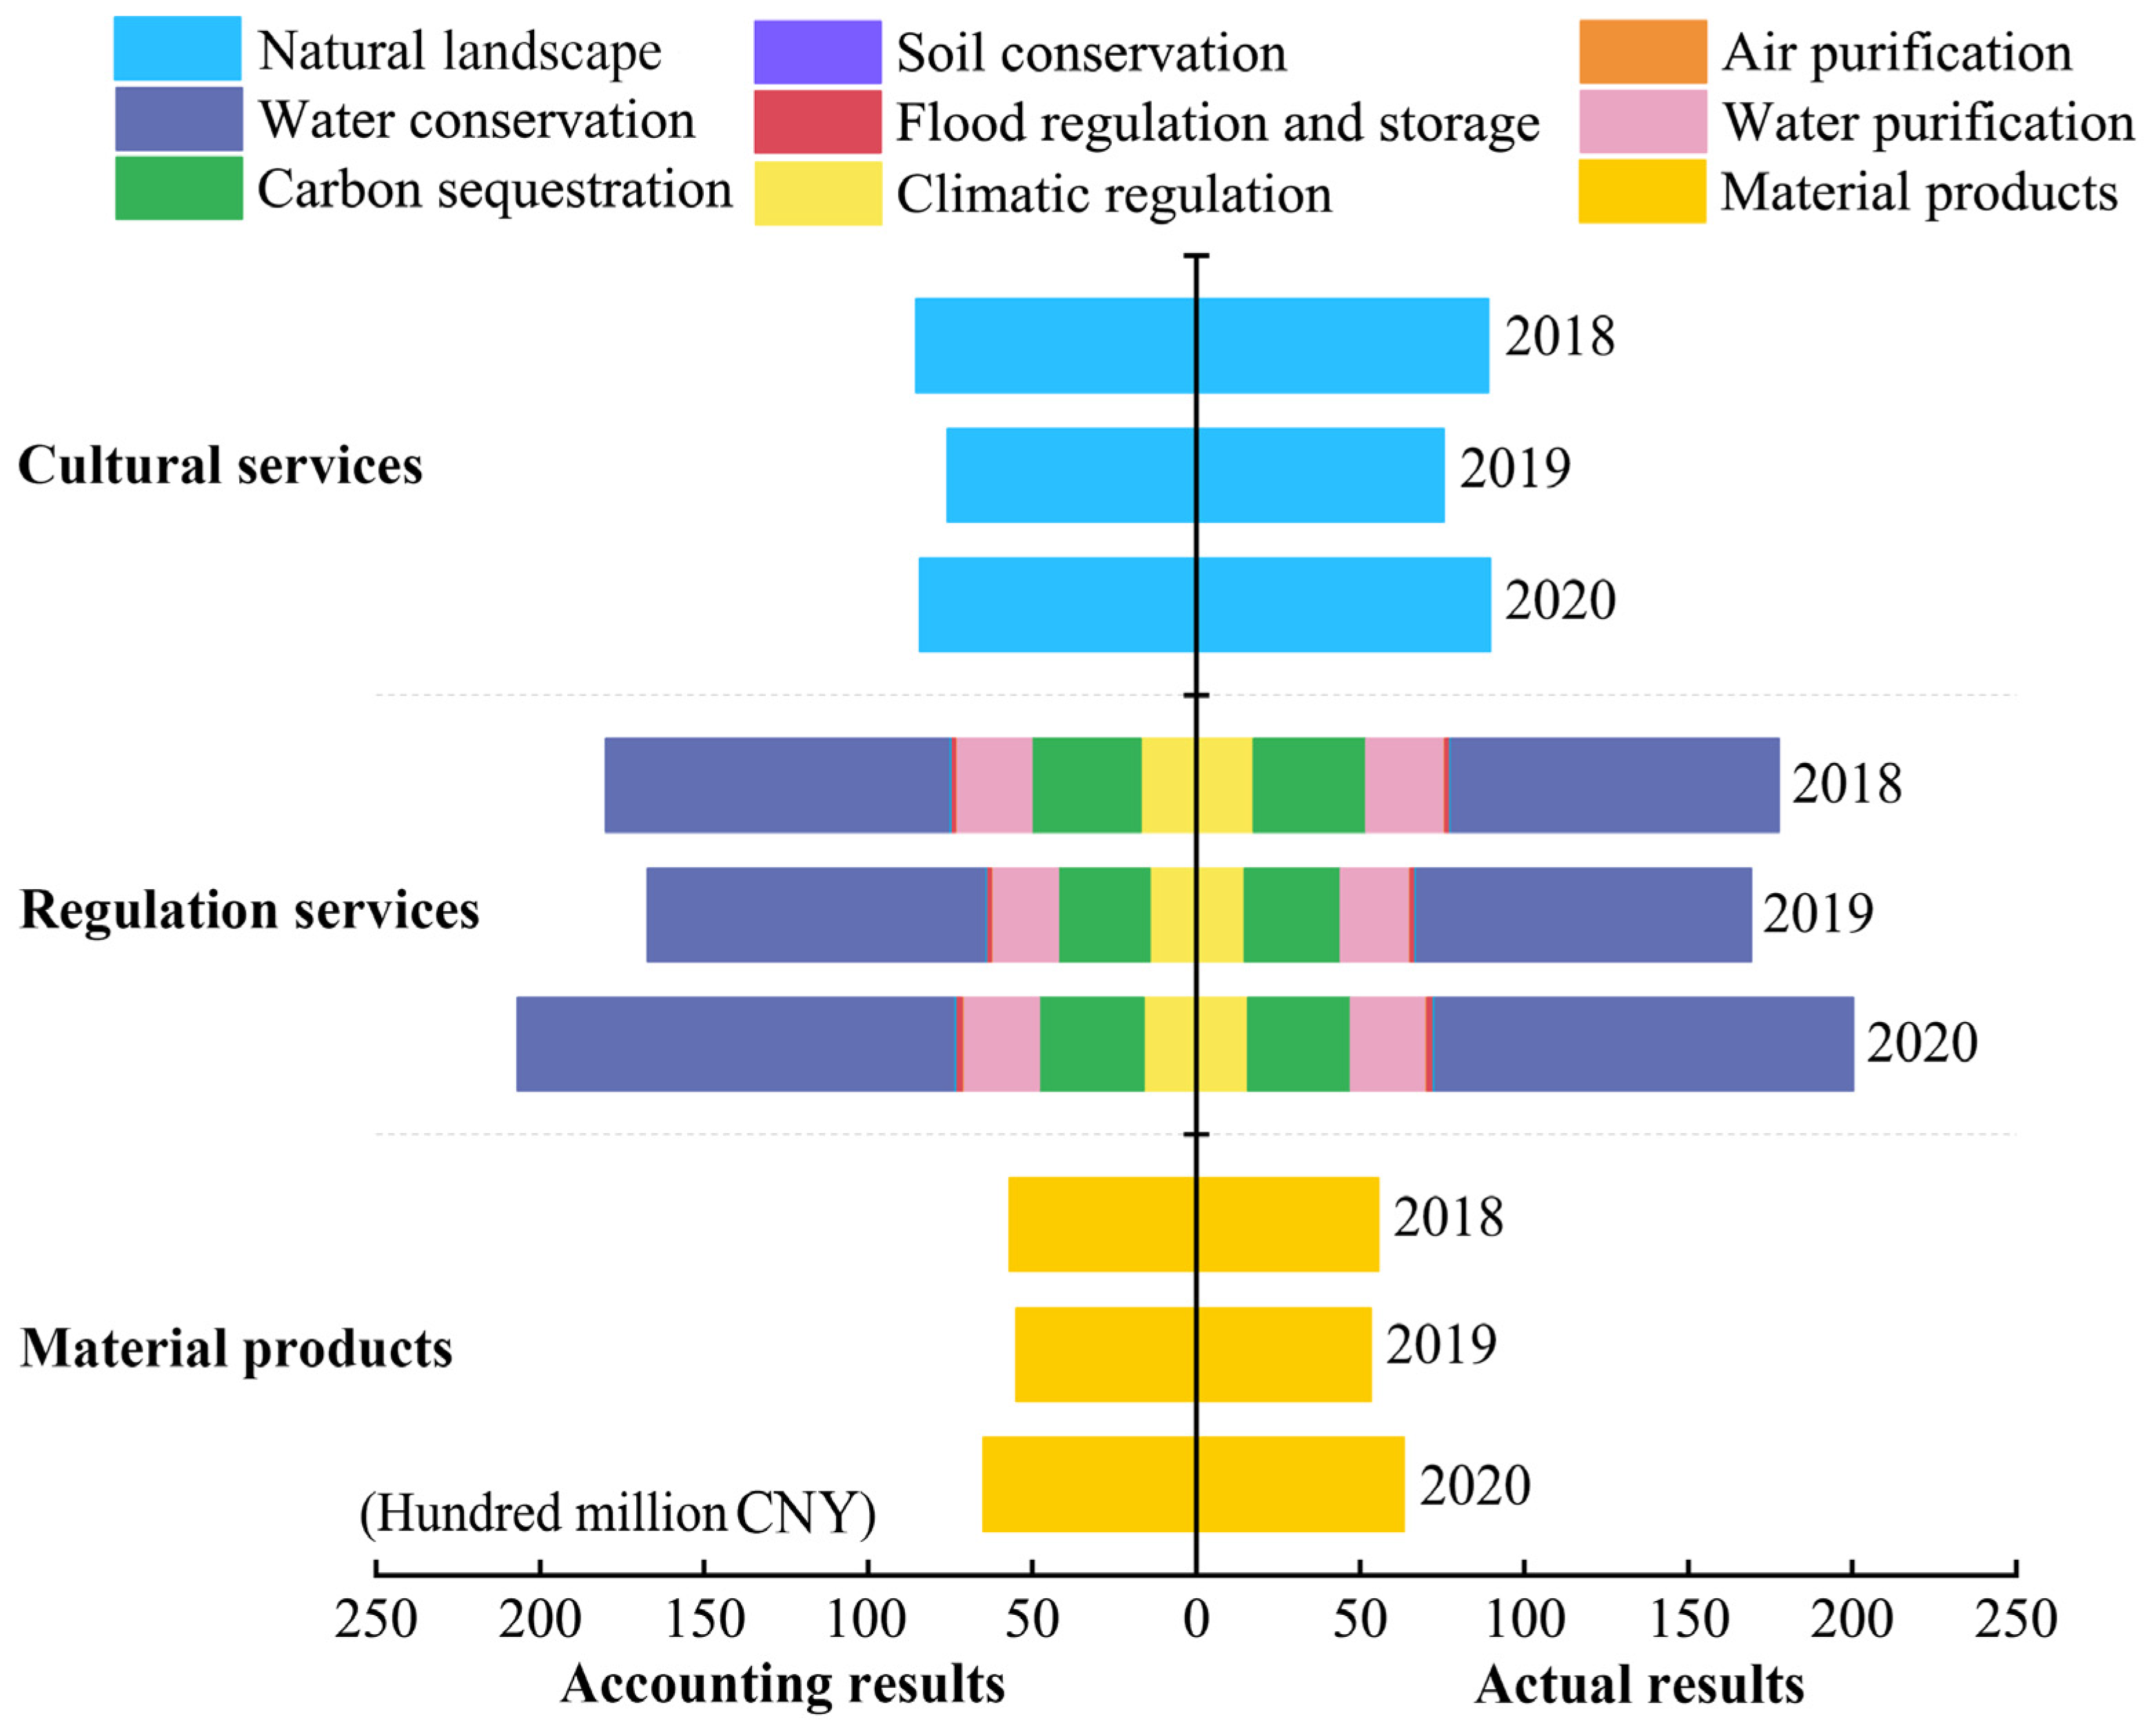
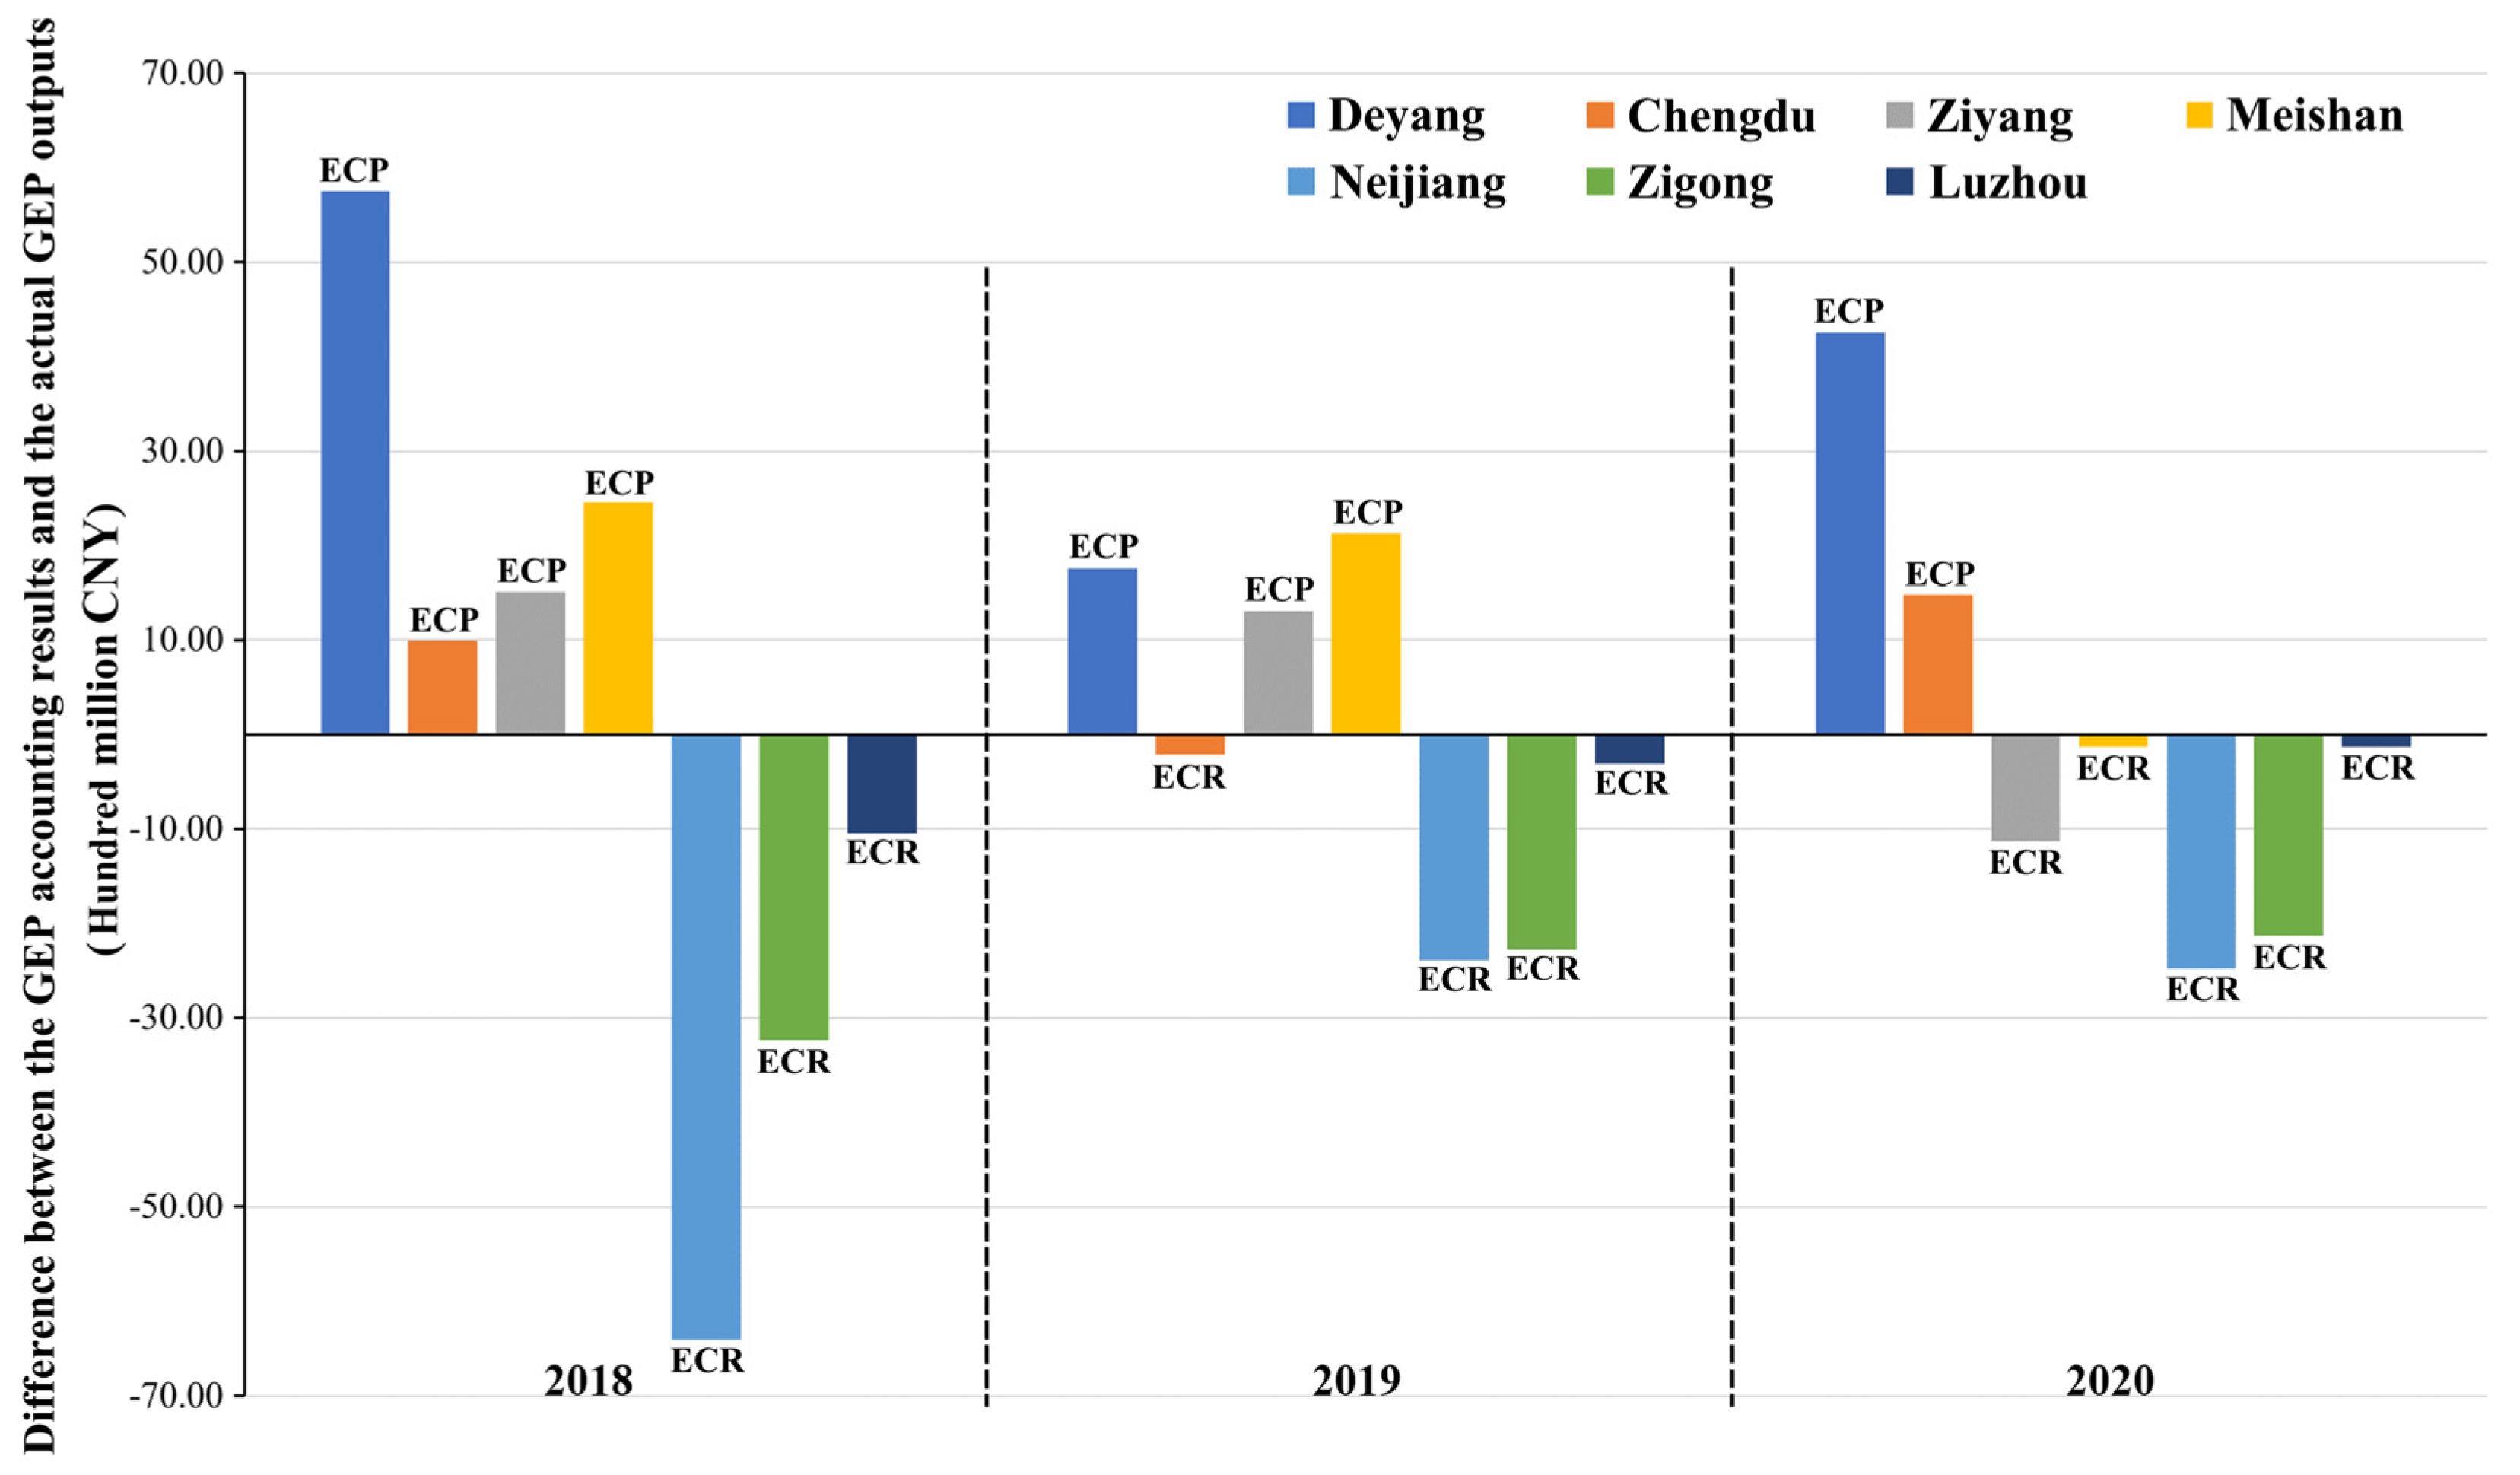
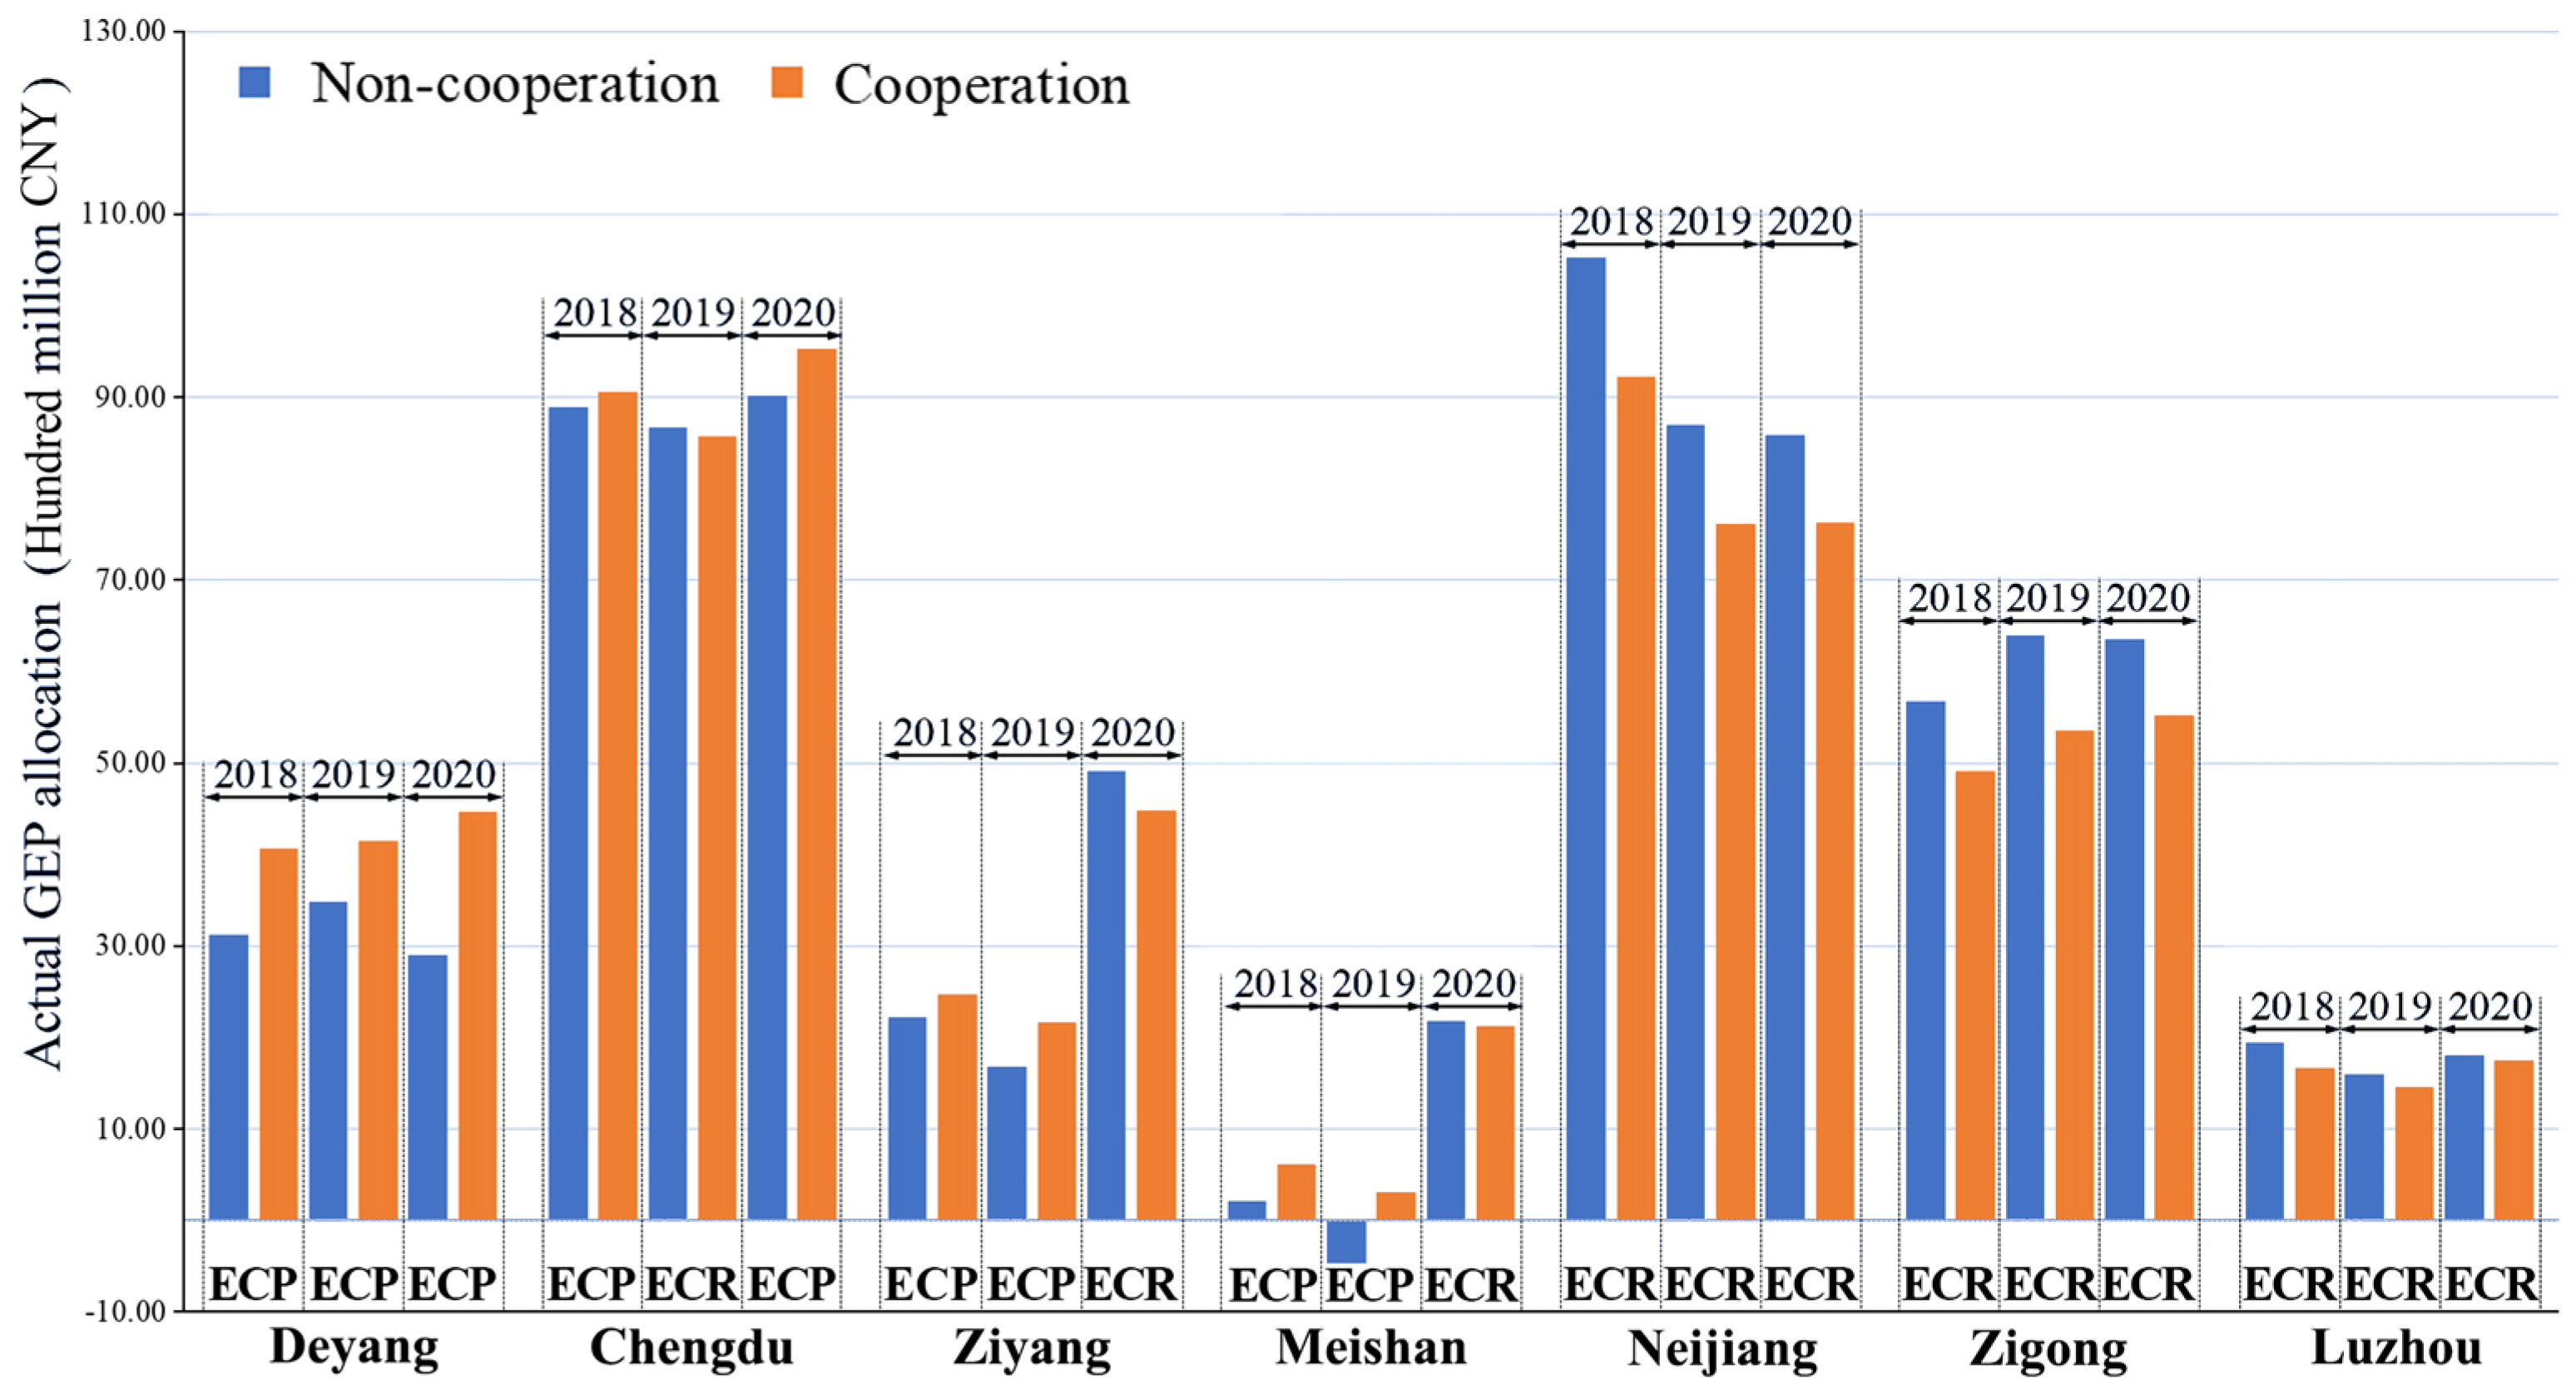
4.1. GEP Accounting Results and Actual GEP Outputs

Figure 5 shows the GEP accounting results of the Tuojiang River Basin in 2018–2020. In the past three years, the GEP increased from CNY 32.2 billion in 2018 to CNY 35.5 billion in 2020, with a growth rate of 10.2%. This indicates that the ecological and environmental quality of the basin is generally improved. Among them, the contribution of regulating services to GEP was the largest, with a total of CNY 55.394 billion in three years, accounting for 56.78% of the total accounted GEP. Among the GEP contributed by the regulating services, climate regulation services accounted for the largest proportion (61.27%), with a total of CNY 33.938 billion over the three years. In addition, the GEP contribution to climate regulation services increased annually, rising by approximately 27.26% in 2020 compared to 2018. The GEP contribution of water conservation, soil conservation, and flood regulation and storage remained basically unchanged, which was CNY 4.742 billion, CNY 9.314 billion, and CNY 6.668 billion, respectively, in three years, accounting for 37.41% of the regulating service. However, the GEP contributions of air purification, water purification, and carbon sequestration were relatively low at CNY 0.029 billion, CNY 0.158 billion, and CNY 0.056 billion, respectively. The three in total accounted for only 1.32% of the GEP contribution by regulating services, indicating the vulnerable environmental quality of the Tuojiang River Basin.
Similar to the accounted GEP results, the actual GEP produced in the Tuojiang River Basin also showed an increasing trend over the past three years, with a growth rate of 9.56%. Regulating services remained the main source of contribution, with a total of CNY 54.686 billion over the three years. However, the contribution of air purification, water purification, and carbon sequestration contributed less GEP over the three years, at 0.1%, 0.5%, and 0.2% respectively.
The difference between the GEP accounting results and the actual GEP outputs for the cities in the Tuo River Basin from 2018 to 2020 is shown in Figure 6. Of these, Deyang City had positive GEP differentials in all three years, at CNY 5.746 billion, CNY 1.761 billion, and CNY 4.252 billion, respectively, accumulated as CNY 11.759 billion. This suggests that its affiliated watershed section has been subject to overdevelopment and overutilization. Therefore, Deyang City should be regarded as the ECP. As a major equipment manufacturing city in China, Deyang City accounts for 25% of the industrial output in Sichuan Province [38], with a pronounced high carbon lock-in effect, leading to a continued demand for the GEP. Neijiang City, Zigong City, and Luzhou City all had negative GEP differences, indicating that the three cities are the ECR because of their high GEP contributions to regulating services. The difference in GEP for Chengdu City from 2018 to 2020 was 0.991 billion, −0.219 billion, and 1.477 billion, respectively, indicating that it changed from ECP to ECR and then to ECP. This is mainly due to the fact that Chengdu was in a period of industrial and energy transition, and the actual GEP output fluctuated greatly. As a result, its role in eco-compensation was changing. From 2018 to 2020, the GEP differentials for Ziyang City were 1.510 billion, 1.301 billion, and −1.137 billion, respectively, and for Meishan City were 2.457 billion, 2.133 billion, and −0.134 billion, respectively, indicating that the two cities changed from ECP to ECR. At the same time, the GEP accounting results for goods and regulating services in the two cities were improved significantly, indicating that the two cities were gradually moving away from a resource-dependent model of development. Among the regulating services, these two cities contributed the largest increase in GEP for climate regulation, indicating that they had made progress in improving the quality of the ecosystem.

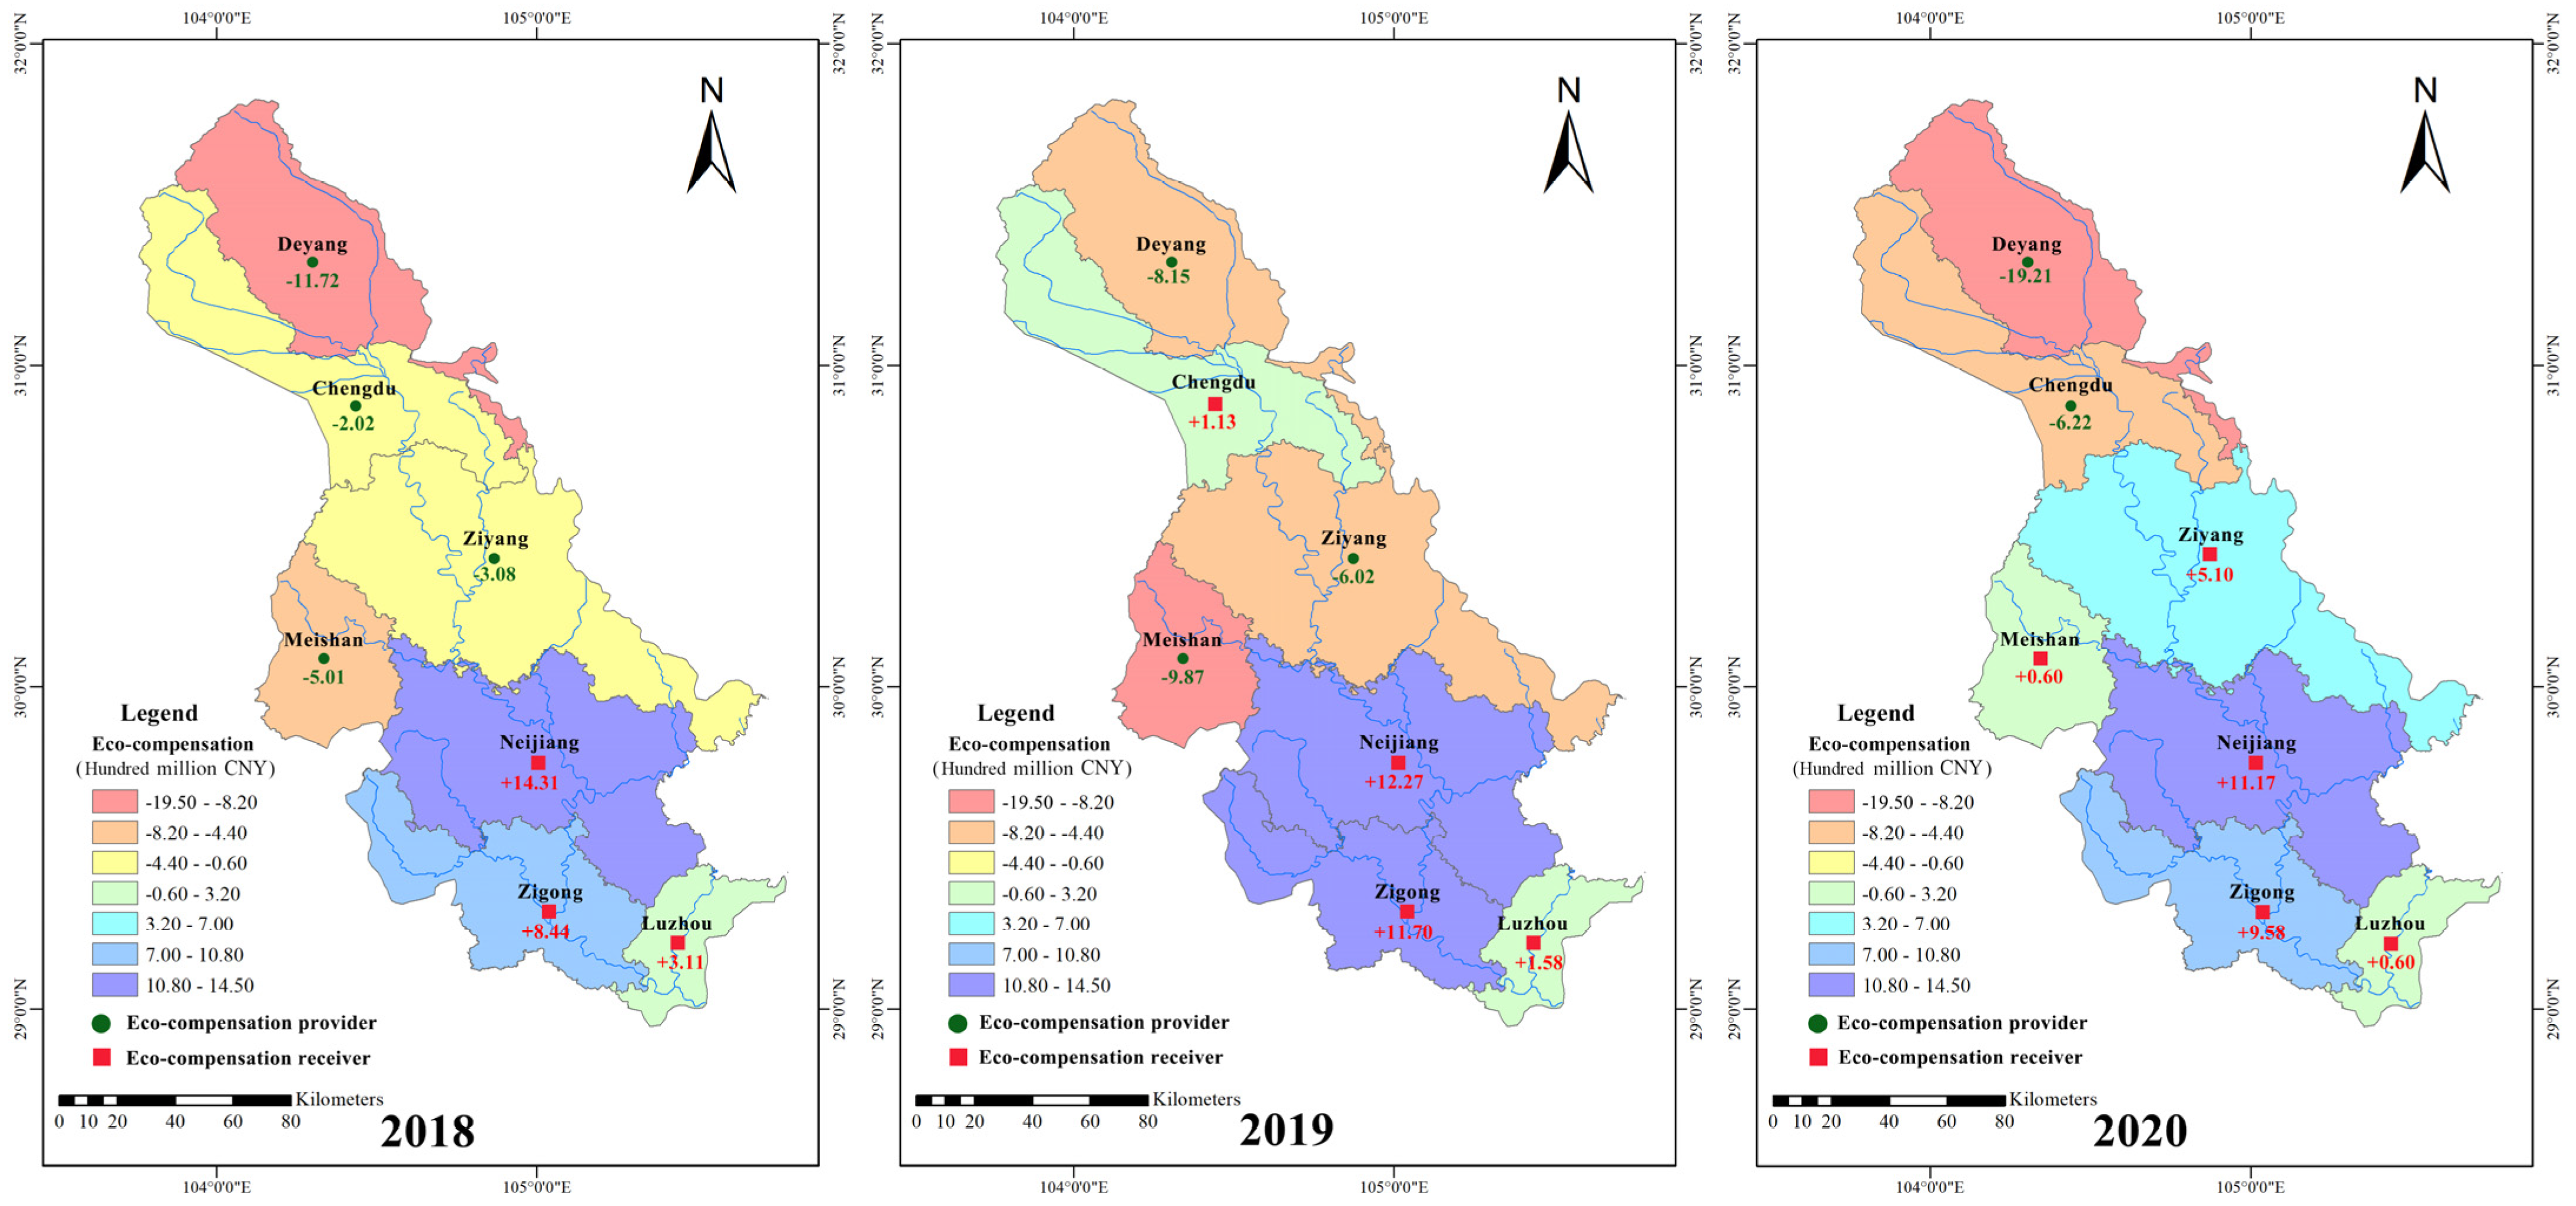
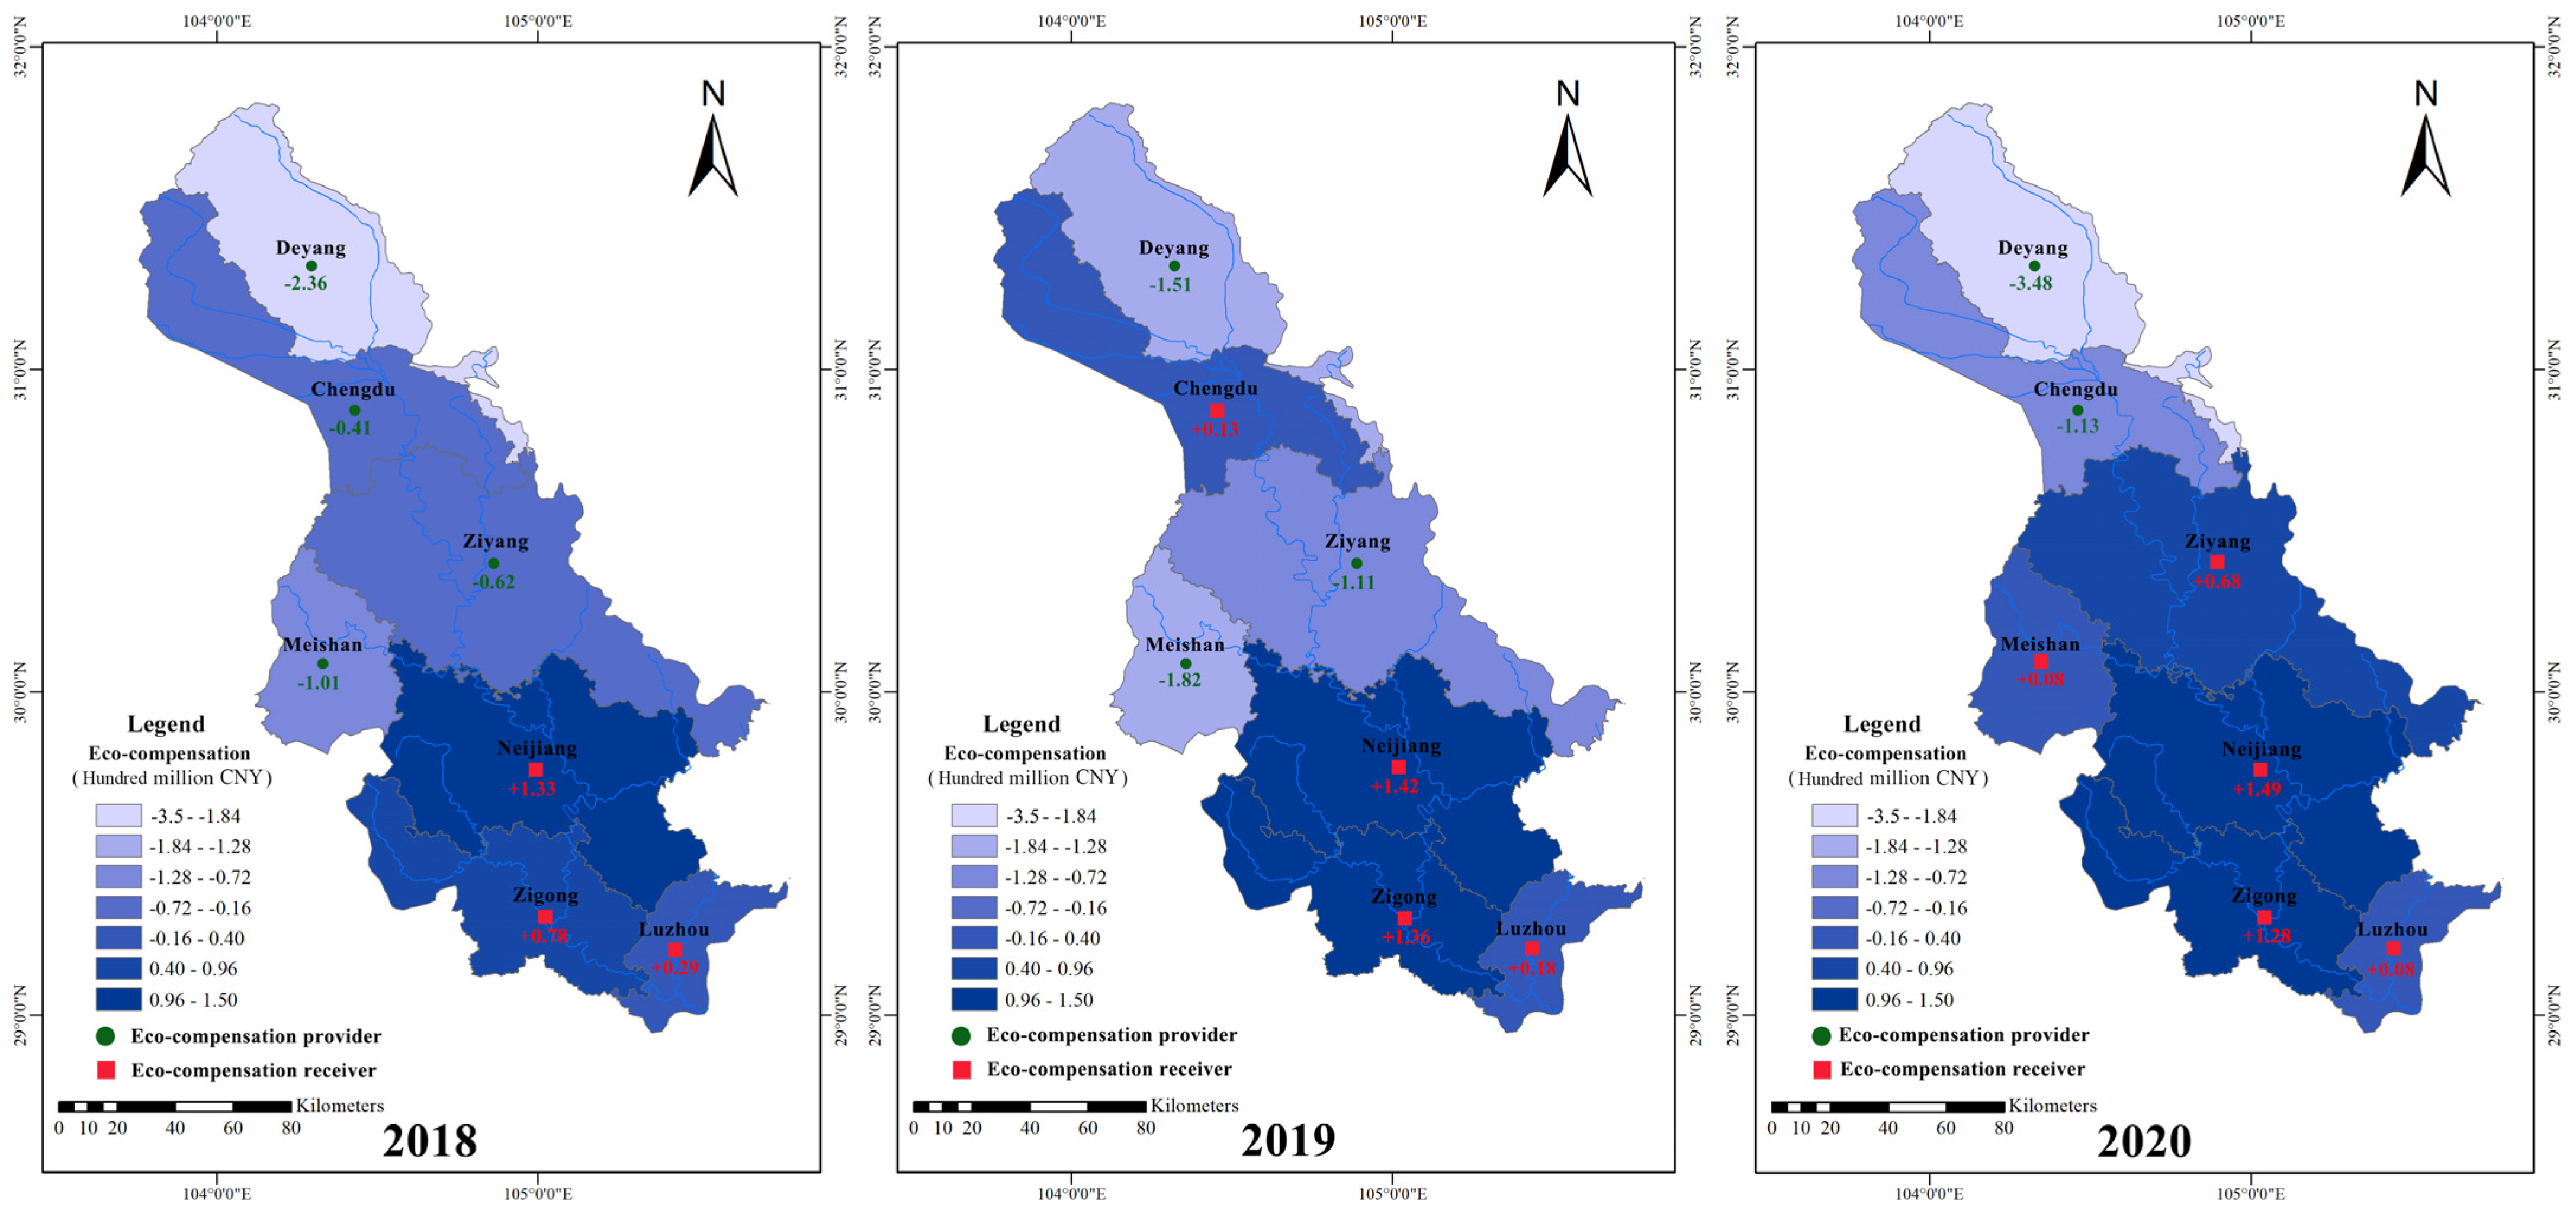
4.2. Eco-Compensation Allocation

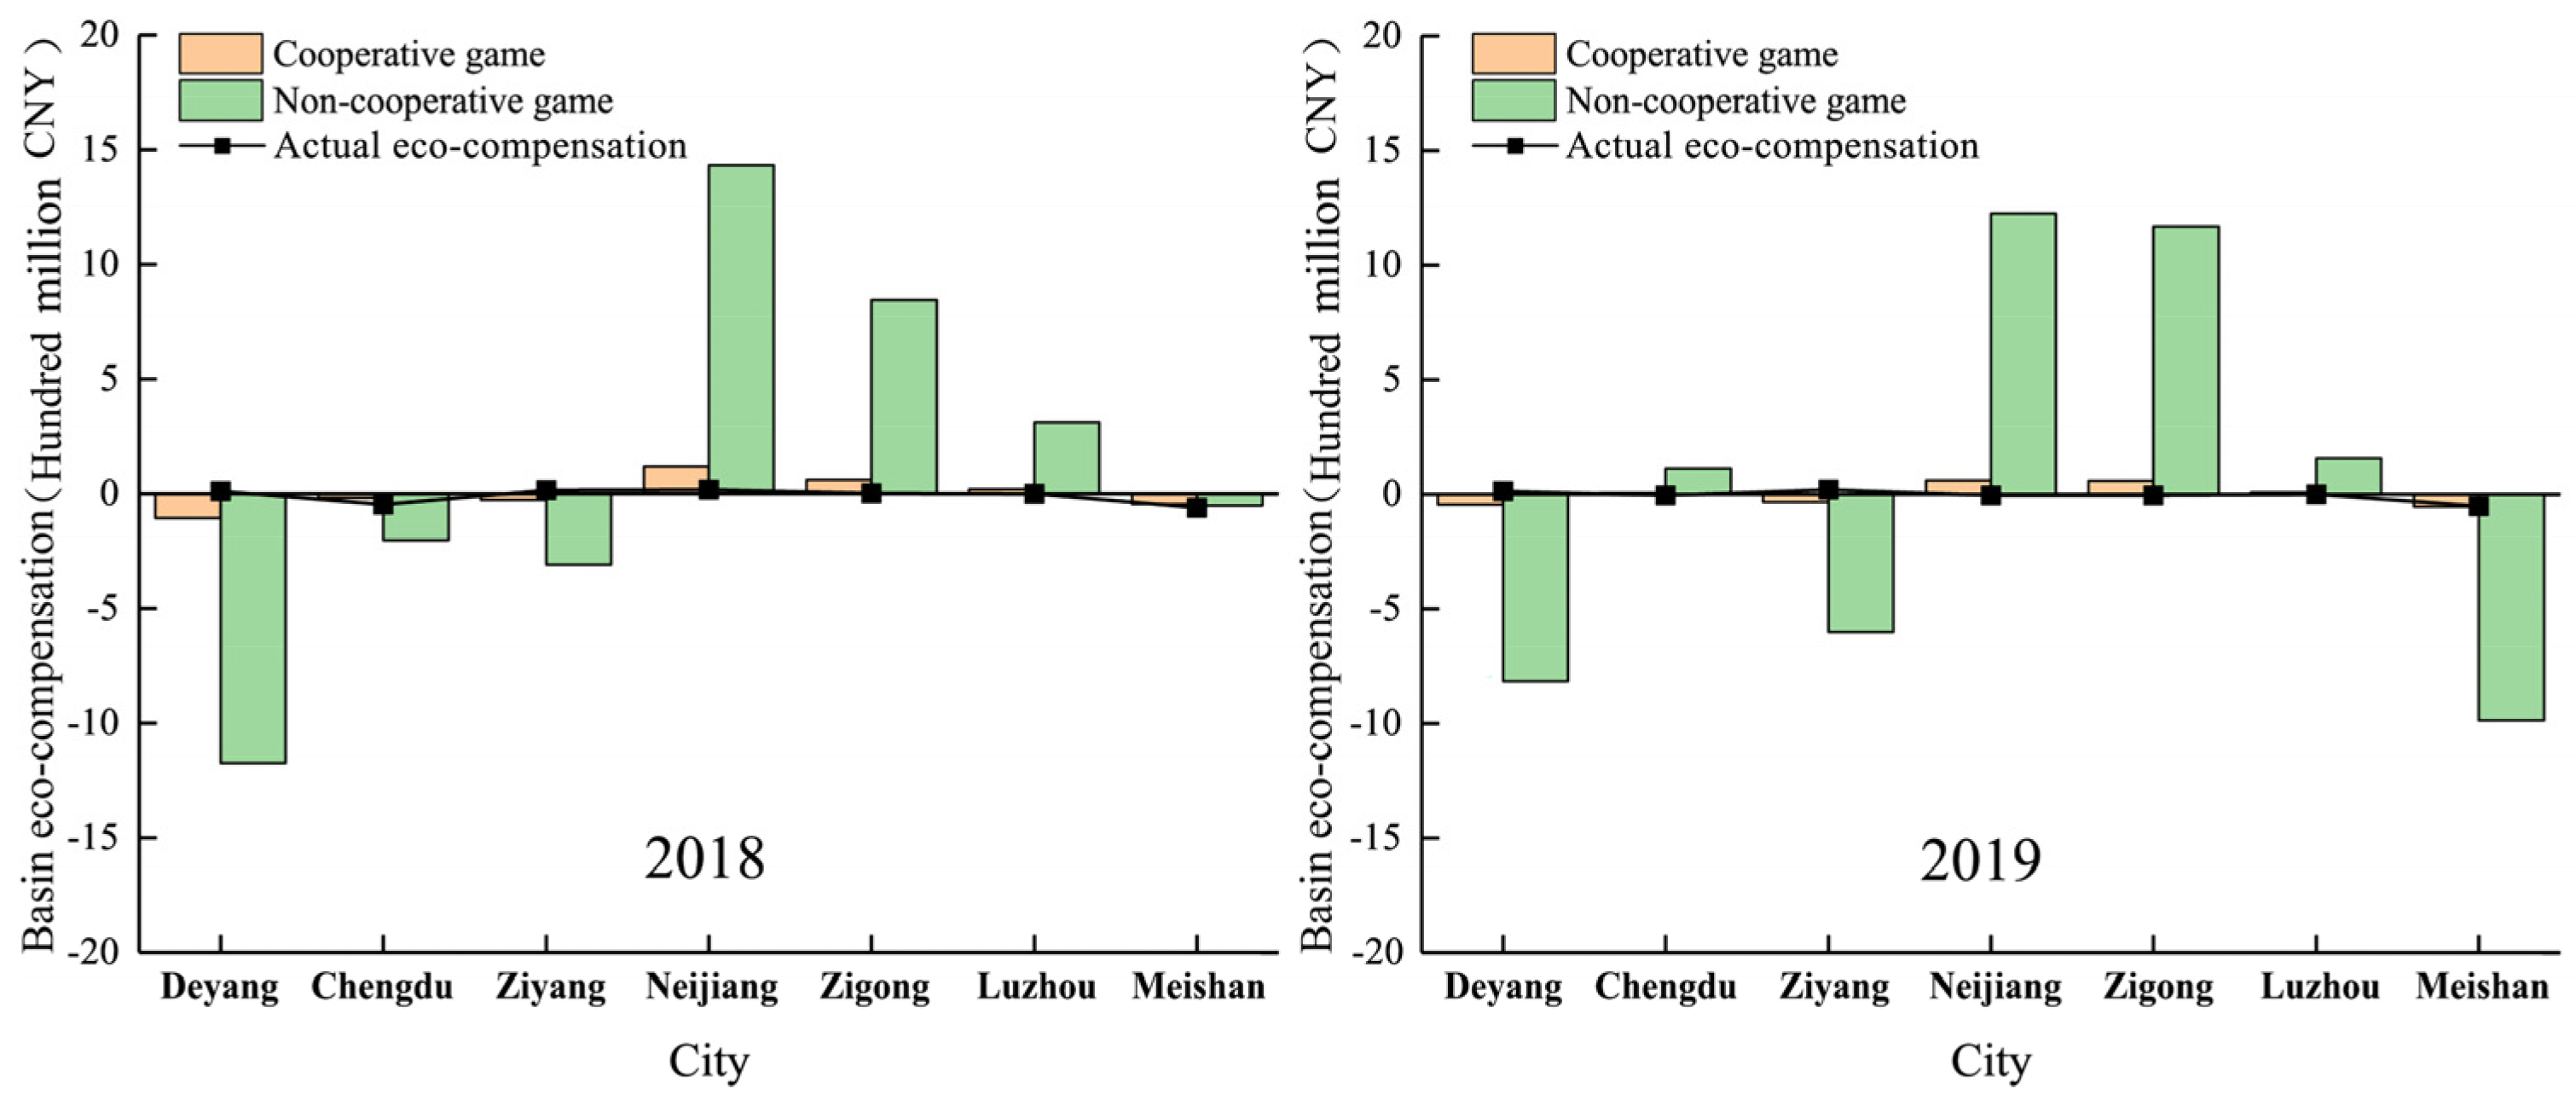
4.2.1. Non-Cooperative Game Based Allocation

From 2018 to 2020, the eco-compensation in the Tuojiang River Basin showed an upward trend, with the compensation paid by the ECP increasing from CNY 2.183 billion to CNY 2.543 billion, with a growth rate of 16.5%. The compensation received by the ECR increased from CNY 2.587 billion to CNY 2.706 billion, with a growth rate of 4.6%.
The eco-compensation for each city during 2018–2020 is shown in Figure 7. Deyang City was deemed as the ECP, and its compensation payment increased from CNY 1.172 billion in 2018 to CNY 1.921 billion in 2020, with a growth rate of 63.9%. This may be due to the continued growth of consumer demand and the expansion of resource-dependent industries (e.g., the phosphorus-based chemical industry), which has a significant impact on the watersheds [38]. Ziyang City and Meishan City shifted from the role of ECP to the ECR, from payments of CNY 0.308 billion and CNY 0.501 billion to revenues of CNY 0.501 billion and CNY 0.060 billion, respectively. This may be attributed to closer interconnections of ecosystem services among cities, driven by the policy of integrated development of the “Chengdu-Deyang-Meishan-Ziyang” urban agglomeration. Chengdu was the ECP in 2018, paying CNY 0.202 billion in eco-compensation; in 2019, it became the ECR, receiving CNY 0.113 billion in eco-compensation; in 2020, it became the ECP again, paying CNY 0.622 billion in eco-compensation. Chengdu, as a megacity in Western China, has a large population and faces great challenges in terms of socio-economic development and resource and environmental constraints [39]. From 2018 to 2020, Neijiang City, Zigong City, and Luzhou City were regarded as the ECR, with total revenues of CNY 3.775 billion, CNY 2.973 billion, and CNY 530 million, respectively. A possible reason is that Neijiang City and Zigong City are dominated by tertiary industries, which contribute 48.96% and 45.20% of the GDP, respectively, and are characterized by low emissions and low resource consumption. The liquor industry, as a pillar industry in Luzhou City, contributes 52.3% to the GDP [40]. Its demand for water resource development is higher than that of Neijiang City and Zigong City.

4.2.2. Cooperative Game-Based Allocation

In the cooperative game, the eco-compensation increased slightly from 2018 to 2020, shown in Figure 8. The compensation paid by the ECP increased from CNY 0.439 billion to CNY 0.461 billion, with a growth rate of 5.0%. The compensation received by the ECR increased from CNY 0.240 billion to CNY 0.362 billion, with a growth rate of 50.8%. Among them, Deyang City was regarded as the ECP, and its compensation payment increased from CNY 0.236 billion in 2018 to CNY 0.348 billion in 2020, with a growth rate of 47%. Neijiang City, Zigong City, and Luzhou City were the ECR, and the compensation received by these three cities increased by an average of 3% per year. Chengdu was the ECP in 2018, paying CNY 0.041 billion in eco-compensation; in 2019, it became the ECR, receiving CNY 0.013 billion in eco-compensation; in 2020, it became the ECP again, paying CNY 0.113 billion in eco-compensation. Ziyang City and Meishan City were gradually changed from ECP to ECR due to their increase in regulating services. In 2018, Ziyang City and Meishan City spent CNY 0.062 billion and CNY 0.1 billion on eco-compensations, respectively. However, these two cities received CNY 0.068 billion and CNY 0.0008 billion in eco-compensations in 2020.

4.3. Discussion

In the discussion section, we compared the differences in the allocation of eco-compensation between the two game scenarios to derive the optimal compensation program. From 2018 to 2020, the ECR in the non-cooperative game received a larger share of GEP, with a total of CNY 11.525 billion, more than those in the cooperative game. However, given individual rationality, eco-compensation in the non-cooperative game must be borne by each ECP separately, which makes it difficult to meet the actual demand. For example, in 2019, Meishan had to spend CNY 0.492 billion on eco-compensation in addition to the allocated GEP (See Figure 9). In such cases, local governments may face budget deficits due to failure to transform the ecosystem services without financial intervention from the central government. In contrast to the non-cooperative game, the ECP in the cooperative game received more GEP revenue, an increase of CNY 5.786 billion over the three years. In addition, the GEP allocated to the cities in the river basin is shown as positive from 2018 to 2020 in the cooperative game scenario. Under the cooperative game scenario, a total of CNY 7.049 billion in eco-compensation funds were saved in three years. This indicates that the allocation scheme better reflects the principle of watershed integrity and that mutual benefits can be realized through close cooperation between the ECP and the ECR. At the same time, the cooperative game reveals that the savings can be used to strengthen watershed management and further improve ecosystem services. To ensure the stability of the cooperative alliance, the central government should coordinate with local governments in the basin to ensure that each player strictly follows allocation rules to enhance environmental and economic benefits.
We also compared the eco-compensation under the two game scenarios with the actual eco-compensation. From Figure 10, it can be seen that the compensations of both games are larger than the actual compensations. In particular, the compensation under the non-cooperative game scenario is much higher than the actual compensation. In 2018, eco-compensation in the noncooperative and cooperative game scenarios was CNY 2.586 billion and CNY 0.24 billion, respectively, but actual compensation was only CNY 0.047 billion. In 2019, eco-compensation in the noncooperative and cooperative game scenarios was CNY 2.668 billion and CNY 0.309 billion, respectively, but actual compensation was only CNY 0.035 billion. This means that there is a large funding gap for actual ecological compensation, regardless of which game-based compensation scheme is chosen.
The cities within the Tuo River Basin vary in terms of economic development, population size, and water resources. However, current eco-compensation policies are mainly based on environmental performance indicators, such as water quality, water resource quantity, sewage discharge, and so on, ignoring the economic and social services provided by the watershed as an ecosystem [41]. This may further lead to a loss of fairness and efficiency of eco-compensation [42]. In this study, the GEP allocation contributes to defining the eco-compensation relationship in the watershed, which overcame the issue related to subjectivity in determining ECS and ECR based on water quality and quantity. For example, Chengdu is inherently recognized as an ECP under the classification criteria that focus on water consumption [27]. However, according to the results of the non-cooperative and cooperative games, Chengdu as an ECP should receive CNY 0.113 billion and CNY 0.013 billion in eco-compensation, respectively.
Based on the results, we provided the following policy implications: ① In the formulation of eco-compensation standards for watersheds, the heterogeneity of water resource carrying capacities and the socio-economic development should be fully taken into account. ② The ECP should improve water use efficiency and gradually transform resource-intensive industries into low-carbon industries. The ECR can provide ecological services trade on the premise of ensuring the security of ecosystem services, to promote sustainable use of resources. ③ Coordination between upstream and downstream areas is encouraged based on the criteria of equity and efficiency, to facilitate sustainable basin development in the river basin.
This study has some limitations: Firstly, it should be noted that due to the influence of GEP accounting boundaries, accounting indicators, and data availability, it is necessary to consider the establishment of a unified GEP accounting standard for watersheds, in order to better identify the compensation relationship between multi-stakeholders. Secondly, the game model simplifies the complex interactions among players in the allocation of eco-compensation. For example, this study considers only the strictest form of alliance in the cooperative game, which weakens the individual rationality of the alliance members. In addition, there is a need to explore the environmental bottom line faced in GEP transformation and to consider the correlation between GEP and environmental capacity in future studies.

5. Conclusions

This study contributed to the construction of a cooperative game and a non-cooperative game between the ECP and the ECR to select the optimal eco-compensation program. The roles regarding the ECP and ECR were determined by the difference between the gross ecosystem product (GEP) accounting results and the actual GEP outputs regarding a watershed. Cooperative and non-cooperative game-based system dynamics models were constructed separately for GEP allocation to investigate the change in strategic actions between the ECP and ECR.
Taking the Tuojiang River Basin as a case example, the results showed that the GEP increased from CNY 32.2 billion in 2018 to CNY 35.5 billion in 2020, with a growth rate of 10.2%. Of these, the regulating services contributed the most to the GEP, with a total of CNY 55.394 billion in the three years, accounting for 56.78%. Deyang City was played as the ECP, and it had positive GEP differentials, with a cumulative difference of CNY 11.759 billion. Neijiang City, Zigong City, and Luzhou City were played as the ECR, receiving revenues of 11.289 billion, 7.661 billion, and 1.497 billion, respectively. Chengdu City changed from the ECP to the ECR and ultimately to the ECP, and its difference in GEP from 2018 to 2020 was 0.991 billion, −0.219 billion, and 1.477 billion, respectively. From 2018 to 2020, Ziyang City and Meishan City changed from the ECP to the ECR, the former GEP differentials were 1.510 billion, 1.301 billion, and −1.137 billion, respectively, and the latter differentials were 2.457 billion, 2.133 billion, and −0.134 billion, respectively.
With regard to the eco-compensation allocation, the compensations increased for both non-cooperative and cooperative games, with ECP payments and ECR revenues in the former increasing by 16.5% and 4.6%, respectively; and in the latter increasing by 5.0% and 50.8%. However, a total of CNY 7.049 billion in eco-compensation funds was saved under the cooperative game scenario, whilst the non-cooperative game generated no savings in compensation. Although the cooperative game-driven allocation shows better economic and environmental benefits, there is still a funding gap for actual eco-compensation. This further calls for the improvement of the eco-compensation program.

Supplementary Materials

The following supporting information can be downloaded at: https://www.mdpi.com/article/10.3390/land12091698/s1, Supplementary File S1: GEP accounting system; Supplementary File S2: Model parameter and input. References [43,44,45] are cited in the supplementary materials.

Author Contributions

X.M., conceptualization, methodology, validation, writing—original draft. Y.Y. and R.Z., conceptualization, methodology, project administration, funding acquisition. X.X., writing—review and editing, validation. S.D., data curation, visualization. Q.M., investigation, validation. W.X., data curation, investigation. All authors have read and agreed to the published version of the manuscript.

Funding

This work was supported by the National Natural Science Foundation of China (Grant No. 42101315, 41571520), the Sichuan Youth Science and Technology Innovation Team Funding (Grant No. 2022JDTD0005), the Natural Science Foundation of Sichuan Province (Grant No. 2022NSFSC1012), the Open Fund of Sichuan Province Cyclic Economy Research Center (Grant No. XHJJ-2005, XHJJ-2002), the Fundamental Research Funds for the Central Universities (Grant No. 2682021CX069, 2682021ZTPY088), and the Consulting research project of Chinese Academy of Engineering (Grant No. Q113520S02003).

Data Availability Statement

Not applicable.

Conflicts of Interest

The authors declare no conflict of interest.

References

  1. Cao, H.; Li, M.; Qin, F.; Xu, Y.; Zhang, L.; Zhang, Z. Economic development, fiscal ecological compensation, and ecological environment quality. Int. J. Environ. Res. Public Health 2022, 19, 4725. [Google Scholar] [CrossRef] [PubMed]
  2. Jiang, Y.; Guan, D.; He, X.; Yin, B.; Zhou, L.; Sun, L.; Huang, D.; Li, Z.; Zhang, Y. Quantification of the coupling relationship between ecological compensation and ecosystem services in the Yangtze River Economic Belt, China. Land Use Policy 2022, 114, 105995. [Google Scholar] [CrossRef]
  3. Yu, Y.; Zhou, T.; Zhao, R.; Zhang, J.; Min, X. Bi-level hybrid game model for optimal operation of multi-function reservoir considering integrated water resource management. Environ. Sci. Pollut. Res. 2022, 1–18. [Google Scholar] [CrossRef]
  4. Guan, X.; Liu, W.; Chen, M. Study on the ecological compensation standard for river basin water environment based on total pollutants control. Ecol. Indic. 2016, 69, 446–452. [Google Scholar] [CrossRef]
  5. Larson, J.S.; Mazzarese, D.B. Rapid assessment of wetlands: History and application to management. In Global Wetlands: Old World and New; Mitsch, W.J., Ed.; Elsevier: Amsterdam, The Netherlands, 1994; pp. 625–636. [Google Scholar]
  6. Chomitz, K.M.; Brenes, E.; Constantino, L. Financing environmental services: The Costa Rican experience and its implications. Sci. Total Environ. 1999, 240, 157–169. [Google Scholar] [CrossRef]
  7. Sun, G.; Wei, X.; Hao, L.; Sanchis, M.G.; Hou, Y.; Yousefpour, R.; Zhang, Z. Forest hydrology modeling tools for watershed management: A review. Forest Ecol. Manag. 2023, 530, 120755. [Google Scholar] [CrossRef]
  8. Wang, Y.; Wu, X.; Shen, J.; Chi, C.; Gao, X. Analysis on Decision-making changes of multilevel governments and influencing factors in river basin ecological compensation. Complexity 2021, 2021, 6860754. [Google Scholar] [CrossRef]
  9. Pattanayak, S.K.; Wunder, S.; Ferraro, P.J. Show Me the Money: Do payments supply environmental services in developing countries? Rev. Environ. Econ. Policy 2010, 4, 254–274. [Google Scholar] [CrossRef]
  10. Rao, Q.; Lin, X.; Chen, F.; Chen, W.; Lin, Y.; Zeng, Y. Research into an ecological compensation standard in the Minjiang River Basin under the combined scenario of ‘clear property rights, water quality and quantity, and opportunity cost’. Water Supply 2022, 22, 7873–7883. [Google Scholar] [CrossRef]
  11. Yang, Y.; Zhang, X.; Chang, L.; Cheng, Y.; Cao, S. A method of evaluating ecological compensation under different property rights and stages: A case study of the Xiaoqing River Basin, China. Sustainability 2018, 10, 615. [Google Scholar] [CrossRef]
  12. Wei, C.; Luo, C. A differential game design of watershed pollution management under ecological compensation criterion. J. Clean. Prod. 2020, 274, 122320. [Google Scholar] [CrossRef]
  13. Mahjouri, N.; Ardestani, M. A game theoretic approach for inter basin water resources allocation considering the water quality issues. Environ. Monit. Assess. 2010, 167, 527–544. [Google Scholar] [CrossRef]
  14. Li, D.; Zhao, J.; Govindaraju, R.S. Water benefits sharing under transboundary cooperation in the Lancang-Mekong River Basin. J. Hydrol. 2019, 577, 123989. [Google Scholar] [CrossRef]
  15. Chen, Y.; Park, B.; Kou, X.; Hu, M.; Dong, J.; Li, F.; Olama, M. A comparison study on trading behavior and profit distribution in local energy transaction games. Appl. Energy 2020, 280, 115941. [Google Scholar] [CrossRef]
  16. Jiang, K.; You, D.; Li, Z.; Shi, S. A differential game approach to dynamic optimal control strategies for river basin pollution across regional boundaries under eco-compensation criterion. Ecol. Indic. 2019, 105, 229–241. [Google Scholar] [CrossRef]
  17. Bai, M.; Zhou, S.; Zhao, M. Cyanobacterial bloom control in Taihu Basin: Analysis of cost-risk analysis framework based on cooperative game. J. Clean. Prod. 2018, 195, 318–327. [Google Scholar] [CrossRef]
  18. Qin, J.; Fu, X.; Peng, S.; Xu, Y.; Huang, J.; Huang, S. Asymmetric bargaining model for water resource allocation over transboundary rivers. Int. J. Environ. Res. Public Health 2019, 16, 1733. [Google Scholar] [CrossRef]
  19. Zhang, J.Y.; Song, Y.; Wang, J. Spatiotemporal patterns of gross ecosystem product across China’s cropland ecosystems over the past two decades. Front. Ecol. Evol. 2022, 10, 959329. [Google Scholar] [CrossRef]
  20. Ding, J.; Chen, L.; Deng, M.; Chen, J. A differential game for basin ecological compensation mechanism based on cross-regional government-enterprise cooperation. J. Clean. Prod. 2022, 362, 132335. [Google Scholar] [CrossRef]
  21. Jiang, K.; Merrill, R.; You, D.; Pan, P.; Li, Z. Optimal control for transboundary pollution under ecological compensation: A stochastic differential game approach. J. Clean. Prod. 2019, 241, 118391. [Google Scholar] [CrossRef]
  22. Shi, G.M.; Wang, J.; Zhang, B.; Zhang, Z.; Zhang, Y. Pollution control costs of a transboundary river basin: Empirical tests of the fairness and stability of cost allocation mechanisms using game theory. J. Environ. Manag. 2016, 177, 145–152. [Google Scholar] [CrossRef]
  23. Han, Q.; Tan, G.; Fu, X.; Mei, Y.; Yang, Z. Water resource optimal allocation based on multi-agent game theory of Hanjiang River Basin. Water 2018, 10, 1184. [Google Scholar] [CrossRef]
  24. Gao, X.; Shen, J.; He, W.; Sun, F.; Zhang, Z.; Guo, W.; Zhang, X.; Kong, Y. An evolutionary game analysis of governments’ decision-making behaviors and factors influencing river basin ecological compensation in China. J. Environ. Manag. 2019, 251, 109592. [Google Scholar] [CrossRef] [PubMed]
  25. Zhou, G.; Wang, Q.; Zhang, J.; Li, Q.; Wang, Y.; Wang, M.; Huang, X. Distribution and characteristics of microplastics in urban waters of seven cities in the Tuojiang River basin, China. Environ. Res. 2020, 189, 109893. [Google Scholar] [CrossRef]
  26. Zhang, M.; Ni, J.; Yao, L. Pigovian tax-based equilibrium strategy for waste-load allocation in river system. J. Hydrol. 2018, 563, 223–241. [Google Scholar] [CrossRef]
  27. He, L.; Yao, L.; Jiang, H. Optimal allocation and transaction of waste load permits for transboundary basin: A Bi-level programming approach based on node-arc. J. Environ. Manag. 2022, 307, 114550. [Google Scholar] [CrossRef]
  28. Hu, Q.; Lu, C.; Chen, T.; Chen, W.; Yuan, H.; Zhou, M.; Bao, L. Evaluation and analysis of the gross ecosystem product towards the sustainable development goals: A case study of Fujian Province, China. Sustainability 2023, 15, 3925. [Google Scholar] [CrossRef]
  29. Zhao, N.; Wang, H.; Zhong, J.; Bai, Y.; Yi, S. Evaluation of the gross ecosystem product and analysis of the transformation path of “Two Mountains” in Hulunbuir City, China. Land 2022, 12, 63. [Google Scholar] [CrossRef]
  30. Zhou, X.; Wang, Q.; Zhang, R.; Ren, B.; Wu, X.; Tang, J. A spatiotemporal analysis of Hainan Island’s 2010–2020 gross ecosystem product accounting. Sustainability 2022, 14, 15624. [Google Scholar] [CrossRef]
  31. Chinese Academy of Environmental Planning. The Technical Guideline on Gross Ecosystem Product (GEP); Chinese Academy of Environmental Planning: Beijing, China, 2020. [Google Scholar]
  32. Sichuan Provincial Bureau of Statistics. Sichuan Statistical Yearbook 2018; China Statistics Press: Beijing, China, 2018. [Google Scholar]
  33. Sichuan Provincial Bureau of Statistics. Sichuan Statistical Yearbook 2019; China Statistics Press: Beijing, China, 2019. [Google Scholar]
  34. Sichuan Provincial Bureau of Statistics. Sichuan Statistical Yearbook 2020; China Statistics Press: Beijing, China, 2020. [Google Scholar]
  35. Sichuan Provincial Bureau of Statistics. Statistical Bulletin on National Economic and Social Development in Sichuan Provincial 2018; Municipal Bureau of Statistics: Chengdu, China, 2018.
  36. Sichuan Provincial Bureau of Statistics. Statistical Bulletin on National Economic and Social Development in Sichuan Provincial 2019; Municipal Bureau of Statistics: Chengdu, China, 2019.
  37. Sichuan Provincial Bureau of Statistics. Statistical Bulletin on National Economic and Social Development in Sichuan Provincial 2020; Municipal Bureau of Statistics: Chengdu, China, 2020.
  38. Li, Y.; Chen, X.; Feng, X.; Lv, Y.; Zhang, Z.; Qi, Q. Investigation of the allocation and trading strategy of wastewater emission permits considering ecological compensation. Environ. Technol. Innov. 2023, 30, 103103. [Google Scholar] [CrossRef]
  39. Deng, H.; Yang, J.; Wang, P. Study on coupling coordination relationship between urban development intensity and water environment carrying capacity of Chengdu–Chongqing Economic Circle. Sustainability 2023, 15, 7111. [Google Scholar] [CrossRef]
  40. Luzhou Municipal Bureau of Statistics. Statistical Bulletin on National Economic and Social Development in Luzhou; Luzhou Municipal Bureau of Statistics: Luzhou, China, 2020. [Google Scholar]
  41. Yu, Y.; Zhao, R.; Zhang, J.; Yang, D.; Zhou, T. Multi-objective game theory optimization for balancing economic, social and ecological benefits in the Three Gorges Reservoir operation. Environ. Res. Lett. 2021, 16, 085007. [Google Scholar] [CrossRef]
  42. Shang, W.; Gong, Y.; Wang, Z.; Stewardson, M.J. Eco-compensation in China: Theory, practices and suggestions for the future. J. Environ. Manag. 2018, 210, 162–170. [Google Scholar] [CrossRef] [PubMed]
  43. Bi, F.; Zhou, H.; Zhu, M.; Wang, W. Economic benefit evaluation of water resources allocation in transboundary basins based on particle swarm optimization algorithm and cooperative game model: A case study of Lancang-Mekong River Basin. PLoS ONE 2022, 17, 0265350. [Google Scholar] [CrossRef] [PubMed]
  44. Li, J.; Cui, T.; Kendall, G. Equilibrium in a bargaining game of two sellers and two buyers. Mathematics 2022, 10, 2705. [Google Scholar] [CrossRef]
  45. Department of Ecology and Environment of Sichuan Province. Compensation Agreement for the Ecological Protection of the Tuojiang River Basin; Department of Ecology and Environment of Sichuan Province: Chengdu, China, 2020. [Google Scholar]
Figure 1. Location of the study area.
Land 12 01698 g001
Figure 2. GEP accounting system.
Land 12 01698 g002
Figure 3. System dynamics model based on non-cooperative game.
Land 12 01698 g003
Figure 4. System dynamics model based on cooperative game.
Land 12 01698 g004
Figure 5. GEP accounting results of Tuojiang River Basin from 2018 to 2020.
Land 12 01698 g005
Figure 6. Difference between the GEP accounting results and the actual GEP outputs from 2018 to 2020.
Land 12 01698 g006
Figure 7. Non-cooperative game-based eco-compensation allocation from 2018 to 2020.
Land 12 01698 g007
Figure 8. Cooperative game-based eco-compensation allocation from 2018 to 2020.
Land 12 01698 g008
Figure 9. Compensation comparison between the non-cooperative game and the cooperative game from 2018 to 2020.
Land 12 01698 g009
Figure 10. Comparison between game-based eco-compensation and actual eco-compensation.
Land 12 01698 g010
Disclaimer/Publisher’s Note: The statements, opinions and data contained in all publications are solely those of the individual author(s) and contributor(s) and not of MDPI and/or the editor(s). MDPI and/or the editor(s) disclaim responsibility for any injury to people or property resulting from any ideas, methods, instructions or products referred to in the content.

