Article

Spatial Association Rules and Thermal Environment Differentiation Evaluation of Local Climate Zone and Urban Functional Zone

1
Shandong Academy of Sciences Environmental, Jinan Lishan Road 50, Jinan 250013, China
2
Chinese Academy of Surveying and Mapping, Lianhuachi West Road 28, Beijing 100036, China
3
School of Information Engineering, China University of Geosciences in Beijing, No. 29, Xueyuan Road, Haidian District, Beijing 100083, China
*
Author to whom correspondence should be addressed.
Land 2023, 12(9), 1701; https://doi.org/10.3390/land12091701
Submission received: 12 July 2023 / Revised: 18 August 2023 / Accepted: 24 August 2023 / Published: 30 August 2023
(This article belongs to the Section Land Systems and Global Change)

Abstract

:
Urban heat islands (UHIs) caused by urbanization have become a major issue affecting the sustainable development of the ecological environment. The distribution of UHIs is mainly affected by the reflection and transmission of heat radiation caused by differences in urban spaces, and the anthropogenic heat emissions caused by social activities. At present, the research on the urban thermal environment involves two spatial classification systems: local climate zone (LCZ), based on urban morphology and spatial patterns; and urban functional zone (UFZ), based on socio-economic activities. It is not clear whether there are association rules between these two systems in different cities. Against this background, this study explores the association rules between the UFZ and LCZ classification systems using the selected Chinese cities in different regions as typical examples. Our results confirm that there are common association rules from UFZ to LCZ, as the form of buildings is greatly influenced by the types of functional areas in urban construction. Specifically, the medical zone corresponds to the compact mid-rise zone (LCZ2); the business service area and the office area also correspond to the compact zone (LCZ1-LCZ3); and the industrial area corresponds to the compact low-rise zone (LCZ3). These functional zones have the same association rules in different cities. The cross-regional mining of the relationship between different urban functional systems will help to coordinate different planning departments and carry out the integration of multiple spatial plans. Furthermore, we found that LCZ has a better differentiation effect on the surface temperature through our comparison research, which makes it more suitable as a reference for research on the thermal environment and the heat island effect.

1. Introduction

According to the report “State of the Climate in 2021” released by the World Meteorological Organization [1], four key climate change indicators, including greenhouse gas concentration, rise in sea level, ocean heat, and ocean acidification, set new records in 2021. China’s average surface temperature, coastal sea level, and other climate change indicators also broke the observation records in 2021. These factors may have harmful and long-lasting impacts on sustainable development and ecosystems. Under the trend of global climate change, urban warming has attracted more and more attention, as the high temperature will accelerate energy consumption [2], aggravate air pollution [3], and endanger human health [4]. Therefore, understanding the distribution and characteristics of the urban thermal environment is of great significance and has practical value for improving urban resilience. Urban heat islands (UHIs) are mainly caused by the combined effects of the urban underlying surface, water vapor, air pollution, vegetation reduction, artificial heat sources, and other comprehensive factors [5,6]. Due to the rapid expansion of urban constructions, various building materials have changed the thermal transmission characteristics of the underlying surface. These building materials have a higher absorption rate of solar radiation than natural vegetation, which causes the urban surface temperature to continue to rise, and it is difficult to release the heat absorbed by the surface [7]. In addition, human activities and the process of industrialization can release large amounts of carbon dioxide, sulfur dioxide, and nitrogen oxides into the air. The increasing density of these substances will produce a greenhouse effect in urban areas that will enhance the UHI effect [8]. Recent research on the driving mechanism of the urban thermal environment mostly begin with the aspect of the land cover of the city itself, the impact of human activities, and the changes in physical conditions. The composition and configuration of surface components, urban development, and scale are the key factors affecting the UHI effect [9,10]. From the perspective of research methods, the current focus is on using a linear regression model to build a quantitative relationship between the surface temperature, biophysical parameters, and socio-economic factors [11,12,13]. Combined with an urban classification system, the mechanism of these thermal environmental parameters can be spatially analyzed, and the pertinence of the implementation of UHI mitigation strategies for cities from different regions can be improved.
Therefore, a rational division of the city has become crucial in studying the spatial heterogeneity of the factors influencing the UHI effect. Traditional research units, such as land covers [14], blocks [15], and administrative boundaries [16], have difficulty depicting the physical characteristics of cities based on the division of natural and human elements. Previous studies have shown that the UHI is mainly affected by human activities of different intensities and types [17,18]. Therefore, urban functional zones (UFZ) (such as commercial areas, residential areas, industrial areas, etc.) are divided in order to analyze the relationship between urban morphology and surface temperature on the basis of comparing surface temperatures in each functional zone [19]. It has been confirmed that there are significant differences in anthropogenic heat emissions in different functional zones [20]. Such research can be instrumental in aiding urban planners with effectively evaluating and enhancing the thermal environment of each functional zone. However, the correlation between urban functional zones and urban morphology has not been sufficiently studied. There could be situations in which the morphological characteristics of the same functional zones are very different and the morphological characteristics of different functional zones are similar [19]. Thus, another classification system based on local climate zones (LCZ) has been proposed [21]. According to the difference in the response ability of different urban morphology types to the thermal environment, cities can be divided into 10 types of built-up zones (LCZ1-LCZ10) and 7 types of natural covers (LCZA-LCZG). Similar LCZs have similar morphological characteristics and temperature attributes. Bechtel et al. [22] utilized remote sensing image classification technology to create the World Urban Database and Access Portal Tool (WUDAPT), a platform that facilitates the dissemination and implementation of the LCZ classification system. As the idea of local climate zoning meets the demand for a combination of urban climate research and urban planning, it has been widely recognized in the studies of the relationship between urban morphology and the UHI effect. Research based on LCZ has been carried out in cities around the world [23,24,25]. For example, Shi et al. [23] studied a method for LCZ classification with higher accuracy and found that combining multiple sources of data, no matter how many, cannot effectively improve accuracy. Jiang et al. [24] studied the effects of PM2.5 and PM10 diffusion based on LCZ. Yang et al. [25] studied the temperature characteristics of each LCZ in different seasons in Shenyang, China and the correlation with urban morphology indicators. Xu et al. [26] demonstrated that utilizing LCZ to construct a surface temperature prediction model leads to improved accuracy. Cai et al. [27] studied the urban agglomeration of the Yangtze River Delta in China, and concluded that the LCZ types with high land surface temperatures (LSTs) in different cities were consistent. However, according to the definition of LCZ, its division focuses on the description of surface morphology and texture, while the geographical location and human activity differences of LCZ are not fully considered. Therefore, there may be a certain temperature difference for the same LCZ type due to their various geographical locations in the city. Previous studies have shown that the average LST of a single LCZ distributed in different areas of the city can be significantly different, and the temperatures of different cities in the same LCZ may also show significant differences [28,29,30].
Based on the above research, it can be seen that the analysis of UHI has two spatial structures: the LCZ classification system, dominated by urban form, and the UFZ classification system, dominated by socio-economic activities. A large number of scholars have carried out thermal environment analysis based on these two systems, but have not systematically analyzed the applicability of these two classification systems for UHI studies. And it is still not known whether there are common association rules between these two classification systems in different cities. In this paper, the urban thermal environments of UFZ and LCZ are analyzed and evaluated. A comparative study is carried out in order to find out the association rules between the two classification systems. By investigating the association rules between different classification systems of UFZ and LCZ, we aim to develop a comprehensive “code-book” with which to effectively translate inter-departmental planning schemes. This can be used as a reference for the relevant thermal environment research, and assist urban planners in creating UHI mitigation policies tailored to local conditions.

2. Study Area and Data Collection

2.1. Study Area

Beijing (the capital of China), Harbin, Wuhan, and Guangzhou (three provincial capitals) were selected as the study areas (Figure 1). According to China’s urban scale grading standards, Beijing and Guangzhou are megacities, Wuhan is a supercity, and Harbin is a big city. These four cities cover the northern and southern regions of China (Northeast—Harbin, North—Beijing, Central—Wuhan, South—Guangzhou). In recent decades, they all have experienced large-scale and rapid urbanization processes. The climates and landscapes in these cities vary significantly due to natural conditions and human social factors. Therefore, the choice of these cities for this research holds broad significance and represents different aspects of China.

2.2. Data Sources

In this study, Landsat 8 images were used to retrieve LST. LCZ was mainly divided by using images from Google Earth, base data on the buildings, and Landsat 8 images. The UFZ data were obtained from the public data source of Tsinghua University (Table 1). They were based on Sentinel remote sensing data, OpenStreetMap data, Luojia No.1 night light data, Tencent mobile positioning, and Points of Interest (POI) in Gaode navigation data, as well as other social and transportation-related big data, to divide urban functional areas in 2018 [31]. In this study, we only focused on urban areas and used built-up area boundaries to clip the UFZ data of the selected cities (Figure 2). For the city of Beijing, the built-up area is mainly concentrated inside the Fifth Ring Road. Therefore, it was used to clip the study area of Beijing. This study also used building base vector data as a reference for constructing LCZ. The building base vector dataset which we used was obtained from the National Qinghai Tibet Plateau Science Data Center [32], and was extracted using high-resolution remote sensing images and deep learning semantic segmentation methods. The raster and vector data used in this paper are shown in Table 1.

3. Method

3.1. Local Climate Zones (LCZs) Classification

This study was based on the standard LCZ classification method proposed by Burke et al. in 2015 [22]. The specific classification includes four stages: (1) The sizes of LCZ units for different cities were determined based on urban building height data and a semivariogram function. (2) Based on summer images and street views from 2016 to 2019, samples such as LCZ1-LCZ10, LCZE, LCZF, LCZW, and LCZT were manually selected on the Google Earth platform (http://maps.bimw.cn/baidujiejing/, accessed on 18 August 2023) (Figure 3). (3) According to the provided training samples and Satellite imagery, the whole study area was divided into different LCZ categories using the LCZ Random forest classifier. Finally, the LCZ mapping results were validated using the obtained validation samples.

3.2. LCZ and UFZ Association Rule Mining

The classification systems of UFZ and LCZ are different, but they are spatially and semantically related [33]. Mining the association rules between urban functional systems can help to coordinate multiple departments in order to complete territorial spatial planning [34]. Multi-system urban functions are interrelated: for example, shantytowns in the land use system may appear as slums in the socio-economic system and compact low-rise buildings in the LCZ system. In this research, the association rules between the established LCZ and the existing UFZ data were explored using the following steps:
(1)
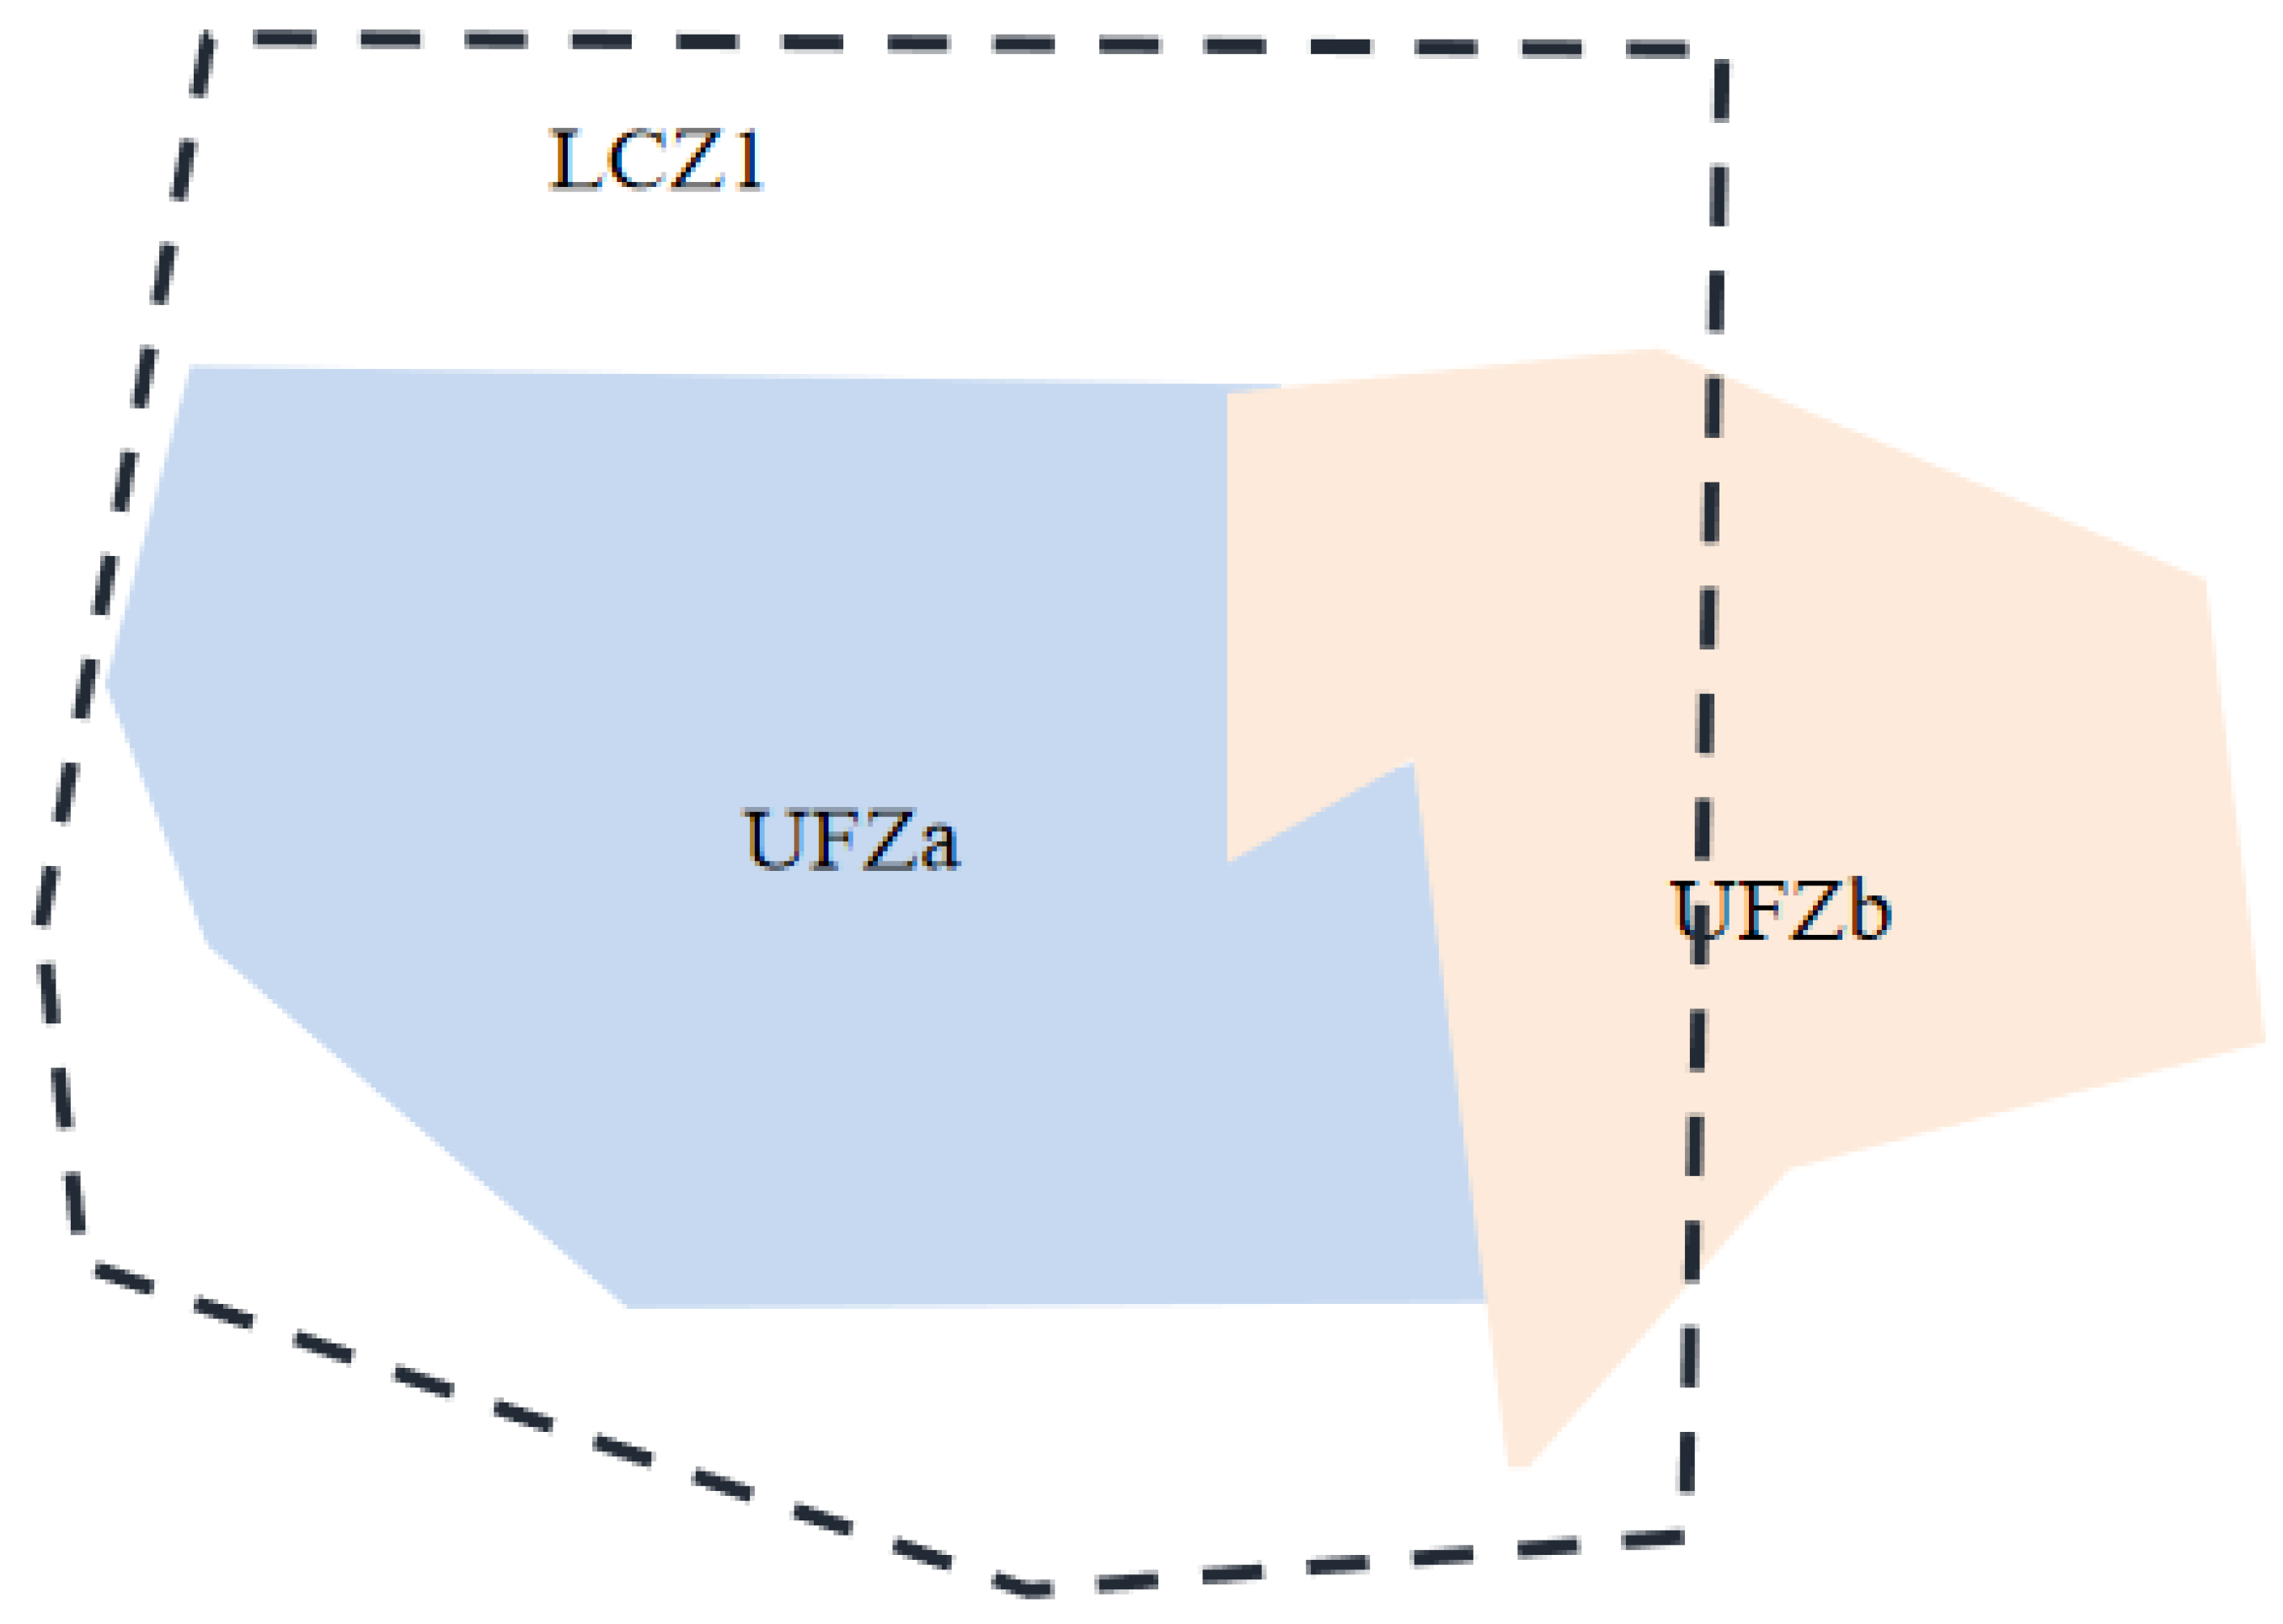
Overlay analysis was conducted by calculating the spatial overlap of the two systems. The urban function classification results of different systems were spatially superimposed. As shown in Figure 4, a local climate zone (LCZ1) intersects several functional zones (UFZa and UFZb). Their spatial overlap area can be expressed as LCZ1 ∩ UFZa and LCZ1 ∩ UFZb. The spatial correlation degree (SCD) of UFZa in the functional area to LCZ1 was calculated as follows: SCD (LCZ1|UFZa) = (LCZ1 ∩ UFZa)/UFZa (i.e., 100% in Figure 4). The SCD of LCZ1 to UFZa was calculated as follows: SCD (UFZa|LCZ1) = LCZ1 ∩ UFZa/LCZ1 (i.e., 40% in Figure 4).
(2)
Ranking the correlation degrees: a correlation degree of 70–100% is high; 30–70% is medium; and less than 30% is low.
(3)
According to the above two steps, we obtained the results regarding the degree of correlation of each block with other types of blocks. We filtered out all blocks with high correlation degrees, and used Apriori algorithm to mine the association rules of UFZ and LCZ.
The Apriori algorithm process is divided into two steps [35]: (1) All frequent item sets in the database were retrieved through iteration to identify the item sets whose support was not lower than the threshold set by the user. (2) The association rules satisfying the minimum confidence defined by users were constructed using frequent item sets. The support of the association rules was calculated by dividing the number of item sets that contained both X and Y by the total number of item sets. The frequency at which the item sets contained both items, X and Y, together was measured. This measure was denoted as support (X => Y). The confidence level of the association rule was defined as the ratio of the number of item sets containing X and Y to the number of item sets containing X, which was recorded as confidence (X => Y). The confidence level reflects the probability of the occurrence of item Y in item sets containing X. The algorithm follows an iterative process of continuous cycling until no more frequent item sets can be found. By going through these steps, the spatial association rule mining is effectively converted into association rule mining. This approach provides a valuable framework for mining association rules in a multiple urban classification system.

3.3. Land Surface Temperature Retrieval

We used Landsat 8 images to determine the surface temperature based on the radiation transfer equation method [36]. The main formula of this method is as follows:
L S T = K 2 / ln ( K 1 / B + 1 )  
B = ( L λ L μ τ × ( 1 ε ) × L d ) / ( ε × τ )  
where B is the radiance value of blackbody in thermal infrared band; Lλ is the spectral radiation of the sensor; Lu, Ld, and τ represent atmospheric upward radiation, atmospheric downward radiation, and atmospheric transmittance, which can be found on NASA’s official website-https://atmcorr.gsfc.nasa.gov/ (accessed on 1 May 2022) according to the imaging time and central latitude and longitude of the image; K1 and K2 can be obtained from the image header file; and ε is the surface emissivity, which is an important parameter for temperature inversion. Due to the various types of surface coverage in the study area, we adopted the algorithm proposed by Qin et al. [37].

3.4. Geographic Detector Analysis

The geographic detector method is theoretically a spatial statistical method, and was proposed by Wang et al. [38,39]. The premise is that if the spatial stratification heterogeneity of two variables tends to be consistent, then the two variables are related. It can be used to explore the driving force of response variables. The geographical detector can be applied for both numerical data and deterministic data, which is a major advantage of the method. It calculates the parameter of the q value of each single factor, which indicates the extent to which each factor explains the spatial differentiation of dependent variables. The minimum q value is 0 and the maximum is 1. The larger the q value is, the greater the degree of spatial differentiation interpretation of the dependent variable. Linear regression is a classic statistical method. It assumes that all variables in the regression model are independent and share similar spatial distributions. It ignores the spatial characteristics of variable data and does not consider the spatial stratification heterogeneity. Technically, linear regression may lead to biased and incomplete results. Therefore, in this study, we used the geographic detector model to study the application effect of LCZ and UFZ in the field of thermal environment.
The geographic detector model includes four modules, namely, the factor detector, interaction detector, risk detector, and ecological detector. This study mainly uses the factor detector. It identifies the factors that are responsible for the independent variable. The explanatory power of each factor is measured by its q value:
q = 1 h = 1 L N h σ h 2 N σ 2
where h (1, …, L) is the number of sub-regions of factor X; N represents the total number of spatial units in the whole study area; Nh represents the number of samples in h partition; and σ and σh represent the total variance and variance of samples in sub-region h.

4. Results and Discussion

4.1. LCZ Classification Results

As shown in Figure 5, the local climate zone in Guangzhou is mainly dominated by LCZ4, with LCZ2, LCZ5, and LCZ6 each accounting for 15%. In addition, LCZ7 and LCZ8 also account for 7.3% and 8.8%, respectively. LCZ4 and LCZ5 in Wuhan showed the highest proportion, accounting for 42% in total, followed by LCZ2 and LCZ8, accounting for 10.8% and 9.5%, respectively. In Harbin, LCZ4 accounted for 32%, followed by LCZ2 and LCZ3, accounting for 16.9% and 12.5%, respectively, and LCZ8 accounted for 10.5%. In Beijing’s Fifth Ring Road, the dense high-rise buildings (LCZ1) showed the highest proportion, accounting for 41.6% of the total area. The second ring was mainly composed of dense mid-rise buildings (LCZ2). Dense low-rise buildings and open high-rise buildings accounted for the same proportion, each accounting for 7%, mostly scattered between the fourth and fifth rings. The proportion of heavy industrial areas (LCZ10) and very open low floors (LCZ9) was very small.
According to the population data, the ranking order of population density is Beijing, Guangzhou, Wuhan, and Harbin. In order to accommodate more people in cities, urban planners tend to increase the density of the buildings or the height of the urban constructions. Beijing and Guangzhou, with large population densities, are dominated by dense local climate zones. The ratio of dense to open local climate zones in the Beijing Research Area is 7:3, and the ratio of dense to open local climate zones in the Guangzhou Research Area is 6:4. Wuhan has a large proportion of open local climate zones in the built-up urban areas, but the proportion of high local climate zones is significantly higher than that of mid- and low-rise buildings. The proportion of open and dense climate zones in urban built-up areas in Harbin is relatively average. Basically, it tends to be 5:5, and the proportion of high, middle, and low climate zones is 5:3:2.

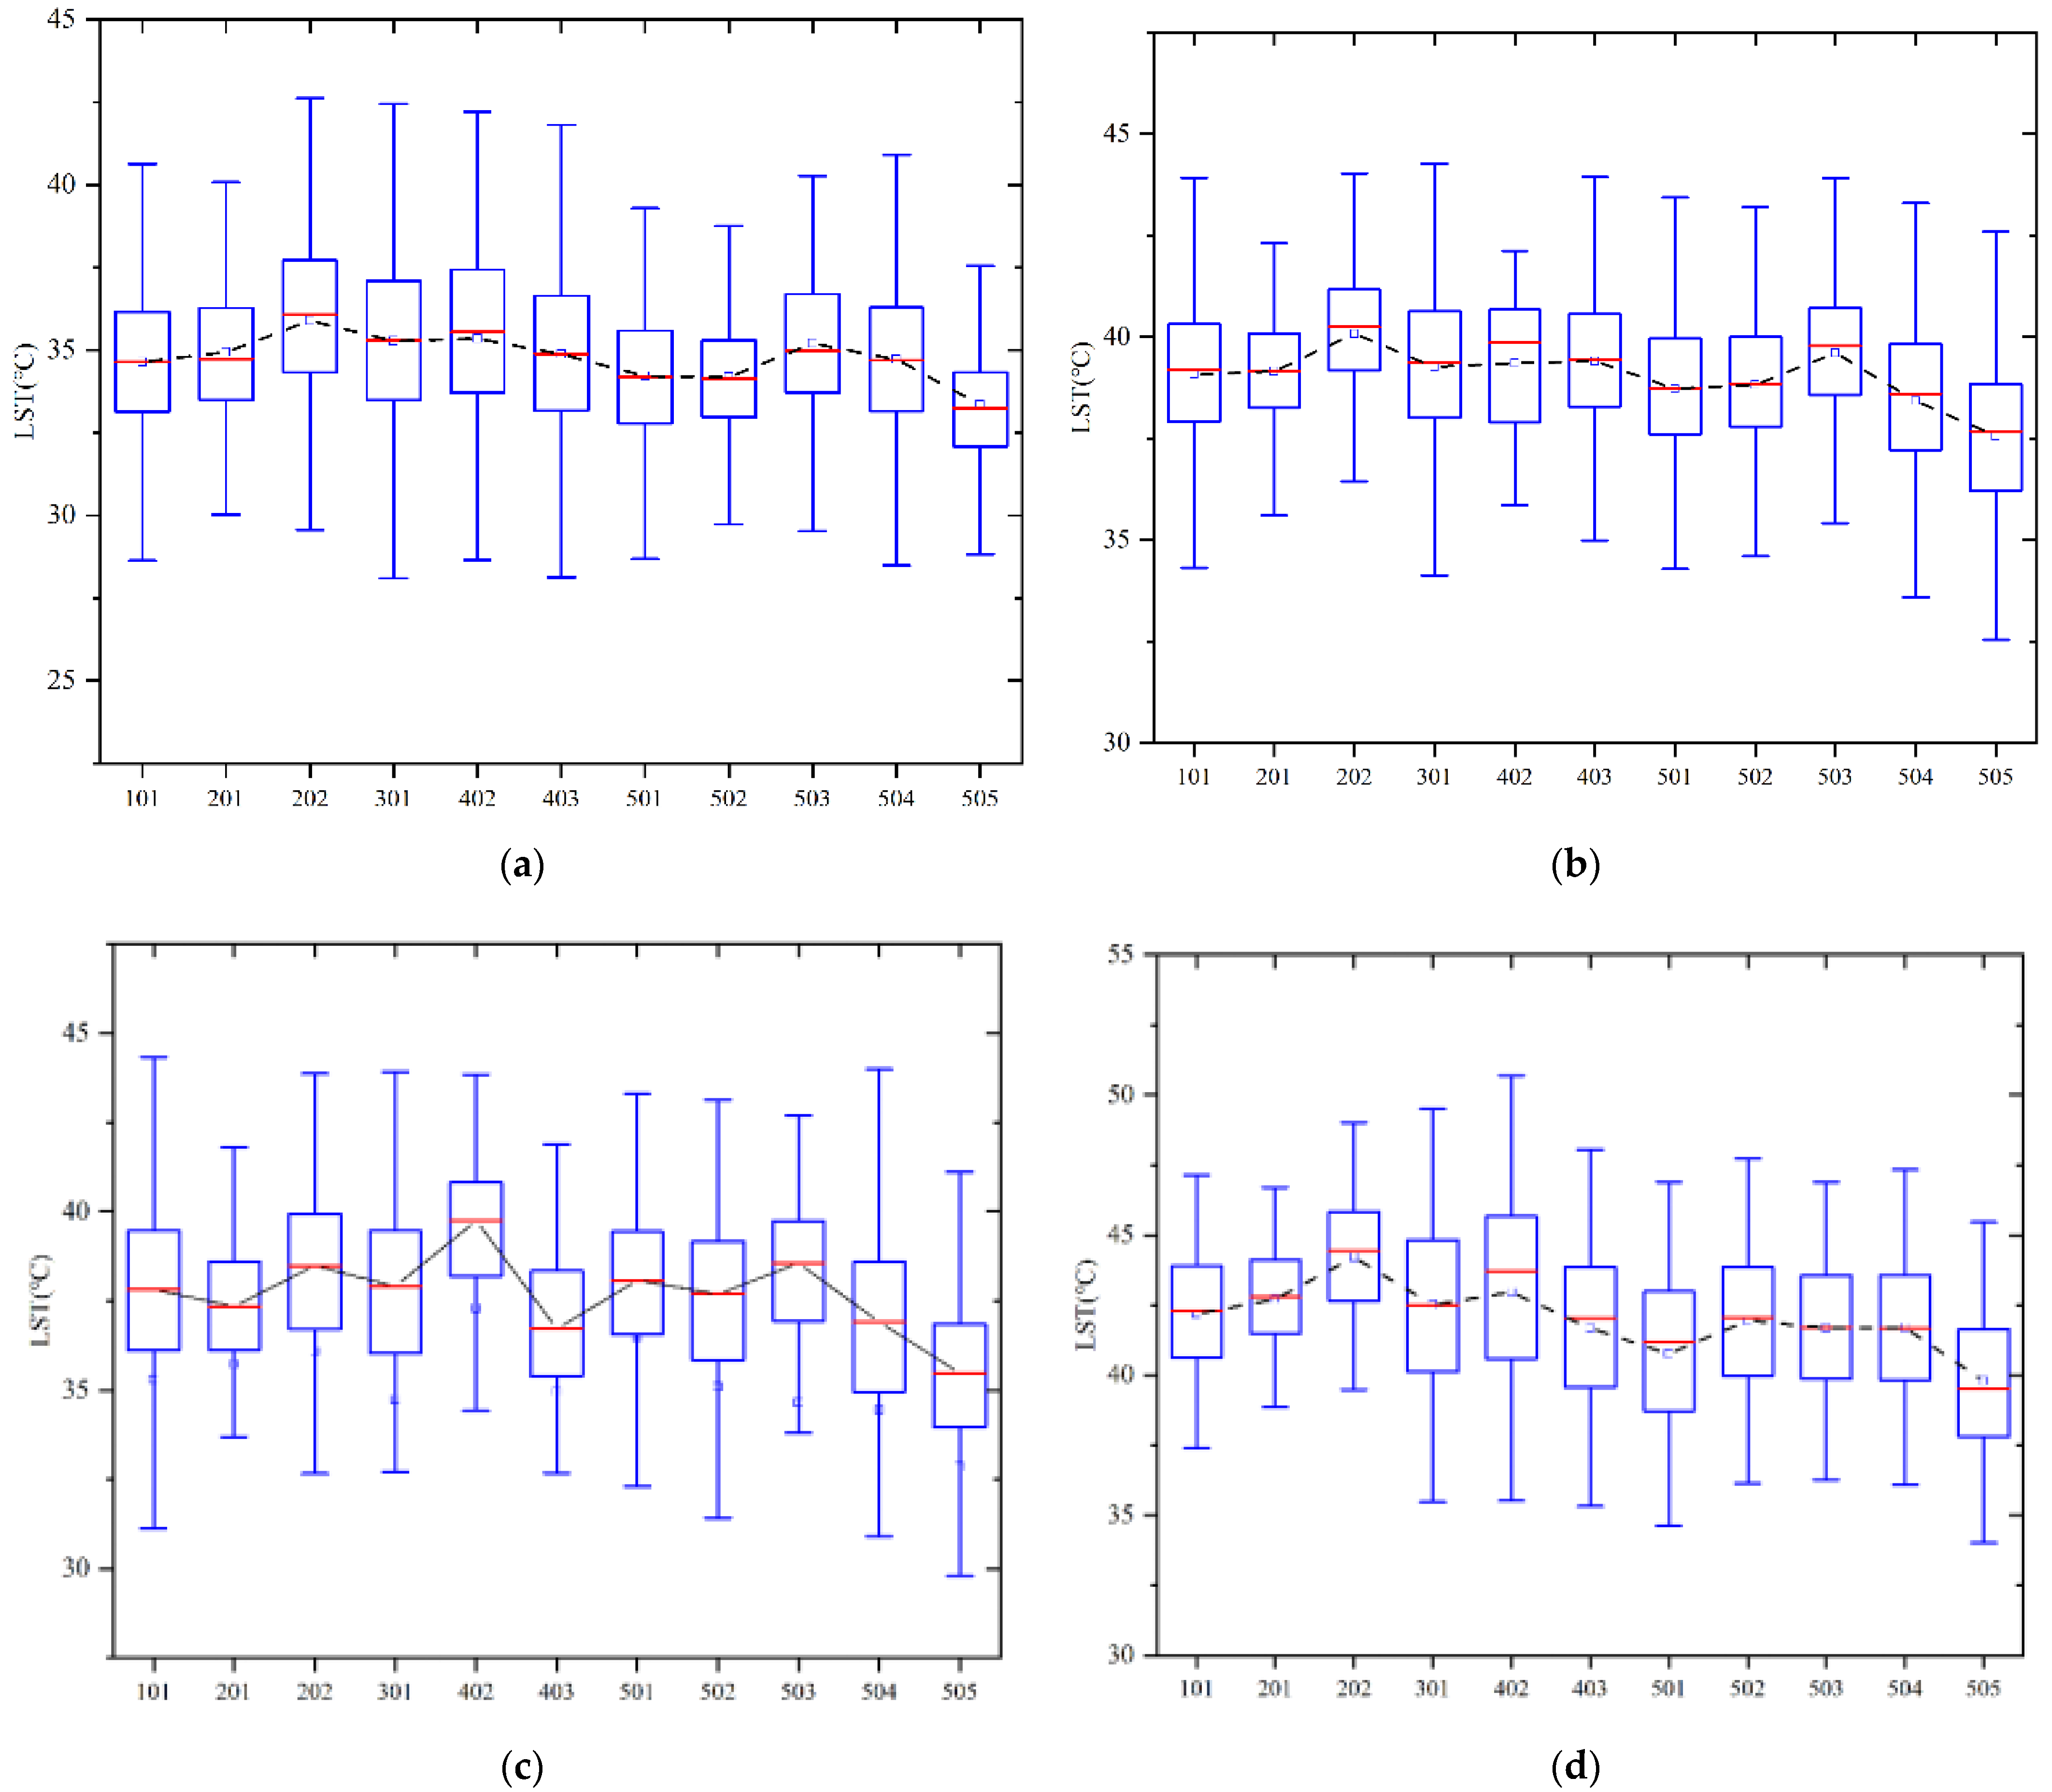
4.2. Surface Temperature Distribution

According to Figure 6 and Figure 7, it can be seen that there are certain similarities in each area. The areas with non-urban cover types (LCZF, LCZT, LCZW) are smaller than those with other urban cover types, and the surface temperature demonstrates the general rule of LCZF > LCZT > LCZW. This shows that in the urban environment, the heat capacity of the impervious surface is higher, and it absorbs more heat after receiving solar radiation, while vegetation and water have obvious cooling effects [37].
When the building height is equal, the Surface Urban Heat Island (SUHI) of a compact building area will be significantly higher than that of an open building, for example, the compact high-rise zone (LCZ1) > the open high-rise zone (LCZ4); the compact mid-rise zone (LCZ2) > the open mid-rise zone (LCZ5); and the compact low-rise zone (LCZ3) > the open low-rise zone (LCZ6). This is primarily due to the fact that compact building areas have a greater amount of hard surfaces, which results in increased heat absorption and limited ventilation. On the other hand, open building areas benefit from good air circulation and higher vegetation cover, which helps to mitigate the heat island effect through transpiration and shading from daylight. Furthermore, it is worth noting that the height of the climate zone is often linked to the surface temperature, as observed in the study. At equal density, the rule that the middle floor is larger than the lower and higher floor climate zones is generally common in each study area. This phenomenon may be due to the mutual shielding of floor shadows in high-rise buildings, resulting in relatively low surface temperatures. For the mid- and low-rise building areas, the higher the floor height is, the higher the temperature in the local climate area becomes, resulting in higher surface temperature in middle-rise climate areas than in the areas with low-rise buildings. The research shows that high-rise buildings absorb less heat due to shadow shading, while the LST in mid- and low-rise building areas has relatively little correlation with the building height, which has been proven by previous research [40].
Figure 8 shows that the distribution law of surface temperature was similar among the study areas. For example, the surface temperatures of 202 commercial service areas, 402 transportation stations, and 503 medical areas were relatively high, which may have been caused by more abundant artificial heat sources, a high solar radiation absorption rate of building materials, and less vegetation in these areas. The LSTs of 505 park and green areas, 504 sports and cultural areas, 501 administrative areas, and 502 education areas were relatively low, which may be related to the relatively open areas and high coverage of green space and water [41].

4.3. Association Rule Mining Results

The results of association rule mining were obtained by applying a support degree threshold of 0.1 and a promotion degree requirement of more than 1. The association rules were mined from two directions: UFZ to LCZ and LCZ to UFZ, and the results are shown in Table 2 and Table 3. The rules between cities are generally quite different, but there are also similarities. For example, in Beijing and Guangzhou, as two megacities in the study area, residential areas have high correlation rules with the compact middle-rise areas, which is related to the high population density of these megacities. The business service areas in the four cities have formed association rules with compact areas (LCZ1–LCZ3). The business service areas in Guangzhou, Wuhan, and Harbin have mainly formed association rules with the LCZ2 compact mid-rise zone, and the business service areas in Beijing have formed association rules with the LCZ1 compact high-rise zone. Industrial zones also have certain commonalities. The industrial zones in the four research areas mainly form association rules with the LCZ3 compact low-rise zone and the LCZ8 large low-rise zone. In the four research areas, the medical zone forms association rules with the compact middle-rise zone.
Through these results, we found that the more association rules obtained from UFZ mining towards LCZ, which also shows that we are function-oriented in urban construction to determine the shapes of building areas, and the association rules of residential areas are mainly affected by the density of the urban population. The association rules formed in cities with high population densities also mainly correspond to dense areas, while some functional areas have formed common rules among cities. For example, the medical areas in the four research areas correspond to compact mid-rise buildings; business service areas and office areas correspond to compact buildings; and the industrial areas correspond to compact low-rise buildings. These functional areas have the same association rules in different cities. This shows that people have reached a certain consensus on the regional form according to the roles of these functional areas. However, the process of mining the association rules from LCZ to UFZ has great differences among different cities, and no common rules have been found. The formed association rules are relatively few, which shows that the different functional zones in each type of LCZ are more diverse and scattered. It is difficult to screen out the association rules that meet the requirements of support and promotion.

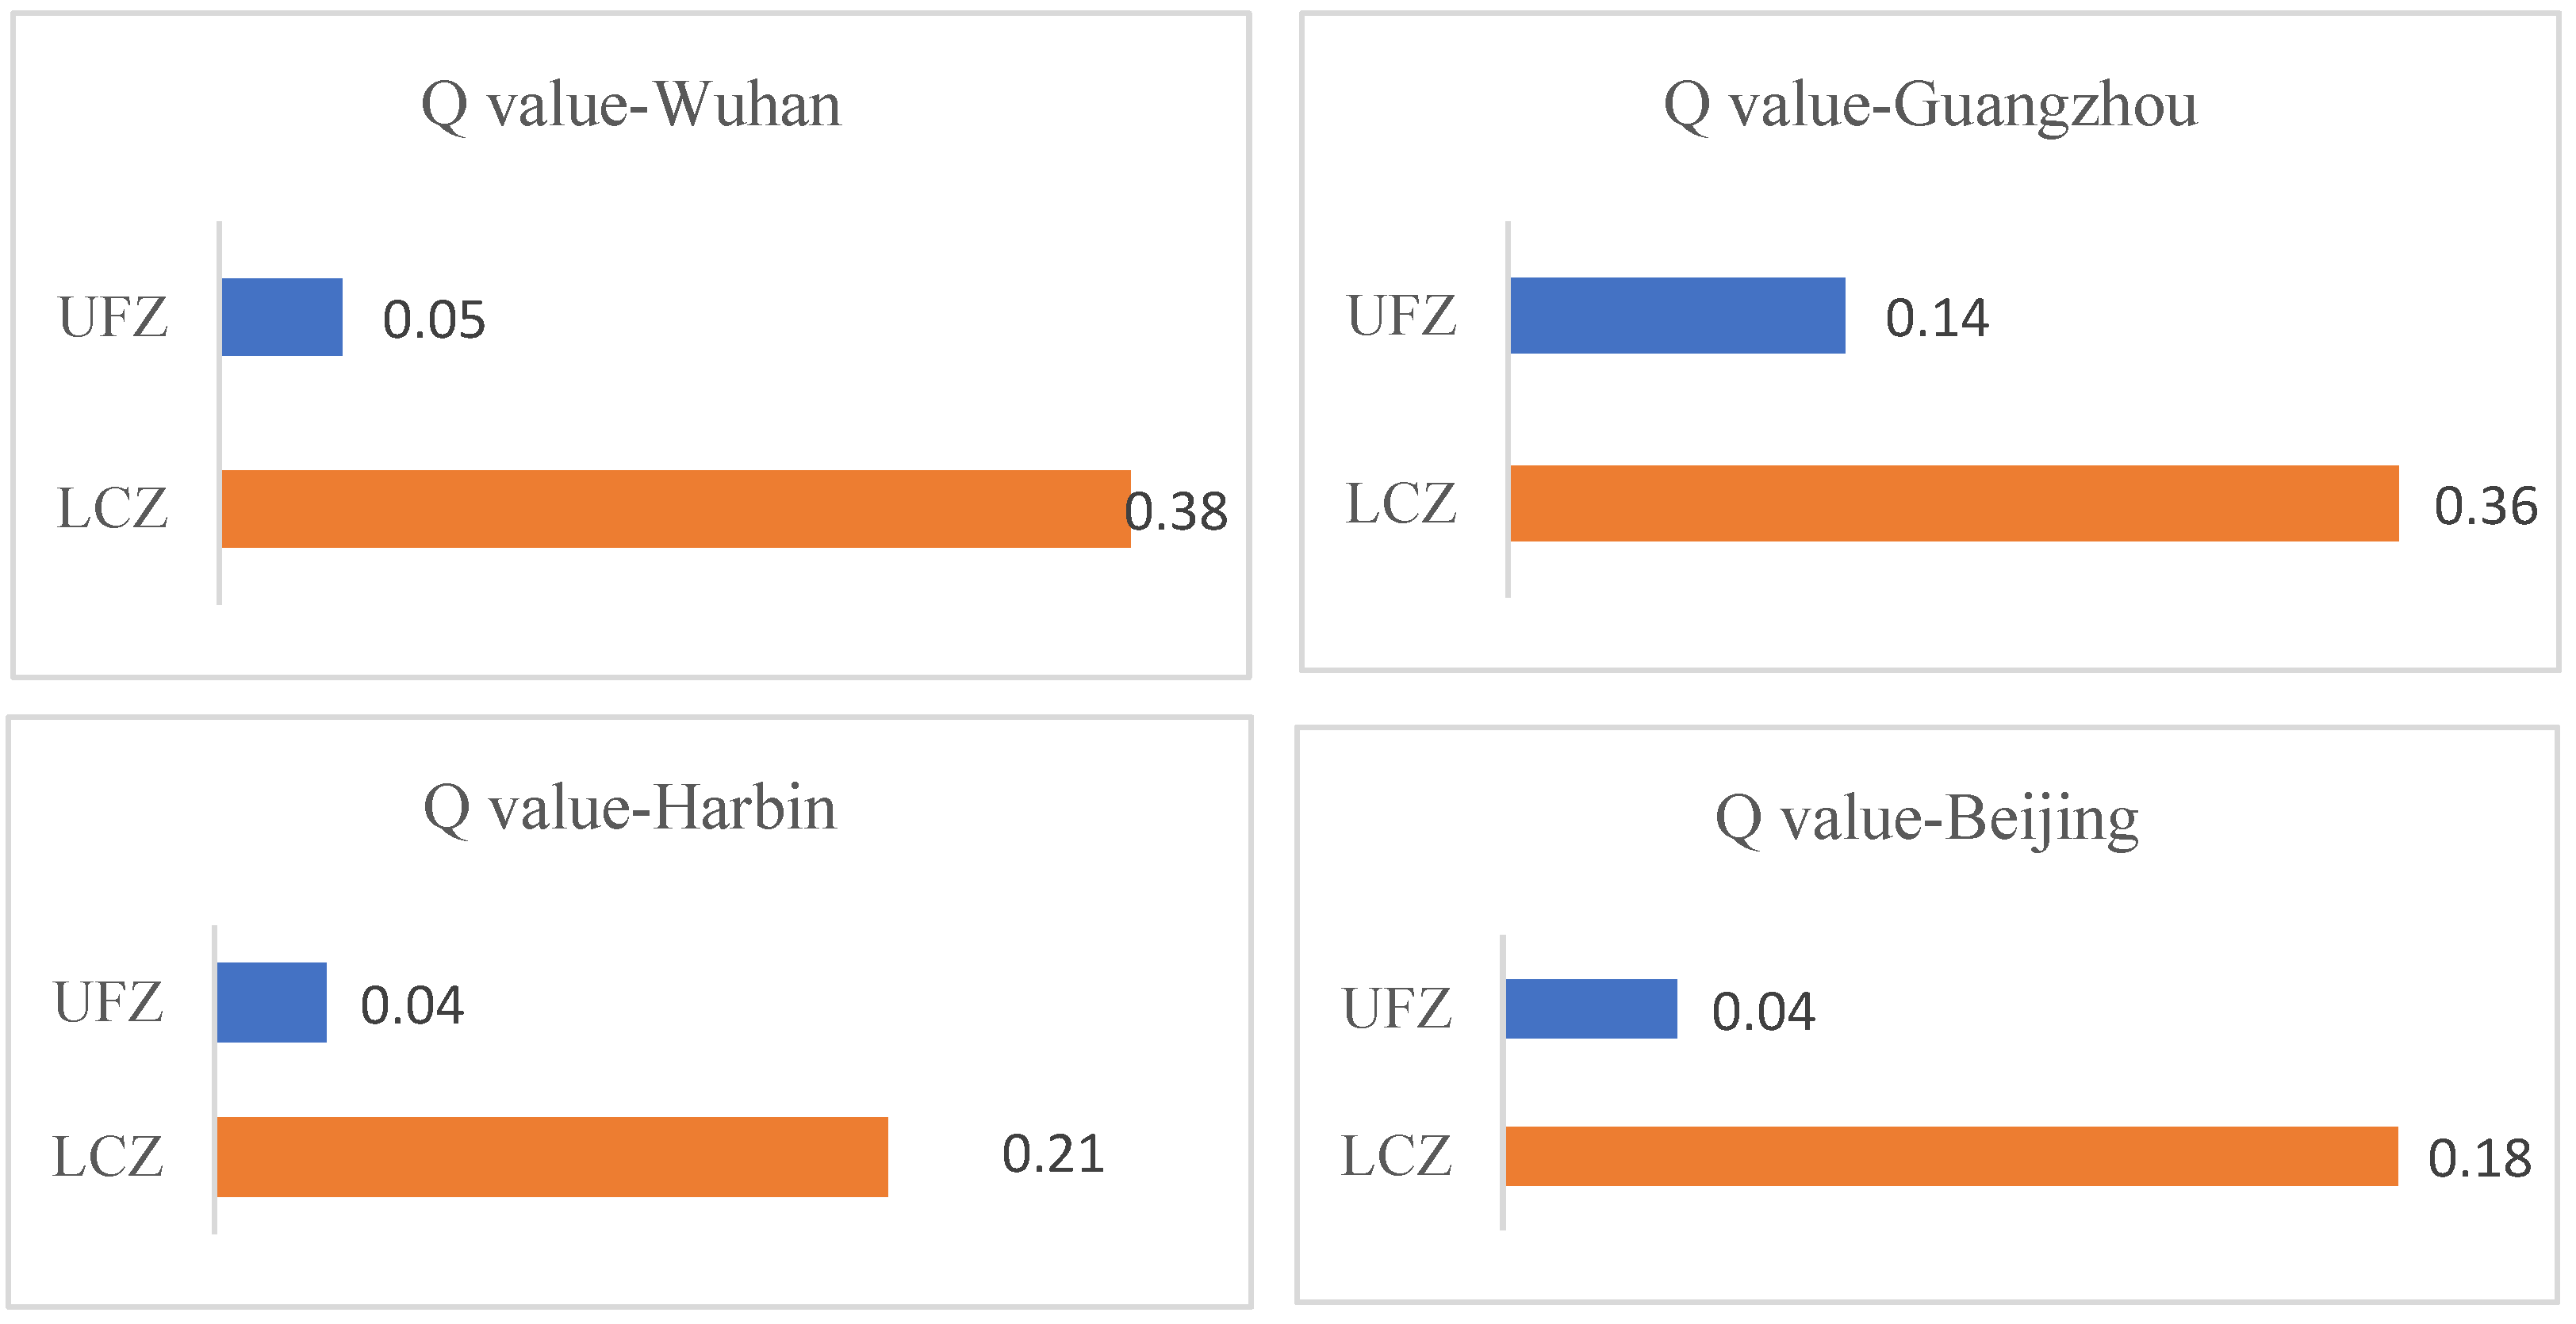
4.4. Analysis of Thermal Environment Differentiation between UFZ and LCZ

According to the factor detector, the q value of each study area was obtained (Figure 9). It can be clearly seen that LCZ had a higher degree of interpretation of thermal environment differentiation in many regions. Among them, the Wuhan Research Area had a higher q value, while the Beijing Research Area had a lower q value, which may be related to the smaller selection area of the latter. Other research areas generally had larger scopes, which may lead to more significant results in differentiation research. This indicates that the larger the research area, the better the effect on differentiation research. In each of the selected study areas, LCZ had a higher q value than UFZ, which indicates that LCZ achieved a better interpretation of the differentiation of thermal environments.

5. Conclusions

In this study, two classification systems commonly used in the study of the urban thermal environment, LCZ and UFZ, were mined for association rules, and the spatial differentiation of thermal environment was evaluated based on LCZ and UFZ. The mining of association rules for LCZ and UFZ reveals that certain cities share similar associations. For instance, medical areas tend to correspond to densely intermediate floors, while commercial service and office areas are also linked to dense structures. Similarly, industrial areas align with compact low-rise regions. Furthermore, the analysis suggests a higher degree of commonality between UFZ and LCZ compared to the direction from LCZ to UFZ. This indicates that people in different cities have agreed upon architectural preferences based on the role of UFZ. Using factor detectors from geographic detectors, a thermal environment spatial differentiation analysis on LCZ and UFZ was conducted. Through the results of the factor detector, it became evident that LCZ had a higher degree of explanation for LST differentiation in each study area. Additionally, there were more substantial differences in LST between the sub-regions of LCZ, suggesting that LCZ has a more refined differentiation of the thermal environment.
In general, our study can provide references for relevant heat island research to help urban planners formulate mitigation policies according to local conditions. Nevertheless, there are still limitations, and future works may be conducted from the following perspectives. First, the research period in this study was mainly summer, and the relevant rules of other seasons have not been studied. In a next step, relevant research can be conducted on thermal environment differentiation in other seasons to explore the unified rules of various seasons, enriching the overall and comprehensive value of this study. Second, the association rule mining method can be further studied technically. For example, considering more factors (e.g., types of cities) in a geographic detector with two classification systems may help to enable more direct application and transformation of the mined association rules.

Author Contributions

Methodology, Y.X.; validation, Y.X. and C.Z.; writing—original draft preparation, Y.X.; writing—review and editing, W.H. and C.Z.; supervision, W.H. and C.Z.; project administration, W.H. All authors have read and agreed to the published version of the manuscript.

Funding

This research received no external funding.

Data Availability Statement

The data that support the findings of this study are available upon reasonable request.

Conflicts of Interest

The authors declare no conflict of interest.

References

  1. World Meteorological Organization. State of the Global Climate 2021 (WMO-No. 1290). 2022. Available online: https://library.wmo.int/doc_num.php?explnum_id=11178 (accessed on 18 August 2023).
  2. Georgescu, M.; Moustaoui, M.; Mahalov, A.; Dudhia, J. Summer-time climate impacts of projected megapolitan expansion in Arizona. Nat. Clim. Change 2012, 3, 37–41. [Google Scholar] [CrossRef]
  3. Yang, L.; Li, X.; Shang, B. Impacts of Urban Expansion on the Urban Thermal Environment: A Case Study of Changchun, China. Chin. Geogr. Sci. 2022, 32, 79–92. [Google Scholar] [CrossRef]
  4. Guhathakurta, S.; Gober, P. The impact of the phoenix urban heat island on residential water use. J. Am. Plan. Assoc. 2007, 73, 317–329. [Google Scholar] [CrossRef]
  5. Li, J.; Song, C.; Cao, L.; Zhu, F.; Meng, X.; Wu, J. Impacts of landscape structure on surface urban heat islands: A case study of Shanghai, China. Remote Sens. Environ. 2011, 115, 3249–3263. [Google Scholar] [CrossRef]
  6. Du, H.; Zhou, F.; Li, C.; Cai, W.; Jiang, H.; Cai, Y. Analysis of the Impact of Land Use on Spatiotemporal Patterns of Surface Urban Heat Island in Rapid Urbanization, a Case Study of Shanghai, China. Sustainability 2020, 12, 1171. [Google Scholar] [CrossRef]
  7. Liu, Y.; Peng, J.; Wang, Y. Efficiency of landscape metrics characterizing urban land surface temperature. Landsc. Urban Plan. 2018, 180, 36–53. [Google Scholar] [CrossRef]
  8. Li, Y.-y.; Liu, Y.; Ranagalage, M.; Zhang, H.; Zhou, R. Examining Land Use/Land Cover Change and the Summertime Surface Urban Heat Island Effect in Fast-Growing Greater Hefei, China: Implications for Sustainable Land Development. ISPRS Int. J. Geo-Inf. 2020, 9, 568. [Google Scholar] [CrossRef]
  9. Guo, G.; Zhou, X.; Wu, Z.; Xiao, R.; Chen, Y. Characterizing the impact of urban morphology heterogeneity on land surface temperature in Guangzhou, China. Environ. Model. Softw. 2016, 84, 427–439. [Google Scholar] [CrossRef]
  10. Zhang, Q.; Wu, Z.; Singh, V.P.; Liu, C. Impacts of Spatial Configuration of Land Surface Features on Land Surface Temperature across Urban Agglomerations, China. Remote Sens. 2021, 13, 4008. [Google Scholar] [CrossRef]
  11. Wang, Y.; Zhan, Q.; Ouyang, W. How to quantify the relationship between spatial distribution of urban waterbodies and land surface temperature? Sci. Total Environ. 2019, 671, 1–9. [Google Scholar] [CrossRef]
  12. Yin, C.; Man, Y.; Lu, Y.; Huang, Y.; Liu, Y. Effects of urban form on the urban heat island effect based on spatial regression model. Sci. Total Environ. 2018, 634, 696–704. [Google Scholar] [CrossRef]
  13. Zhao, C.H.; Jensen, J.; Weng, Q.H.; Weaver, R. A Geographically Weighted Regression Analysis of the Underlying Factors Related to the Surface Urban Heat Island Phenomenon. Remote Sens. 2018, 10, 1428. [Google Scholar] [CrossRef]
  14. Hamid, T.S.; Sahar, S.; Abbas, E.Z.; Tarek, A.; Hesham, A.; Kristin, K. A Comprehensive Statistical Study on Daytime Surface Urban Heat Island during Summer in Urban Areas, Case Study: Cairo and Its New Towns. Remote Sens. 2016, 8, 643. [Google Scholar]
  15. Huang, G.; Cadenasso, M.L. People, landscape, and urban heat island: Dynamics among neighborhood social conditions, land cover and surface temperatures. Landsc. Ecol. 2016, 31, 2507–2515. [Google Scholar] [CrossRef]
  16. Li, K.; Chen, Y.; Gao, S. Comparative Analysis of Variations and Patterns between Surface Urban Heat Island Intensity and Frequency across 305 Chinese Cities. Remote Sens 2021, 13, 3505. [Google Scholar] [CrossRef]
  17. Wong, K.V.; Dai, Y.; Paul, B. Anthropogenic Heat Release into the Environment. J. Energy Resour. Technol. 2012, 134, 041602. [Google Scholar] [CrossRef]
  18. Taha, H. Urban climates and heat islands: Albedo, evapotranspiration, and anthropogenic heat. Energ Build. 1997, 25, 99–103. [Google Scholar] [CrossRef]
  19. Feng, Y.; Du, S.; Myint, S.W.; Shu, M. Do Urban Functional Zones Affect Land Surface Temperature Differently? A Case Study of Beijing, China. Remote Sens. 2019, 11, 1802. [Google Scholar] [CrossRef]
  20. Lee, S.H.; Song, C.K.; Baik, J.J.; Park, S.U. Estimation of anthropogenic heat emission in the Gyeong-In region of Korea. Theor. Appl. Climatol. 2009, 96, 291–303. [Google Scholar] [CrossRef]
  21. Stewart, I.D.; Oke, T.R. Local climate zones for urban temperature studies. Bull. Am. Meteorol. Soc. 2012, 93, 1879–1900. [Google Scholar] [CrossRef]
  22. Bechtel, B.; Alexander, P.J.; Böhner, J.; Ching, J.; Conrad, O.; Feddema, J.; Mills, G.; See, L.; Stewart, I. Mapping Local Climate Zones for a Worldwide Database of the Form and Function of Cities. ISPRS Int. J. Geo-Inf. 2015, 4, 199–219. [Google Scholar] [CrossRef]
  23. Shi, L.; Ling, F. Local Climate Zone Mapping Using Multi-Source Free Available Datasets on Google Earth Engine Platform. Land 2021, 10, 454. [Google Scholar] [CrossRef]
  24. Jiang, R.; Xie, C.; Man, Z.; Zhou, R.; Che, S. Effects of Urban Green and Blue Space on the Diffusion Range of PM2.5 and PM10 Based on LCZ. Land 2023, 12, 964. [Google Scholar] [CrossRef]
  25. Yang, J.; Ren, J.Y.; Sun, D.Q.; Xiao, X.M.; Xia, J.; Jin, C.; Li, X.M. Understanding land surface temperature impact factors based on local climate zones. Sustain. Cities Soc. 2021, 69, 102818. [Google Scholar] [CrossRef]
  26. Xu, Y.; Zhang, C.; Hou, W. Modeling of Daytime and Nighttime Surface Urban Heat Island Distribution Combined with LCZ in Beijing, China. Land 2022, 11, 2050. [Google Scholar] [CrossRef]
  27. Cai, M.; Ren, C.; Xu, Y. Investigating the relationship between Local Climate Zone and land surface temperature. In Proceedings of the 2017 Joint Urban Remote Sensing Event (JURSE), Dubai, United Arab Emirates, 6–8 March 2017; pp. 1–4. [Google Scholar]
  28. Quanz, J.A.; Ulrich, S.; Fenner, D.; Holtmann, A.; Eimermacher, J. Micro-Scale Variability of Air Temperature within a Local Climate Zone in Berlin, Germany, during Summer. Climate 2018, 6, 5. [Google Scholar] [CrossRef]
  29. Kwok, Y.T.; Schoetter, R.; Lau, K.K.L.; Hidalgo, J.; Ren, C.; Pigeon, G.; Masson, V. How well does the local climate zone scheme discern the thermal environment of Toulouse (France)? An analysis using numerical simulation data. Int. J. Climatol. 2019, 39, 5292–5315. [Google Scholar] [CrossRef]
  30. Jga, B.; Ml, C.; Ss, D.; Dm, D. Inter-/intra-zonal seasonal variability of the surface urban heat island based on local climate zones in three central European cities. Build. Environ. 2019, 156, 21–32. [Google Scholar]
  31. Gong, P.; Chen, B.; Li, X.; Liu, H.; Wang, J.; Bai, Y.; Chen, J.; Chen, X.; Fang, L.; Feng, S.; et al. Mapping essential urban land use categories in China (EULUC-China): Preliminary results for 2018—ScienceDirect. Sci. Bull. 2020, 65, 182–187. [Google Scholar] [CrossRef]
  32. Zhang, Z.; Qian, Z.; Zhong, T.; Chen, M.; Zhang, K.; Yang, Y.; Zhu, R.; Zhang, F.; Zhang, H.; Zhou, F.; et al. Vectorized rooftop area data for 90 cities in China. Sci. Data 2022, 9, 66. [Google Scholar] [CrossRef] [PubMed]
  33. Woodworth, M.D. Planning for Growth: Urban and Regional Planning in China. Int. J. Urban Reg. 2018, 42, 539–541. [Google Scholar] [CrossRef]
  34. Dissanayake, D.; Morimoto, T.; Murayama, Y.; Ranagalage, M. Impact of Landscape Structure on the Variation of Land Surface Temperature in Sub-Saharan Region: A Case Study of Addis Ababa using Landsat Data (1986–2016). Sustainability 2019, 11, 2257. [Google Scholar] [CrossRef]
  35. Papi, R.; Attarchi, S.; Darvishi Boloorani, A.; Neysani Samany, N. Knowledge discovery of Middle East dust sources using Apriori spatial data mining algorithm. Ecol. Inform. 2022, 72, 101867. [Google Scholar] [CrossRef]
  36. Gillespie, A.; Rokugawa, S.; Matsunaga, T.; Cothern, J.S.; Hook, S.; Kahle, A.B. A temperature and emissivity separation algorithm for Advanced Spaceborne Thermal Emission and Reflection Radiometer (ASTER) images. IEEE Trans. Geosci. Remote Sens. 1998, 36, 1113–1126. [Google Scholar] [CrossRef]
  37. Qin, Z.; Li, W.; Gao, M.; Zhang, H. Estimation of land surface emissivity for Landsat TM6 and its application to Lingxian Region in north China. In Proceedings of the SPIE—The International Society for Optical Engineering, Shanghai, China, 2006. [Google Scholar]
  38. Wang, J.F.; Zhang, T.L.; Fu, B.J. A measure of spatial stratified heterogeneity. Ecol. Indic. 2016, 67, 250–256. [Google Scholar] [CrossRef]
  39. Wang, J.F.; Xu, J.D. Geodetector: Principle and prospective. Acta Geogr. Sin. 2017, 72, 116–134. [Google Scholar]
  40. Xi, C.; Ren, C.; Wang, J.Q.; Feng, Z.B.; Cao, S.J. Impacts of urban-scale building height diversity on urban climates: A case study of Nanjing, China. Energy Build. 2021, 251, 111350. [Google Scholar] [CrossRef]
  41. Zhang, X.; Zhong, T.Y.; Feng, X.Z.; Wang, K. Estimation of the relationship between vegetation patches and urban land surface temperature with remote sensing. Int. J. Remote Sens. 2009, 30, 2105–2118. [Google Scholar] [CrossRef]
Figure 1. The locations of the study areas. (a) Guangzhou; (b) Wuhan; (c) Harbin; (d) Beijing.
Land 12 01701 g001aLand 12 01701 g001b
Figure 2. UFZ classes within the built-up area of the selected cities in China. (a) Guangzhou; (b) Wuhan; (c) Harbin; (d) Beijing.
Land 12 01701 g002aLand 12 01701 g002b
Figure 3. Samples of LCZ from Google Earth: (a) LCZ1: Compact high-rise; (b) LCZ2: compact mid-rise; (c) LCZ3: compact low-rise; (d) LCZ4: open high-rise; (e) LCZ5: open mid-rise; (f) LCZ6: open low-rise; (g) LCZ7: light low-rise; (h) LCZ8: large low-rise; (i) LCZ9: sparsely built; (j) LCZ10: heavy industry; (k) LCZT: vegetation; (l) LCZE: bare rock; (m) LCZF: bare soil; (n) LCZW: water.
Land 12 01701 g003
Figure 4. Schematic diagram of spatial correlation.
Land 12 01701 g004
Figure 5. Spatial distribution of LCZ in the selected cities. (a) Guangzhou; (b) Wuhan; (c) Harbin; (d) Beijing.
Land 12 01701 g005
Figure 6. Spatial distribution of LST in the selected cities. (a) Guangzhou; (b) Wuhan; (c) Harbin; (d) Beijing.
Land 12 01701 g006
Figure 7. Box-plots with LST in LCZs. (a) Guangzhou; (b) Wuhan; (c) Harbin; (d) Beijing. (The red line within the box indicates the median; the bottom of the box is the first quartile, and the top is the third quartile; the black dashed line represents the line connecting the average values).
Land 12 01701 g007
Figure 8. Box-plots with LST in UFZs. (a) Guangzhou; (b) Wuhan; (c) Harbin; (d) Beijing. (The line within the box indicates the median; the bottom of the box is the first quartile and the top is the third quartile; the black dashed line represents the line connecting the average values).
Land 12 01701 g008
Figure 9. Factor detector q value.
Land 12 01701 g009
Table 1. Data sources and descriptions.
Data TypeDetailed Information
Raster dataData nameRegionTimeRow and path number
Landsat8 image dataBeijing17 August 2019123 32
Harbin7 July 2017118 28
Wuhan23 July 2016123 39
Guangzhou20 August 2017122 44
Vector dataData nameData source
UFZ datahttp://data.starcloud.pcl.ac.cn/ (accessed on 18 August 2023, Tsinghua University Public Data Set)
Built-up area datahttp://data.starcloud.pcl.ac.cn/ (accessed on 18 August 2023)
Building base datahttp://data.tpdc.ac.cn (accessed on 18 August 2023)
Table 2. Association rules in the study areas (UFZ -> LCZ).
UFZGuangzhouWuhanHarbinBeijing
LCZ with High CorrelationSupportConfidenceLCZ with High CorrelationSupportConfidenceLCZ with High CorrelationSupportConfidenceLCZ with High CorrelationSupportConfidence
101 Residential zoneLCZ2 Compact mid-rise0.1720.220LCZ5 Open mid-rise0.2280.417 LCZ2Compact mid-rise0.1240.297
201 Commercial office zoneLCZ1 Compact high-rise0.1050.299LCZ2 Compact mid-rise0.1730.293LCZ2 Compact mid-rise0.3140.647
LCZ2 Compact mid-rise0.1730.210LCZ5 Open middle-rise0.2300.198
202 Business service zoneLCZ2 Compact mid-rise0.1740.543LCZ3Compact low-rise0.2140.225LCZ1 Compact high-rise0.1050.325LCZ1 Compact high-rise0.1440.671
LCZ8 Large low-rise0.1460.153LCZ2 Compact mid-rise0.3620.718
301 Industrial zoneLCZ8 Large low-rise0.1480.224LCZ7Lightweight low-rise0.1080.269LCZ3 Compact low-rise0.1010.256LCZ3 Compact low-rise0.1290.152
LCZ4 Open high-rise0.1510.322LCZ8 Large low-rise0.1690.333
402 Transport station LCZ8 Large low-rise0.1650.273
LCZ9 sparsely built0.1100.182
403 Airport facilities LCZ9 Sparsely built0.1320.500
501 Administrative zoneLCZ4 Open high-rise0.1200.420LCZ5 Open mid-rise0.1660.429LCZ5 Open mid-rise0.3170.750LCZ1 Compact high-rise0.4280.913
502 Education zoneLCZ4 Open high-rise0.1540.576LCZ2 Compact mid-rise0.1010.186LCZ2 Compact mid-rise0.1060.462LCZ1 Compact high-rise0.3450.724
LCZ5 Open middle-rise0.2530.464LCZ9 Sparsely built0.1320.429LCZ4 Open high-rise0.1270.157
503 Medical zoneLCZ2 Compact middle-rise0.1000.340LCZ2 Compact mid-rise0.1150.308LCZ2 Compact mid-rise0.4890.838LCZ1 Compact high-rise0.4620.920
LCZ2 Compact mid-rise0.1400.163
504 Sports and culturalLCZ6 Open low-rise0.2550.163 LCZ9 Sparsely built0.1110.364
505 Parks and greenLCZT Trees and plants0.3640.509LCZT Trees and plants0.1510.329LCZ6 Open low-rise0.1500.491LCZW Water0.2410.354
LCZT Trees and plants0.4450.650
LCZW Water0.3520.455
Table 3. Association rules in the study areas (LCZ -> UFZ).
LCZGuangzhouWuhanHarbinBeijing
UFZ with High CorrelationSupportConfidenceUFZ with High CorrelationSupportConfidenceUFZ with High CorrelationSupportConfidenceUFZ with High CorrelationSupportConfidence
LCZ1 Compact high-rise502 Education zones0.2060.395 101 Residential zones0.1050.519
LCZ2 Compact mid-rise503 Medical zones0.1020.475101 Residential zones0.1510.557502 Education zones0.2120.356101 Residential zones0.1260.696
LCZ3 Compact low-rise 301 Industrial zones0.1780.402 202 Business service zones0.2370.587
LCZ4 Open high-rise 201 Commercial office zones0.1890.320
LCZ5 Open mid-rise101 Residential zones0.1080.281504 Sports and cultural0.1100.433101 Residential zones0.1870.415502 Education zones0.2290.368
LCZ6 Open low-rise301 Industrial zones0.2700.466101 Residential zones0.2410.530101 Residential zones0.1270.274403 Airport facilities0.2570.643
403 Airport facilities0.1350.233 504 Sports and cultural areas0.1200.553
LCZ7 Lightweight low-rise 301 Industrial zones0.2370.489
LCZ8 Large low-rise504 Sports and cultural0.3490.596403 Airport facilities0.1440.780
LCZ9 Sparsely built403 Airport facilities0.1760.651 403 Airport facilities0.6210.840
LCZ10 Heavy industry301 Industrial zones0.4030.760 301 Industrial zones0.2080.632
LCZT Trees and plants 505 Parks and green areas0.1050.193101 Residential zones0.1160.277101 Residential zones0.1110.333
505 Parks and green areas0.4550.520505 Parks and green areas0.3060.211
LCZW Water 504 Sports and cultural areas0.1270.200
Disclaimer/Publisher’s Note: The statements, opinions and data contained in all publications are solely those of the individual author(s) and contributor(s) and not of MDPI and/or the editor(s). MDPI and/or the editor(s) disclaim responsibility for any injury to people or property resulting from any ideas, methods, instructions or products referred to in the content.

