Article

Comparison of Sampling and Grid Methods for Regional Soil Erosion Assessment

1
School of Geographical Sciences, Xinyang Normal University, Xinyang 464000, China
2
Henan Key Laboratory for Synergistic Prevention of Water and Soil Environmental Pollution, Xinyang Normal University, Xinyang 464000, China
3
Faculty of Geographical Science, Beijing Normal University, Beijing 100875, China
4
Soil and Water Conservation Monitoring Station of Henan Province, Zhengzhou 450008, China
*
Author to whom correspondence should be addressed.
Land 2023, 12(9), 1703; https://doi.org/10.3390/land12091703
Submission received: 1 July 2023 / Revised: 13 August 2023 / Accepted: 19 August 2023 / Published: 31 August 2023
(This article belongs to the Topic Slope Erosion Monitoring and Anti-erosion)

Abstract

:
To control soil erosion, the intensity, area, and distribution of regional soil erosion must be determined to accurately plan and implement corresponding soil conservation measures. Therefore, regional soil erosion assessment has received extensive attention worldwide. At present, a sampling survey approach and full-coverage grid-based calculation are mainly applied in regional soil erosion assessment. The quantitative evaluation of the entire region depends on the quality of the data source. Furthermore, owing to the greatness of the evaluation object, the difficulty of data acquisition, the high cost, and poor usability, the present approach is bound to be at the expense of data accuracy, spatial resolution, time resolution, etc. The sampling survey approach can obtain high-precision data of soil erosion factors. Therefore, it can accurately quantify soil erosion in a field investigation unit. However, the sampling method, sampling density, and extrapolation methods have a significant impact on regional soil erosion assessments. This study considers the case of Baiquan County in the rolling hills of Northeast China as an example. Regional soil erosion evaluation using sampling survey and grid computing were compared. The impact of the data source accuracy on the soil erosion assessment was also quantitatively evaluated. The results of grid method showed a phenomenon of large rates of soil erosion and the ratio of the soil erosion area (the share of areas above the mild level), which were overestimated by 20% and 6%, respectively. A digital elevation model (DEM) with a resolution of 30 m can be used for soil erosion evaluation in plain areas, but that with the same resolution in hilly areas has insufficient calculation accuracy and provides large errors. The grid method can be adopted when land use and soil conservation measures are accurate. Otherwise, the sampling method is recommended. Interpolation of the ratio of the soil erosion area in the survey unit based on land use can better evaluate regional soil erosion.

1. Introduction

The process of soil erosion is caused by external forces, such as hydraulic and wind forces. This directly leads to a series of environmental and ecological problems, including land degradation; siltation of rivers, reservoirs, and ponds; and eutrophication of water bodies. This has become a global environmental concern [1,2,3,4]. To prevent and control soil erosion of a region, the intensity, area, and distribution of soil erosion in the region should first be clearly detected, and the corresponding soil and water conservation measures can then be set up in a targeted manner. Therefore, regional soil erosion assessments are of great concern to many countries and regions around the world [5,6]. At present, there are many methods for regional soil erosion assessments, such as “full coverage grid computing”, used by Australia and Europe, and “sampling surveys”, which are widely used in the United States and China. Australia established the water and soil conservation bureaus in 1936 and conducted a regional soil erosion survey in 1949. Since then, many soil erosion evaluations have been conducted on the Australian mainland using the soil erosion model [7,8]. From the 1990s to the beginning of the 21st century, to quantitatively evaluate the soil erosion situation in Europe by applying modern digital calculations, the European Soil Data Centre, Joint Research Centre of the European Commission, implemented a soil erosion risk assessment project. It aimed to identify areas prone to soil erosion and provide information for countries in the European Union (EU) to formulate soil protection and degradation prevention policies. Erosion risk assessments have been successively conducted throughout Europe and different regions or countries in Europe using different methods [9,10]. In 1934, the United States organized 115 soil erosion experts to conduct a two-month-long field survey called the National Erosion Reconnaissance Survey [11,12]. This investigation preliminarily determined the graded area of rates of soil erosion occurring on agricultural land [13]. Subsequently, a method for the dynamic monitoring and evaluation of soil erosion based on “sampling surveys” was established. Regional soil erosion evaluations in China can be traced back to the 1940s, and four large-scale “national soil erosion surveys” have been conducted successively. In particular, the sampling survey of the “First National Water Conservancy Census” from 2010 to 2012 was used for the first time to evaluate national soil erosion using the CSLE model. This laid a solid foundation for the future dynamic monitoring and evaluation of regional soil erosion [14,15]. To detect soil erosion in China in a timely manner, the Ministry of Water Resources has organized the nationwide annual dynamic monitoring of soil erosion since 2018, which has evaluated soil erosion occurring in all land areas for the first time.
The grid method is affected by the quality of the data source, such as its accuracy and spatial and temporal resolutions. The evaluation results of this method have great uncertainties. Therefore, the results from this type of full-coverage estimation have often been criticized [16]. Topography, vegetation coverage, the coverage of understory vegetation in arbor forests, and soil and water conservation measures affect the accuracy of the results. If the accuracy of the data source can be effectively improved, future regional soil erosion evaluations can be developed with full-coverage grid computing. Although researchers have been trying to obtain data sources with high precision and a high spatiotemporal resolution [17,18], the problem of evaluating soil erosion at the regional scale has not been resolved well [19]. A sampling survey can obtain high-precision soil erosion factor data in a survey unit, and thus, can accurately and quantitatively evaluate the soil erosion status in the unit. However, the sampling methods, sampling density, and result extrapolation methods have a significant impact on the regional soil erosion evaluation [20,21]. The accuracy of soil erosion evaluation results based on coarse resolution requires quantitative evaluation to explore whether they can provide decision-makers with good soil and water conservation planning services [22]. Further research needs to be conducted to evaluate whether the spatial distribution characteristics of the regional soil erosion assessment results are consistent between the grid method and sampling survey, and which of those results are more feasible.
The black soil region of Northeast China, one of the three typical black soil regions in the world, performs important roles in crop production and food security [23]. The black soil in northeastern China has experienced severe soil erosion, and the soil depth has reduced from 60 to 70 cm in the 1950s to 20 to 30 cm presently [24]. Soil erosion assessment at multiple spatial scales, the effectiveness assessment of soil conservation measures, and land cover changes have been studied by many researchers [25,26,27,28]. Baiquan County in the rolling hilly region of Northeast China, which is more severely eroded and is a typical region for the evaluation of soil erosion, was selected as the study area [29]. The purposes of this study were to (1) compare the rationality of the two evaluation results of regional soil erosion by using the full coverage grid method and a sampling survey, respectively; and (2) quantitatively evaluate the difference between the two methods of soil erosion evaluation, determine the source of errors, and provide reasonable suggestions for improving the regional soil erosion evaluation methods.

2. Material and Methods

2.1. Study Region

Baiquan County is in the middle–western part of Heilongjiang province and the northeast of the city of Qiqihar. It is located in the transition zone from the small Xing’an Mountains to the Songnen Plain and belongs to rolling hilly region of Northeast China. Located in the middle and high latitudes, Baiquan County belongs to the typical mid-temperate continental monsoon climate, with an average temperature of 1.2 °C and annual precipitation of 490.1 mm. In contrast to the abundant water along the course of the river, the surface water resources in the eastern, central and southwestern areas of the county are very scarce, and the underground water is deeply buried. The soil types mainly include phaeozems, chernozems, meadow soil, swamp soil, and saline soil. The original vegetation in Baiquan County has long been destroyed, and as a whole, it has the characteristics of interlaced distribution from forests and meadow grasslands or steppe meadows. Baiquan County has been one of the counties in Heilongjiang Province most seriously affected by soil erosion. Water erosion is the main soil erosion, followed by wind erosion. As early as the 1980s, Baiquan County was listed as a key county for water and soil conservation in the province. In the practice of water and soil conservation for more than 30 years, the “Tongshuang small watershed management model” and the “small watershed economic zone construction model” have been summarized. The “Contracting waste ditch and waste slope management model” has made outstanding contributions to the water and soil conservation work in Baiquan County.

2.2. Grid Method

The Chinese soil loss equation (CSLE), derived from universal soil loss equation (USLE), was used to assess the full-coverage region of Baiquan County. The equation for the CSLE is as follows (Liu et al., 2002):
A = R × K × L × S × B × E × T
where A is rate of soil erosion in t·ha−1·a−1. R is rainfall erosivity in MJ·mm·ha−1·h−1·a−1. K is soil erodibility in t·ha·h·ha−1·MJ−1·mm−1. L and S are dimensionless topographic factors of the slope length and the slope steepness. B is the dimensionless vegetation cover factor of biological practices for trees, shrubs, and grasslands. E is the dimensionless factor of engineering practices, such as terraces. T is the dimensionless factor of tillage practices, such as crop rotation, contour tillage, residue cover, and inter-cropping strips. Each of these factors are discussed individually below.

2.2.1. Rainfall Erosivity Factor, R

The daily rainfall estimation model was applied to calculate R. The daily rainfall data from 1986 to 2015 of 46 meteorological stations in Heilongjiang Province and its surrounding areas were collected. Through geostatistical interpolation, the raster layer of 24 half months of rainfall erosivity and annual rainfall erosivity were obtained with a spatial resolution of 30 m. On this basis, the annual rainfall erosivity raster layer and 24 ratios of half month rainfall erosivity were obtained by using the vector layer of Baiquan County.

2.2.2. Soil Erodibility Factor, K

The K value estimation formula proposed by Wischmeier [30] and Williams [31] was used to calculate the soil erodibility factor. The soil erodibility factor was from the results of the soil erodibility factor in the First National Water Conservancy Census [15].

2.2.3. Slope Length and Steepness Factor, LS

The slope length factor was calculated by using a slope segment length equation [32]. Equations (2) and (3) of McCool et al. [33] were used for the slope factor S of areas below 10°. Equation (4) of Liu et al. [34] was used for slope areas above 10°.
S = 10.8 sin θ + 0.03                                         θ < 5 °
S = 16.8 sin θ 0.5                                         5 ° θ < 10 °
S = 21.91 sin θ 0.96                                         θ 10 °
The DEM data covering Baiquan County were converted from a 1:50,000 digital contour map and generated a raster layer with a spatial resolution of 30 m.

2.2.4. Vegetation and Biological Practice Factor, B

The assignment and calculation of the B value needed to be calculated according to different land uses. The formula for calculating the B value of forest land and grassland is as follows:
B = i = 1 24 S L R i W R i
S L R i = 0.44468 × e ( 3.20096 × G D ) 0.04099 × e ( F V C F V C × G D ) + 0.025
S L R i = 1 1.17647 + 0.86242 × 1.05905 100 × F V C
S L R i = 1 1.25 + 0.78845 × 1.05968 100 × F V C
where FVC refers to the fractional vegetation coverage, calculated using NDVI based on remote-sensing images, and its value ranged from 0 to 1. GD is the understory cover of arbor forests; its value ranged from 0 to 1, including the understory cover composed entirely of vegetation (shrubs, herbs, and litter), except for the tree canopy. The value was obtained as follows, based on field investigations or experience.
The FVC was obtained by fusing 250 m resolution MODIS NDVI and the vegetation coverage calculated based on a 30 m resolution Landsat-8 OLI image. Both the MODIS NDVI and Landsat-8 OLI images were from 2015 to 2017.
V H ( t i ) = V M ( t i ) + j = 1 n [ ω ( t i ,   t j )     ( V T ( t j ) V M ( t j ) ) ] j = 1 n ω ( t i ,   t j )
where  V H ( t i )  is the NDVI fusion value for a high-resolution pixel.  V M ( t i )  is the sequence of MODIS annual mean value corresponding to a high-resolution pixel.  V T ( t j )  is the high-resolution NDVI data of the Landsat-8 OLI image corresponding to this pixel in a certain period.  t i  is the Julian date of the MODIS-NDVI data acquisition (DOY = 16 × time phase − 7).  t j  is the Julian day corresponding to the acquisition of the high-resolution NDVI data.  ω ( t i ,   t j )  is the weight of the high-resolution NDVI of  t j , expressed as  ω ( t i ,   t j ) = 1 | t i t j | .
The NDVI of 24 half months was obtained with a spatial resolution of 30 m and fused into the above formula to obtain the corresponding FVC:
F V C = ( N D V I N D V I min N D V I max N D V I min ) k
where FVC is the fractional vegetation coverage. NDVI is the NDVI value of the pixel. NDVImax and NDVImin are the conversion coefficients of the pixel for certain land-use types. K is the nonlinear coefficient. In the same climate type, the pixel where the maximum NDVI of different vegetation and minimum value of bare soil NDVI in MODIS images were determined, and the average value of Landsat-8 OLI NDVI in this pixel was taken as the conversion coefficient.
Finally, the 3-year average of 24 months of vegetation coverage was calculated. The B value was calculated by considering the average value of the vegetation coverage of the 24 months corresponding to the specified three years, which is the FVC in Equation (10).
The B values of non-forest land and grassland were directly assigned according to the following table (Table 1).

2.2.5. Engineering Practice Factor (E) and Tillage Practice Factor (T)

Field investigations in the study area showed that engineering measures mainly included terraces, ridges, and a few level steps. The assignment of the engineering measure factor was based on the assignment table of factors of engineering measures for soil and water conservation in the First National Water Conservancy Census (Table 2). The E value was resampled to generate a grid with a spatial resolution of 30 m, corresponding to a 1:50,000 DEM.
The tillage measure factor reflects two effects: the crop coverage effect formed by the crop rotation system, and the soil and water conservation tillage measures. According to national crop rotation regionalization, the study area belongs to the first ripe region of semi-humid warmth-loving crops in the hilly region of the Northeast Plain, as well as the first ripe region of warm–cool crops in the mountainous region of Changbai in the Sanjiang Plain. The T factor of the crop rotation measure, which reflects the impact of crop cover, was 0.331. The tillage measures for soil and water conservation in the study area were mainly contour ridges and furrow planting, and the corresponding T value was 0.251.

2.3. Sampling Method

2.3.1. Design of Sampling Units

A multi-stage, unequal probability, systematic area sampling method was employed for the selection of the sampling units [15]. The method was employed for the national soil erosion survey of 2011 in China. First, each sheet of the 1:10,000 topographic map was used as the control area, which was 5 by 5 km2 with a 1 by 1 km2 grid embedded in it, and one sampling unit was selected at the center of the grid from each control area. The sampling unit could be either a catchment (0.2–3 km2) or a square (1 by 1 km2). In most hilly and mountainous areas, the sampling unit was a catchment. In flat areas, where it would be a great challenge to locate a small catchment, the center 1 by 1 km2 square was selected as the sampling unit instead. When a small catchment was used, it was selected to intersect with the center grid. In this case, the sampling density was 1/25, i.e., 4%. A sampling density of 1% means one sampling unit within each square of 100 km2. Based on this method, Baiquan County had a total of 216 survey units with a sampling density of 4%, including 36 survey units with a sampling density of 1% (Figure 1).

2.3.2. Field Survey

The land-use types, soil and water conservation measures, vegetation coverage, canopy density, and understory coverage of tree forests were investigated in 216 sampling units. The methods of investigation were based on the First National Water Conservancy Census of China in 2011 [15]. Additionally, we recorded the DEM generated by 1:10,000 digital contour maps of 1% density survey units (36 units) in the study area with a spatial resolution of 10 m.

2.3.3. Soil Erosion Rate of Sampling Units

The soil erosion rate of each sampling unit was calculated using CSLE, which was used in the grid method. The rainfall erosivity factor and soil erodibility factor were the same as those applied in the grid method. The L and S factor of the 1% density survey units were calculated using 1:10,000 digital contour maps. The rest of the units were calculated using 1:50,000 digital contour maps. The vegetation and biological practice factor, engineering practice factor, and tillage practice factor were based on the field survey.

2.4. Other Data Collection

2.4.1. Land-Use Data

The land-use types of Baiquan, applied in the grid method, were obtained by manual visual interpretation based on ZY-3 satellite imagery. This was acquired on 19 September 2016 and 30 September 2016, with a WGS84 geocentric coordinate system and 1% cloud cover. A panchromatic band of 2.1 m can guarantee the accuracy of interpretation. The results were modified and verified through field investigation.

2.4.2. Remote-Sensing Image Products

MOD13Q1 NDVI image products synthesized over 16 days from 2015 to 2017, with a spatial resolution of 250 m and row number h26V04, were used to retrieve the vegetation coverage. The download address is http://glovis.usgs.gov/ (accessed on 15 September 2018). The available image period of the Landsat-8 OLI was from April 2016 to October 2017, with a total of eight images (path = 119, row = 26 and 27, lower than 10% cloud cover). Through the fusion calculation method (shown in Section 2.2.4), NDVI products were obtained with a spatial resolution of 250 m for 24 months for three years from 2015 to 2017.
The rates of soil erosion were evaluated according to the soil erosion model calculated using the CSLE model, and the criterion for judgment was the classification standard in the Technical Standard for Comprehensive Prevention and Control of Soil Erosion in Black Soil Areas (SL446-2009) [35].
The tolerance of soil loss in the black soil region of Northeast China is 2 t·ha−1·a−1, and the corresponding soil erosion classification standards are presented in Table 3.
The same data required by the grid method and sampling unit calculation of the classification standard for the rates of soil erosion include the daily rainfall data used to calculate the rainfall erosivity and soil erodibility data. The different data used in the calculation included land-use, DEM, and soil and water conservation data. The land-use data applied in the grid method were sourced from high-resolution image interpretation, and the sampling unit was obtained from field surveys. The grid method uses a 1:50,000 scale to generate a DEM with a resolution of 30 m, whereas the survey unit (36) uses a 1:10,000 scale to generate a 10 m resolution DEM. For soil and water conservation measures, it is difficult to interpret the precise type and scope of soil and water conservation measures based on remote-sensing images. Therefore, engineering measures were not considered in the grid method, and only crop rotation was considered for tillage measures. Moreover, soil and water conservation measures were obtained through field investigation in the sampling units.

3. Results

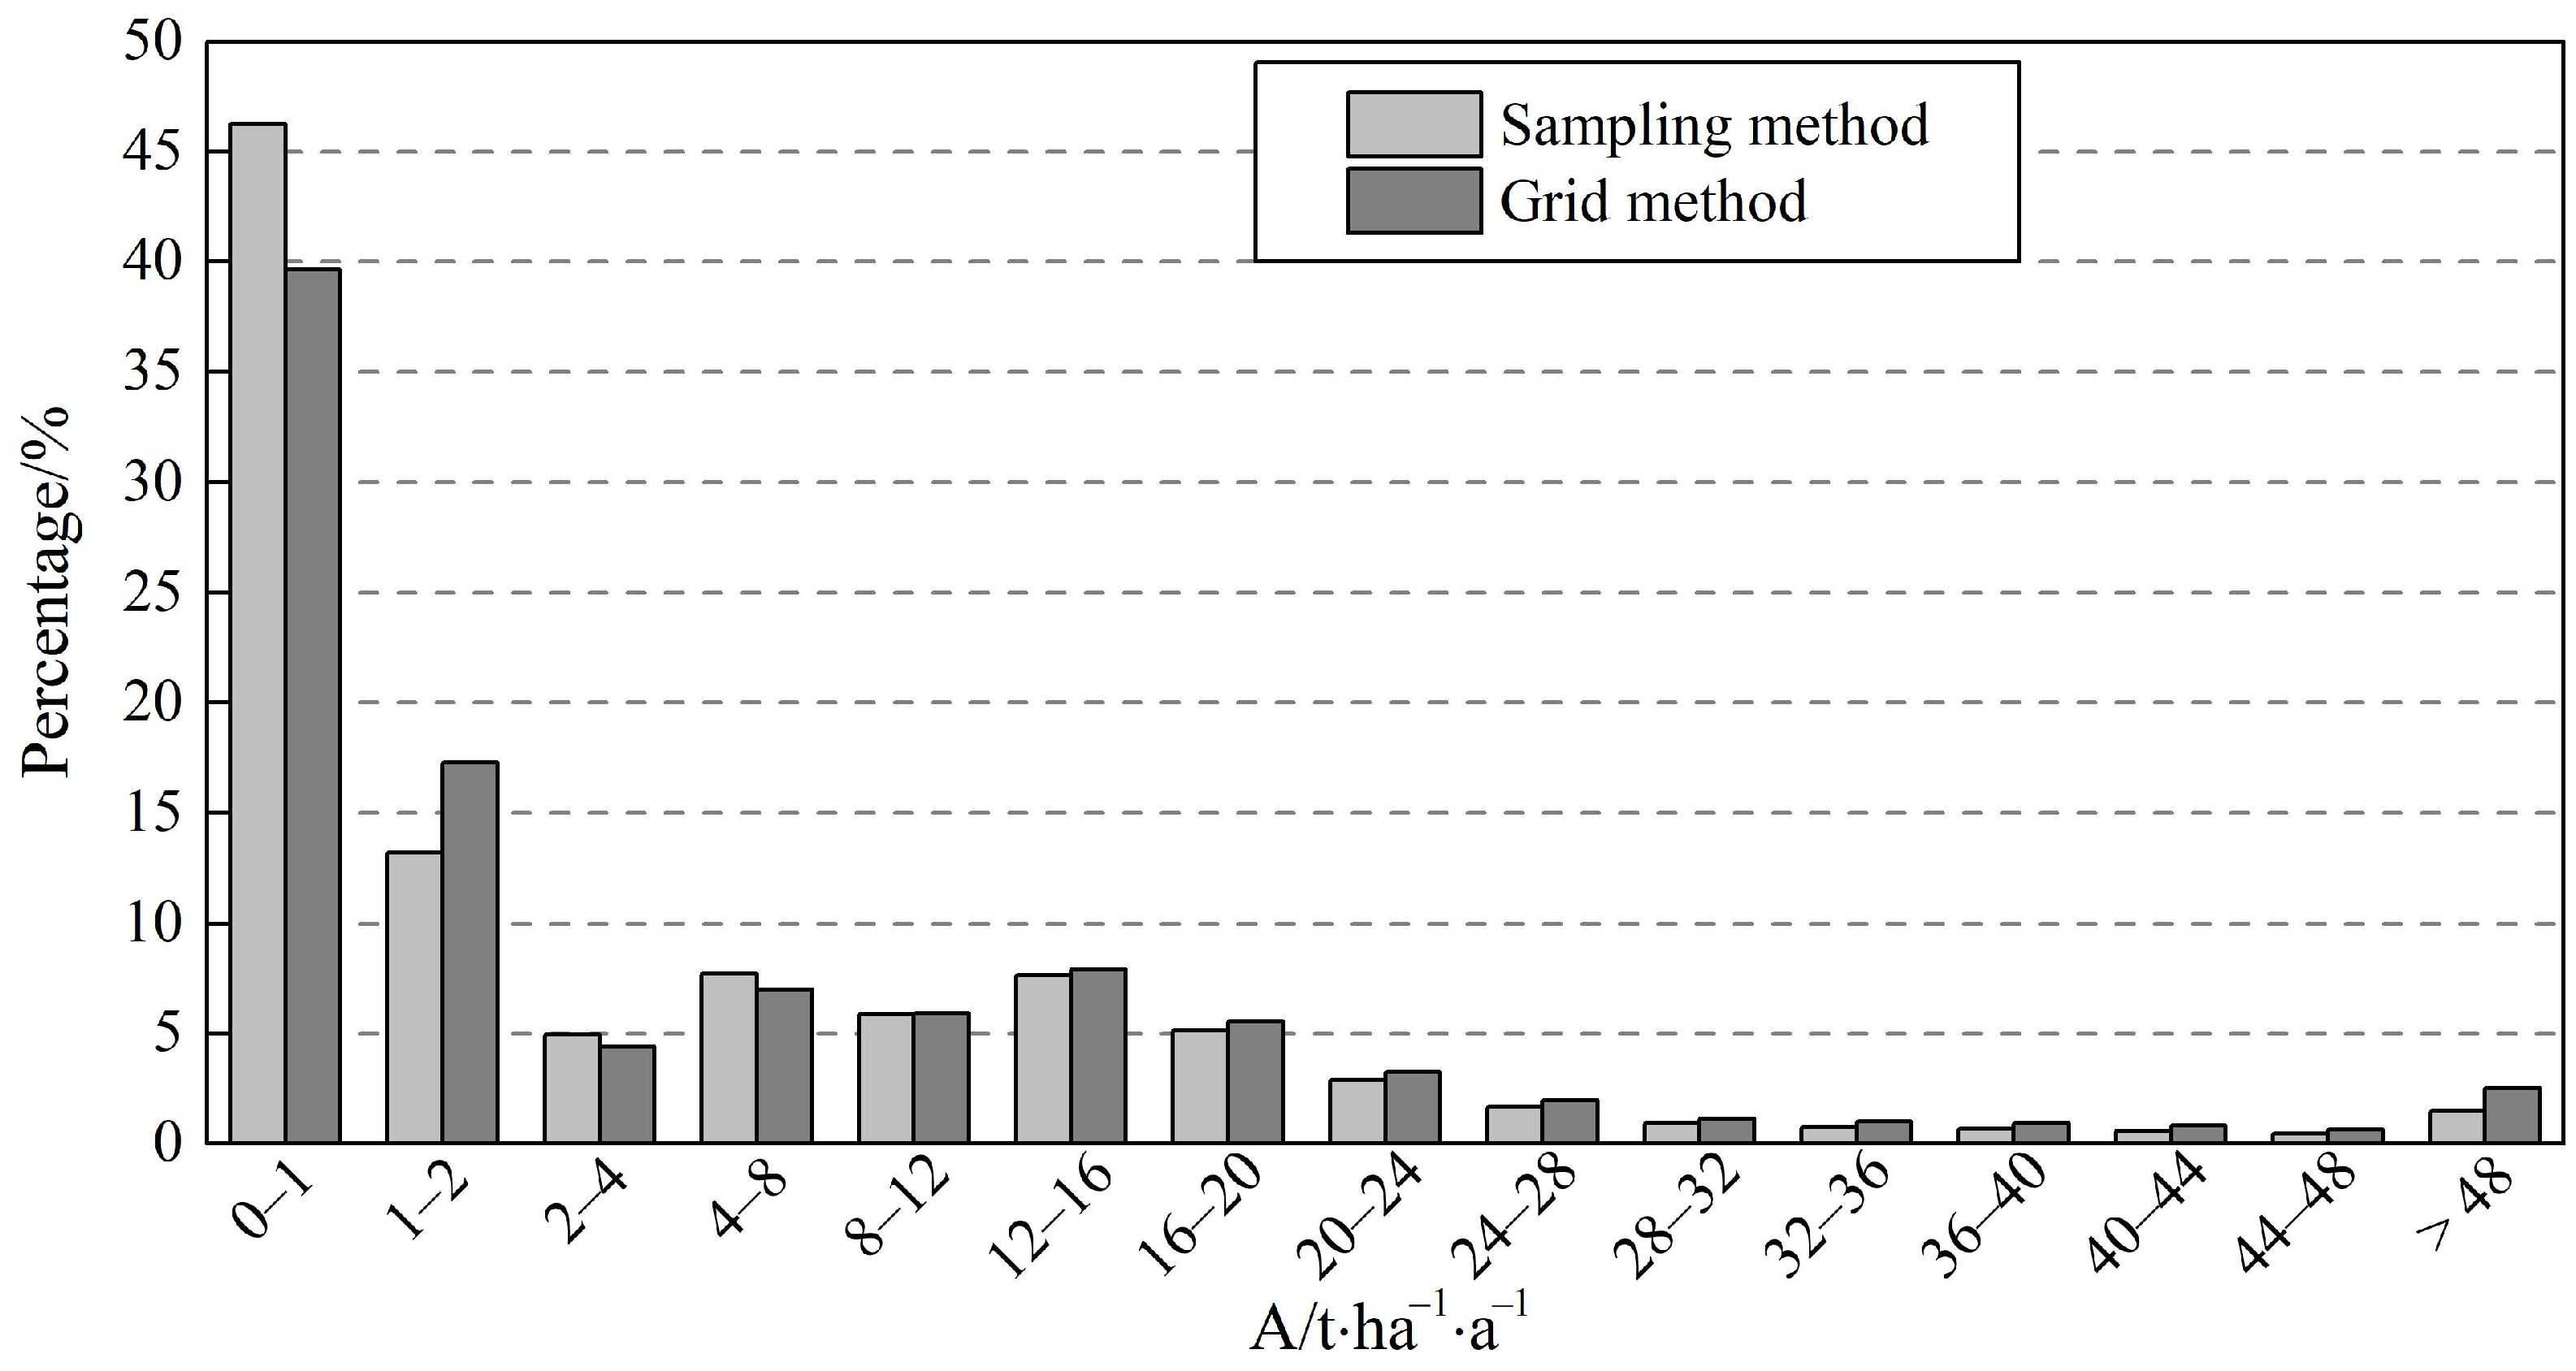
3.1. Comparison of the Rates of Soil Erosion

The statistical analysis of the rates of soil erosion of all sampling units in Baiquan County based on the sampling survey showed that the rates of soil erosion varied from 0 to 369 t·ha−1·a−1, and the average rate of soil erosion was 7.32 t·ha−1·a−1. The proportion of the soil erosion area in the survey unit was 40.6%, of which the proportions showing mild and moderate erosion were 18.5 and 15.6%, respectively. The proportion of areas showing strong erosion and above was 6.5%, of which the proportions of very strong and severe erosion were 1.7 and 1.5%, respectively. From the frequency distribution diagram of rates of soil erosion (Figure 2), the proportion of the area with a rate of soil erosion value less than 1 was the largest, at approximately 46.2%, followed by those at 1–2 and 4–8 t·ha−1·a−1, accounting for 13.2 and 7.7%, respectively. When the rates of soil erosion were greater than 12 t·ha−1·a−1, the grades of each rate of soil erosion showed a decreasing trend. Rates of soil erosion greater than 48 t·ha−1·a−1 also accounted for a considerable proportion of 1.5%. Statistical analysis of the rates of soil erosion in the survey unit of the grid method showed that the rates of soil erosion varied from 0 to 369 t·ha−1·a−1, and the average was 8.80 t·ha−1·a−1. From the frequency distribution diagram of the rates of soil erosion (Figure 2), the proportion of the area with rates of soil erosion less than 1 is the largest, approximately 39.6%, followed by those at 1–2 and 12–16 t·ha−1·a−1, accounting for 17.3 and 7.9%, respectively. When the rates of soil erosion were greater than 12 t·ha−1·a−1, the grades of each rate of soil erosion showed a decreasing trend. The rates of soil erosion greater than 48 t·ha−1·a−1 also occupied a considerable proportion, about 2.5%. In general, the results based on the grid method showed a higher rate of soil erosion and a larger proportion of the soil erosion area.
We counted and compared the average rates of soil erosion and ratio of soil erosion area within the survey units between the grid method and sampling survey. In particular, the assessment of soil erosion in the 1% sampling units is more reliable due to the precise data sources and field investigation (terrain, vegetation, and soil and water conservation measures). The results showed that the grid method overestimated the results, regardless of whether it measured the rates of soil erosion or ratio of the soil erosion area. However, the proportions of the soil erosion area from the two results were similar (Figure 3).

3.2. Comparison of the Rates of Soil Erosion of Different Land-Use Types

The soil erosion moduli of each land-use type in the survey unit calculated by the sampling survey were compared and analyzed (Figure 4a). The range of the rates of soil erosion of dry land was very large; the minimum was 0 and the maximum could reach 369 t·ha−1·a−1. The results of the average rates of soil erosion showed that dry land experienced moderate erosion. Notably, dry land is the main source of soil erosion in the study area. The average soil erosion moduli of grassland and other woodland were 6.24 and 5.94 t·ha−1·a−1, respectively, and these values were the second highest in arid land. The rates of soil erosion of other woodlands had a smaller variation range, ranging from 2 to 13 t·ha−1·a−1, and the rates of soil erosion of other woodlands were closely related to the smaller vegetation coverage. However, the rates of soil erosion of grassland varied greatly, with minimum and maximum values of 2 and 145 t·ha−1·a−1, respectively. The average rates of soil erosion were the smallest in woodland, at 3.79 t·ha−1·a−1, and varied from 2 to 9 t·ha−1·a−1. The average rates of soil erosion of shrubland were only 4.27 t·ha−1·a−1, higher than that of forest land, and the maximum rate of soil erosion was 22 t·ha−1·a−1.
The soil erosion moduli of each land-use type in the grid method survey unit were compared and analyzed (Figure 4b). The average rates of soil erosion of dry land were the largest, at 15.84 t·ha−1·a−1, which was higher than that calculated by the sampling survey. The rates of soil erosion of dry land varied from 0 to 369 t·ha−1·a−1. From the average rates of soil erosion, the erosion on arid land was still moderate, and arid land was the key area for soil erosion control. Grassland and shrubland were second only to arid land in terms of the average rates of soil erosion, whose values were 6.44 and 4.68 t·ha−1·a−1, respectively; their variations ranged from 0 to 106 and 0 to 47 t·ha−1·a−1, respectively. The soil erosion of other woodland was severely underestimated and the average rates of soil erosion were the smallest, at only 0.38 t·ha−1·a−1, which varied from 0.15 to 2 t·ha−1·a−1. The rates of soil erosion of forested land were still small; the average rates of soil erosion were 3.97 t·ha−1·a−1, and the minimum and maximum values were 0.3 and 152 t·ha−1·a−1; the maximum rate of soil erosion was much larger than that of the sampling survey.

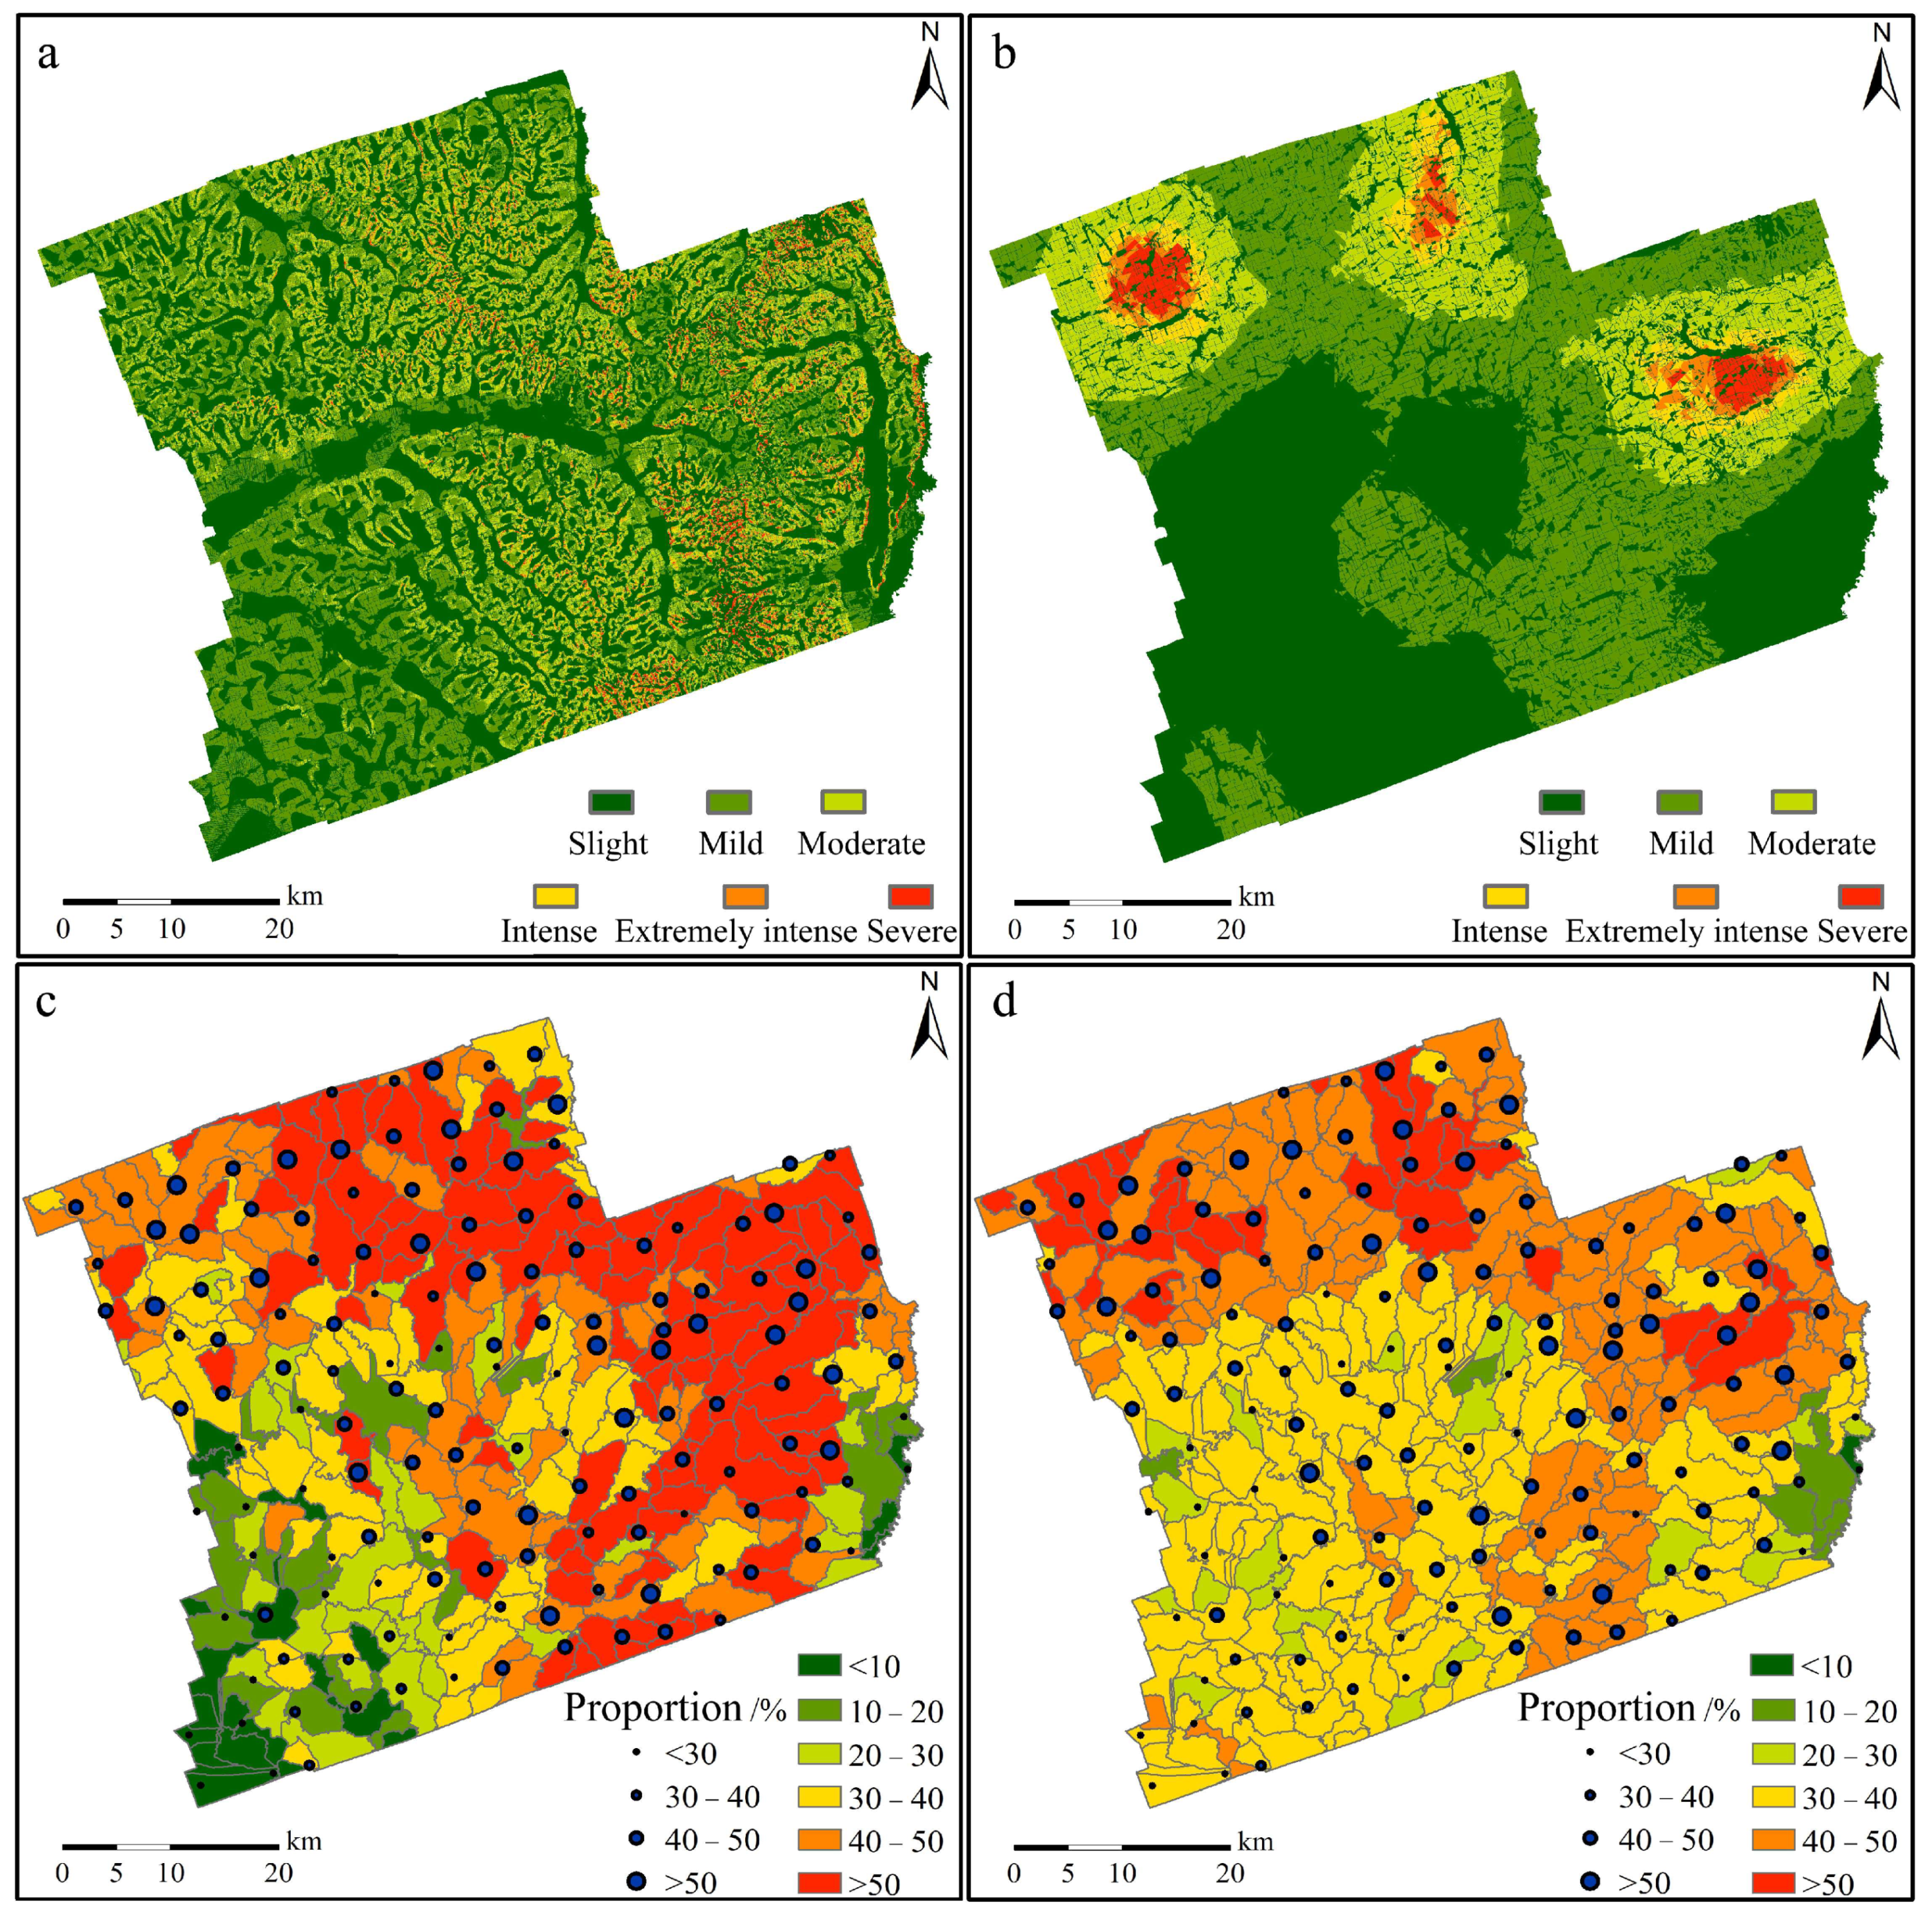
3.3. Comparison of Spatial Patterns between Grid Method and Sampling Method

Even though the CSLE model was used to calculate the rates of soil erosion, there were differences in the specific calculation process. For example, in the calculation of the B factor values of forested land, shrubland, and grassland, it was necessary to conduct vegetation coverage inversion from remote-sensing images; however, the sampling survey also considered vegetation coverage estimated by actual ground measurements. Therefore, the B factor values obtained by the two were also different. At the regional scale, the grid method was used to obtain the rates of soil erosion, through which the rates of soil erosion map was graded (Figure 5a). The results of the sampling survey units were obtained by combining the ratio of the soil erosion area of the unit with the spatial interpolation of land use, and the final result presented in the area was the ratio of the soil erosion area. If the interpolation results of the ratio of the soil erosion area based on the survey unit needed to be directly compared with the results of the grid method, the regional ratio of the soil erosion area would then need to be divided into several grades to be individually compared with each grade of soil erosion. According to the classification statistics of the calculation results of 216 survey units in Baiquan County, the area proportions of slight erosion, mild erosion, moderate erosion, strong erosion, extremely strong, and severe erosion were 62.90, 17.11, 13.97, 3.04, 1.53, and 1.45%, respectively. Assuming that the results of our sampling represent the soil erosion characteristics of the entire region, the proportion of each erosion grade in Baiquan County would also be equal to the results of the survey unit. Accordingly, the interpolation results of the ratio of the soil erosion area based on the survey units could be classified into the corresponding erosion grades (Figure 5b).
We compared the rates of soil erosion results obtained by the grid method with the results of the ratio of the soil erosion area obtained by the sampling survey on a small watershed scale, which avoided direct comparison between the rates of soil erosion and the ratio of the soil erosion area. First, we divided the small watersheds of Baiquan County based on the DEM generated from a 1:50,000 contour line. The average area of the small watersheds was approximately 11.7 km2, and the area was divided into 306 small watersheds, among which the smallest and largest watershed areas were 2.1 and 45.5 km2, respectively. The average ratio of the soil erosion area of the grid method and interpolation results of the ratio of the soil erosion area of the survey units were calculated for 306 small watersheds in Baiquan County. The results are shown in Figure 5c,d. When compared, the results of the delineation of the northern and northwestern regions were relatively consistent, and both areas showed severe erosion and were key areas for soil and water conservation planning and governance. The southwestern plain area of Baiquan County showed low erosion. In the results of the grid method, the proportion of area occupied by the erosion area of the small watershed was greater than 50%, which was approximately one-third of the total. The ratio of the soil erosion area of the point distribution in the figure represents that of the field survey in the survey unit. In general, the results of the grid method were in poor agreement, particularly in the eastern part of Baiquan County. The results of the grid method showed that the eastern hilly area showed more serious soil erosion.
The investigation and evaluation of soil erosion could identify areas with severe soil erosion, which could be the basis for the scientific and rational planning of soil and water conservation. In the existing soil and water conservation planning schemes, both rates of soil erosion and ratio of the soil erosion area can be used as an important basis for planning [36]. The soil assessment method was more appropriate if it can be more suitable for soil conservation planning. The results of this study showed that in regional water and soil conservation planning, the region was divided into several small watersheds, the proportion of the soil erosion area was counted in the small watershed, and the proportion of the eroded area was ranked to determine the order and area of priority treatment. Accordingly, soil and water conservation planning was conducted in combination with natural, social, economic, and ecological factors, among others. The layout of soil and water conservation measures and the evaluation of their benefits should pay attention to the rates of soil erosion. The corresponding soil and water conservation measures were arranged according to the distribution of the rates of soil erosion in the control area, and the benefits of soil and water conservation measures were evaluated based on the change in the rates of soil erosion before and after the layout of measures.

4. Discussion

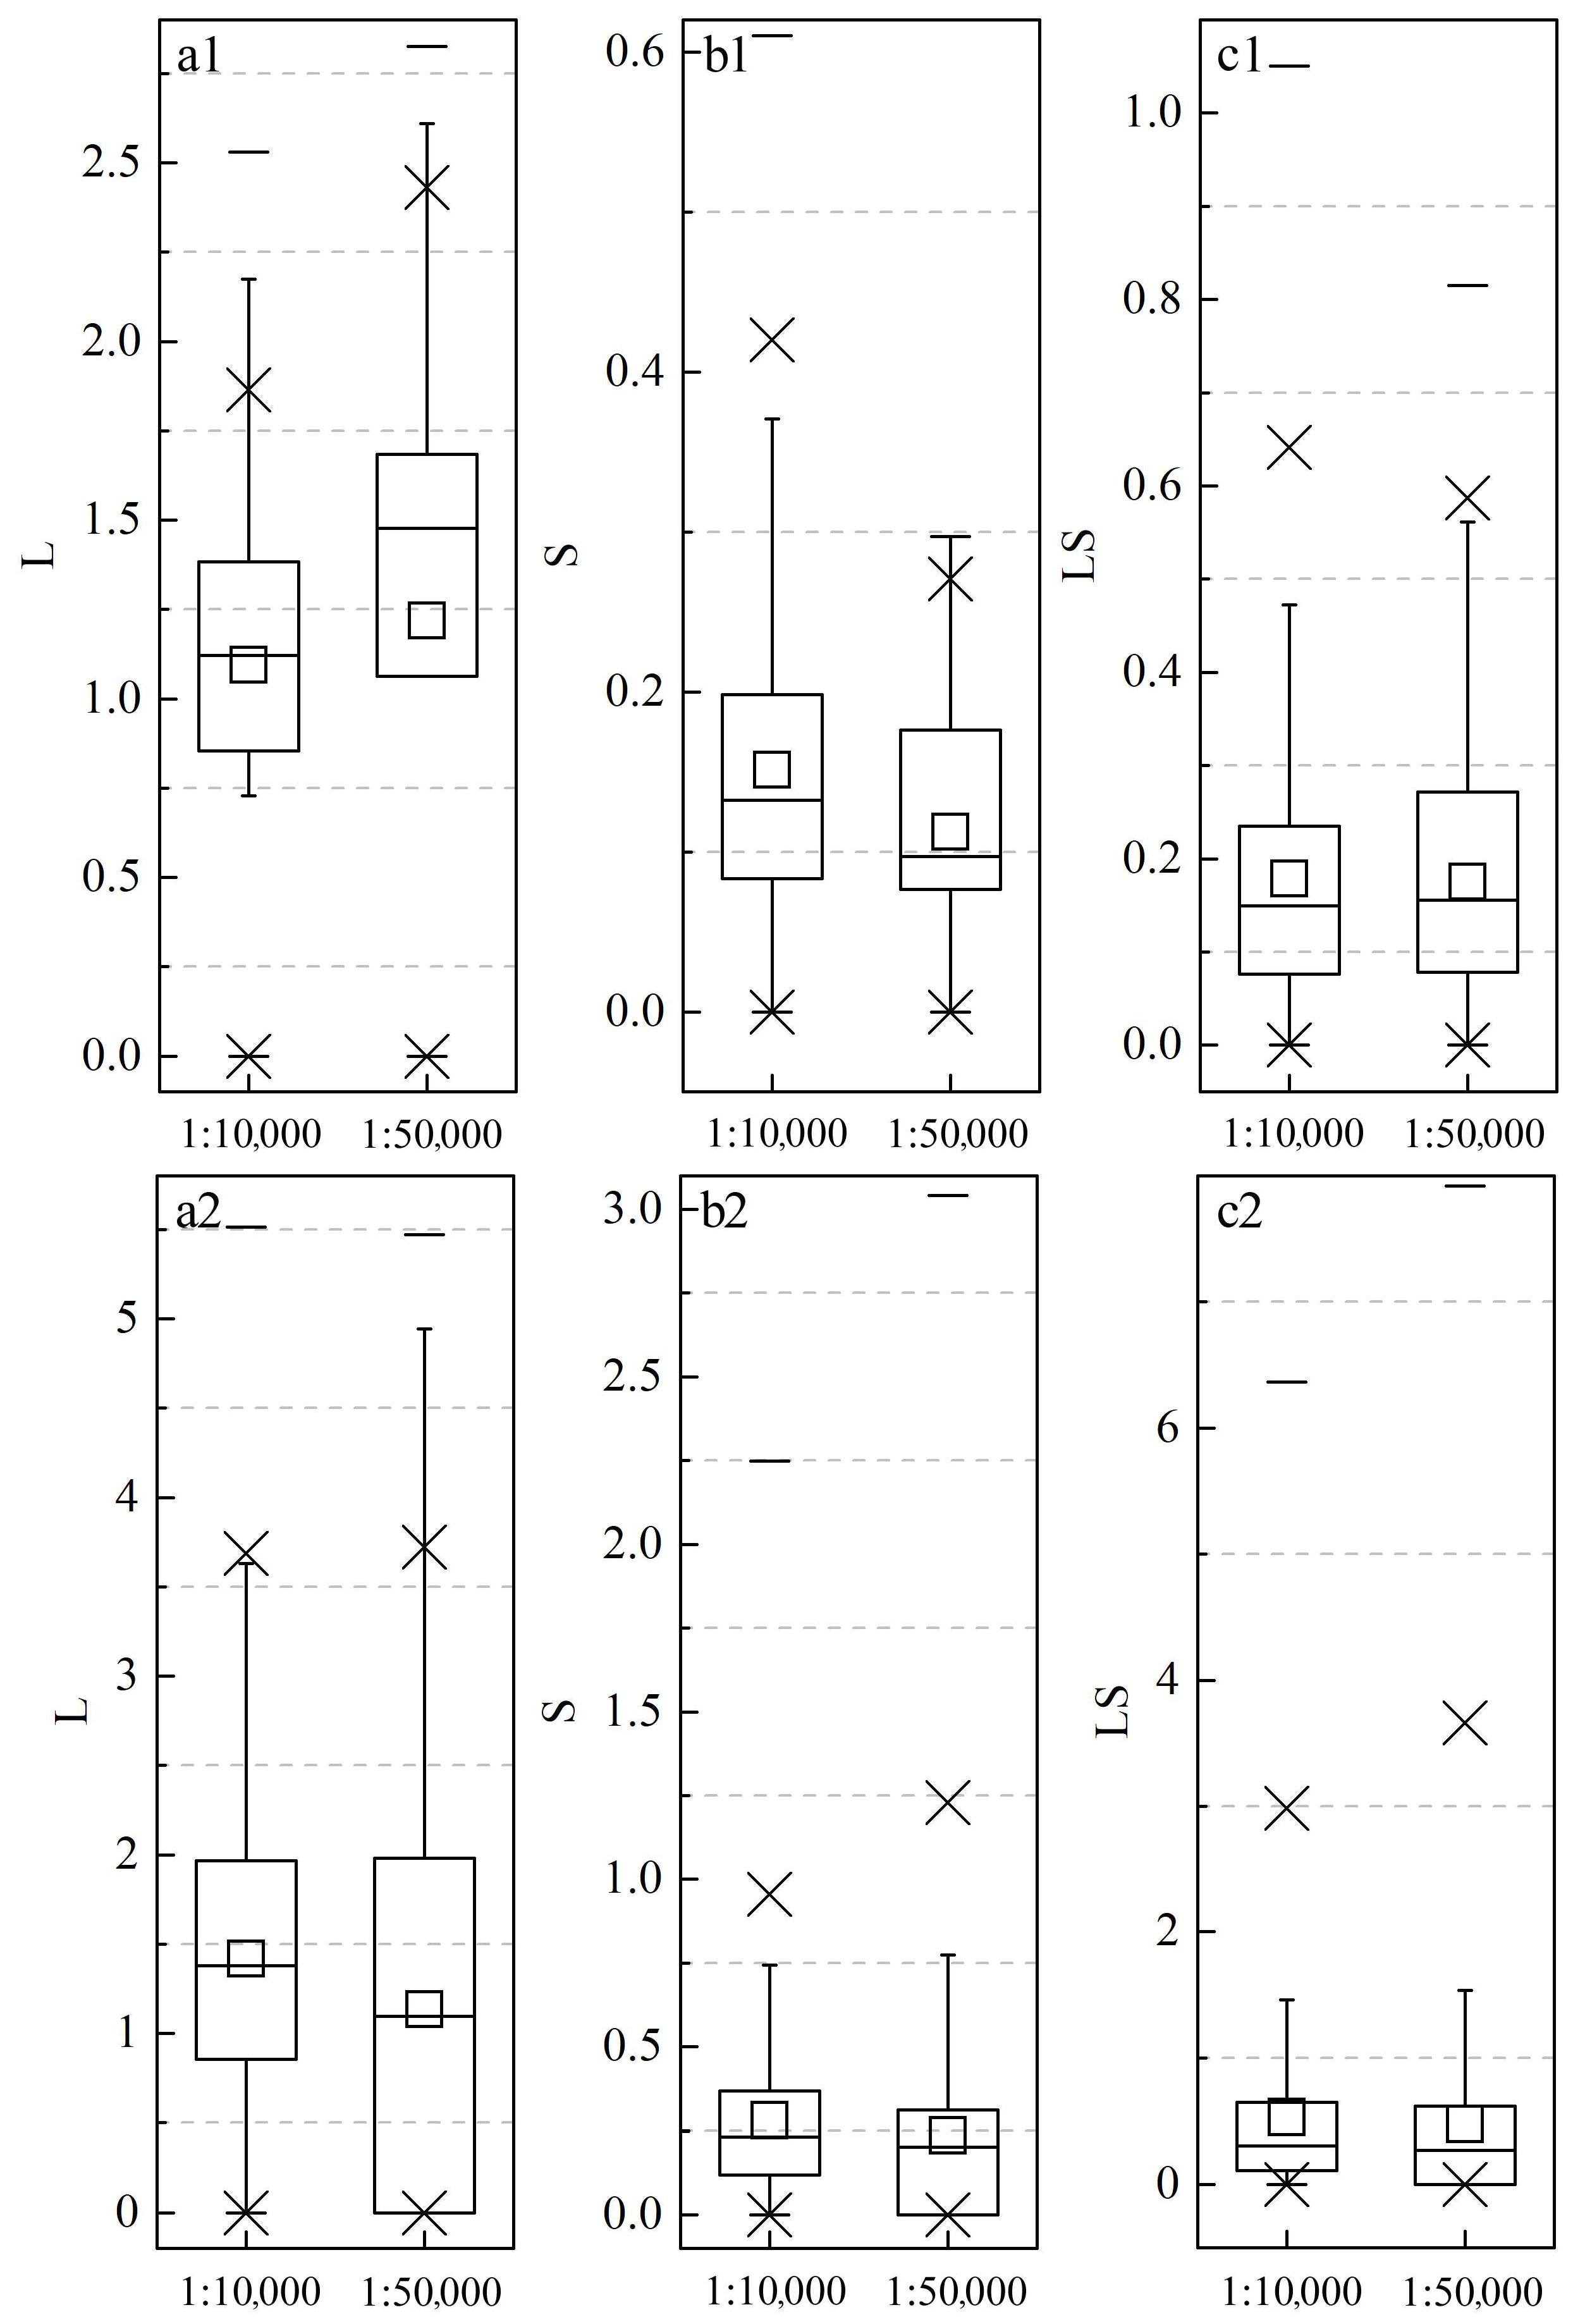
4.1. Influence of Topographic Data on the Calculation of Rates of Soil Erosion

Topography mainly affects soil erosion through the slope gradient and slope length (LS) factor, which were extracted based on the DEM [37]. Topographic factors are basic topographic elements affecting the area and distribution of soil erosion and are used as input factors in many soil erosion models. At present, we can obtain free DEM data worldwide at a 30 m resolution, mainly from Advanced Spaceborne Thermal Emission and Reflection Radiometer (ASTER) global DEM (GDEM), Shuttle Radar Topography Mission (SRTM) DEM, ALOS Global Digital Surface Model “ALOS World 3D-30 m (AW3D30)”, and other datasets. Additionally, some countries and regions have released high precision DEM data. For example, some regions in the United States can freely download a DEM with a high resolution of 3 m or even higher. Different DEM scales have significant differences in the evaluation of the rates of soil erosion. Small scales make the terrain fluctuations flat overall, and the slope decreases; this naturally underestimates the rates of soil erosion [38]. A large-scale DEM cannot directly reflect the real undulating slope value of the ground surface, but can only calculate the slope morphologically [39]. Yin et al. [19] showed that the L and S factor values obtained by DEM with different precisions and spatial resolutions differed considerably. The LS factor obtained at a scale of 1:10,000 was more reliable for regional soil erosion assessment, whereas a spatial evaluation with a resolution lower than 30 m was less effective. Even a 25 m resolution DEM would produce errors in calculating the LS factor in mountainous areas, thus affecting the results of the regional soil erosion assessment [18]. Currently, it is almost impossible to obtain high-precision terrain data across counties. Additionally, the 1:10,000 contour line was classified as confidential data in many areas of China, and it was impossible to obtain this contour line data over a large area. This makes it difficult to accurately assess regional soil erosion. Therefore, the maximum scale of the DEM that could be used by the grid method was 1:50,000, when the dynamic monitoring of soil erosion was conducted on a regional scale.
In the southwestern plain area of Baiquan County, when comparing the terrain factors extracted from the DEM with two resolutions, the L factor differed considerably in terms of the average value. Comparison between the L factors extracted from the 1:50,000- and 1:10,000-scale DEMs showed that the latter tended to overestimate the values by 11% (Figure 6(a1)). The extracted S factor tended to be underestimated by 25% (Figure 6(b1)). Therefore, the mean values of the LS factors calculated using the DEM for the two resolutions were very similar (approximately 0.18 (Figure 6(c1)). In the rolling hilly region in the northeast of Baiquan County, the L factors extracted from the two resolutions were considerably different; the L and S factors extracted based on the 1:50,000 scale DEM tended to be underestimated (Figure 6(a2,b2)) by 20% and 16%, respectively. Therefore, the average LS factor value extracted from the 1:50,000 scale DEM was lower than that extracted from the 1:10,000 scale DEM, which had a total underestimation of 10% (Figure 6(c2)). Therefore, in the regional soil erosion assessment, the DEM of the plain area could be replaced by that with a spatial resolution of 30 m. In a rolling hilly region, this replacement cannot be conducted. The northeastern region of this study was mainly plain, and the overall terrain was low; however, the rolling hills and hilly areas were dominated by low and gentle hills, and the error of the 1:50,000 scale DEM in extracting the LS was very large. The error of the extracted LS from the 1:50,000 scale DEM was even greater in the rugged southwestern region of China, where mountainous plateaus are widespread, and in the Loess Plateau, with thousands of ravines and gullies. A DEM at a resolution of 30 m or lower should not be used to evaluate regional soil erosion.

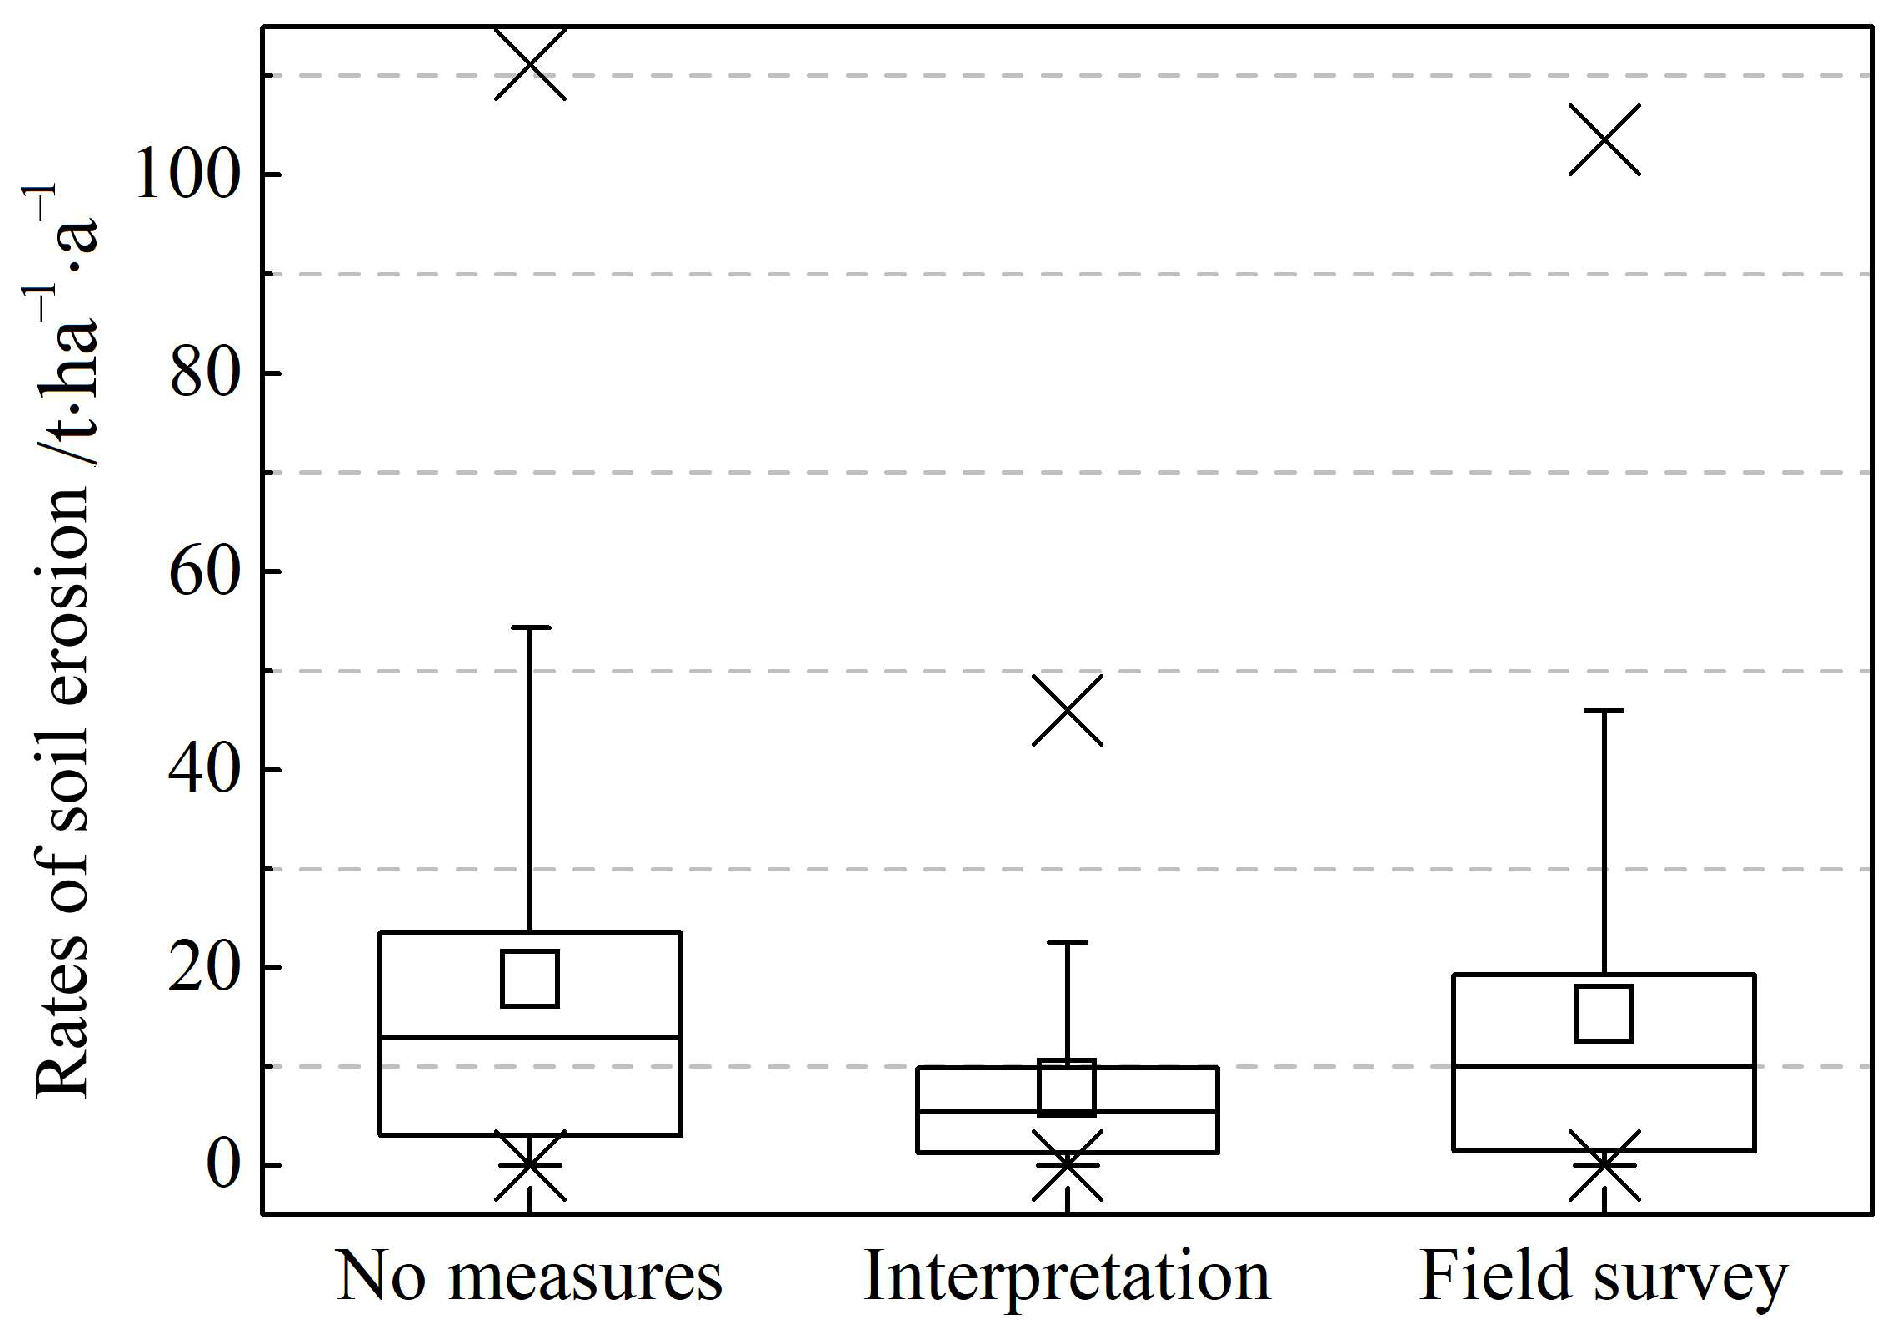
4.2. Influence of Soil and Water Conservation Measures on the Calculation of Rates of Soil Erosion

Soil and water conservation measures can effectively prevent soil erosion, and their quantity and spatial distribution significantly impact the assessment of soil erosion [40]. Most soil and water conservation measures are distributed on farmland, and several types exist; thus, it is difficult to accurately interpret these measures from remote-sensing images. Soil erosion models generally use water conservation measures based on image interpretation, which is an important factor affecting the accuracy of soil erosion assessments. In this study, after cropping the land-use map of the grid method in the survey unit, we removed all the correctly interpreted cultivated land and cropped the soil and water conservation measure layer, which was interpreted based on the high-resolution image. We then compared the differences in soil erosion assessment caused by the interpretation accuracy of soil and water conservation measures within this range. There are many uncertainties in the interpretation of soil and water conservation measures from the satellite image. Even if the image was clear enough (with sufficiently high spatial resolution), the type and distribution of soil and water conservation measures could not be accurately evaluated because of the experience of the interpreter. Therefore, in the grid method, the water conservation measures are ignored. Additionally, considering the interpretation of soil and water conservation measures based on high-resolution images, its accuracy would also cause errors in assessing the soil erosion. We subsequently compared the soil erosion moduli calculated without considering water conservation measures: those based on high-score image interpretation and those calculated based on field surveys (Figure 7). The rates of soil erosion calculated without water conservation measures varied from 0 to 342 t·ha−1·a−1, and the average value was 18.8 t·ha−1·a−1. The rates of soil erosion calculated based on the interpretation of the water conservation measures from the high-resolution image varied from 0 to 141 t·ha−1·a−1, with an average of 7.8 t·ha−1·a−1. The rates of soil erosion calculated based on the soil and water conservation measures in the field survey varied from 0 to 342 t·ha−1·a−1, with an average of 15.2t·ha−1·a−1. In our study area, the soil erosion assessment results obtained without considering the soil and water conservation measures were closer to the actual erosion status. However, owing to the influence of interpretation accuracy, water conservation measures based on high-resolution image interpretation could lead to differences in assessing the soil erosion. In this study, the rates of soil erosion were underestimated by approximately 50%. Therefore, the influence of engineering measures was not considered in the grid method, implying that the E value was 1. We only considered the influence of crop rotation measures on farming measures.
The spatial distribution of the grid method showed that the eastern hilly area showed more serious soil erosion. This was because soil and water conservation measures were not fully considered in the calculation. During the field investigation, we found that the vegetation coverage in the eastern hilly area was relatively high, and soil and water conservation measures, such as ridges, slope terraces, and contours, were also more concentrated in this region. Therefore, the effect of soil and water conservation measures would not be considered in the grid method, thereby overestimating erosion. The interpolation results based on the proportion of water erosion in the survey unit could better reflect the regional variation characteristics of soil erosion. From this point of view, the sampling method was more appropriate.
CSLE has been proven in its reliability in soil erosion assessment in Northeast China. When comparing the results of the sampling and grid methods, it would be better if we have the measurements of 137Cs techniques in the study area. Based on a 1:10,000 digital contour map, the field measurement of vegetation coverage, the coverage of understory vegetation in arbor forests, and soil and water conservation measures, we assumed that the assessment of soil erosion sampling units is more reliable, which can be applied to indicate the precision or error of the results of the grid method in sampling units. The grid method and sampling method both have been applied in the assessment of soil erosion in China. The sampling method, especially, has been used in American for a long time. The two methods can be extrapolated; however, the reliability of each method needs more in-depth study.
At present, China is conducting the division of key soil erosion prevention and control areas. The delineation work is in the exploratory stage and has not yet been completed. The “landing” of key water and soil loss prevention and control areas needs to be scientifically delimited at the county level, which is an important basis for the deployment of soil and water conservation measures and the evaluation of soil and water conservation benefits. In previous soil and water conservation practices, the planning and management of soil and water conservation in small watersheds has achieved remarkable results, especially in Baiquan County. Therefore, the spatial distribution of soil erosion with a small watershed as the statistical unit is more conducive to soil and water conservation planning.

5. Conclusions

The main conclusions are as follows:
(1) The results of the grid method showed that the rates of soil erosion were extremely large, and the ratio of the soil erosion area was too high, and these were overestimated by 20 and 6%, respectively. In terms of the spatial distribution pattern, the results of the grid method and sampling survey showed that the two had a high degree of agreement in the plain area. The results of the grid method were relatively reliable, and the error of the grid method in the hilly area was large. The error was larger, especially in the eastern hilly areas, where vegetation coverage was high, and soil and water conservation measures such as ridges, slope terraces, and contour farming were concentrated. In the grid method, the effects of soil and water conservation measures were not considered, thus overestimating the erosion. The interpolation results based on the proportion of water erosion in the survey unit could also reflect the regional variation characteristics of soil erosion.
(2) In the regional soil erosion assessment, the DEM of the plain area could be replaced by that with a spatial resolution of 30 m. In hilly areas with large terrain fluctuations, the error of the DEM with a 30 m resolution would be larger in extracting LS; thus, it was unreliable to use a DEM with a spatial resolution of 30 m or larger for evaluating regional soil erosion.
(3) The soil and water conservation measures based on image interpretation exaggerated the actual area and scope, leading to an underestimation of the rates of soil erosion by 50% when considering soil and water conservation measures in this study. When the interpretation accuracy of soil and water conservation measures was low, the impact of measures increased the difference in erosion assessment. Notably, the types of soil and water conservation measures in this study area were relatively simple; the ground features were more obvious and the interpretation was relatively easy. If the terrain was broken and the soil and water conservation measures varied, the ground features would be more difficult to interpret through images. Therefore, at present, field investigations for identifying soil and water conservation measures in regional soil erosion assessments are more credible.

Author Contributions

Conceptualization, Z.G. and A.L.; methodology, Z.G.; software, S.C.; validation, Z.G. and Q.Y.; formal analysis, S.L.; investigation, Z.G. and A.L.; resources, Q.Y.; data curation, P.L.; writing—original draft preparation, Z.G.; writing—review and editing, Z.G. and A.L.; visualization, S.C.; supervision, S.L.; project administration, Q.Y.; funding acquisition, Z.G. All authors have read and agreed to the published version of the manuscript.

Funding

This work was supported by the National Key Research and Development Program of China (Grant number: 2018YFC0507004), Youth Program of the “Nanhu Scholar Award Program” of Xinyang Normal University (Grant number: 2019046).

Data Availability Statement

No new data were created or analyzed in this study. Data sharing is not applicable to this article.

Conflicts of Interest

The authors declare no conflict of interest.

References

  1. Liu, Z. Objectives and tasks of soil and water conservation in China. Sci. Soil Water Conserv. 2003, 260, 121109. [Google Scholar]
  2. Pimentel, D. Soil erosion: A food and environmental threat. Environ. Dev. Sustain. 2006, 8, 119–137. [Google Scholar] [CrossRef]
  3. Smith, P.; House, J.I.; Bustamante, M.; Sobocká, J.; Harper, R.; Pan, G.; West, P.C.; Clark, J.M.; Adhya, T.; Rumpel, C.; et al. Global change pressures on soils from land use and management. Glob. Chang. Biol. 2016, 22, 1008–1028. [Google Scholar] [CrossRef] [PubMed]
  4. Liu, B.Y.; Yang, Y.; Lu, S.J. Discriminations on common soil erosion terms and their implications for soil and water conservation. Sci. Soil Water Conserv. 2018, 16, 9–16. [Google Scholar]
  5. Borrelli, P.; Alewell, C.; Alvarez, P.; Anache, J.A.A.; Baartman, J.; Ballabio, C.; Bezak, N.; Biddoccu, M.; Cerdà, A.; Chalise, D.; et al. Soil erosion modelling: A global review and statistical analysis. Sci. Total Environ. 2021, 780, 146494. [Google Scholar] [CrossRef]
  6. Dou, X.; Ma, X.; Zhao, C.; Li, J.; Yan, Y.; Zhu, J. Risk assessment of soil erosion in Central Asia under global warming. Catena 2022, 212, 106056. [Google Scholar] [CrossRef]
  7. Rosewell, C.J. Potential Sources of Sediments and Nutrients: Sheet and Rill Erosion and Phosphorus Sources; Environment Australia: Canberra, Australia, 1997. [Google Scholar]
  8. Lu, H.; Gallant, J.; Prosser, I.P.; Moran, C.; Priestley, G. Prediction of sheet and rill erosion over the Australian continent, incorporating monthly soil loss distribution. In Land and Water Technical Report; CSIRO: Canberra, Australia, 2001. [Google Scholar]
  9. Grimm, M.; Jones, R.; Montanarella, L. Soil Erosion Risk in Europe; Joint Research Centre European Commission: Sint Maartensvlotbrug, The Netherlands, 2001. [Google Scholar]
  10. Panagos, P.; Ballabio, C.; Himics, M.; Scarpa, S.; Matthews, F.; Bogonos, M.; Poesen, J.; Borrelli, P. Projections of soil loss by water erosion in Europe by 2050. Environ. Sci. Policy 2021, 124, 380–392. [Google Scholar] [CrossRef]
  11. Nusser, S.M.; Goebel, J.J. The National Resources Inventory: A long-term multi-resource monitoring programme. Environ. Ecol. Stat. 1997, 4, 181–204. [Google Scholar] [CrossRef]
  12. Goebel, J.J. The National Resources Inventory and its role in US agriculture. Int. Stat. Inst. 1998, 181–192. [Google Scholar]
  13. Harlow, J.T. History of Natural Resources Conservation Service National Resources Inventories; USDA: Washington, DC, USA, 1994.
  14. Guo, S.Y.; Li, Z.G. Development and achievements of soil and water conservation monitoring in China. Sci. Soil Water Conserv. 2009, 7, 19–24. [Google Scholar]
  15. Liu, B.; Xie, Y.; Li, Z.; Liang, Y.; Zhang, W.; Fu, S.; Yin, S.; Wei, X.; Zhang, K.; Wang, Z.; et al. The assessment of soil loss by water erosion in China. Int. Soil Water Conserv. Res. 2020, 8, 430–439. [Google Scholar] [CrossRef]
  16. Fiener, P.; Auerswald, K. Comment on ”The new assessment of soil loss by water erosion in Europe” by Panagos et al. (Environmental Science & Policy 54 (2015) 438-447). Environ Sci. Policy 2016, 57, 140–142. [Google Scholar]
  17. Panagos, P.; Meusburger, K.; Ballabio, C.; Borrelli, P.; Alewell, C. Soil erodibility in Europe: A high-resolution dataset based on LUCAS. Sci. Total Environ. 2014, 479, 189–200. [Google Scholar] [CrossRef] [PubMed]
  18. Panagos, P.; Borrelli, P.; Poesen, J.; Ballabio, C.; Lugato, E.; Meusburger, K.; Montanarella, L.; Alewell, C. The new assessment of soil loss by water erosion in Europe. Environ. Sci. Policy 2015, 54, 438–447. [Google Scholar] [CrossRef]
  19. Yin, S.; Zhu, Z.; Wang, L.; Liu, B.; Xie, Y.; Wang, G.; Li, Y. Regional soil erosion assessment based on a sample survey and geostatistics. Hydrol. Earth Syst. Sci. 2018, 22, 1695–1712. [Google Scholar] [CrossRef]
  20. Zou, C.R.; Qi, F.; Zhang, Q.H.; Liu, X.; Zhang, R.; Li, J.; Dong, S.; Yao, X. Comparison of different sampling densities and extrapolation methods based on CSLE model. Sci. Soil Water Conserv. 2016, 14, 130–138. [Google Scholar]
  21. Zhang, H.; Zhang, R.; Qi, F.; Liu, X.; Niu, Y.; Fan, Z.; Zhang, Q.; Li, J.; Yuan, L.; Song, Y.; et al. The CSLE model based soil erosion prediction: Comparisons of sampling density and extrapolation method at the county level. Catena 2018, 165, 465–472. [Google Scholar] [CrossRef]
  22. Pandey, A.; Gautam, A.K.; Chowdary, V.M.; Jha, C.S.; Cerdà, A. Uncertainty assessment in soil erosion modelling using RUSLE, multisource and multiresolution DEMs. J. Indian Soc. Remote Sens. 2021, 49, 1689–1707. [Google Scholar] [CrossRef]
  23. Zhang, Y.; Wu, Y.; Liu, B.; Zheng, Q.; Yin, J. Characteristics and factors controlling the development of ephemeral gullies in cultivated catchments of black soil region, Northeast China. Soil Tillage Res. 2007, 96, 28–41. [Google Scholar] [CrossRef]
  24. Fang, H.; Sun, L.; Qi, D.; Cai, Q. Using 137Cs technique to quantify soil erosion and deposition rates in an agricultural catchment in the black soil region, Northeast China. Geomorphology 2012, 170, 142–150. [Google Scholar] [CrossRef]
  25. Zhang, Q.W.; Li, Y. Effectiveness assessment of soil conservation measures in reducing soil erosion in Baiquan County of Northeastern China by using 137Cs techniques. Environ. Sci. Process. Impacts 2014, 16, 1480. [Google Scholar] [CrossRef] [PubMed]
  26. Fang, H.Y.; Sun, L.Y. Modelling soil erosion and its response to the soil conservation measures in the black soil catchment, Northeastern China. Soil Tillage Res. 2017, 165, 23–33. [Google Scholar]
  27. Fang, H.; Fan, Z. Assessment of Soil Erosion at Multiple Spatial Scales Following Land Use Changes in 1980–2017 in the Black Soil Region, (NE) China. Int. J. Environ. Res. Public Health 2020, 17, 7378. [Google Scholar] [CrossRef]
  28. Gu, Z.J.; Xie, Y.; Li, A.; Liu, G.; Shi, Y.D. Assessment of soil erosion in rolling hilly region of Northeast China using Chinese Soil Loss Equation (CSLE) model. Trans. Chin. Soc. Agric. Eng. 2020, 36, 49–56. [Google Scholar]
  29. Zhang, R.; Liu, X.; Heathman, G.C.; Yao, X.; Hu, X.; Zhang, G. Assessment of soil erosion sensitivity and analysis of sensitivity factors in the Tongbai–Dabie mountainous area of China. Catena 2012, 101, 92–98. [Google Scholar] [CrossRef]
  30. Wischmeier, W.H.; Mannering, J.V. Relation of soil properties to its erodibility. Soil Sci. Soc. Am. J. 1969, 33, 131–137. [Google Scholar] [CrossRef]
  31. Sharpley, A.N.; Williams, J.R.; Jones, C.A. Erosion Productivity Impact Calculator EPIC: Model Documentation; USDA Technical Bulletin 1768; The Royal Society Publishing: London, UK, 1990. [Google Scholar]
  32. Foster, G.R.; Wischmeier, W. Evaluating irregular slopes for soil loss prediction. Trans. ASAE 1974, 17, 305–309. [Google Scholar] [CrossRef]
  33. McCool, D.K.; Brown, L.C.; Foster, G.R.; Mutchler, C.K.; Meyer, L.D. Revised Slope Steepness Factor for the Universal Soil Loss Equation. Trans. ASAE 1987, 30, 1387–1396. [Google Scholar] [CrossRef]
  34. Liu, B.Y.; Nearing, M.A.; Risse, L.M. Slope gradient effects on soil loss for steep slopes. Trans. ASAE 1994, 37, 1835–1840. [Google Scholar] [CrossRef]
  35. Ministry of Water Resources of the People’s Republic of China. Techniques Standard for Comprehensive Control of Soil Erosion: SL446-2009; China Water Resources and Hydropower Press: Beijing, China, 2009. (In Chinese) [Google Scholar]
  36. Wang, B.; Zheng, F.L.; Guan, Y.H. Improved USLE-K factor prediction: A case study on water erosion areas in China. Int. Soil Water Conserv. Res. 2016, 4, 168–176. [Google Scholar] [CrossRef]
  37. Li, A.; Zhang, X.J.; Liu, B.Y. Effects of DEM resolutions on soil erosion prediction using Chinese Soil Loss Equation. Geomorphology 2021, 384, 107706. [Google Scholar] [CrossRef]
  38. Gao, Y.; Lv, N.; Xue, C.S.; Ma, H.C. Influence of digital elevation model with different scales to the graded intensity of soil erosion. Soil Water Conserv. China 2007, 10, 26–28. [Google Scholar]
  39. Yang, Q.K.; Li, R.; Liang, W. Cartographic analysis on terrain factors for regional soil erosion modeling. Res. Soil Water Conserv. 2006, 13, 56–58. [Google Scholar]
  40. Sun, L.; Zhang, B.; Yin, Z.; Guo, H.; Siddique, K.H.; Wu, S.; Yang, J. Assessing the performance of conservation measures for controlling slope runoff and erosion using field scouring experiments. Agric. Water Manag. 2022, 259, 107212. [Google Scholar] [CrossRef]
Figure 1. Spatial distribution of sampling units in Baiquan County.
Land 12 01703 g001
Figure 2. Frequency distribution of the rates of soil erosion in the units of the sampling survey and grid method.
Land 12 01703 g002
Figure 3. (a) The rates of soil erosion and (b) soil erosion area ratio of the grid method and sampling survey.
Land 12 01703 g003
Figure 4. Rates of soil erosion of the main land-use types in the survey unit of (a) the sampling survey and (b) the grid method.
Land 12 01703 g004
Figure 5. Rates of soil erosion maps of the (a) grid method, (b) sampling method, (c) ratio of the soil erosion area of grid method, and of the sampling method (d).
Land 12 01703 g005
Figure 6. Topographic factors extracted based on the 1:10,000 and 1:50,000 scales on the survey units in the (a1,b1,c1) southwestern plain area and (a2,b2,c2) northeastern rolling hill area of Baiquan County.
Land 12 01703 g006
Figure 7. Rates of soil erosion without any measures and measures from interpretation and field surveys.
Land 12 01703 g007
Table 1. B factor value of land use except for forest land and grassland.
First Class Classification of Land UseSecond Class Classification of Land UseB ValueNotes
Cultivated landPaddy field1Water conservation benefits reflected by T factor
Dry land1Water conservation benefits reflected by T factor
Irrigable land1Water conservation benefits reflected by T factor
Settlements and mining sitesUrban settlements0.01Equivalent to 80% vegetation cover
Rural settlements0.025Equivalent to 60% vegetation cover
Independent industrial land1Equivalent to no vegetation cover
Transportation landRural road1Equivalent to no vegetation cover
Other transportation land0.01Equivalent to 80% vegetation cover
Water area and water conservancy facility land 0The amount of erosion is 0
Other land 0Bare land is 1, otherwise it is 0
Table 2. E value of engineering practices.
Second Class ClassificationEngineering PracticesE Value
TerraceHorizontal terraces with soil ridges0.084
Horizontal terraces with rock ridges0.121
Sloping terraces0.414
Terraced fields with slope0.347
Field bund 0.347
Level steps 0.151
Table 3. Classification standard for the rates of soil erosion.
GradeSlightMildModerateIntenseExtremely IntenseSevere
Rates of soil erosion (t·ha−1·a−1)≤22~1212~2424~3636~48>48
Disclaimer/Publisher’s Note: The statements, opinions and data contained in all publications are solely those of the individual author(s) and contributor(s) and not of MDPI and/or the editor(s). MDPI and/or the editor(s) disclaim responsibility for any injury to people or property resulting from any ideas, methods, instructions or products referred to in the content.

