Article

What Are the Impacts of Urbanisation on Carbon Emissions Efficiency? Evidence from Western China

1
College of Urban and Environmental Sciences, Peking University, Beijing 100871, China
2
School of Government, Peking University, Beijing 100871, China
3
School of Software & Microelectronics, Peking University, Beijing 100871, China
4
School of Public Policy and Management, Guangxi University, Nanning 530004, China
5
Guanghua School of Management, Peking University, Beijing 100871, China
*
Author to whom correspondence should be addressed.
Land 2023, 12(9), 1707; https://doi.org/10.3390/land12091707
Submission received: 27 May 2023 / Revised: 30 August 2023 / Accepted: 31 August 2023 / Published: 31 August 2023

Abstract

:
The contributions of this research are making the theoretical analysis of the impact mechanism of urbanisation on carbon emissions efficiency (CEE), and then empirically analysing the effects of urbanisation on CEE in Western China from 2010 to 2019 by applying the super-efficiency epsilon-based measure model with undesirable outputs and the Tobit model. Major findings are: (1) The mean CEE of the 11 western provinces show a trend of declining and then increasing over those 10 years, demonstrating U-shaped change characteristics. (2) The CEE of Guangxi has the most significant decrease, while the CEE of Chongqing showed only a small fluctuation; the CEE of Guizhou has the characteristic that first it rises, then descends, then rises again; the CEEs of Inner Mongolia and Yunnan have been in the production frontier surface from 2010 to 2015, and presents the trend of declining, then increasing after 2015. The CEEs of the other six western provinces present a trend of declining, then increasing. (3) Chongqing, Sichuan, Inner Mongolia, and Yunnan have a high level of CEE, followed by Shaanxi, Xinjiang, Guangxi, and Guizhou, with an intermediate level of CEE, and Gansu, Ningxia, and Qinghai, with the lowest level of CEE. (4) The effects of urbanisation on CEE in Western China present a U-shaped relationship, meaning that the process of influence was first inhibition, then stimulation. At present, the process of urbanisation shows negative impacts on the CEE, while the tipping point has not yet arrived. The western provinces of China should follow the path of high-quality urbanisation to quickly shift the impact of urbanisation on CEE to the right side of the U-shaped curve.

1. Introduction

Ever since human beings entered the industrial era, global warming has become one of the most serious problems worldwide. It is, therefore, imperative to control and eliminate greenhouse gas emissions, especially CO2 emissions [1]. China’s West Development Program has motivated rapid urbanisation and industrialisation in Western China [2], inducing serious CO
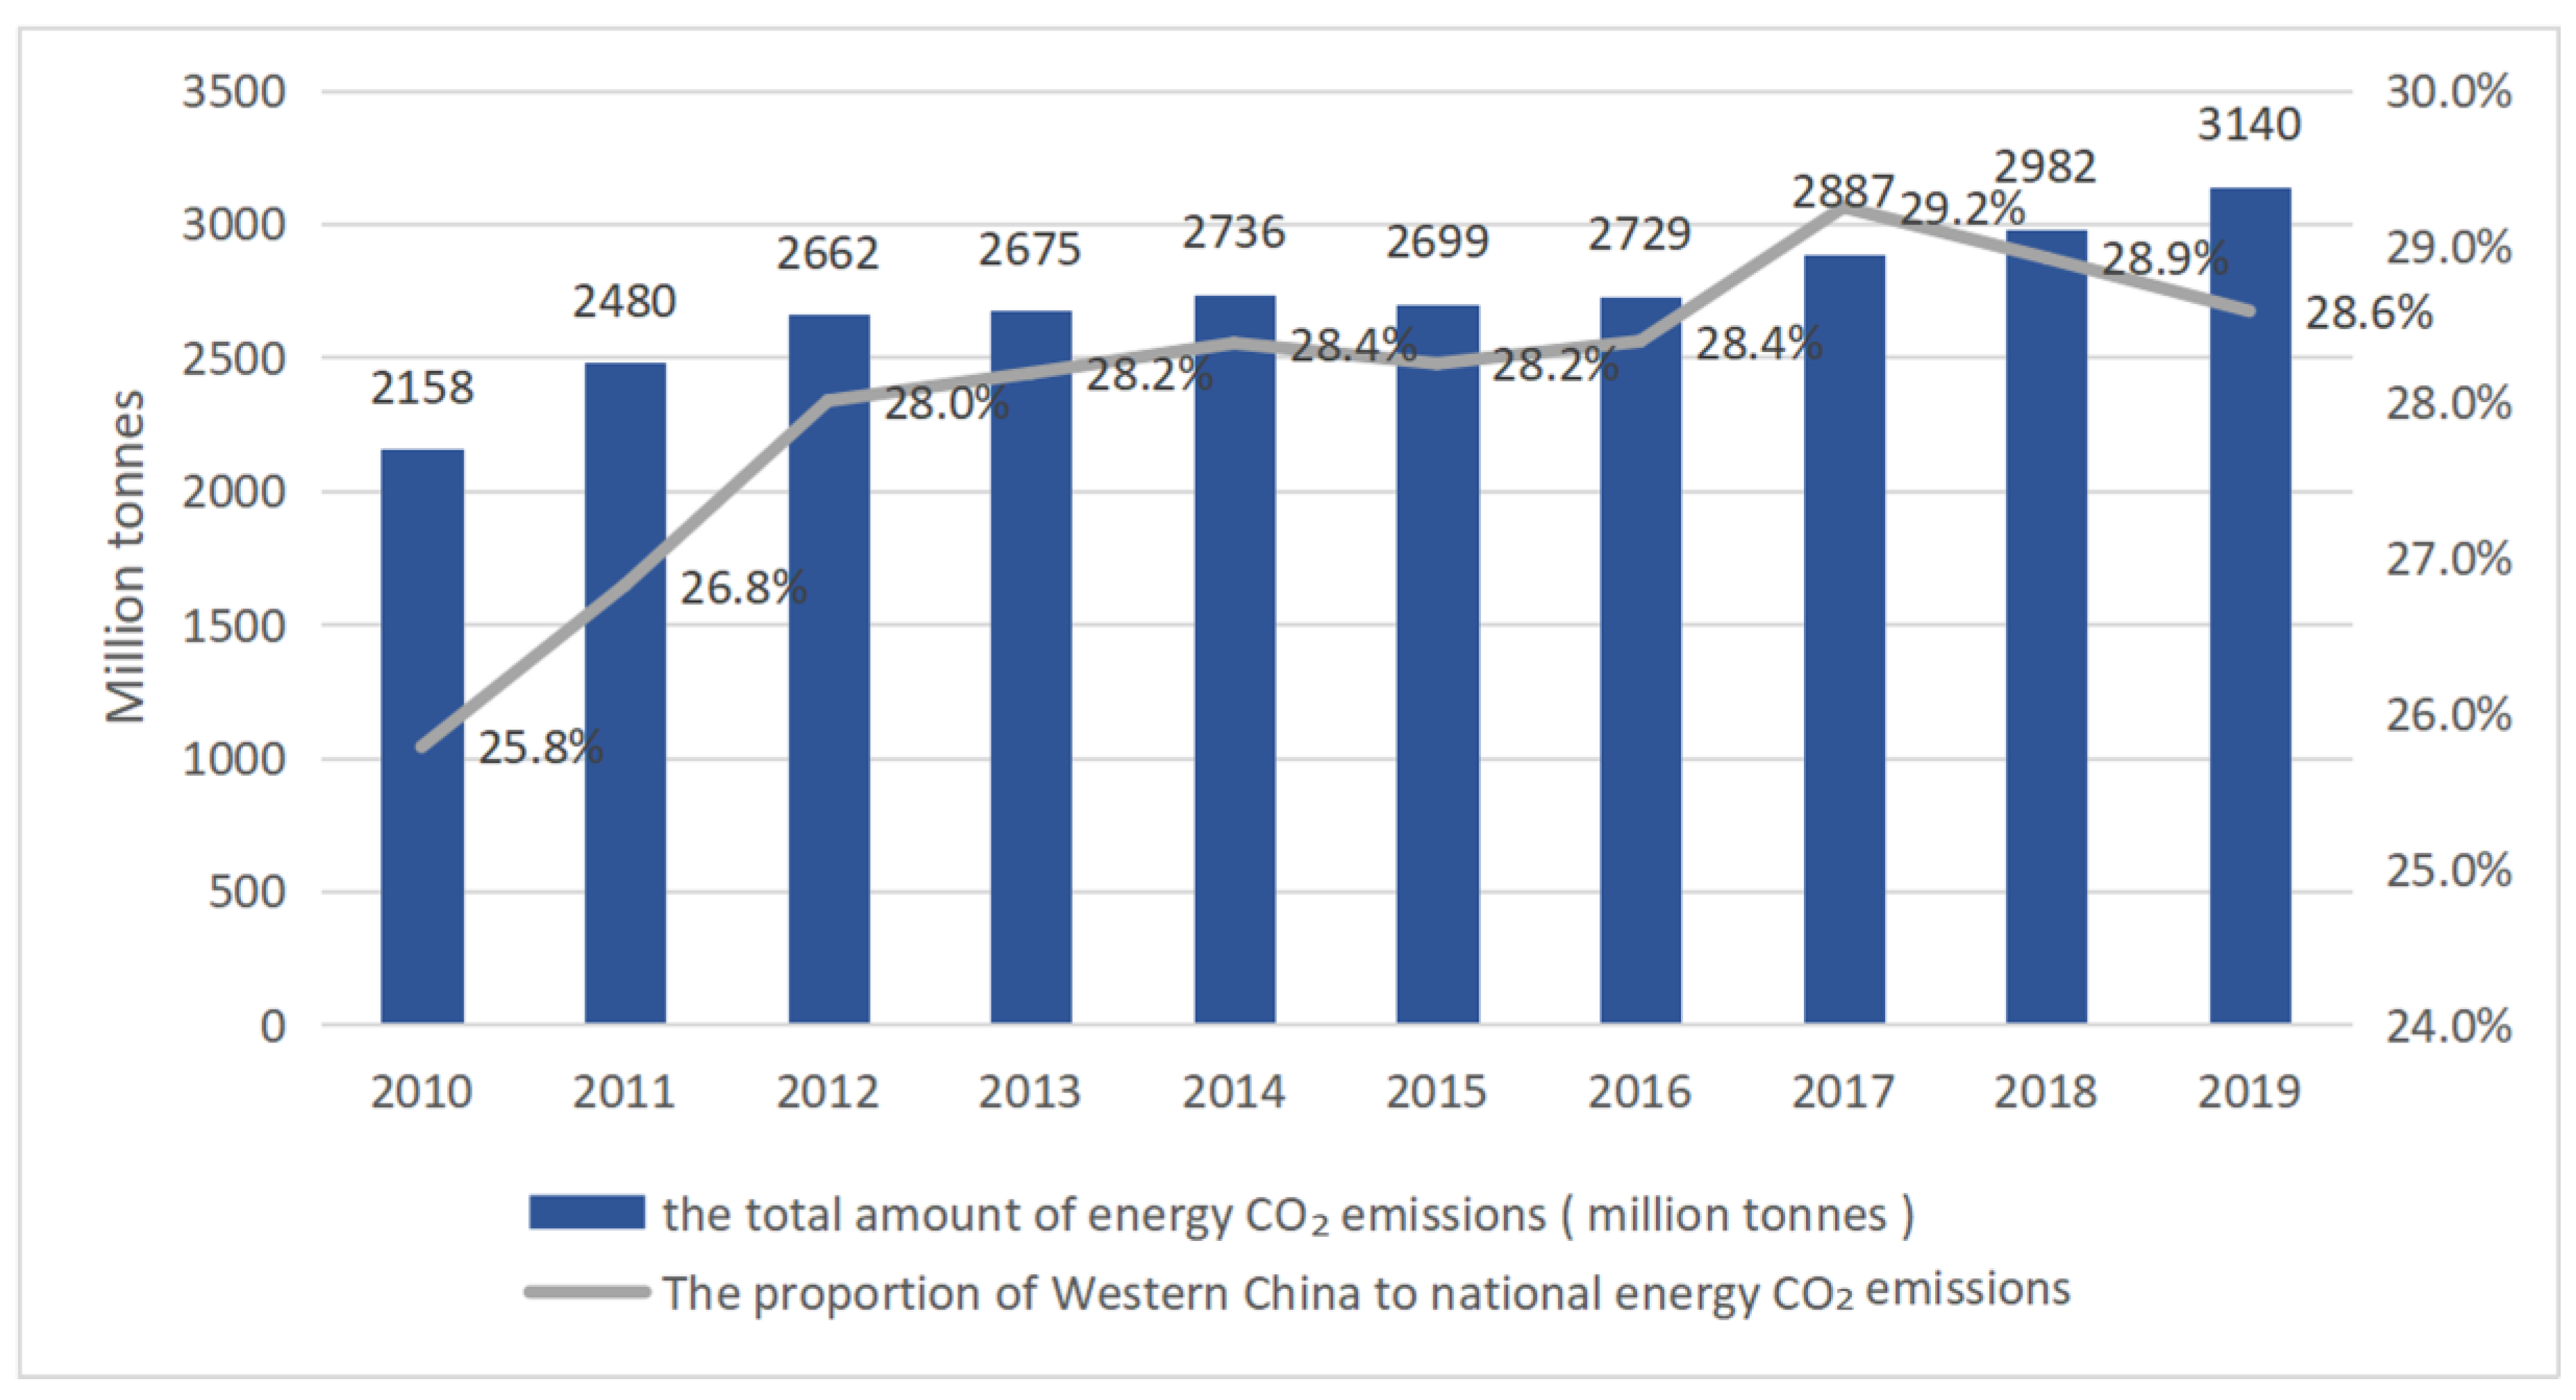
2 emissions. According to the data from China Emission Accounts and Datasets, the CO2 emissions in Western China amounted to 2158 million tonnes in 2010 and 3140 million tonnes in 2019, and its proportion in the entire country increased from 25.8% in 2010 to 28.6% in 2019 (Figure 1) [
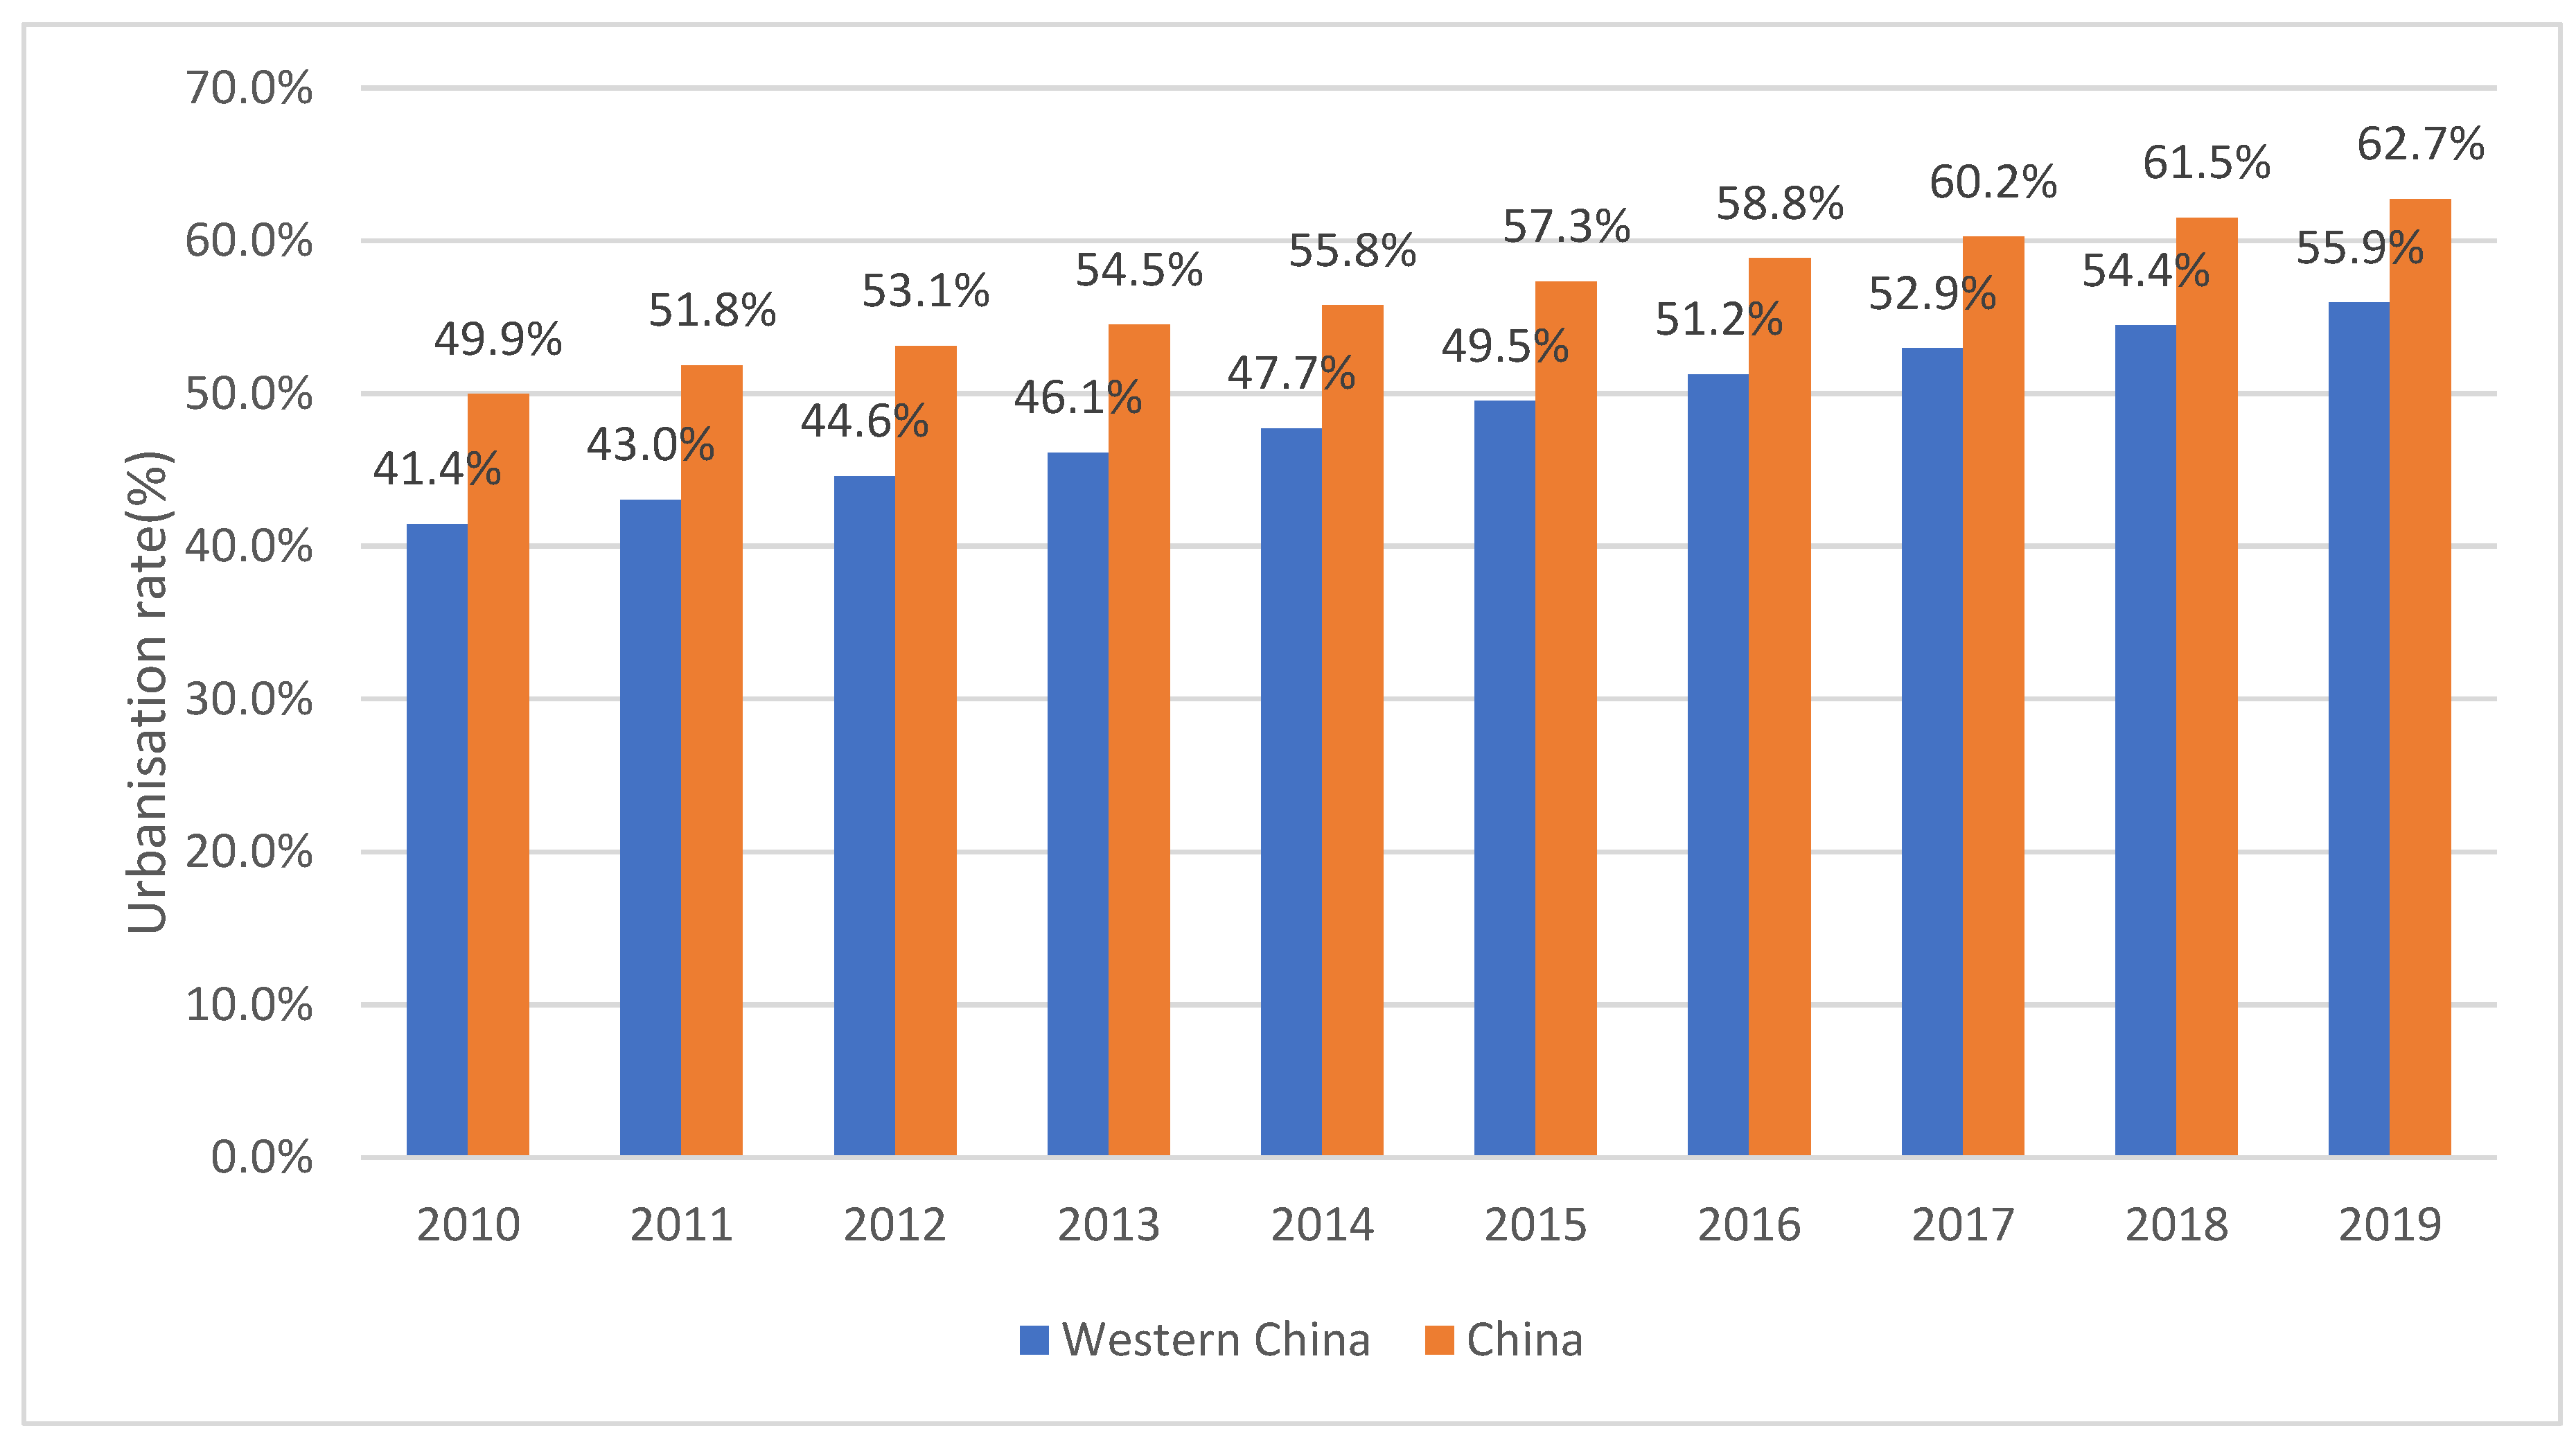
3]. However, the urbanisation rate of Western China is still lower than the national level and has much room for growth (Figure 2) [4]. Therefore, the urbanisation of Western China will keep developing at a relatively rapid rate for a long period in the future. The Silk Road Project will introduce more industries into Western China, potentially increasing energy resource and CO2 emissions challenges. In 2020, China first proposed it would strive to reach the peak of CO2 emissions by 2030 and achieve carbon neutrality by 2060; therefore, CO2 emissions in Western China will inevitably increase with advances in urbanisation and industrialisation, and the region faces great pressure to reduce CO2 emissions. Currently, Western China’s economy is stepping into the “new normal” phase, and traditional linear industrial practice, characterised by high capital investments, massive resource consumption, and severe pollution discharge, may no longer be able to adapt to the regional situation. Therefore, choosing a low-carbon developmental pattern has become the trend for regional economic development.
Carbon emission efficiency (CEE) is an important indicator to measure environmental quality and the progress of carbon neutrality goals [5,6], which pursues producing more output with fewer CO2 emissions and resource consumption. Researchers have examined the relationships between urbanisation and CEE in countries or regions, resulting in mixed conclusions. Among these, there are two main viewpoints. One believes that urbanisation has linear impacts on CEE, while the other argues that the impacts are nonlinear. Although the researchers have studied the relationships between urbanisation and CEE in depth, it is worth further studying those regions with rapid growth in both CO2 emissions and urban population. In-depth and comprehensive research, particularly in the field of the impacts of urbanisation on CEE in Western China, is needed, which would be one small step toward the global sustainable development of society and the environment.
To fill the gap in previous studies, this paper focused on measuring CEE by utilising a super-efficiency epsilon-based measure (super-EBM) on the basis of the panel data of 11 provinces in Western China from 2010 to 2019. It then investigated the spatial and temporal distribution and variation characteristics of CEE in Western China. Lastly, the effects of urbanisation on CEE were investigated using an econometric approach. The main contribution and innovation points of this research are as follows: (1) It uses a sample of Western China for the empirical study of the impacts of urbanisation on CEE, which is not addressed in the literature on this topic. (2) This research makes the theoretical analysis of the impact mechanism of urbanisation on CEE, and then brings forward two hypotheses: (i) urbanisation has a significant influence on the CEE in Western China, and (ii) there may exist an EKC relationship between urbanisation and CEE in Western China. (3) It explores the mechanism through which urbanisation impacts CEE in Western China by empirical testing of these two hypotheses, with great hopes of overcoming the regional environmental constraints on urbanisation development and enhancing regional sustainable development.
The article is composed of the following sections: Section 2 is a literature review, and Section 3 contains the data and methodologies. Section 4 presents the characteristics of CEE in Western China. Section 5 does the empirical analysis of the influence of urbanisation on CEE in Western China, and Section 6 presents the research results, provides suggestions for policymakers, and points out future research prospects.

2. Literature Review

Scholars have roughly classified CEE into two categories: single- and total-factor indicators. The single-factor method mainly uses indicators, such as CO2 emissions per unit of GDP, CO2 emissions per unit of energy consumption, per-capita CO2 emissions, and other single indicators, to measure CEE [7,8]. The single-factor CEE only reflects the relationship between a certain factor and CO2 emissions, without reflecting the multi-dimensional characteristics of a regional system of CO2 emissions. Thus, it cannot completely comprise economic, social, energy, and environmental factors [9,10]. The total factor CEE takes into account the production factors in the process of economic production, which are defined as the maximum economic output and minimum CO2 emissions under constant multi-factor inputs, such as capital, labour, and energy [11]. Common approaches applied to calculate the efficiency of total factor carbon emissions are stochastic frontier analysis (SFA) and data envelopment analysis (DEA). SFA is a parametric method, which requires the determination of the production function form and has been applied to measure CEE by some scholars [12,13,14,15,16]. However, SFA cannot solve the problem of collinearity between variables and requires the establishment of a specific production function, which may have practical limitations [17,18]. Data envelopment analysis (DEA), first proposed by Charnes et al. [19], is a non-parametric method and suitable for the comprehensive evaluation model with various inputs and outputs. DEA is a relatively objective and accurate method from a total factor perspective for calculating CEE. DEA methods have been widely used to calculate CEE [17,20,21].
Many researchers are also exploring the contradiction between urbanisation and CO2 emissions. Theoretically, the rapid urbanisation process may produce large-scale energy consumption, resource development, and urban construction, bringing more intense and long-lasting ecological environmental effects [22]. Therefore, some researchers agreed that urbanisation can impact CO2 emissions positively; for example, Tan et al. [23] found that the different urbanisation rates have promotion effects to different extents on CO2 emissions based on the provincial panel data in China from 2003 to 2015. Ali et al. [24] and Wang et al. [25] also believed that urbanisation enhances CO2 emissions. On the other hand, urbanisation can inhibit CO2 emissions by the agglomeration effect of talent, technology, information, funding, industry, and other elements related to innovation, thus promoting economic prosperity and technological progress. Therefore, some researchers believe that urbanisation can inhibit CO2 emissions. Xu et al. [26] found that urbanisation in most Chinese cities reaches a level conducive to CO2 reduction based on the data of 268 Chinese cities from 2006 to 2008. With further research, some researchers found the impacts of urbanisation on CO2 emissions have different characteristics in different areas or historical periods, and the impacts of urbanisation on CO2 emissions may have nonlinear characteristics. Some researchers have confirmed that there is a U-shaped relationship between urbanisation and CO2 emissions. Zhang et al. [27] agree that there is an inverted “U-shaped” relationship between new-type urbanisation and CO2 emissions in the central heating sector in Chinese cities from 2012 to 2019. Utilising Chinese provincial panel data, Chen et al. [28] suggested that the inverted U-shaped relationship exists between new urbanisation and CO2 emissions. However, some scholars have put forward the opposite views, too; Shahbaz et al. [29] found that the relationship between urbanisation and CO2 emissions is U-shaped, i.e., urbanisation initially reduces CO2 emissions, but after a threshold level, it increases CO2 emissions. Martínez-Zarzoso et al. [30] analysed the impact of urbanisation on CO2 emissions in developing countries from 1975 to 2003, and their study showed an inverted-U-shaped relationship between urbanisation and CO2 emissions. He et al. [31] believed that there was an inverted-U relationship between urbanisation and CO2 emission in the major regions of China.
With the emergence and development of SFA and DEA methods, the impacts of urbanisation on CEE have been studied by researchers, and some of them indicate that urbanisation can impact CEE either negatively or positively, for example, with panel data from 283 cities in China from 2006 to 2019, Chen et al. [32] considered that the new-type urbanisation (NTU) significantly promoted the improvement of urban carbon emissions efficiency (UCEE), and the UCEE improved strongly during the later stage of NTU construction. However, some of them have confirmed that urbanisation and CEE are nonlinear and have a U-shaped relationship [33]; for example, Zhang et al. [34] found that the impact of industrialisation and urbanisation on CEE follows a U-shaped based on the panel data of China’s Yangtze River Economic Belt (YEB) from 2008 to 2017. Li et al. [35] and Zhao et al. [36] also believed that there is a U-curve relation between CEE and urbanisation.
In general, the researchers have conducted in-depth research on the relationships between urbanisation and CEE in depth in many countries or regions, and have obtained abundant research results. However, there is a lack of systematic study in Western China, which has the characteristics of rapid growth in both CO2 emissions and urban population among the current literature. Based on this, this paper attempts to use a sample of Western China for the empirical study of the impacts of urbanisation on CEE; the results will help policymakers in developing appropriate economic, energy, and environmental policies for Western China.

3. Materials and Methodology

3.1. Research Area

Western China is an important hub in the Belt and Road. It is rich in natural resources, accounting for 71.4% of the nation’s land area, 27.1% of the country’s population, and 21.2% of the country’s GDP in 2021 [4]. This paper chose 11 Western China provinces as its research object, adopting the Super-EBM DEA model with undesirable outputs to measure the carbon emissions efficiency (CEE) of the Western China provinces during the period from 2010 to 2019 (due to the difficulty of data obtainability, Tibet was not included in the analysis). Figure 3 shows the study region.
The Western development strategy was first introduced by the Chinese government in 2001 to boost the development of China’s western region and narrow the economic gap between the western and the eastern parts of China. Abundant energy and mineral reserves and high exploitation serve as essential foundations for the decarbonisation transition of Western China. Chongqing, Guizhou, Sichuan, and Yunnan are located in southwest China, and these provinces are an essential base for developing China’s non-ferrous metal industry and strategic reserves. Shaanxi, Gansu, Qinghai, Ningxia, and Xinjiang are located in northwest China; they are remote, harsh, and sparsely populated, whereas they are rich in energy resources. Inner Mongolia is located in the north of China and is abundant in energy minerals, such as coal, rare earth, tinstone, and germanite. Guangxi is located in south China, which is a main ore-forming zone for Bauxite, manganese ore, tin ore, and non-ferrous metal. In all, Western China is rich in fossil energy and mineral resources, with its economic development basically relying on energy-intensive and resource-intensive industries. Thus, it is a fast-growing region with increasing CO2 emissions in China.

3.2. Variable Description

3.2.1. Explained Variables

The paper takes 11 provinces as research objects in Western China. Using a perspective of total factor CEE and taking into account certain studies [37,38], capital stock, energy, and labour are selected as input indicators, Gross domestic product (GDP) as the expected output indicator, and CO2 emissions as the undesirable output indicator. Table 1 shows the definitions for input–output indicators.
(1) Capital stock (CS). In this paper, the perpetual inventory method is applied to calculate the capital stock, and the calculation formula is Kt = Kt−1(1 − D) + I, where K stands for the capital stock, t is the year, D denotes the depreciation rate capital stock, which is 9.6% in this study [39], and I stands for fixed capital investment. The capital stock in 2010 is expressed by dividing the total fixed capital investment by 10% in 2010 [39]. To avoid inflationary distortion, this paper converted each province’s GDP into its constant price in 2010. The data on fixed capital investment were collected from NBSC [4];
(2) Energy (E). Energy is the fundamental input factor in production activities, which provides the necessary power source to carry out production activities. Energy data were collected from the China Energy Statistical Yearbook (2011–2020);
(3) Labour (L). The number of unit employees of 11 provinces is used as labour input. The data came from the China Statistical Yearbook (2011–2020);
(4) Desirable output (DO). Regional real GDP is used as desirable output, which is also converted into the constant price in 2010 to lessen the impact of inflation. The data were collected from NBSC [4];
(5) Undesirable output (UO). CO2 emission data came from China Emission Accounts and Datasets (https://www.ceads.net/, accessed on 31 May 2023).

3.2.2. Core Explanatory Variable

(1) Urbanisation level (U): The proportion of the urban resident population to the total population is widely applied to measure urbanisation levels. For the purpose of verifying the nonlinear effect of urbanisation on CEE, its quadratic term would be tested. The data are collected from the National Bureau of Statistics of China (NBSC) [4].
(2) Theoretical mechanism: Urbanisation has a negative impact on CEE. Theoretically, there are four main reasons for this negative relationship. (1) Urbanisation may result in labour transferring from agriculture to non-agricultural industries, especially the manufacturing industry, which is not only the pillar industry for the creation of wealth but also the largest consumption of limited resources and the source of environmental pollution. (2) The large quantity of migrant peasants swarming into cities affects architecture and real estate, with a significant strain on resources and energy. (3) Urbanisation is not only a process affecting the change in the mode of production from agriculture to industry but also affects the transformation of lifestyle from rural to urban, which eventually brings increases in the demand for energy-intensive products, including appliances and cars, and a substantial increase in energy consumption per capita, which causes further CO2 emissions [40,41]. (4) With the city scale expanding, urban construction and transportation land would require more high energy consumption and high CO2 emissions products, especially cement and steel [42]. Another significant result of enlarging the city scale is that the distance for urban transportation becomes longer, which generates even further CO2 emissions. Overall, the misplacement of urban functions and urbanisation’s environmental destruction may result in increasing CO2 emissions and inhibiting CEE.
According to the Environment Kuznets Curve, environmental pollution has an inverse U-shaped relationship with economic growth in the early stages, but the pollution decreases once the development of the economy reaches a certain threshold [43]. Some scholars have analysed the impact of urbanisation on CEE in developing countries and found a U-shaped relationship between urbanisation and CEE. Theoretically, there are four main reasons for this U-shaped relationship. First, urbanisation can promote the accumulation of management experience, information, financing, talents, technology, and other production factors, which can promote the advance of technology and the conservation of energy; secondly, the population agglomeration could share many public resources and realise the rational allocation of public resources more effectively and maximally [44], which in turn can decrease CO2 emissions intensity; thirdly, along with the development of urbanisation quality and people quality of life enhancement, people increasingly pay attention to environmental quality and also set higher environmental protection demands [45], which forces the government to optimise the city’s industrial structure, take corresponding measures to control the proportion of manufacturing industries emitting serious pollution, and encourage the development of high-tech industries and other less-polluting tertiary industries, which in turn will improve CEE in the production process; and fourthly, in terms of transportation, the increase in population density creates a dense, compact city, thereby shortening the transportation distance to a certain extent and thus reducing dependence on automobiles [46,47]. Overall, therefore, urbanisation can have a positive effect on CEE once its development reaches a certain threshold.
Based on the above theoretical analysis, the authors put forward the following hypotheses:
Hypothesis 1.
Urbanisation has a significant influence on the CEE in Western China.
Hypothesis 2.
There may exist an EKC relationship between urbanisation and CEE in Western China.

3.2.3. Control Variables

The influences of some important factors are controlled to obtain more accurate estimate results [48]. Industrial structure (IS), technical progress level (TPL), foreign trade dependence (FTD), foreign direct investment (FDI), and educational development level (EDL) were selected as control variables. The definition of all variables is found in Table 2. The data were obtained from NBSC [4] and the China commerce yearbook (2011–2020).
(1) Industrial structure (IS). Theoretically, a higher proportion of secondary industries will produce more CO2 emissions. Secondary industries, in particular heavy industries like the iron, steel, chemical, and petrochemical industries, are the primary contributors to CO2 emissions. Based on the work of Zhang and Xu [49], Zhang et al. [50], Dong et al. [51], and Chu et al. [52], this paper adopted the proportion of the secondary industry to GDP as the measurement indicator of the industrial structure, expecting that the industrial structure was negatively correlated with CEE.
(2) Technical progress level (TPL). Technical progress will improve the efficiency of resource consumption and eliminate the backward production capacity; the development and application of new energy technology can reduce CO2 emissions and improve CEE [53]. Considering data availability and the existing studies of Zhang et al. [54] and Zhang et al. [55], this indicator was calculated using the patent application granted per 100,000 people, and we expected that the technical progress level would be positively correlated with CEE.
(3) Foreign trade dependence (FTD). There may be a dual effect of foreign trade on CEE. On the one hand, foreign trade can enhance CEE by introducing foreign advanced technology and by promoting economic prosperity and technological progress [56]. On the other hand, trade can expand the scale of production, thereby affecting CO2 emissions [57]. In addition, an increase in foreign trade will consume more resources and energy, lowering the CEE. Based on studies by Du et al. [57], Gong et al. [58], and Wang et al. [59], this indicator was measured by the ratio of trade to GDP.
(4) Foreign direct investment (FDI). FDI has a two-fold influence on CEE. On the one hand, the pollution haven hypothesis theory contends that FDI will cause more CO2 in host countries with weak environmental regulations, resulting in a greater burden on CO2 emissions. On the other hand, by transferring advanced technologies to host countries, FDI has the potential to increase productivity and upgrade industries [60]. In reference to existing studies of Wei and Wang [61] and Fu et al. [62], FDI was selected as an important control variable, and its effect on CEE was also ambiguous.
(5) Educational development level (EDL). A higher-quality labour force often provides the knowledge to promote energy-saving technology. Based on the study by Zhuo and Deng [48], Lin et al. [63], and Liang et al. [64], this paper adopted the average schooling year as the measurement indicator of the educational development level, and expected that the educational development level would be positively correlated with CEE.
Table 3 shows the descriptive statistics of the main variables. As shown in Table 3, the average CEE is only 0.84, and the maximum value is 1.075, whereas the minimum value is only 0.533, indicating a large difference in CEE among provinces. Similarly, there are large differences in other variables among provinces.

3.3. Methodology

3.3.1. The Super-Efficiency Epsilon-Based Measure (EBM) Model with Undesirable Outputs

Traditional DEA methods, such as radial models and non-radial models, have their own advantages and deficiencies. The radial models (CCR and BCC models) did not consider the slacks, while the non-radial model (SBM model) ignored radial characteristics of the same proportion. The EBM model is one of the methods of DEA, which integrates both radial and non-radial features in a unified framework and avoids efficiency under- or overestimation [65,66,67,68,69]. The super-efficient EBM model with undesirable outputs is an improvement on the ordinary EBM model, which incorporates undesirable output variables and Andersen’s super-efficiency DEA model. Based on the assumption of non-oriented and constant returns-to-scale, the super-EBM model with undesirable outputs can be represented as follows [70,71]:
μ = min ( κ - ε x i = 1 m ω i s i xik β + ε y r = 1 q ω r + s r + yrk + ε b t = 1 p ω t b s t b b tk ) s . t { j = 1 , i k n x ij λ j + s i = κ x ik i = 1 , 2 , , m j = 1 , j k n y rj λ j s r g = β y rk r = 1 , 2 , , q j = 1 , j k n b tj λ j + s p b λ = β b tk t = 1 , 2 , , p λ 0 , s 0 , s + 0 , s b 0
μ* is the efficiency value as measured by the super-EBM model with undesirable outputs; n, m, q, and p represent the number of DMUs, inputs, desirable outputs, and undesirable outputs, respectively; x, y, and b stand for the inputs, desirable outputs, and undesirable outputs; λj denotes the linear combination coefficient; k represents the planning parameter of the radial part; sr+ and sp are slack variables of the desirable and undesirable output; and wi, wr+, and wtb− stand for the weights of the input, desirable output, and undesirable output. ε y and ε b  represents the parameters that can combine the radial and non-radial slack.

3.3.2. Tobit

The super-EBM model with undesirable outputs loosens the limit of efficiency scores to less than 1, but the scores are still censored since the efficiency scores are all greater than 0. The ordinary least squares (OLS) method may produce biased and inconsistent results in parametric estimations when the dependent variable is censored. The Tobit model can solve this problem by the maximum likelihood estimation (MLE) [72,73,74]. The Tobit model can be expressed as follows:
Y = β Xi + ui Yi = { Y i if Y i > 0 0 if Y i 0
In Equation (2), the subscript i indicates the ith DMU, and the subscript t denotes the year. Y represents the actual variable, Y* stands for the restricted dependent variable, and X is the independent variable. β shows estimative factors, and ui shows the error with the distribution of N (0, σ2).

4. Calculation Results of CEE

The panel data of 11 Western provinces from 2010 to 2019 are estimated by the super-efficiency EBM model, and the measurement results are shown in Table 4. The average value of CEE in 11 provinces from 2010 to 2019 was determined to be 0.840, and the average efficiency of each province fluctuates between 0.725 and 0.931, showing that Western China has yet to reach the production frontier and that regional developments have significant potential for emission reduction. The CEE shows a significant provincial difference. The trend of the average CEE is displayed in Figure 4 in terms of the temporal dimension. In general, the CEE of 11 western provinces went through two stages of declining and then increasing over those 10 years, demonstrating U-shaped change characteristics. The average efficiency fell from 0.931 in 2010 to 0.725 in 2017, which is the changing decrease stage (2010–2017). The second phase, gradual growth (2018–2019), saw an increase in average efficiency from 0.725 in 2017 to 0.811 in 2019. During the second period, the implementation of the new industrialisation strategy, the improvement of industrial technology levels, and the transformation and upgrading of industrial structures all played a role in promoting CEE [75]. From the provincial perspective of time series, the CEE of Guangxi has the most significant decrease, and it decreased from 1.002 in 2010 to 0.713 in 2019. As for Chongqing, its CEE showed present of a small fluctuation, which was between 1.034 and 1.075. Among the 11 western provinces, only the CEE of Guizhou has the characteristic that first it rises, then descends, and then rises again. The CEEs of Mongolia and Yunnan have been in the production frontier surface from 2010 to 2015 and present the trend of first declining and then increasing after 2015. In the other six provinces (Sichuan, Shaanxi, Gansu, Qinghai, Ningxia, and Xinjiang), the CEEs present a trend of first declining and then increasing.
The CEE of the 11 western provinces was visualised using ArcGIS 10.6 software, which shows a significant provincial difference (Figure 5). To further analyse the regional variations in CEE, the 11 Western provinces are split into three groups based on the CEE level, from the highest to lowest. Four provinces—Chongqing, Sichuan, Inner Mongolia, and Yunnan—are included in the first tier of high-level provinces; Chongqing has the highest efficiency, with a value of 1.049, and surpasses the production frontier 1. This illustrates that Chongqing is far ahead of other western provinces in economic development and technological level, promoting regional economic low-carbon development. The second tier includes Shaanxi, Xinjiang, Guangxi, and Guizhou, with an intermediate level of CEE. The remaining three provinces (Gansu, Ningxia, and Qinghai) have a lower level of CEE than other provinces located in Western China. This may be due to their relatively backward economic development level, production technology, and limited capital investment [76], resulting in low CEE levels.

5. Regression Analysis

5.1. Unit Root and Cointegration Tests

Using Eviews 10.0 software, all variables were subjected to stationarity tests, and the results are presented in Table 5. According to the results of the unit root tests, all variables (except DEL) did not pass the stationary test (p < 0.05), and thus we performed first-order differences on all variables. In the first-order difference sequences, the p values of UL*2 passed the significance tests at the Levin, Lin, and Chu (LLC) test, but failed to pass the significance tests of Im, Pesaran, and Shin (IPS), Augmented Dickey–Fuller-Fisher (ADF), and Phillips and Perron-Fisher (PPF). As for the other variables, all passed the significance tests, indicating the variables that need to be tested for the second-order difference sequences. As shown in Table 5, all sequences passed the stationarity test at the 1% significance level at the second-order difference sequences; therefore, the null hypothesis of a non-existent unit root after the second-order difference can be rejected for each sequence. In other words, there may be stationary sequences.
A Kao test is applied in this paper to test whether there is a long-term equilibrium relationship between dependent variables and independent variables. As shown in Table 6, the t-statistic value passes the test of significance, indicating that dependent and independent variables maintain a long-term cointegration relationship during the study period.

5.2. Tobit Model Construction

After the tests of unit root and cointegration, we apply the Stata 15.0 software to conduct a Tobit regression analysis. The structural equation is as follows:
CEEi,t = β1ULi,t + β2(UL)2i,t + β3ISi,t4TPLi,t + β5FDIi,t6FTDi,t + β7DELi,tεi,t
In Equation (3), UL, (UL)2, IS, TPL, FDI, TFD, and DEL refer to the urbanisation level, the square value of the urbanisation level, industrial structure, technical progress level, foreign trade dependence, foreign direct investment, and educational development level, respectively. The test results of the Tobit model are shown in Table 7.

5.3. Results Discussion

As shown in Table 7, the regression coefficients of the urbanisation level and the (urbanisation level)2 are −6.08 and 5.294, respectively, and pass the 1% significance test, verifying that urbanisation has a significant influence on CEE in Western China (Hypothesis 1) and its impacts are negative. It also verifies the existence of a “U-shaped” EKC between urbanisation and CEE in Western China (Hypothesis 2). These findings are consistent with Zhang et al. [34], Li et al. [35], and Zhao et al. [36]. During the studied period, the regional urbanisation rate increased from 41.4% in 2010 to 55.9% in 2019, which is at the rapid urbanisation stage; however, the accumulation of funding, technology, and other production factors in Western China is weak due to the geographical location and climate environment, and regional urbanisation inevitably takes an extensive development mode featuring high consumption and high emissions in this stage. Therefore, the impact of urbanisation on CEE is negative in the present stage, although these impacts will not last forever. In keeping with the above theoretical analysis, urbanisation accelerates specialisation and industrial agglomeration, providing labour and capital and enhancing regional productivity. Continuing advances in urbanisation ultimately promote technological innovation and industrial upgrading, thereby fundamentally suppressing serious pollution and improving CEE. It is imperative to quickly shift the impact of urbanisation on CEE to the right side of the U-shaped curve by following the path of high-quality urbanisation. In fact, China’s government has stepped up its efforts to improve the urbanisation quality and upgrade the industrial level of its western region since 2010, and it can be expected that further policies of both high-quality urbanisation and industrial upgrading will be proposed and implemented in the future, which in turn will promote the arrival of the turning point at which the impact of urbanisation on CEE will transform into a positive correlation.
It is worth discussing that this result is contrary to findings from Sun et al. [33]. Sun et al. pointed out the inverted U-shaped relationship between urbanisation and CEE. The divergence may be due to the differences in the indicator system and methods of CEE, and the research region from Sun et al. [33]. In the study by Sun et al. [33]., the calculation method of CEE is SFA, and the input indicators do not include energy consumption. Moreover, Sun et al. [33] studied the whole country, while this paper focuses on its western region. The national urbanisation rate increased from 49.9% in 2010 to 62.7% in 2019, which is more than that of its western region during the same period. Combined with the industrial development stages of Western China, these results are also in line with the EKC hypothesis.
As for the control variables, foreign trade dependence, foreign direct investment, and educational development level all show a significantly positive effect on CEE. The estimated coefficients of industrial structure are negative, while that of technical progress level is positive, but all failed the significance test.
(1) Foreign trade dependence has significantly promoted CEE. In order to seize the international market share, many enterprises in Western China have made efforts to enhance the environmental standards of products, which contributes to improving CEE. The provinces of Western China should carry out a series of policies to accelerate trade in environmentally friendly products and services to promote green production and consumption [77].
(2) Foreign direct investment positively affects CEE (p > 0.01), which means that the pollution haven hypothesis (PHH) does not apply to Western China. Since 2013, China has strengthened its environmental pollution controls and restricted the introduction from abroad of industries with huge energy consumption and high pollution emissions. It is noteworthy that the regression coefficient value of foreign direct investment was highest (11.403***), meaning that foreign direct investment played a strong role in promoting CEE, and the local governments also flexibly formulated the foreign investment policies that are suitable for the local actual, so as to exert the promoting effect of foreign direct investment on CEE.
(3) Educational development level also has an apparent influence on CEE. Since always, the development of education has been given priority in many provinces in the western regions of China. The total government expenditure on education in all provinces in Western China increased from RMB 328 billion in 2010 to 918 billion in 2019. However, the proportion of government expenditure on education to GDP has shown a downward trend since 2012, decreasing to 4.48% in 2019 from 5.25% in 2012, which means that Western China must invest more money in education.
(4) The estimated coefficients of industrial structure are negative but not apparent. The reason might be that many provinces in Western China are pushing the transformation of the economic development model and striving to upgrade the manufacturing industry, which controls and reduces the CO2 emissions from the second industry, which in turn weakens its negative effect. Western China needs to take advantage of its rich resources and struggle to develop high-end manufacturing, advanced materials, renewable energy, and other strategic emerging industries, and improve the ability to deeply process the resources to promote the high-quality development of the industrial sector.
(5) Technical progress level positively affects CEE but does not pass the significance test. This may be because the reductions of emissions due to technical progress, such as the promotion and use of new energy and the improvement of energy efficiency, are affected by the rebound effect. A combination of technological progress and supporting policies is crucial to weakening the impact of the rebound effect.

6. Conclusions

To achieve its targets of peak carbon emissions by 2030 and carbon neutrality by 2060, it is necessary to focus on Western China, which is the region with rapid growth in both urbanisation and CO2 emissions in China. A reasonable emission reduction plan should not only focus on the amount and intensity of CO2 emissions but also focus on efficiency. This study measured the CEE of Western China based on the super-EBM and with undesirable outputs. The impacts of urbanisation on CEE in Western China were investigated using the Tobit model. The corresponding study results are summarised as follows: firstly, the CEE of 11 western provinces went through two stages of declining and then increasing over the 10 study years, demonstrating U-shaped change characteristics. Secondly, Chongqing, Sichuan, Inner Mongolia, and Yunnan had a high level of CEE, followed by Shaanxi, Xinjiang, Guangxi, and Guizhou, with an intermediate level of CEE. Gansu, Ningxia, and Qinghai have the lowest level of CEE, which shows that out of the eleven provinces, only four provinces have a relatively high CEE, although it could be improved by implementing a set of corrections. However, the other seven provinces have a low CEE performance, and they must improve in the coming years. Thirdly, the effects of urbanisation on CEE in Western China present a U-shaped relationship, meaning that the influence of urbanisation on CEE had a trend of initial inhibition and then stimulation. At present, the urbanisation process shows negative impacts on CEE, while the tipping point has not yet arrived. Lastly, foreign trade dependence, foreign direct investment, and educational development level have significant positive influences on CEE. The regression coefficient of technical progress level is positive, and that of industrial structure is negative but has an influence on CEE; however, that did not pass the significance test.
In order to improve CEE, this paper proposes several relevant policy suggestions based on the results of the empirical study: (1) The government should consider high-quality urbanisation, which includes resource-saving and environmentally friendly development. During the urbanisation process, more attention should be directed to promoting industrial structure upgrades and supporting the development of the environmental industry and the recycling economy. Urban land use planning should strictly protect ecological land, avoid inefficient and scattered expansion of construction land, and minimise environmental impacts. (2) Western China should combine its own conditions to push its economy towards high-quality development. It is essential for Western China to optimise its industrial structure and transform the region’s resource advantages into industrial advantages. In addition, the government should provide policy support for high-tech and low-polluting industries in their shift from east to west. (3) It is advisable to increase the environmental standards of foreign trade, and optimal fiscal policies to support the export trade of f environmentally friendly products. In the meantime, the provinces of Western China should continue to utilise foreign capital and optimise the mix of foreign investment. Through the introduction of environmental protection for foreign capital, the government should consciously guide investment flow to the high-tech industry and services. (4) Western China should make a plan for the development of the new-energy industry, and quicken the pace to develop renewable energy sources (solar, wind, biomass, and hydro) [78]; financial support, revenue decrease, and financial allowance, and other incentives measures should be implemented to promote the investment of renewable energy infrastructure. (5) Furthermore, a talent policy should be established by governments in Western China to attract more qualified workers. It should set aside funds to be awarded to inspire technological innovation, talent introduction policies should be boldly innovated, and a flexible talent policy should be established to attract high-quality talent to Western China in order to effectively promote industrial structure upgrading and urbanisation quality in the country’s western regions. (6) The provinces of Western China actively encourage the development of sectors with high energy efficiency and environmental protection in the secondary and tertiary industries, while making the energy-saving reconstruction of the manufacturing industries with low energy efficiency and high emissions.
This paper also had the following limitations, and the future can be expanded from the following aspects: (1) Due to the limitations of data, this paper only explored the effects of urbanisation on CEE from the inter-provincial panel data, while the impact of urbanisation on CEE at the municipal level is still unknown. Therefore, future research should explore the effect urbanisation has on CEE from the municipal level, which can make up for the shortcomings of existing research. (2) In this paper, we focused on the population urbanisation rate. Other aspects, such as land and economic urbanisation rates, could also provide valuable insights into measuring urbanisation levels in future research. (3) The ecological potential and load are very complex systems; further discussions on the impacts of rapid urbanisation on the two systems in Western China are needed. (4) Rapid changes in rural society due to urbanisation can inevitably lead to the deterioration of both physical and cultural heritage. There is an urgent need for future research to explore the balance between heritage protection and urbanisation in the provinces of Western China.

Author Contributions

L.Y.: conceptualisation, methodology, software, validation, formal analysis, writing—original draft preparation, writing—review and editing. Z.L.: investigation, resources, data curation, writing—original draft preparation, writing—review. W.Y.: funding acquisition, writing—original draft, and data curation. H.Z.: conceptualisation, methodology, software, validation, formal analysis. H.Z.: writing—original draft preparation, writing—review and editing, supervision, and funding acquisition. L.Z.: conceptualisation, methodology, software, validation, investigation, resources, data curation, writing—original draft preparation, writing—review and editing, project administration. Z.Z.: resources, data curation, and writing—review and editing. All authors have read and agreed to the published version of the manuscript.

Funding

This work was financially supported by the National Key R&D Program of China (No. 2019YFC1803900) and the National Nature Science Foundation of China (No. 42107402).

Institutional Review Board Statement

Not applicable.

Informed Consent Statement

Not applicable.

Data Availability Statement

Data were obtained from China’s Official National Statistical Database and the China Emission Accounts and Datasets.

Conflicts of Interest

The authors declare no conflict of interest.

References

  1. Intergovernmental Panel on Climate Change. Intergovernmental Panel on Climate Change: Fourth Assessment Report: Climate Change 2007: Synthesis Report. Working Papers (id:1325). 2008. Available online: https://www.globalchange.gov/browse/reports/ipcc-climate-change-2007-synthesis-report (accessed on 31 August 2023).
  2. Li, P. Groundwater Quality in Western China: Challenges and Paths Forward for Groundwater Quality Research in Western China. Expo. Health 2016, 8, 305–310. [Google Scholar] [CrossRef]
  3. China Emission Accounts and Datasets (CEAD). Available online: https://www.ceads.net/ (accessed on 7 March 2023).
  4. National Bureau of Statistics of China. Annual Data of the Province in China. 2023. Available online: http://data.stats.gov.cn/easyquery.htm?cn=E0103 (accessed on 1 May 2023).
  5. Dong, F.; Zhu, J.; Li, Y.; Chen, Y.; Gao, Y.; Hu, M.; Qin, C.; Sun, J. How green technology innovation affects carbon emission efficiency: Evidence from developed countries proposing carbon neutrality targets. Environ. Sci. Pollut. Res. 2022, 29, 35780–35799. [Google Scholar] [CrossRef]
  6. Xie, Z.; Wu, R.; Wang, S. How technological progress affects the carbon emission efficiency? Evidence from national panel quantile regression. J. Clean. Prod. 2021, 307, 127133. [Google Scholar] [CrossRef]
  7. Sun, J.W. The decrease of CO2 emission intensity is decarbonization at national and global levels. Energy Policy. 2005, 33, 975–978. [Google Scholar] [CrossRef]
  8. Vujović, T.; Petković, Z.; Pavlović, M.; Jović, S. Economic growth based in carbon dioxide emission intensity. Physica A Stat. Mech. Its Appl. 2018, 506, 179–185. Available online: https://ideas.repec.org/a/eee/phsmap/v506y2018icp179-185.html (accessed on 31 August 2023). [CrossRef]
  9. Ran, Q.; Liu, L.; Razzaq, A.; Meng, Y.; Yang, X. Does green finance improve carbon emission efficiency? Experimental evidence from China. Environ. Sci. Pollut. Res. 2023, 30, 48288–48299. [Google Scholar] [CrossRef]
  10. Xiao, Y.P.; Ma, D.L.; Zhang, F.T.; Zhao, N.; Wang, L.; Guo, Z.M.; Zhang, J.W.; An, B.T.; Xiao, Y.D. Spatiotemporal differentiation of carbon emission efficiency and influencing factors: From the perspective of 136 countries. Sci. Total Environ. 2023, 879, 163032. [Google Scholar] [CrossRef] [PubMed]
  11. Khan, Z.; Badeeb, R.A.; Hassan, T.; Zhang, C.; Elfaki, K.E. Emissions-adjusted international trade for sustainable development in China: Evidence from dynamic. Sustain. Dev. 2022, 31, 379–392. [Google Scholar] [CrossRef]
  12. Wang, J.; Sun, K.; Ni, J.; Xie, D. Evaluation and Factor Analysis of Industrial Carbon Emission Efficiency Based on “Green-Technology Efficiency”—The Case of Yangtze River Basin, China. Land 2021, 10, 1408. [Google Scholar] [CrossRef]
  13. Jin, T.; Kim, J. A comparative study of energy and carbon efficiency for emerging countries using panel stochastic frontier analysis. Sci. Rep. 2019, 9, 6647. [Google Scholar] [CrossRef]
  14. Lin, B.; Du, K. Modeling the dynamics of carbon emission performance in China: A parametric malmquist index approach. Energy Econ. 2015, 49, 550–557. [Google Scholar] [CrossRef]
  15. Wang, J.; Liao, Z.; Sun, H. Analysis of Carbon Emission Efficiency in the Yellow River Basin in China: Spatiotemporal Differences and Influencing Factors. Sustainability 2023, 15, 8042. [Google Scholar] [CrossRef]
  16. Wang, Q.W.; Zhou, P.; Shen, N.; Wang, S.S. Measuring Carbon Dioxide Emission Performance in Chinese Provinces: A Parametric Approach. Renew. Sustain. Energy Rev. Dev. 2013, 21, 324–330. [Google Scholar] [CrossRef]
  17. Zeng, L.; Lu, H.; Liu, Y.; Zhou, Y.; Hu, H. Analysis of Regional Differences and Influencing Factors on China’s Carbon Emission Efficiency in 2005–2015. Energies 2019, 12, 3081. [Google Scholar] [CrossRef]
  18. Zhu, J.; Sun, H.; Zhou, D.; Peng, L.; Sun, C. Carbon emission efficiency of thermal power in different regions of China and spatial correlations. Mitig. Adapt. Strateg. Glob. Chang. 2020, 25, 1221–1242. [Google Scholar] [CrossRef]
  19. Charnes, A.; Cooper, W.W.; Rhodes, E. Measuring the Efficiency of Decision Making Units. Eur. J. Oper. Res. 1978, 2, 429–444. [Google Scholar] [CrossRef]
  20. Zhang, Y.J.; Liu, Z.; Zhang, H.; Tan, T.-D. The impact of economic growth, industrial structure and urbanization on carbon emission intensity in China. Nat. Hazards 2014, 73, 579–595. [Google Scholar] [CrossRef]
  21. Ning, L.; Zheng, W.; Zeng, L. Research on China’s Carbon Dioxide Emissions Efficiency from 2007 to 2016: Based on Two Stage Super Efficiency SBM Model and Tobit Model. Beijing Daxue Xuebao (Ziran Kexue Ban)/Acta Sci. Nat. Univ. Pekin. 2021, 57, 181–188. Available online: https://www.scopus.com/inward/record.uri?eid=2-s2.0-85101373648&doi=10.13209%2fj.0479-8023.2020.111&partnerID=40&md5=d948ef3627771ac2ca544cbf07fbc229 (accessed on 13 June 2022).
  22. Wu, H.; Hao, Y.; Weng, J.H. How does energy consumption affect China’s urbanization? New evidence from dynamic threshold panel models. Energy Policy 2019, 127, 24–38. [Google Scholar] [CrossRef]
  23. Tan, F.; Yang, S.; Niu, Z. The impact of urbanization on carbon emissions: Both from heterogeneity and mechanism test. Environ. Dev. Sustain. 2023, 25, 4813–4829. [Google Scholar] [CrossRef]
  24. Ali, R.; Bakhsh, K.; Yasin, M.A. Impact of urbanization on CO2 emissions in emerging economy: Evidence from Pakistan. Sustain. Cities Soc. 2019, 307, 101553. [Google Scholar] [CrossRef]
  25. Wang, S.J.; Zeng, J.Y.; Huang, Y.Y.; Shi, C.Y.; Zhan, P.Y. The effects of urbanization on CO2 emissions in the Pearl River Delta: A comprehensive assessment and panel data analysis. Appl. Energy 2018, 228, 1693–1706. [Google Scholar] [CrossRef]
  26. Xu, J.J.; Wang, J.C.; Li, R.; Yang, X.J. Spatio-temporal effects of urbanization on CO2 emissions: Evidences from 268 Chinese cities. Energy Policy 2023, 177, 113569. [Google Scholar] [CrossRef]
  27. Zhang, W.S.; Xu, Y.; Jiang, L.; Streets, D.G.; Wang, C. Direct and spillover effects of new-type urbanization on CO2 emissions from central heating sector and EKC analyses: Evidence from 144 cities in China. Resour. Conserv. Recycl. 2023, 192, 106913. [Google Scholar] [CrossRef]
  28. Chen, C.; Qin, Y.D.; Gao, Y.J. Does new urbanization affect CO2 emissions in China: A spatial econometric analysis. Sustain. Cities Soc. 2023, 96, 104687. [Google Scholar] [CrossRef]
  29. Shahbaz, M.; Loganathan, N.; Muzaffar, A.T.; Ahmed, K.; Jabran, M.A. How urbanization affects CO2 emissions in Malaysia? The application of STIRPAT model. Renew. Sustain. Energy Rev. 2016, 57, 83–93. [Google Scholar] [CrossRef]
  30. Martínez-Zarzoso, I.; Maruotti, A. The impact of urbanization on CO2 emissions: Evidence from developing countries. Ecol. Econ. 2011, 70, 1344–1353. [Google Scholar] [CrossRef]
  31. He, Z.X.; Xu, S.C.; Shen, W.X.; Long, R.Y.; Chen, H. Impact of urbanization on energy related CO2 emission at different development levels: Regional difference in China based on panel estimation. J. Clean. Prod. 2017, 140, 1719–1730. [Google Scholar] [CrossRef]
  32. Chen, W.X.; Wang, G.Z.; Xu, N.; Ji, M.; Zeng, J. Promoting or inhibiting? New-type urbanization and urban carbon emissions efficiency in China. Cities 2023, 140, 104429. [Google Scholar] [CrossRef]
  33. Sun, W.; Huang, C. How does urbanization affect carbon emission efficiency? Evidence from China. J. Clean. Prod. 2020, 272, 122828. [Google Scholar] [CrossRef]
  34. Zhang, C.; Chen, P. Industrialization, urbanization, and carbon emission efficiency of Yangtze River Economic Belt—Empirical analysis based on stochastic frontier model. Environ. Sci. Pollut. Res. 2021, 28, 66914–66929. [Google Scholar] [CrossRef] [PubMed]
  35. Li, J.B.; Huang, X.J.; Kwan, M.P.; Yang, H.; Chuai, X.W. The effect of urbanization on carbon dioxide emissions efficiency in the Yangtze River Delta, China. J. Clean. Prod. 2018, 188, 38–48. [Google Scholar] [CrossRef]
  36. Zhao, Z.; Yuan, T.; Shi, X.; Zhao, L. Heterogeneity in the relationship between carbon emission performance and urbanization: Evidence from China. Mitig. Adapt. Strateg. Glob. Chang. 2020, 25, 1363–1380. [Google Scholar] [CrossRef]
  37. Li, J.; Ma, J.; Wei, W. Analysis and Evaluation of the Regional Characteristics of Carbon Emission Efficiency for China. Sustainability 2020, 12, 3138. [Google Scholar] [CrossRef]
  38. Wang, Q.; Zhang, Q. Foreign Direct Investment and Carbon Emission Efficiency: The Role of Direct and Indirect Channels. Sustainability 2022, 14, 13484. [Google Scholar] [CrossRef]
  39. Zhang, J.; Wu, G.Y.; Zhang, J.P. The Estimation of China’s Provincial Capital Stock: 1952–2000. Econ. Res. J. 2004, 10, 35–44. Available online: http://en.cnki.com.cn/Article_en/CJFDTOTAL-JJYJ200410004.htm (accessed on 25 July 2019).
  40. Feng, Z.; Zou, L.; Wei, M.Y. The impact of household consumption on energy use and CO2 emissions in China. Energy 2011, 36, 656–670. [Google Scholar] [CrossRef]
  41. Liu, J.; Yin, M.; Wang, K.; Zou, J.; Kong, Y. Long-term impacts of urbanization through population migration on China’s energy demand and CO2 emissions. Mitig. Adapt. Strateg. Glob. Chang. 2020, 25, 1053–1071. [Google Scholar] [CrossRef]
  42. Xu, S.; He, Z.; Long, R.; Shen, W. Impacts of economic growth and urbanization on CO2 emissions: Regional differences in China based on panel estimation. Reg. Environ. Change 2016, 6, 777–787. [Google Scholar] [CrossRef]
  43. Grossman, G.M.; Krueger, A.B. Economic growth and the environment. Nber Work. Pap. 1995, 110, 353–377. [Google Scholar] [CrossRef]
  44. Wang, Y.; Chen, W.; Zhao, M.; Wang, B. Analysis of the influencing factors on CO2 emissions at different urbanization levels: Regional difference in China based on panel estimation. Nat. Hazards 2019, 96, 627–645. [Google Scholar] [CrossRef]
  45. Lv, T.; Hu, H.; Zhang, X.; Xie, H.; Wang, L.; Fu, S. Spatial spillover effects of urbanization on carbon emissions in the Yangtze River Delta urban agglomeration, China. Environ. Sci. Pollut. Res. 2022, 29, 33920–33934. [Google Scholar] [CrossRef]
  46. Zhang, C.G.; Lin, Y. Panel estimation for urbanization, energy consumption and CO2 emissions: A regional analysis in China. Energy Policy. 2012, 49, 488–498. [Google Scholar] [CrossRef]
  47. Chen, W.; Shen, Y.; Wang, Y. Evaluation of economic transformation and upgrading of resource-based cities in Shaanxi province based on an improved TOPSIS method. Sustain. Cities Soc. 2018, 37, 232–240. [Google Scholar] [CrossRef]
  48. Zhuo, C.F.; Deng, F. How does China’s Western Development Strategy affect regional green economic efficiency? Sci. Total Environ. 2020, 707, 135939. [Google Scholar] [CrossRef] [PubMed]
  49. Zhang, Y.; Xu, X. Carbon emission efficiency measurement and influencing factor analysis of nine provinces in the Yellow River basin: Based on SBM-DDF model and Tobit-CCD model. Environ Sci Pollut Res. 2022, 9, 33263–33280. [Google Scholar] [CrossRef] [PubMed]
  50. Zhang, F.; Deng, X.; Phillips, F.; Fang, C.; Wang, C. Impacts of industrial structure and technical progress on carbon emission intensity: Evidence from 281 cities in China. Technol. Forecast. Soc. Chang. 2020, 154, 119949. [Google Scholar] [CrossRef]
  51. Dong, F.; Li, Y.; Zhang, X.; Zhu, J.; Zheng, L. How does industrial convergence affect the energy efficiency of manufacturing in newly industrialized countries? Fresh evidence from China. J. Clean. Prod. 2021, 316, 128316. [Google Scholar] [CrossRef]
  52. Chu, X.; Geng, H.; Guo, W. How Does Energy Misallocation Affect Carbon Emission Efficiency in China? An Empirical Study Based on the Spatial Econometric Model. Sustainability 2019, 11, 2115. [Google Scholar] [CrossRef]
  53. Dong, F.; Long, R.; Bian, Z.; Xu, X.; Yu, B.; Wang, Y. Applying a Ruggiero three-stage super-efficiency DEA model to gauge regional carbon emission efficiency: Evidence from China. Nat. Hazards 2017, 87, 1453–1468. [Google Scholar] [CrossRef]
  54. Zhang, W.; Zhu, Z.; Liu, X.; Cheng, J. Can green finance improve carbon emission efficiency? Environ. Sci. Pollut. Res. 2022, 29, 68976–68989. [Google Scholar] [CrossRef] [PubMed]
  55. Zhang, X.; Sun, H.; Wang, T. Impact of Financial Inclusion on the Efficiency of Carbon Emissions: Evidence from 30 Provinces in China. Energies 2022, 15, 7316. [Google Scholar] [CrossRef]
  56. Zeng, L.; Li, H.; Wang, X.; Yu, Z.; Hu, H.; Yuan, X.; Zhao, X.; Li, C.; Yuan, D.; Gao, Y.; et al. China’s Transport Land: Spatiotemporal Expansion Characteristics and Driving Mechanism. Land 2022, 11, 1147. [Google Scholar] [CrossRef]
  57. Du, K.; Li, P.; Yan, Z. Do green technology innovations contribute to carbon dioxide emission reduction? Empirical evidence from patent data. Technol. Forecasting Soc. Chang. 2019, 146, 297–303. [Google Scholar] [CrossRef]
  58. Gong, W.; Zhang, H.; Wang, C.; Wu, B.; Yuan, Y.; Fan, S. Analysis of urban carbon emission efficiency and influencing factors in the Yellow River Basin. Environ. Sci. Pollut. Res. 2023, 30, 14641–14655. [Google Scholar] [CrossRef] [PubMed]
  59. Wang, Q.; Wang, R.; Liu, S. The reverse technology spillover effect of outward foreign direct investment, energy efficiency and carbon emissions. Environ. Dev. Sustain. 2023. [Google Scholar] [CrossRef]
  60. Zeng, L.; Li, C.; Liang, Z.; Zhao, X.; Hu, H.; Wang, X.; Yuan, D.; Yu, Z.; Yang, T.; Lu, J.; et al. The Carbon Emission Intensity of Industrial Land in China: Spatiotemporal Characteristics and Driving Factors. Land 2022, 11, 1156. [Google Scholar] [CrossRef]
  61. Wei, L.; Wang, Z. Differentiation Analysis on Carbon Emission Efficiency and Its Factors at Different Industrialization Stages: Evidence from Mainland China. Int. J. Environ. Res. Public Health 2022, 19, 16650. [Google Scholar] [CrossRef] [PubMed]
  62. Fu, J.; Ding, R.; Zhang, Y.; Zhou, T.; Du, Y.; Zhu, Y.; Du, L.; Peng, L.; Zou, J.; Xiao, W. The Spatial-Temporal Transition and Influencing Factors of Green and Low-Carbon Utilization Efficiency of Urban Land in China under the Goal of Carbon Neutralization. Int. J. Environ. Res. Public Health 2022, 19, 16149. [Google Scholar] [CrossRef] [PubMed]
  63. Lin, Y.N.; Chiu, Y.H.; Chang, T.-H.; Lin, T.-Y.; Chiu, S.-Y. The impact of education level on residents’ carbon consumption in China. Int. J. Environ. Sci. Technol. 2022, 20, 9603–9618. [Google Scholar] [CrossRef]
  64. Liang, S.; Zhao, J.; He, S.; Xu, Q.; Ma, X. Spatial econometric analysis of carbon emission intensity in Chinese provinces from the perspective of innovation-driven. Environ. Sci. Pollut. Res. 2019, 26, 13878–13895. [Google Scholar] [CrossRef]
  65. Li, Y.; Chiu, Y.-h.; Lu, L.C. New Energy Development and Pollution Emissions in China. Int. J. Environ. Res. Public Health 2019, 16, 1764. [Google Scholar] [CrossRef] [PubMed]
  66. Tone, K.; Tsutsui, M. An epsilon-based measure of efficiency in DEA—A third pole of technical efficiency. Eur. J. Oper. Res. 2010, 207, 1554–1563. [Google Scholar] [CrossRef]
  67. Zeng, L.; Li, P.; Yu, Z.; Nie, Y.; Li, S.; Gao, G.; Huang, D. Spatiotemporal Characteristics and Influencing Factors of Water Resources’ Green Utilization Efficiency in China: Based on the EBM Model with Undesirable Outputs and SDM Model. Water 2022, 14, 2908. [Google Scholar] [CrossRef]
  68. Zhao, P.; Zeng, L.; Li, P.; Lu, H.; Hu, H.; Li, C.; Zheng, M.; Li, H.; Yu, Z.; Yuan, D. China’s transportation sector carbon dioxide emissions efficiency and its influencing factors based on the EBM DEA model with undesirable outputs and spatial Durbin model. Energy 2022, 238, 121934. [Google Scholar] [CrossRef]
  69. Zeng, L. The Driving Mechanism of Urban Land Green Use Efficiency in China Based on the EBM Model with Undesirable Outputs and the Spatial Dubin Model. Int. J. Environ. Res. Public Health 2022, 19, 10748. [Google Scholar] [CrossRef] [PubMed]
  70. Li, C.Y.; Yongmei, Z.; Shiqiang, Z.; Jianmei, W. Applying the Super-EBM model and spatial Durbin model to examining total-factor ecological efficiency from a multi-dimensional perspective: Evidence from China. Environ. Sci. Pollut. Res. 2022, 29, 2183–2202. [Google Scholar] [CrossRef]
  71. Zhao, L.; Gao, X.; Jia, J.; Zhang, Y. Analyzing inclusive green growth in China: A perspective of relative efficiency. Environ. Sci. Pollut. Res. 2023, 30, 16017–16035. [Google Scholar] [CrossRef]
  72. Tobin, J. Estimation of relationships for limited dependent variables. Econometrica 1958, 26, 24–36. [Google Scholar] [CrossRef]
  73. Zeng, L.; Li, H.; Lao, X.; Hu, H.; Wei, Y.; Li, C.; Yuan, X.; Guo, D.; Liu, K. China’s Road Traffic Mortality Rate and Its Empirical Research from Socio-Economic Factors Based on the Tobit Model. Systems 2022, 10, 122. [Google Scholar] [CrossRef]
  74. Yuan, X.; Nie, Y.; Zeng, L.; Lu, C.; Yang, T. Exploring the Impacts of Urbanization on Eco-Efficiency in China. Land 2023, 12, 687. [Google Scholar] [CrossRef]
  75. Lin, X.; Cui, W.; Wang, D. The heterogeneous effects of environmental regulation on industrial carbon emission efficiency in China using a panel quantile regression. Environ. Sci. Pollut. Res. 2023, 30, 55255–55277. [Google Scholar] [CrossRef]
  76. Yang, L.; Ma, Z.; Yin, J.; Li, Y.; Lv, H. The evolution and determinants of Chinese inter-provincial green development efficiency: An MCSE-DEA-Tobit-based perspective. Environ. Sci. Pollut. Res. 2023, 30, 53904–53919. [Google Scholar] [CrossRef]
  77. Duodu, E.; Mpuure, D.M.N. International trade and environmental pollution in sub-Saharan Africa: Do exports and imports matter? Environ. Sci. Pollut. Res. 2023, 30, 53204–53220. [Google Scholar] [CrossRef]
  78. Azam, A.; Rafiq, M.; Shafique, M.; Zhang, H.N.; Yuan, J.H. Analyzing the effect of natural gas, nuclear energy and renewable energy on GDP and carbon emissions: A multi-variate panel data analysis. Energy 2021, 219, 119592. [Google Scholar] [CrossRef]
Figure 1. The total amount of energy CO2 emissions of Western China and its proportion in the whole country from 2010 to 2019 [3].
Land 12 01707 g001
Figure 2. The urbanisation rate of China and its western region from 2010 to 2019 [4].
Land 12 01707 g002
Figure 3. The research areas.
Land 12 01707 g003
Figure 4. The values of CEE for 11 provinces in Western China (2010–2019).
Land 12 01707 g004
Figure 5. Average CEE values in the 11 Western provinces (2010–2019).
Land 12 01707 g005
Table 1. Assessment indicator system of CEE.
Primary IndicatorsSecondary IndicatorsUnit
InputsCapital stock100 million Renminbi (RMB)
Employees10,000 people
Energy consumption10,000 tons of standard coal
Desired outputsGDP100 million RMB
Undesired outputsCO2 emissions10,000 tons
Table 2. Definition of explanatory variables.
Explanatory VariableDefinition of the VariablesPre-Judgment
Urbanisation level (UL)The proportion of the urban resident population to the total population (%)Unknown
Industrial structure (IS)The proportion of the secondary industry to GDP (%)Negative
Technical progress level (TPL)Patent application granted per 100,000 people (item)Positive
Foreign trade dependence (FTD)The proportion of the foreign trades to GDP (%)Unknown
Foreign direct investment (FDI)The proportion of the foreign direct investments to GDP (%)Unknown
Educational development level (EDL)Average schooling year (104 RMB)Positive
Table 3. Descriptive statistics of the main variables.
VariableObservationMeanStandard DeviationMinimumMaximum
CEE1100.840.1590.5331.075
UL1100.5030.0820.3380.682
(UL) 21100.260.0830.1140.465
IS1100.4140.0480.3280.538
TPL1104.0863.2940.46914.445
FDI1100.0090.0080.000110.037
FTD1100.1160.070.0130.401
EDL1108.5150.6246.7649.77
Table 4. The CEE of the 11 provinces in Western China (2010–2019).
Provinces2010201120122013201420152016201720182019Mean
Inner Mongolia1.0251.0281.0301.0181.0061.0040.6860.6971.0021.0020.950
Guangxi1.0020.9300.8840.7950.7920.7780.7070.6960.7290.7130.803
Chongqing1.0371.0311.0411.0651.0611.0401.0751.0571.0401.0441.049
Sichuan1.0151.0261.0131.0021.0010.9440.8820.8861.0041.0020.977
Guizhou0.8030.8490.8680.8160.8020.8050.6730.6840.7640.7560.782
Yunnan1.0061.0051.0051.0081.0061.0030.7900.7860.8560.8630.933
Shaanxi1.0121.0091.0030.8600.8590.8490.7920.7940.8340.8210.883
Gansu0.8050.7900.7600.7030.6880.6880.6040.6090.6950.7220.706
Qinghai0.7720.7440.6860.6280.6080.6000.5360.5330.5750.5700.625
Ningxia0.7200.7130.6870.6490.6370.6610.5710.5650.6220.6470.647
Xinjiang1.0481.0351.0231.0141.0050.7910.6650.6650.7660.7810.879
Mean0.9310.9230.9090.8690.8600.8330.7260.7250.8080.8110.840
Table 5. The results of LLC, IPS, ADF, and PPF tests.
LLCIPSADFPPF
CEE−4.59684 ***−0.7818323.928038.3799 **
UL−1.81845 **1.0942332.1014 *67.6014 ***
(UL)2−2.19840 **4.0415218.628831.4176 *
IS−2.49085 ***0.7891519.85355.27740
TPL3.173614.625664.180732.94490
FDI−4.88970 ***−1.37320 *41.3617 ***42.2818 ***
TFD−1.90124 **0.4899017.136314.0802
DEL−10.4793 ***−5.45914 ***74.7983 ***109.673 ***
∆CEE−7.24791 ***−2.72979 ***46.4408 ***43.7755 ***
∆UL−6.96282 ***−2.47240 ***46.2254 ***37.9369 **
∆(UL)2−3.57101 ***−1.15682 32.744833.7736
∆IS−6.78361 ***−3.13371 ***50.3317 ***54.5030 ***
∆TPL−9.58018 ***−5.09222 ***67.9988 ***91.5625 ***
∆FDI−10.3700 ***−4.38726 ***68.9408 ***113.291 ***
∆TFD−7.75143 ***−3.58952 ***55.1930 ***62.4403 ***
∆DEL−14.5693 ***−9.43005 ***111.808 ***166.225 ***
∆∆CEE−20.5302 ***−7.25098 ***89.3214 ***92.8166 ***
∆∆UL−12.8661 ***−5.15129 ***76.0949 ***109.272 ***
∆∆(UL)2UL*2−12.7124 ***−5.10173 ***76.3849 ***106.640 ***
∆∆IS−9.84122 ***−4.32832 ***62.4057 ***86.2489 ***
∆∆TPL−23.7748 ***−8.25391 ***97.3661 ***140.317 ***
∆∆FDI−14.4243 ***−8.87889 ***105.465 ***151.970 ***
∆∆TFD−11.4181 ***−5.05898 ***71.6269 ***114.607 ***
∆∆DEL−20.4592 ***−7.92019 ***87.2858 ***163.211 ***
Note: *, ** and *** indicate significance at the 0.1%, 1% and 5% levels, respectively.
Table 6. The results of the Kao cointegration test.
t-StatisticProb.
Augmented Dickey–Fuller−3.9587880.000 ***
Residual variance0.004024
HAC variance0.003986
Note: *** indicates significance at the 1% level.
Table 7. The regression results of the Tobit model.
Coef.St. Err.t-Valuep-Value
UL−6.08 ***1.242−4.900.000
(UL)25.294 ***1.24.410.000
IS−0.0780.217−0.360.722
TPL0.0010.0040.300.761
FDI11.403 ***1.2629.030.000
FTD0.852 ***0.1495.730.000
EDL0.047 **0.0222.130.035
Constant1.9470.3295.920.000
Note: ** and *** indicate significance at the 1% and 5% level, respectively.
Disclaimer/Publisher’s Note: The statements, opinions and data contained in all publications are solely those of the individual author(s) and contributor(s) and not of MDPI and/or the editor(s). MDPI and/or the editor(s) disclaim responsibility for any injury to people or property resulting from any ideas, methods, instructions or products referred to in the content.

