Article

Spatio-Temporal Variation Characteristics of North Africa’s Climate Potential Productivity

1
Collaborative Innovation Center of South China Sea Studies, Nanjing 210093, China
2
School of Geographic & Oceanographic Sciences, Nanjing University, Nanjing 210023, China
3
Institute of African Studies, Nanjing University, Nanjing 210023, China
4
Johns Hopkins University-Nanjing University Center for Chinese and American Studies, Nanjing 210093, China
5
Department of Architecture and Built Environment, University of Nottingham, Ningbo 315100, China
*
Authors to whom correspondence should be addressed.
These authors contributed equally to this work.
Land 2023, 12(9), 1710; https://doi.org/10.3390/land12091710
Submission received: 21 July 2023 / Revised: 25 August 2023 / Accepted: 30 August 2023 / Published: 1 September 2023
(This article belongs to the Special Issue Sustainable Land Management, Climate Change and Food Security)

Abstract

:
Africa is becoming one of the most sensitive and vulnerable regions of the global ecosystem due to its variable climate, complex topography, and diversity of natural ecosystems. In the context of global warming, climate change not only alters the spatial distribution of temperature and precipitation in North Africa, but also affects the spatial distribution of vegetation as well as the structure and function of ecosystems, causing changes in the North African ecosystem and inducing a series of food security problems. In this regard, this paper analyzed the spatio-temporal distribution of climate change, climate production potential (CPP), and influencing factors in Africa based on meteorological data for 1901–2019, using the Thornthwaite Memorial model, Mann–Kendall mutation test, and Pearson correlation model. The results indicated that from 1901 to 2019, the CPP in North Africa decreased by 4.9%, while the region’s precipitation experienced a decline of 5.2%. The phased trend in CPP was consistent with the change in precipitation. Temperature and precipitation were the main limiting factors for CPP in North Africa, with precipitation being more limiting. In general, North Africa’s CPP was more sensitive to precipitation, and a continued ‘warm and dry’ climate in the future could lead to an increasing downward trend.

1. Introduction

Global climate change is one of the most complex challenges facing humanity in the 21st century and is already having widespread and significant impacts on humans and natural vegetation [1]. Climate warming is becoming increasingly evident, causing surface temperatures and air temperatures to be significantly higher than in the past. Agriculture is one of the industries most directly affected by climate change, with both temperature and precipitation having a significant impact on its production. The uncertainty of climate change has increased the frequency of meteorological disasters, which in turn pose a threat to agricultural production as well as food security [2]. The impact of this is detrimental to some regions, particularly those with poor adaptive capacity and unusually vulnerable production.
Africa is becoming one of the most sensitive and fragile areas of the global ecosystem due to its variable climate, complex topography, and diversity of natural ecosystems. Located near the Tropic of Cancer, North Africa has an arid climate with scarce precipitation and is home to the world’s largest desert, the Sahara Desert. In the context of global warming, climate change not only alters the spatial distribution of temperature and precipitation in North Africa, but also affects the spatial distribution of vegetation as well as the structure and function of ecosystems, etc., causing changes in the ecological environment of North Africa and inducing a series of food security problems. The agriculture sector plays an important role within the North African countries, contributing at least 10% to each national gross domestic product (GDP) of the region. Despite this, there has been a persistent imbalance between agricultural production and population demand in North Africa, with significant shortfalls in agricultural production [3]. Countries such as Morocco, Algeria, and Egypt have been ‘areas of high food seismicity’ [4]. The 2008 food crisis that hit North Africa marked a turning point. In the aftermath of the food crisis, agriculture returned to the forefront of national and international attention and governments began to make commitments to food security and agricultural development [3]. The secure production of food in Africa is therefore of great significance for food security. Studying the changing climate potential productivity in North Africa can provide a reliable basis and reference for achieving high-quality, high-yielding, and efficient agricultural production patterns.
Climate potential productivity (CPP) refers to the highest possible biological or agricultural yield per unit area when soil and nutrient conditions are optimal and climatic resources such as temperature and precipitation are fully and rationally utilized [5,6,7,8,9,10]. CPP is an important indicator for the scientific evaluation of regional food production capacity and can reflect the support of crop production by climatic resources in different regions [11]. Exploring the CPP, which reflects the different and mutually coordinated degrees of meteorological factors, not only allows for the prediction of vegetation potential productivity, but also allows for the prediction of future developments based on climate change trends and is one of the bases for assessing agro-climatic resources [12].
Many researchers have carried out theoretical and experimental analyses on CPP from different perspectives. Constantinidou et al. [13] assessed the effects of climate change on the yield of winter wheat in the eastern Mediterranean and the Middle East. Li et al. [14] used the Miami model and the Thornthwaite Memorial model to calculate three climate-induced potential productivities in Yunnan Province of China. Li et al. [15] compared CPP and wheat production in China, Canada, and the USA. Gong et al. [16] analyzed the CPP of soybean and explored the impact of climate change on soybean in the frigid region. Wang et al. [17] estimated the CPP of grain production in Dongting Lake Basin, China. Zhang et al. [18] studied the change mechanism and temporal and spatial variation characteristics of the CPP in Guangdong Province, China.
Food security is an extremely crucial issue under climate change in Africa. In the face of global warming, quantifying the change in CPP is of great significance for food production planning. Therefore, with the help of meteorological data from 1901 to 2019 in North Africa, this study calculated the CPP and its change. The aims of this study are: (1) to examine the spatio-temporal characteristics of temperature, precipitation and CPP; (2) to investigate major limiting factors of agricultural production in North Africa; and (3) to provide a reference for improving agricultural productivity and sustainable development, rational use of climate resources, and food production security. We hope our study can make a contribution to decision-making on the formulation and implementation of climate change response and adaptation policies in North Africa.

2. Materials and Methods
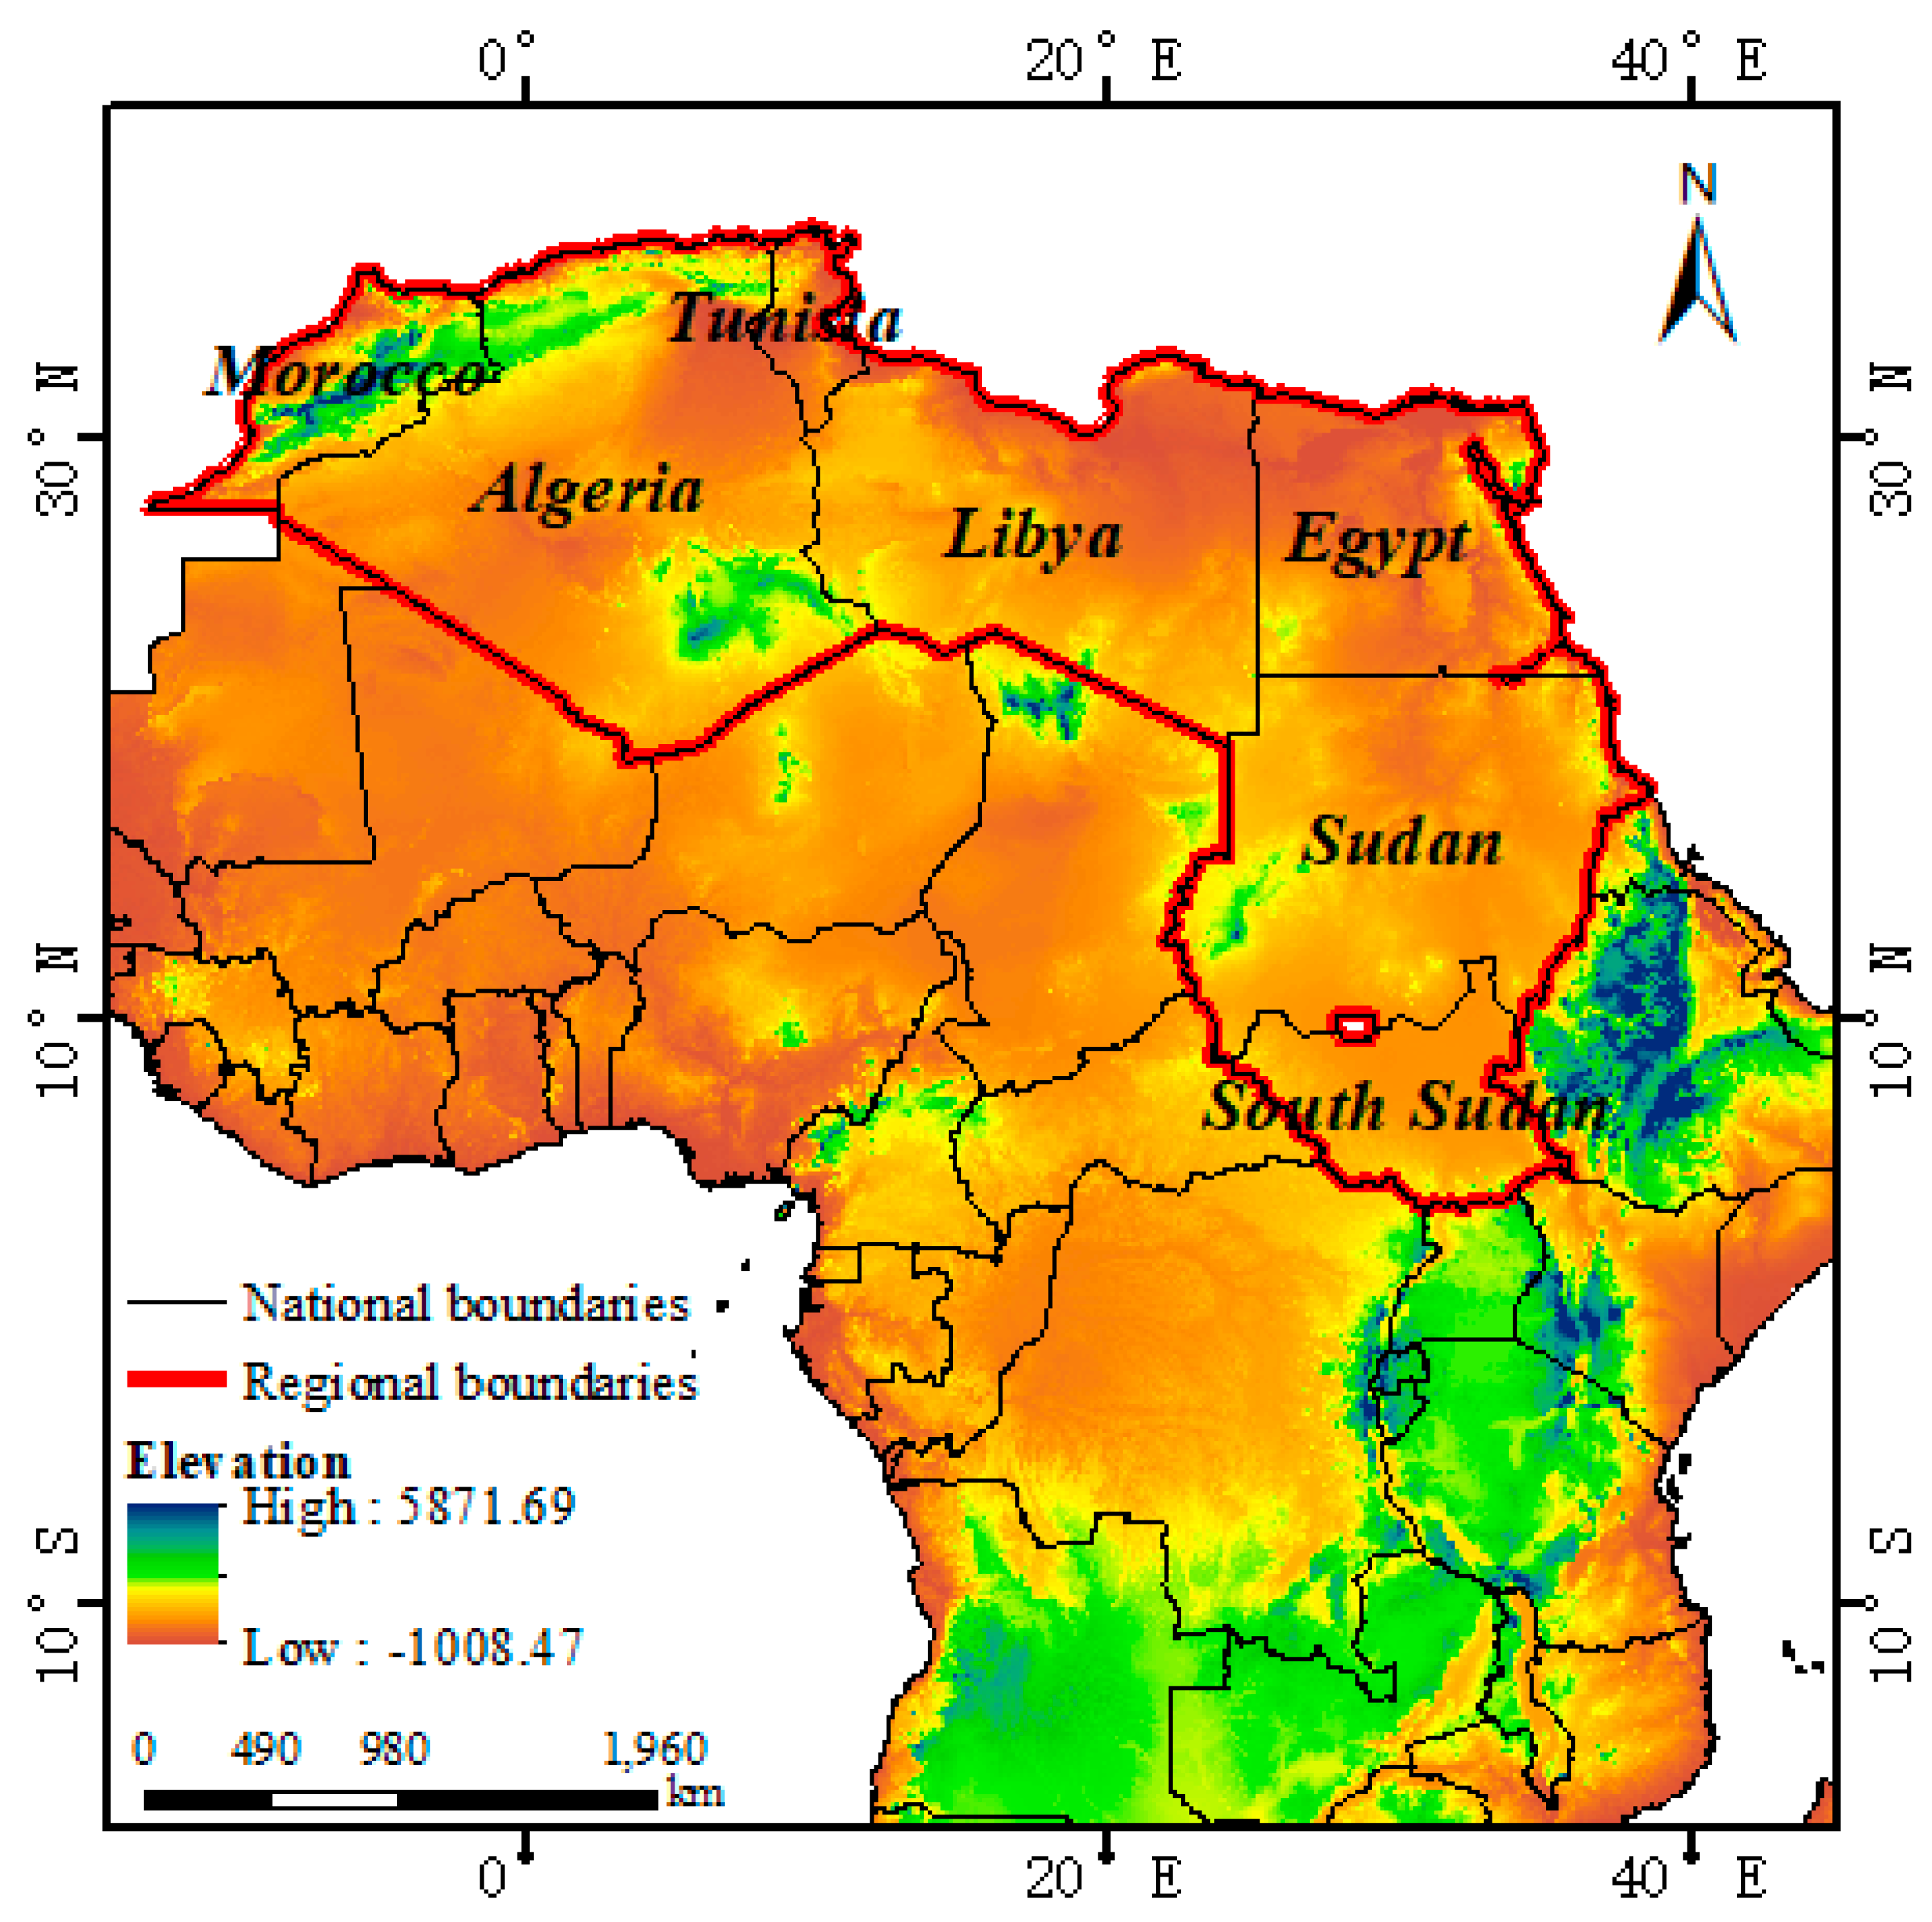
2.1. Study Area

North Africa is located on both sides of the Tropic of Cancer and refers mainly to the countries located on the Mediterranean coast of northern Africa. Based on the map of the world’s political regions and the geographical and geological characteristics of Africa [19,20], this paper classified the seven countries of Morocco, Algeria, Tunisia, Libya, Egypt, Sudan, and South Sudan into the geographical division of North Africa (Figure 1).

2.2. Data Source

The meteorological data used in this paper (monthly temperature and monthly precipitation data) are based on the climate dataset CRU TS v. 4.04 (https://www.uea.ac.uk/web/groups-and-centres/climatic-research-unit/data (accessed on 15 February 2023)) produced by the National Centre for Atmospheric Sciences (NCAS) in the UK. The study time period is 1901–2019 and the spatial resolution is 0.5° × 0.5°. African country vector data are from Natural Earth’s map of world regions (https://www.naturalearthdata.com/features/ (accessed on 8 April 2023)).

2.3. Methods

Climate tendency rate and MK trend analysis were used to analyze the spatio-temporal characteristics of climate change. The Thornthwaite Memorial model was used to quantify CPP data and to analyze the spatio-temporal variation characteristics of CPP in conjunction with MK mutation analysis. Pearson correlation and a linear regression model of CPP, temperature, and precipitation were then constructed in both the temporal and spatial dimensions. The framework of the study is shown in Figure 2.

2.3.1. Climate Tendency Rate

The least squares method was applied to the temperature and precipitation data and time series to calculate the linear regression coefficient α 1 , derive the change trend, and construct a one-dimensional linear regression equation with the following formula:
X = α 0 + α 1
where α 0 is the regression constant, and t is the time series. The climate tendency rate is usually expressed as 10     α 1 , which means the change rate of climate per 10a.

2.3.2. Thornthwaite Memorial Model

In this study, the Thornthwaite Memorial model was selected to calculate the potential productivity. The climate factors considered in the Thornthwaite Memorial model are relatively simple and can better reflect the key factors affecting plant growth and development, such as temperature, precipitation, and evapotranspiration [7,14,21]. This model provides a more accurate estimate of CPP, which is calculated as follows [22]:
Y E = 3000 × 1 e 0.0009695 E T 20
E T = 1.05 P 1 + 1.05 P E L 2
E L = 300 + 25 T + 0.05 T 3
where   Y E is the climate potential productivity ( k g / h m 2 ) (this unit indicates kilogram per square hectometer per year). E T indicates the actual average annual evapotranspiration (mm), and P is annual precipitation (mm). E L indicates the annual maximum evapotranspiration (mm) and T is the mean annual temperature (°C).

2.3.3. Mann–Kendall Trend Analysis

Mann–Kendall (MK) trend analysis is suitable for analyzing time series data with a continuous increasing or decreasing trend, is not disturbed by a few outliers, is suitable for data that do not have a certain distribution, such as hydrology and meteorology, and is easy to calculate [23,24]. The MK test has been widely used by scholars to analyze changes in trends in multi-domain elements such as climate and hydrology over time series [25], which can be calculated based on Equations (5)–(7)
S = k = 1 n 1 j = k + 1 n S g n ( X j X k )
S g n ( X j X k ) = + 1 ( X j X k ) > 0 0 ( X j X k ) = 0 1 ( X j X k ) < 0
Z = S 1 V a r ( S ) S > 0 S + 1 V a r ( S ) S < 0
The Mann–Kendall (MK) mutation analysis is widely used as a non-parametric statistical test method, which has the advantage that it does not need to follow a certain distribution nor is it disturbed by outliers [23,24]. This study therefore used this method to test for mutations in temperature and precipitation and trends in CPP. Specific methods are described in References [26,27].

3. Results

3.1. Spatio-Temporal Variations in North African Climate

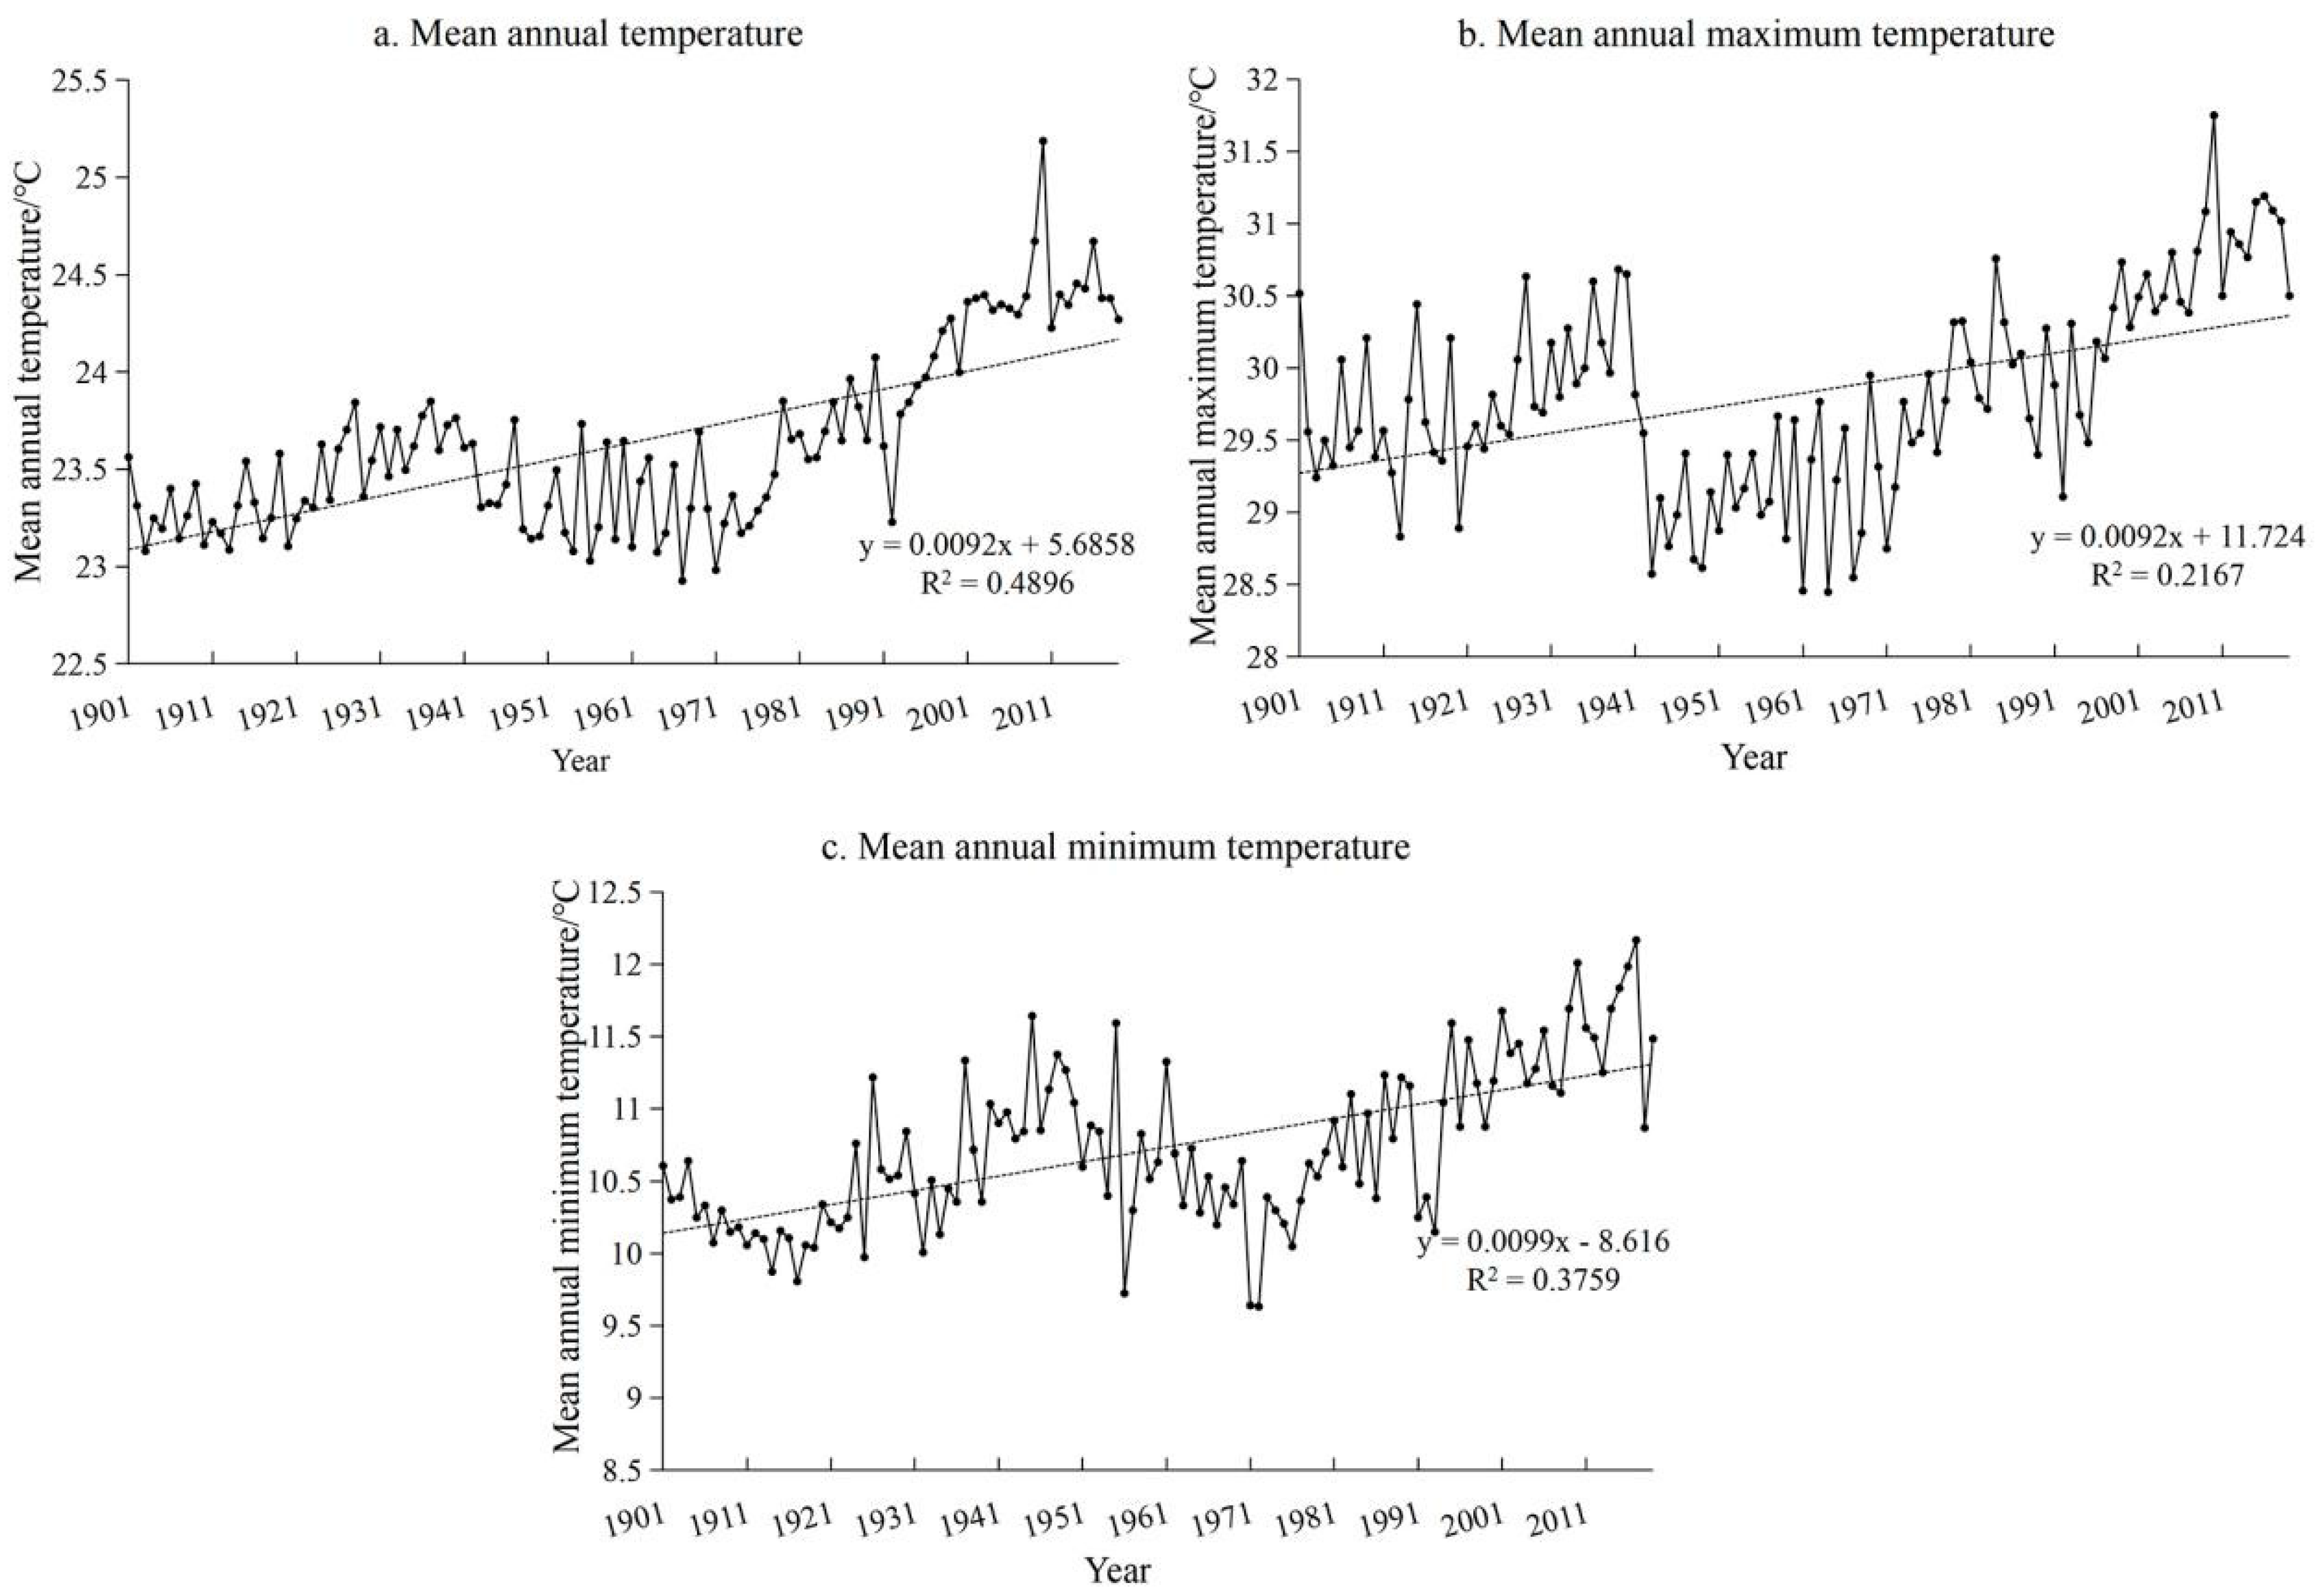
3.1.1. Temporal Variations in Temperature and Precipitation

To perform a linear analysis of the interannual variation in temperature in North Africa, the mean annual temperature, mean annual maximum temperature, and mean annual minimum temperature for North Africa from 1901 to 2019 were regressed to calculate the climate tendency rate, where mean annual temperature is the average of the attribute values for each image element of the annual temperature raster data, and mean annual maximum (minimum) temperature is the maximum (minimum) value of the attribute values for each image element of the annual temperature raster data.
The mean annual temperature, mean annual maximum temperature, and mean annual minimum temperature in North Africa presented an overall upward fluctuating trend (Figure 3). The mean annual temperature in North Africa has gradually increased at a rate of 0.092 °C/10a since 1901, the mean annual maximum temperature has gradually increased at a rate of 0.092 °C/10a, and the mean annual minimum temperature has gradually increased at a rate of 0.099 °C/10a. The mean annual temperature and mean annual minimum temperature in North Africa have increased by 0.78 °C and 0.71 °C, respectively, since 1901. The climate tendency rates and values of increase indicate that the North African region is warming, with the increase in mean annual minimum temperature being particularly significant.
With the aim of performing a linear analysis of the interannual variation in precipitation in North Africa, the mean annual precipitation, annual maximum precipitation, and mean annual precipitation for North Africa from 1901 to 2019 were regressed to calculate the climate tendency rate. The mean annual precipitation is the average of the attribute values for each pixel of the annual precipitation raster data. The annual maximum (minimum) precipitation is the maximum (minimum) value of each attribute of the annual precipitation raster data.
The annual minimum precipitation in North Africa from 1901 to 2019 was less than 1 mm and was distributed in the Sahara Desert region (Figure 4). Mean annual precipitation and annual maximum precipitation have demonstrated a fluctuating downward trend at a rate of 0.939 mm/10a and 1.11 mm/10a, respectively. It can be seen that precipitation has been declining in North Africa, with an overall decrease of 5.4%, with the decrease in annual maximum precipitation being particularly significant.

3.1.2. Spatial Variations in Temperature and Precipitation

MK trend analysis and significance tests were performed on the mean annual temperature and annual precipitation raster images for North Africa from 1901 to 2019 on an image-by-image basis (Figure 5 and Figure 6), and statistical tabulations of raster areas were made (Table 1 and Table 2).
The mean annual temperature in North Africa from 1901 to 2019 was 23.22 °C. The mean annual temperature of 20 to 25 °C is the most widely distributed, accounting for 51.29% of the area of North Africa and 14.47% of the overall area of Africa (Table 1). Southern North Africa is located in the Sahara Desert, where the temperature is generally higher than 25 °C, accounting for 35.04% of the area of North Africa and 9.88% of the overall area of Africa. In the coastal areas north of the Atlas Mountains, the northernmost part of the continent, the temperature is generally below 20 °C, accounting for 13.67% of the area of North Africa and 3.85% of the overall area of Africa. In addition, the highest mean annual temperatures were recorded in Sudan, South Sudan, and southern Algeria (Figure 5a), with the lowest MK trend in Egypt (Figure 5b). The mean annual temperatures in North Africa all revealed a highly significant upward trend (Table 2).
The mean annual precipitation in North Africa from 1901 to 2019 was mostly concentrated in the range of 0~1000 mm, accounting for 96.85% of the area of North Africa and 27.32% of the overall area of Africa (Table 1). A total of 84.69% of the area showed a decreasing trend in mean annual precipitation, with a highly significant decrease accounting for 23.29% of the area of North Africa and 6.56% of the overall area of Africa (Table 2), mainly in the Sahara Desert of North Africa and the eastern part of the Sudanese steppe (Figure 6c). Overall, trends in mean annual precipitation presented mainly insignificant changes (Table 2). Among them, South Sudan received the highest mean annual precipitation (Figure 6a). Except for South Sudan, the mean annual precipitation in all other countries in North Africa is distributed in the range of 0–500 mm. This is probably related to the extreme weather climatic events in South Sudan. Climate change affects the variability of weather, exposing South Sudan to heavy rainfall, seasonal floods, and droughts.

3.2. Spatio-Temporal Variations in North Africa’s CPP

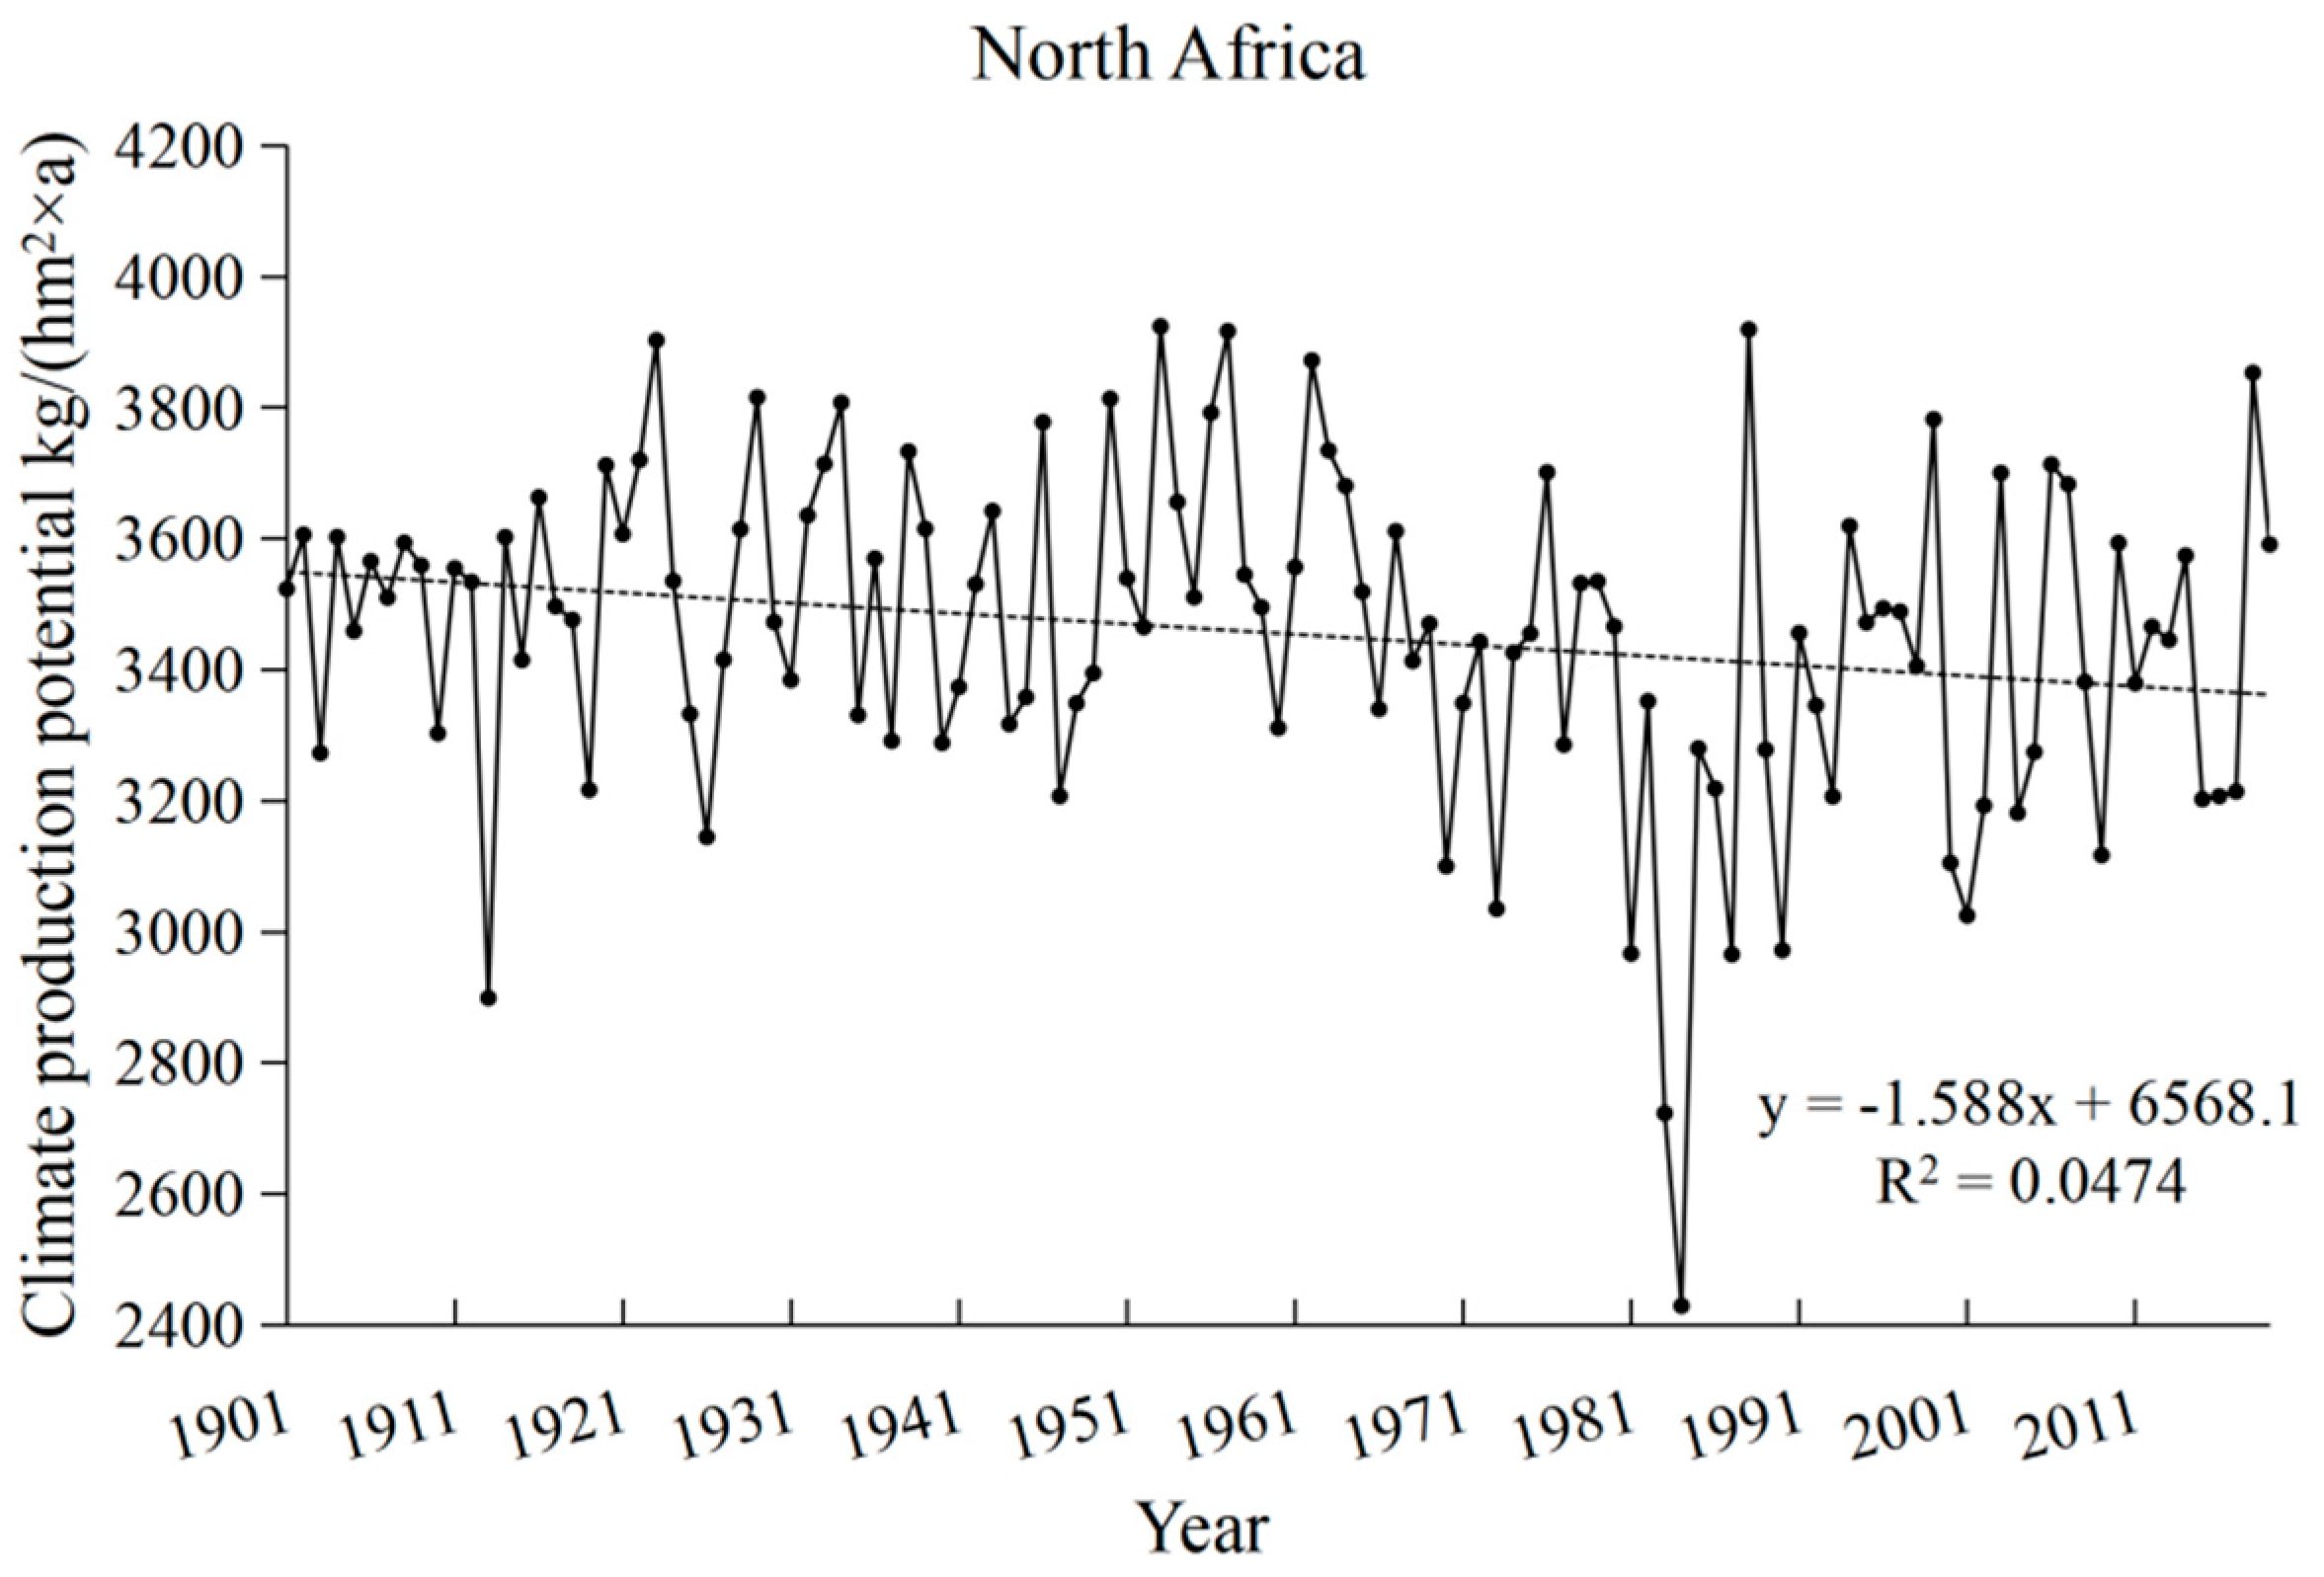
3.2.1. Temporal Variations in North Africa’s CPP

For the purpose of a linear analysis of the interannual variation in CPP in Africa, this paper performed a regression calculation of CPP for North Africa from 1901 to 2019. As can be seen from Figure 7, the CPP of North Africa ranged from 2429.27 to 3924.05 kg/hm2, which coincided with the distribution of precipitation. The CPP for North Africa decreased at a rate of 15.88 kg / hm 2 × 10 a , corresponding to an overall decline of 4.9%. This decrease in CPP aligned closely with the concurrent 5.4% reduction in precipitation in North Africa.

3.2.2. MK Mutation Test for Variations in North Africa’s CPP

The MK mutation test was used to analyze North Africa’s CPP to detect whether there exists a mutation in the CPP series (Figure 8). Referring to Mann [23], the UF K versus UB k plotted by MATLAB analysis indicates an upward trend in the study series if the UF value is greater than 0, and a downward trend if it is less than 0. Based on a significance level of α = 0.05 , the critical value is ± 1.96 . When the curve exceeds the critical value, it indicates a significant trend of change. If the intersection of the UF K and UB k curves occurs and is between the critical lines, the time at which the intersection occurs is the mutation time. If the intersection is not between the critical lines, the intersection does not pass the 0.05 test, so the time at which the intersection occurs is not mutational. The intersection of the UF and UB curves for North Africa occurred in 1969 and lay between the critical lines, indicating that the intersection passed the significance test at the 95% confidence level and was the point in time when the mutation in CPP occurred. Before 1922, the UF value was less than 0, indicating a decreasing trend in CPP. Between 1922 and 1972, the UF value was greater than 0, indicating an increasing trend in UF. Thereafter, the UF value was consistently less than 0, indicating a decreasing trend in CPP, with a significant downward trend after 1988.

3.2.3. Spatial Variations in North Africa’s CPP

MK trend analysis and significance tests were performed on the raster images of the CPP of North Africa during 1901–2019, element by element, and the results are shown in Table 3 and Figure 9.
The mean annual CPP of North Africa for the period 1901–2019 was 3592.56 kg / hm 2 . The CPP was mostly concentrated in the range 0–5000   kg / hm 2 , distributed around the Sahara Desert, accounting for 40.84% of the area of North Africa and 11.52% of the overall area of Africa. Below 0 kg / hm 2 was concentrated in the Sahara Desert region, accounting for 32.23% of North Africa and 9.09% of Africa as a whole, mainly due to climatic characteristics such as high temperatures and low precipitation. Over 5000 kg / hm 2 was concentrated in the Atlas Mountains, accounting for 26.93% of North Africa and 7.59% of Africa as a whole. In all, 79.43% of North Africa revealed a decreasing trend in CPP, of which 19.58% was an extremely significant decrease, mainly in the Sahara Desert region of Libya, Egypt, and Sudan. The overall trend was mainly non-significant, accounting for 63.88% of the area of North Africa and 18.02% of the overall area of Africa, with a predominantly non-significant decrease.

3.3. Response Analysis of North Africa’s CPP to Climate Change

3.3.1. Temporal Analysis of the Constraints on CPP

To explore the response of CPP to climate change, the correlation between CPP, temperature, and precipitation in North Africa was analyzed using SPSS27 software (Table 4). As seen in Table 4, CPP in North Africa exhibited a negative correlation with temperature, with a correlation coefficient of −0.186. The correlation between CPP and temperature passed the significance test of 0.05, indicating that although the correlation between CPP and temperature was weak in North Africa, temperature was the main limiting factor for regional vegetation growth. The correlation between CPP and precipitation was high in North Africa with a correlation coefficient of 0.970 and passed the significance test, indicating that precipitation was the main limiting factor for regional vegetation growth. In general, temperature and precipitation were the main limiting factors for North Africa’s CPP, with precipitation being the stronger limiting factor.
As can be seen in Table 5, for every 1 °C increase in temperature and 1 mm decrease in precipitation, North Africa’s CPP decreased by 9.959 and 16.599 kg / hm 2 × a , respectively. The relationship between CPP, temperature, and precipitation depends to a large extent on climatic conditions. In the case of North Africa, higher temperature has an inhibiting effect on vegetation growth due to higher average annual temperature and lower precipitation. Precipitation, on the other hand, has a facilitating effect in North Africa.

3.3.2. Spatial Analysis of Constraints on CPP

The correlation between CPP and temperature in North Africa from 1901 to 2019 was mainly negative correlations, which accounted for 85.18% of the area of North Africa and 24.03% of the overall area of Africa (Table 6). As seen in Figure 10, positive correlations were mainly concentrated in the southern Sahara Desert region of Algeria and Libya, probably caused by the higher elevation of this region compared to the surrounding desert areas, thus resulting in different environmental conditions for vegetation survival. The overall CPP mainly indicated a very weak correlation with temperature, with a predominantly very weak negative correlation, accounting for 50.18% of North Africa’s area. The correlation between CPP and precipitation was mainly very strong positive in North Africa, which accounted for 89.90% of the area of North Africa and 25.36% of the overall area of Africa.

4. Discussion

4.1. Effects of Temperature and Precipitation on CPP

Our study found that temperature and precipitation were the main climatic variables affecting CPP, which agreed well with previous studies [28,29,30,31]. Precipitation plays a stronger limiting role, suggesting that water resources are a major constraint to agricultural development, which is consistent with other studies [32,33,34,35,36,37]. The main contributing factor may be that North Africa has a particularly arid climate due to its location near the Tropic of Cancer, which is controlled and influenced by the subtropical high-pressure zone and the predominantly downward flow of air, making it a typical tropical desert climate and a Mediterranean climate. Due to the dry and hot climate, there is little precipitation throughout the year, making it difficult to form rivers and lakes, and therefore, water sources are strained. Because of this, the problem of water sources has become a bottleneck for the economic development of the North African region, especially for agricultural production [32,33,34,35,36,37].
In this study, the results indicated that in the context of global warming, North Africa’s temperature has continued to rise, and precipitation was characterized by significant spatial variability, which fits well with previous studies [38,39]. The CPP was on a decreasing trend. This may be due to the fact that the majority of the African population depends on rain-fed agriculture and is heavily reliant on natural resources as a result of climate extremes [40,41,42]. Meanwhile, North African countries have difficulty in building facilities to cope with the adverse impacts of climate change due to poverty. Thus, in the context of global warming, North Africa faces frequent climatic disasters such as high temperatures and droughts, frequent water scarcity, and food security problems, and is severely impacted by climate change [43,44]. Climate change is having a significant impact on the CPP of North Africa, which is trending downwards.

4.2. Study Limitations and Future Research

This paper still has some limitations in terms of data and models. Firstly, in the analysis of the spatial and temporal characteristics and responses to climate change and CPP, the analysis results may be inaccurate because the accuracy of the raster data cannot be fully refined. Secondly, specific studies could be further conducted in the whole of Africa and also on a global scale under climate change scenarios and models. Finally, the Thornthwaite Memorial model primarily focuses on temperature and precipitation, lacking consideration for other factors [45,46]. CPP is influenced by complex interactions between climate and ecosystems. The Thornthwaite model’s simplicity may not capture these intricate relationships adequately, leading to limited accuracy in estimating productivity [47,48]. The model requires the use of empirical coefficients and parameters, which can be subjective and may need to be adjusted for specific regions, potentially leading to bias in the results. In the future, more advanced methods will be adopted for assessing CPP, such as Dynamic Vegetation Models (DVMs) [49,50,51], Eddy covariance (EC) flux data-driven models [52,53,54], Satellite-based models [55,56], and Gross Primary Productivity (GPP) Models [57,58].

5. Conclusions and Policy Implications

5.1. Research Conclusions

Based on the Thornthwaite Memorial model, this paper explored the spatial and temporal distribution of climate and CPP in North Africa during 1901–2019. From 1901 to 2019, the mean annual temperature in North Africa was generally on a highly significant upward trend, and the mean annual precipitation in North Africa was on a non-significant downward trend, with the climate in North Africa tending toward a ‘warm and dry’ future. The study also found that the CPP of North Africa was on a decreasing trend. Temperature and precipitation were the main climatic variables affecting CPP, with precipitation playing a stronger limiting role, indicating that water resources are the main factor limiting agricultural development in North Africa.

5.2. Policy Implications

If the CPP tends to decrease, this will be extremely detrimental to the development of local agro-pastoralism. Combined with climate change, which poses a serious threat to the rain-fed agriculture dominating most countries in the region [40,41,42,59], North Africa needs to adopt predictable and preventive policies to protect food security. For example, North Africa should establish food banks, adequate infrastructures, and efficient food distribution channels to reduce food losses [3,41,60]. Furthermore, in response to the scarcity of water resources, there is a need to develop water-efficient agriculture and to promote cold- and drought-resistant crop varieties. Agricultural products have a certain strategic importance for food security. Wheat (soft and durum) is currently used as the staple diet in North African countries. Alongside wheat, cold- and drought-tolerant crops such as millet, potatoes, highland barley, rye, and sugar beet can also be promoted in North Africa.
Agricultural policies in North Africa have been neglected for a long time. The vision of industrialization in an open economy has neglected the agricultural sector, and ODA has focused only on sectors other than agriculture [60]. The central role of the agricultural sector as an effective vector for resource conservation and an essential element in the fight against poverty, hunger, and global warming calls for a mature policy that puts agriculture first [61]. It is desirable to combine pro-poor strategies with food security policies to reduce the closely related poverty and hunger. Particular commitment should be made to the development of sustainable agriculture. Due to water and land resource constraints, some countries in North Africa have developed intensive agriculture, such as the entire Nile and Maghreb coastal areas in Egypt. And this type of agriculture has been criticized for its extensive use of chemical inputs (fertilizers, plant protection, energy, and seeds) [62,63]. Agriculture is an important means of securing the right to food in North Africa. North Africa must therefore develop an alternative, viable, and sustainable agriculture, one that aims to reconcile agriculture with the environment conducive to the biosphere [3].

Author Contributions

Conceptualization, Z.Z. and X.Z.; methodology, X.Z.; software, L.W. and C.Y.; validation, M.B., L.W. and Z.Z.; formal analysis, M.B.; investigation, L.W.; resources, X.Z.; data curation, L.W. and C.Y.; writing—original draft preparation, M.B. and L.W.; writing—review and editing, X.Z.; visualization, L.W.; supervision, Z.Z.; project administration, M.B.; funding acquisition, Z.Z. All authors have read and agreed to the published version of the manuscript.

Funding

This research was funded by Ministry of Science and Technology Key Research and Development Program: International Collaboration Project on Sustainable Utilization of Water Resources in the East African Great Lakes Region and Comprehensive Management of Lake Basin, grant number 2018YFE0105900-4A.

Data Availability Statement

Not applicable.

Conflicts of Interest

The authors declare no conflict of interest.

References

  1. Iturbide, M.; Gutiérrez, J.M.; Alves, L.M.; Bedia, J.; Cerezo-Mota, R.; Cimadevilla, E.; Cofiño, A.S.; Di Luca, A.; Faria, S.H.; Gorodetskaya, I.V.; et al. An update of IPCC climate reference regions for subcontinental analysis of climate model data: Definition and aggregated datasets. Earth Syst. Sci. Data 2020, 12, 2959–2970. [Google Scholar] [CrossRef]
  2. Piao, S.L.; Ciais, P.; Huang, Y.; Shen, Z.H.; Peng, S.S.; Li, J.S.; Zhou, L.P.; Liu, H.Y.; Ma, Y.C.; Ding, Y.H.; et al. The impacts of climate change on water resources and agriculture in China. Nature 2010, 467, 43–51. [Google Scholar] [CrossRef] [PubMed]
  3. Abdelhedi, I.T.; Zouari, S.Z. Agriculture and Food Security in North Africa: A Theoretical and Empirical Approach. J. Knowl. Econ. 2018, 11, 193–210. [Google Scholar] [CrossRef]
  4. Hervieu, B.; Abis, S. Euro-méditerranée. La sécurité alimentaire, une priorité politique. CIHEAM. In Déméter, Économie et Stratégies Agricoles; A.Colin: Paris, France, 2009; pp. 9–52. [Google Scholar]
  5. Raich, J.W.; Rastetter, E.B.; Melillo, J.M.; Kicklighter, D.W.; Steudler, P.A.; Peterson, B.J.; Grace, A.L.; Moore, B.; Vorosmarty, C.J. Potential Net Primary Productivity in South America: Application of a Global Model. Ecol. Appl. 1991, 1, 399–429. [Google Scholar] [CrossRef] [PubMed]
  6. Qin, Y.; Liu, J.; Shi, W.; Tao, F.; Yan, H. Spatial-temporal changes of cropland and climate potential productivity in northern China during 1990–2010. Food Secur. 2013, 5, 499–512. [Google Scholar] [CrossRef]
  7. Zhao, H.Y.; Tian, B.X.; Gong, L.J.; Qu, H.; Ji, S.; Li, X.; Zhang, X. Climate-induced potential productivity of forest vegetation during the past 308 years in Northern Daxingan Mountain Region, China. Acta Ecol. Sin. 2017, 37, 1900–1911. [Google Scholar]
  8. Gang, C.; Zhao, W.; Zhao, T.; Zhang, Y.; Gao, X.; Wen, Z. The impacts of land conversion and management measures on the grassland net primary productivity over the Loess Plateau, Northern China. Sci. Total Environ. 2018, 645, 827–836. [Google Scholar] [CrossRef]
  9. Cao, D.; Zhang, J.-H.; Yan, H.; Xun, L.; Yang, S.; Yun, B.; Zhang, S.; Yao, F.; Zhou, W. Regional Assessment of Climate Potential Productivity of Terrestrial Ecosystems and Its Responses to Climate Change Over China From 1980–2018. IEEE Access 2020, 8, 11138–11151. [Google Scholar] [CrossRef]
  10. Cao, D.; Zhang, J.; Xun, L.; Yang, S.; Wang, J.; Yao, F. Spatiotemporal variations of global terrestrial vegetation climate potential productivity under climate change. Sci. Total Environ. 2021, 770, 145320. [Google Scholar] [CrossRef]
  11. Bonner, J. The Upper Limit of Crop Yield. Science 1962, 137, 11–15. [Google Scholar] [CrossRef]
  12. Guo, J.P. Advances in impacts of climate change on agricultural production in China. J. Appl. Meteor. Sci. 2015, 26, 1–11. [Google Scholar] [CrossRef]
  13. Constantinidou, K.; Hadjinicolaou, P.; Zittis, G.; Lelieveld, J. Effects of climate change on the yield of winter wheat in the eastern Mediterranean and Middle East. Clim. Res. 2016, 69, 129–141. [Google Scholar] [CrossRef]
  14. Li, Z.J.; Duan, C.C.; Jin, L.L.; Hu, X.Q.; Li, B.; Yang, H.Y. Spatial and temporal variability of climatic potential productivity in Yunnan Province, China. Ying Yong Sheng Tai Xue Bao J. Appl. Ecol. 2019, 30, 2181–2190. [Google Scholar]
  15. Li, X.S.; Zheng, C.L.; Cao, C.Y.; Dang, H.K.; Sun, J.S.; Li, K.J.; Ma, J.Y. Analysis of Climatic Potential Productivity and Wheat Production in Different Producing Areas of the Northern Hemisphere. IOP Conf. Ser. Earth Environ. Sci. 2020, 427, 012010. [Google Scholar] [CrossRef]
  16. Gong, L.; Liu, D.; Jiang, L.; Li, X.; Lv, J. Distribution characteristics of climate potential productivity of soybean in frigid region and its response to climate change. Environ. Sci. Pollut. Res. 2021, 29, 7452–7464. [Google Scholar] [CrossRef] [PubMed]
  17. Wang, J.-R.; Zheng, J.; Su, J.; Zheng, B.-H.; Sun, Z.-Q. Inconsistent increasing of climate potential productivity resulting from global warming and land use transitions in the Dongting Lake Basin, from 2000 to 2020. J. Mt. Sci. 2023, 20, 1954–1967. [Google Scholar] [CrossRef]
  18. Zhang, T.; Gu, M.; Zhang, M.; Zhao, W.; Zou, F.; Wu, Y. Variation Characteristics of Climate Production Potential in Guangdong Province from 1988 to 2018. Chin. Agric. Sci. Bull. 2023, 39, 99–105. [Google Scholar]
  19. Liu, L.Z. Turbulence in North Africa and China’s Overseas Interest Maintenance. Mod. Int. Relat. 2012, 271, 46–51. [Google Scholar]
  20. Xue, L.Q.; Shi, B.Q.; Wang, L.; Yuan, S.; Zhang, C.; Pan, X. Achievements of CNPC’s high-efficiency exploration of offshore blocks in west Africa. China Pet. Explor. 2014, 19, 65–74. [Google Scholar]
  21. Lieth, H.; Box, E. Evapotranspiration and primary production: CW Thornthwaite Memorial Mode. Publ. Climatol. 1972, 25, 37–46. [Google Scholar]
  22. Lieth, H. Modeling the Primary Productivity of the World. Nat. Resour. 1975, 14, 237–263. [Google Scholar]
  23. Mann, H.B. Non-parametric test against trend. Econometrica 1945, 13, 245–259. [Google Scholar] [CrossRef]
  24. Kendall, M.G. Rank Correlation Methods; Hafner: New York, NY, USA, 1948. [Google Scholar]
  25. Gulahmadov, N.; Chen, Y.; Gulakhmadov, M.; Satti, Z.; Naveed, M.; Davlyatov, R.; Ali, S.; Gulakhmadov, A. Assessment of Temperature, Precipitation, and Snow Cover at Different Altitudes of the Varzob River Basin in Tajikistan. Appl. Sci. 2023, 13, 5583. [Google Scholar] [CrossRef]
  26. Wang, W.D.; Yi, Z.; Chen, D. Mann-Kendall Mutation Analysis of Temporal Variation of Apparent Stress in Qinba Mountains and Its Adjacent Areas. IOP Conf. Ser. Earth Environ. Sci. 2021, 660, 012112. [Google Scholar] [CrossRef]
  27. Chen, Y.; Deng, H.; Li, B.; Li, Z.; Xu, C. Abrupt change of temperature and precipitation extremes in the arid region of Northwest China. Quat. Int. 2014, 336, 35–43. [Google Scholar] [CrossRef]
  28. Luo, L.; Ma, W.; Zhuang, Y.; Zhang, Y.; Yi, S.; Xu, J.; Long, Y.; Ma, D.; Zhang, Z. The impacts of climate change and human activities on alpine vegetation and permafrost in the Qinghai-Tibet Engineering Corridor. Ecol. Indic. 2018, 93, 24–35. [Google Scholar] [CrossRef]
  29. Luo, Z.; Wu, W.; Yu, X.; Song, Q.; Yang, J.; Wu, J.; Zhang, H. Variation of Net Primary Production and Its Correlation with Climate Change and Anthropogenic Activities over the Tibetan Plateau. Remote Sens. 2018, 10, 1352. [Google Scholar] [CrossRef]
  30. Ge, W.; Deng, L.; Wang, F.; Han, J. Quantifying the contributions of human activities and climate change to vegetation net primary productivity dynamics in China from 2001 to 2016. Sci. Total Environ. 2021, 773, 145648. [Google Scholar] [CrossRef]
  31. Pang, Y.; Chen, C.; Guo, B.; Qi, D.; Luo, Y. Impacts of Climate Change and Anthropogenic Activities on the Net Primary Productivity of Grassland in the Southeast Tibetan Plateau. Atmosphere 2023, 14, 1217. [Google Scholar] [CrossRef]
  32. Allan, J.A. Water in the environment/socio-economic development discourse: Sustainability, changing management paradigms and policy responses in a global system. Gov. Oppos. 2005, 40, 181–199. [Google Scholar] [CrossRef]
  33. Howe, C.W. The effects of water resource development on economic growth: The conditions for success. In Water in a Developing World; Routledge: London, UK, 2019; pp. 202–218. [Google Scholar]
  34. Organisation for Economic Co-Operation, & Development (OECD). The Land-Water-Energy Nexus: Biophysical and Economic Consequences; IWA Publishing: Geneva, Switzerland, 2017.
  35. Lejars, C.; Daoudi, A.; Amichi, H. The key role of supply chain actors in groundwater irrigation development in North Africa. Hydrogeol. J. 2017, 25, 1593–1606. [Google Scholar] [CrossRef]
  36. Devlin, J. Challenges of Economic Development in the Middle East and North Africa Region; World Scientific: Geneva, Switzerland, 2010; Volume 8. [Google Scholar]
  37. Markantonis, V.; Reynaud, A.; Karabulut, A.; El Hajj, R.; Altinbilek, D.; Awad, I.M.; Bruggeman, A.; Constantianos, V.; Mysiak, J.; Lamaddalena, N.; et al. Can the Implementation of the Water-Energy-Food Nexus Support Economic Growth in the Mediterranean Region? The Current Status and the Way Forward. Front. Environ. Sci. 2019, 7, 84. [Google Scholar] [CrossRef]
  38. Karmalkar, A.V.; Bradley, R.S. Consequences of Global Warming of 1.5 °C and 2 °C for Regional Temperature and Precipitation Changes in the Contiguous United States. PLoS ONE 2017, 12, e0168697. [Google Scholar] [CrossRef]
  39. Shongwe, M.E.; van Oldenborgh, G.J.; van den Hurk, B.; de Boer, B.; Coelho, C.A.S. Projected Changes in Mean and Extreme Precipitation in Africa under Global Warming. Part I: Southern Africa. J. Clim. 2019, 22, 3819–3837. [Google Scholar] [CrossRef]
  40. Hope, K., Sr. Climate change and poverty in Africa. Int. J. Sustain. Dev. World Ecol. 2009, 16, 451–461. [Google Scholar] [CrossRef]
  41. Müller, C.; Cramer, W.; Hare, W.L.; Lotze-Campen, H. Climate change risks for African agriculture. Proc. Natl. Acad. Sci. USA 2011, 108, 4313–4315. [Google Scholar] [CrossRef]
  42. Lu, Y.Y.; Sun, W.; Fang, Y.Q.; Tang, W.A.; Deng, H.Q.; He, D.Y. Estimating the climatic potential productivity and the climatic capacity of food security based on the cropping structure in Anhui Province. Ecol. Environ. Sci. 2022, 31, 1293–1305. [Google Scholar]
  43. Zhao, Y.; Liu, S. Effects of Climate Change on Economic Growth: A Perspective of the Heterogeneous Climate Regions in Africa. Sustainability 2023, 15, 7136. [Google Scholar] [CrossRef]
  44. Winkler, K.; Gessner, U.; Hochschild, V. Identifying Droughts Affecting Agriculture in Africa Based on Remote Sensing Time Series between 2000–2016: Rainfall Anomalies and Vegetation Condition in the Context of ENSO. Remote Sens. 2017, 9, 831. [Google Scholar] [CrossRef]
  45. Liu, J.; Yu, W. Impact of Climate Change on Farmland Production Potentialin the Coastal Areas of Jiangsu Province during Nearly 50 Years. In Proceedings of the Artificial Intelligence and Security: 6th International Conference, ICAIS 2020, Hohhot, China, 17–20 July 2020; Proceedings, Part II 6. Springer: Singapore, 2020; pp. 568–581. [Google Scholar] [CrossRef]
  46. Zhang, X.; Xiao, W.; Wang, Y.; Wang, Y.; Wang, H.; Wang, Y.; Zhu, L.; Yang, R. Spatial-temporal changes in NPP and its relationship with climate factors based on sensitivity analysis in the Shiyang River Basin. J. Earth Syst. Sci. 2020, 129, 24. [Google Scholar] [CrossRef]
  47. Fisher, J.B.; Whittaker, R.J.; Malhi, Y. ET come home: Potential evapotranspiration in geographical ecology. Glob. Ecol. Biogeogr. 2010, 20, 1–18. [Google Scholar] [CrossRef]
  48. Ahmad, U.; Alvino, A.; Marino, S. Solar fertigation: A sustainable and smart IoT-based irrigation and fertilization system for efficient water and nutrient management. Agronomy 2022, 12, 1012. [Google Scholar] [CrossRef]
  49. Hartig, F.; Dyke, J.; Hickler, T.; Higgins, S.I.; O’hara, R.B.; Scheiter, S.; Huth, A. Connecting dynamic vegetation models to data—An inverse perspective. J. Biogeogr. 2012, 39, 2240–2252. [Google Scholar] [CrossRef]
  50. Snell, R.S.; Huth, A.; Nabel, J.E.M.S.; Bocedi, G.; Travis, J.M.J.; Gravel, D.; Bugmann, H.; Gutiérrez, A.G.; Hickler, T.; Higgins, S.I.; et al. Using dynamic vegetation models to simulate plant range shifts. Ecography 2014, 37, 1184–1197. [Google Scholar] [CrossRef]
  51. Moncrieff, G.; Scheiter, S.; Slingsby, J.; Higgins, S. Understanding global change impacts on South African biomes using Dynamic Vegetation Models. S. Afr. J. Bot. 2015, 101, 16–23. [Google Scholar] [CrossRef]
  52. Xie, X.; Li, A.; Tan, J.; Jin, H.; Nan, X.; Zhang, Z.; Bian, J.; Lei, G. Assessments of gross primary productivity estimations with satellite data-driven models using eddy covariance observation sites over the northern hemisphere. Agric. For. Meteorol. 2020, 280, 107771. [Google Scholar] [CrossRef]
  53. Ichii, K.; Ueyama, M.; Kondo, M.; Saigusa, N.; Kim, J.; Alberto, M.C.; Ardö, J.; Euskirchen, E.S.; Kang, M.; Hirano, T.; et al. New data-driven estimation of terrestrial CO2 fluxes in Asia using a standardized database of eddy covariance measurements, remote sensing data, and support vector regression. J. Geophys. Res. Biogeosci. 2017, 122, 767–795. [Google Scholar] [CrossRef]
  54. Dou, X.; Yang, Y. Estimating forest carbon fluxes using four different data-driven techniques based on long-term eddy covariance measurements: Model comparison and evaluation. Sci. Total Environ. 2018, 627, 78–94. [Google Scholar] [CrossRef]
  55. Xiao, X.; Hollinger, D.; Aber, J.; Goltz, M.; Davidson, E.A.; Zhang, Q.; Moore, B., III. Satellite-based modeling of gross primary production in an evergreen needleleaf forest. Remote Sens. Environ. 2004, 89, 519–534. [Google Scholar] [CrossRef]
  56. Xiao, X.; Zhang, Q.; Saleska, S.; Hutyra, L.; de Camargo, P.; Wofsy, S.; Frolking, S.; Boles, S.; Keller, M.; Moore, B., III. Satellite-based modeling of gross primary production in a seasonally moist tropical evergreen forest. Remote Sens. Environ. 2005, 94, 105–122. [Google Scholar] [CrossRef]
  57. Hilker, T.; Coops, N.C.; Wulder, M.A.; Black, T.A.; Guy, R.D. The use of remote sensing in light use efficiency based models of gross primary production: A review of current status and future requirements. Sci. Total Environ. 2008, 404, 411–423. [Google Scholar] [CrossRef] [PubMed]
  58. Cramer, W.; Kicklighter, D.W.; Bondeau, A.; Iii, B.M.; Churkina, G.; Nemry, B.; Ruimy, A.; Schloss, A.L.; Intercomparison, T. Comparing global models of terrestrial net primary productivity (NPP): Overview and key results. Glob. Chang. Biol. 1999, 5, 1–15. [Google Scholar] [CrossRef]
  59. Intergovernmental Panel on Climate Change. Climate Change 2023: Synthesis Report. In A Report of the Intergovernmental Panel on Climate Change. Contribution of Working Groups I, II and III to the Sixth Assessment Report of the Intergovernmental Panel on Climate Change; IPCC: Geneva, Switzerland, 2023. [Google Scholar]
  60. Vindel, B.; Jacquet, P. Agriculture, Développement et Sécurité Alimentaire. Les Cahiers Le Cercle des Économistes: Les Nouveaux Équilibres Agroalimentaires Mondiaux, Sous la Direction de Pierre JACQUET et Jean-Hervé LORENZI, UFR, droit, 2011, 73. Available online: https://www.cairn.info/les-nouveaux-equilibres-agroalimentaires-mondiaux--9782130587699-page-73.htm (accessed on 28 August 2023).
  61. Chabane, M.; Claquin, P. L’agriculture au cœur des stratégies de développement. Doc. Trav. Cent. D’etudes Prospect. 2013, 8, 14. [Google Scholar]
  62. Singh, R. Environmental consequences of agricultural development: A case study from the Green Revolution state of Haryana, India. Agric. Ecosyst. Environ. 2000, 82, 97–103. [Google Scholar] [CrossRef]
  63. Bodas-Salcedo, A.; Webb, M.J.; Bony, S.; Chepfer, H.; Dufresne, J.-L.; Klein, S.A.; Zhang, Y.; Marchand, R.; Haynes, J.M.; Pincus, R.; et al. COSP: Satellite simulation software for model assessment. Bull. Am. Meteorol. Soc. 2011, 92, 1023–1043. [Google Scholar] [CrossRef]
Figure 1. Site map of North African countries.
Land 12 01710 g001
Figure 2. Technical route of this research.
Land 12 01710 g002
Figure 3. Variations in mean annual temperature (a), mean annual maximum temperature (b), and mean annual minimum temperature (c) in North Africa during 1901–2019.
Land 12 01710 g003
Figure 4. Variations in mean annual precipitation (a), annual maximum precipitation (b), and annual minimum precipitation (c) in North Africa during 1901–2019.
Land 12 01710 g004
Figure 5. Mean annual temperature (a), MK trends (b), and significance tests (c) in North Africa during 1901–2019.
Land 12 01710 g005
Figure 6. Mean annual precipitation (a), MK trends (b), and significance tests (c) in North Africa during 1901–2019.
Land 12 01710 g006
Figure 7. Variations in climate potential productivity for North Africa during 1901–2019.
Land 12 01710 g007
Figure 8. MK mutation test for climate potential productivity for North Africa during 1901–2019. UF refers to a standard normal distribution, which is a sequence calculated according to time series. UB is applied to the inverse sequence of the time series.
Land 12 01710 g008
Figure 9. Climate potential productivity (a), Mann–Kendall trends (b), and significance tests (c) for North Africa during 1901–2019.
Land 12 01710 g009
Figure 10. Correlation of climate potential productivity with temperature (a) and precipitation (b) in North Africa during 1901–2019.
Land 12 01710 g010
Table 1. Distribution of mean annual temperature and mean annual precipitation in North Africa during 1901–2019.
Temperature Range (°C)Proportion of Zoning Area (%)Proportion of the African Area (%)Precipitation (mm)Proportion of Zoning Area (%)Proportion of the African Area (%)
10–152.130.600–50086.0824.29
15–2011.543.25500–100010.783.03
20–2551.2914.471000–15003.070.86
25–3035.049.881500–16000.070.02
28.2 28.2
Table 2. Significance of trends in mean annual temperature (%) and mean annual precipitation (%) in North Africa during 1901–2019.
Temperature Precipitation
SignificanceProportion of Zoning Area (%)Proportion of the African Area (%)SignificanceProportion of Zoning Area (%)Proportion of the African Area (%)
Extremely significant decrease00Extremely significant decrease23.296.56
Significant decrease00Significant decrease9.762.75
Non-significant decrease00Non-significant decrease51.6414.57
Non-significant increase00Non-significant increase10.562.98
Significant increase00Significant increase2.410.68
Extremely significant increase10028.2Extremely significant increase2.340.66
28.2 28.2
Table 3. Distribution and significance of trends of climate potential productivity in North Africa during 1901–2019.
CPP (kg/hm2)Proportion of Zoning Area (%)Proportion of the African Area (%)SignificanceProportion of Zoning Area (%)Proportion of the African Area (%)
–032.239.09Extremely significant decrease 19.585.52
0–500040.8411.52Significant decrease9.42.65
5000–10,00011.963.37Non-significant decrease50.4514.24
10,000–15,0007.312.06Non-significant increase13.433.78
15,000–20,0007.592.14Significant increase 3.220.91
20,000–0.070.02Extremely significant increase 3.921.1
28.2 28.2
Table 4. Correlation analysis of climate potential productivity with temperature and precipitation.
Geographic ZonesCorrelation AnalysisPartial Correlation Analysis
TemperaturePrecipitationEvapotranspirationTemperaturePrecipitation
North Africa−0.186 *0.970 **0.985 **−0.072 *0.969 **
Note: * and ** denote passing the significance levels of 0.05 and 0.01, respectively.
Table 5. Regression analysis of climate potential productivity with temperature and precipitation.
Geographic ZonesTemperaturePrecipitation
North Africa−9.95916.599 **
Note: ** denote passing the significance levels of 0.01.
Table 6. Correlation of climate potential productivity with temperature and precipitation in North Africa during 1901–2019.
CorrelationTemperaturePrecipitation
Proportion of Zoning Area (%)Proportion of the African Area (%)Proportion of Zoning Area (%)Proportion of the African Area (%)
Very Strong Negative Correlation006.571.85
Strong Negative Correlation0.420.1100
Moderate Negative Correlation6.081.7200
Weak Negative Correlation28.508.0400
Very Weak Negative Correlation50.1814.163.530.99
Very Weak Positive Correlation9.652.7200
Weak Positive Correlation3.671.0400
Moderate Positive Correlation0.350.0900
Strong Positive Correlation0.280.0800
Very Strong Positive Correlation0.870.2489.9025.36
28.20 28.20
Disclaimer/Publisher’s Note: The statements, opinions and data contained in all publications are solely those of the individual author(s) and contributor(s) and not of MDPI and/or the editor(s). MDPI and/or the editor(s) disclaim responsibility for any injury to people or property resulting from any ideas, methods, instructions or products referred to in the content.

