Article

Spatiotemporal Evolution and Mechanisms of Polder Land Use in the “Water-Polder-Village” System: A Case Study of Gaochun District in Nanjing, China

School of Architecture, Southeast University, Nanjing 210096, China
*
Author to whom correspondence should be addressed.
Land 2023, 12(9), 1714; https://doi.org/10.3390/land12091714
Submission received: 16 July 2023 / Revised: 22 August 2023 / Accepted: 30 August 2023 / Published: 2 September 2023

Abstract

:
This study tries to gain an understanding of the unique spatial patterns of polder areas. Starting from a typical “water-polder-village” combination of spatial elements, our study begins by identifying land use in the polder area using Sentinel-2 data and unsupervised machine learning techniques, taking Gaochun District, Nanjing (China), as an example. Next, we conducted a spatial analysis of change for different years using multiple land-use change indices. Finally, geographically weighted regression (GWR) was developed to account for the heterogeneity of spatial patterns and visualize the spatial distributions of the estimated coefficients. The results, derived from the indices we have constructed, indicate that the water-polder-village is the main subject of spatial pattern changes, with spatial replacement of water and polder and incremental quantitative changes in village areas. Additionally, the main source of existing village land comes from the occupation of polders. Furthermore, the impacts of natural and ecological, development and construction, population, and economic factors on the spatial patterns of the polder area exhibit spatiotemporal heterogeneity. Meanwhile, in rapidly developing areas, population, economy, and construction development may negatively impact the protection of polders. The results provide a reference for the construction and protection of production, living, and ecological spaces in polder areas.

1. Introduction

Polders are cropland systems created by building dikes in wetlands and other low-lying areas [1,2]. To increase the space for food production, people living around wetlands have been continuously reclaiming wetlands for thousands of years, in part by creating polders [3]. Polders are widely distributed in agricultural production areas worldwide; countries with many polders include the Netherlands, Belgium, Bangladesh, and China. In addition to playing a key role in human agricultural production, polders have a critical impact on the formation of settlements in rural areas and the flexible allocation of water systems. Throughout the world, polders, settlements, and water systems have maintained relatively stable and mutually beneficial spatial relationships, forming constantly evolving human ecological systems [4]. However, human production and livelihoods have had a series of impacts on the spatial pattern of polder areas [5]. Land-use changes in polder areas, represented by the occupation of cropland, alteration of water networks, and rapid expansion of construction land, indicate that the traditional development concept of moderately exploiting natural terrain in polder areas has been replaced by the engineering approach of conquering nature through artificial transformation [6]. This change has impacted production, living, and ecological spaces in the polder area. Facing the imbalance between traditional human ecological systems and the concept of sustainable development, it is crucial to analyze the factors producing and impacts of changes in the spatial patterns of polder areas and explore measures to protect and preserve polder.
Existing research on polders has largely focused on analyzing the historical distribution patterns and landscape morphology of these cropland systems [3,7,8]. For example, Li et al. [9] reconstructed the spatiotemporal distribution of polders in China’s Dongting Plain from 1368 to 1980 and examined the possible relationships between the spatial and temporal distribution of polders, regional environmental changes, and socioeconomic history. Regarding the landscape form, scholars have analyzed the typology, morphology, and adaptive transformation of the polder landscape, discussing the modes of spatial organization and protection for the traditional polder landscape system [10].
Some related studies have focused on polders and water, considering the polder as a product of hydraulic engineering originally created to combat floods. Existing studies typically discuss polders based on hydraulic phenomena [11], including the shape and structure of polder hydraulic facilities [12], the impact of polders on floods [13,14,15], and the management of water resources [16,17]. A few studies have integrated polders as a combination of spatial structure and cultural expression, discussing them from the perspective of water heritage to explore historical perceptions of polders, their symbolism, and the impacts of water on polders [18].
Centuries-old interactions between humans and water have resulted in diverse polder landscapes [11]. In addition, the unique geographical environment of the polders has created a distinctive society in the polder area [19]. Most studies on the relationship between polders and settlements emphasize the essential role of polders in individual, specific (single or multiple) settlements. Fei’s research in the 1930s demonstrated that the farming and maintenance of polders require a significant amount of labor, thus necessitating a close-knit community to sustain them [20].
In recent years, studies have shown that close social interactions exist between villages in polder areas, which form tight-knit rural communities [19]. However, few studies have specifically addressed polder settlements, including their morphology [21], customs and culture, and village management [22]. Some studies have attempted to explore the planning and design of polder settlements [23,24]. Research on the spatial relationship between polders and settlements is limited.
Due to the scarcity of available resources, existing studies have mainly relied on local gazetteers 1 (See the end of the article for details), old topographic maps, and historical documents [9,18,25,26]. In recent years, scholars have utilized remote sensing data, which offer higher precision and spatial resolution, to conduct research on polders. For instance, one study utilized visual interpretation techniques to extract polder patches from Google Earth and combined these data with information from historical maps and local gazetteers as a data source [9]. Landsat 8 satellite remote sensing data and survey drawings have also been used in previous studies [8].
Regarding methodology, most studies have focused on landscape morphology analysis, including spatial pattern analysis, texture identification, and interpretation of morphological indices [6,8,11]. In recent years, a few studies have employed spatial analysis models and machine learning methods to investigate the spatial patterns of polders. For example, a constrained cellular automata model has been applied to reconstruct historical arable lands [27]. Additionally, machine learning methods such as the self-organizing map (SOM) neural network and the K-means algorithm have been applied to reconstruct the landscape texture of polders [28].
Overall, recent studies have mainly focused on the discussion of individual elements within the polder area or on the relationships between two specific elements. Few studies have attempted to analyze the broader “water-polder-village” system as an object of analysis for land-use change in the polder area. In terms of methodology, studies using higher spatial resolution and spatial analysis models in polder areas are limited. In this study, taking Gaochun District, Nanjing (China), as an example, we explore the spatiotemporal evolution and driving mechanism of the “water-polder-village,” using Sentinel-2 data, land use indices, and the geographically weighted regression (GWR) model. The research results provide a reference for land-use changes in the polder area in Gaochun and offer new ideas for the inheritance and protection of the human ecological system in similar areas.

2. Materials and Methods
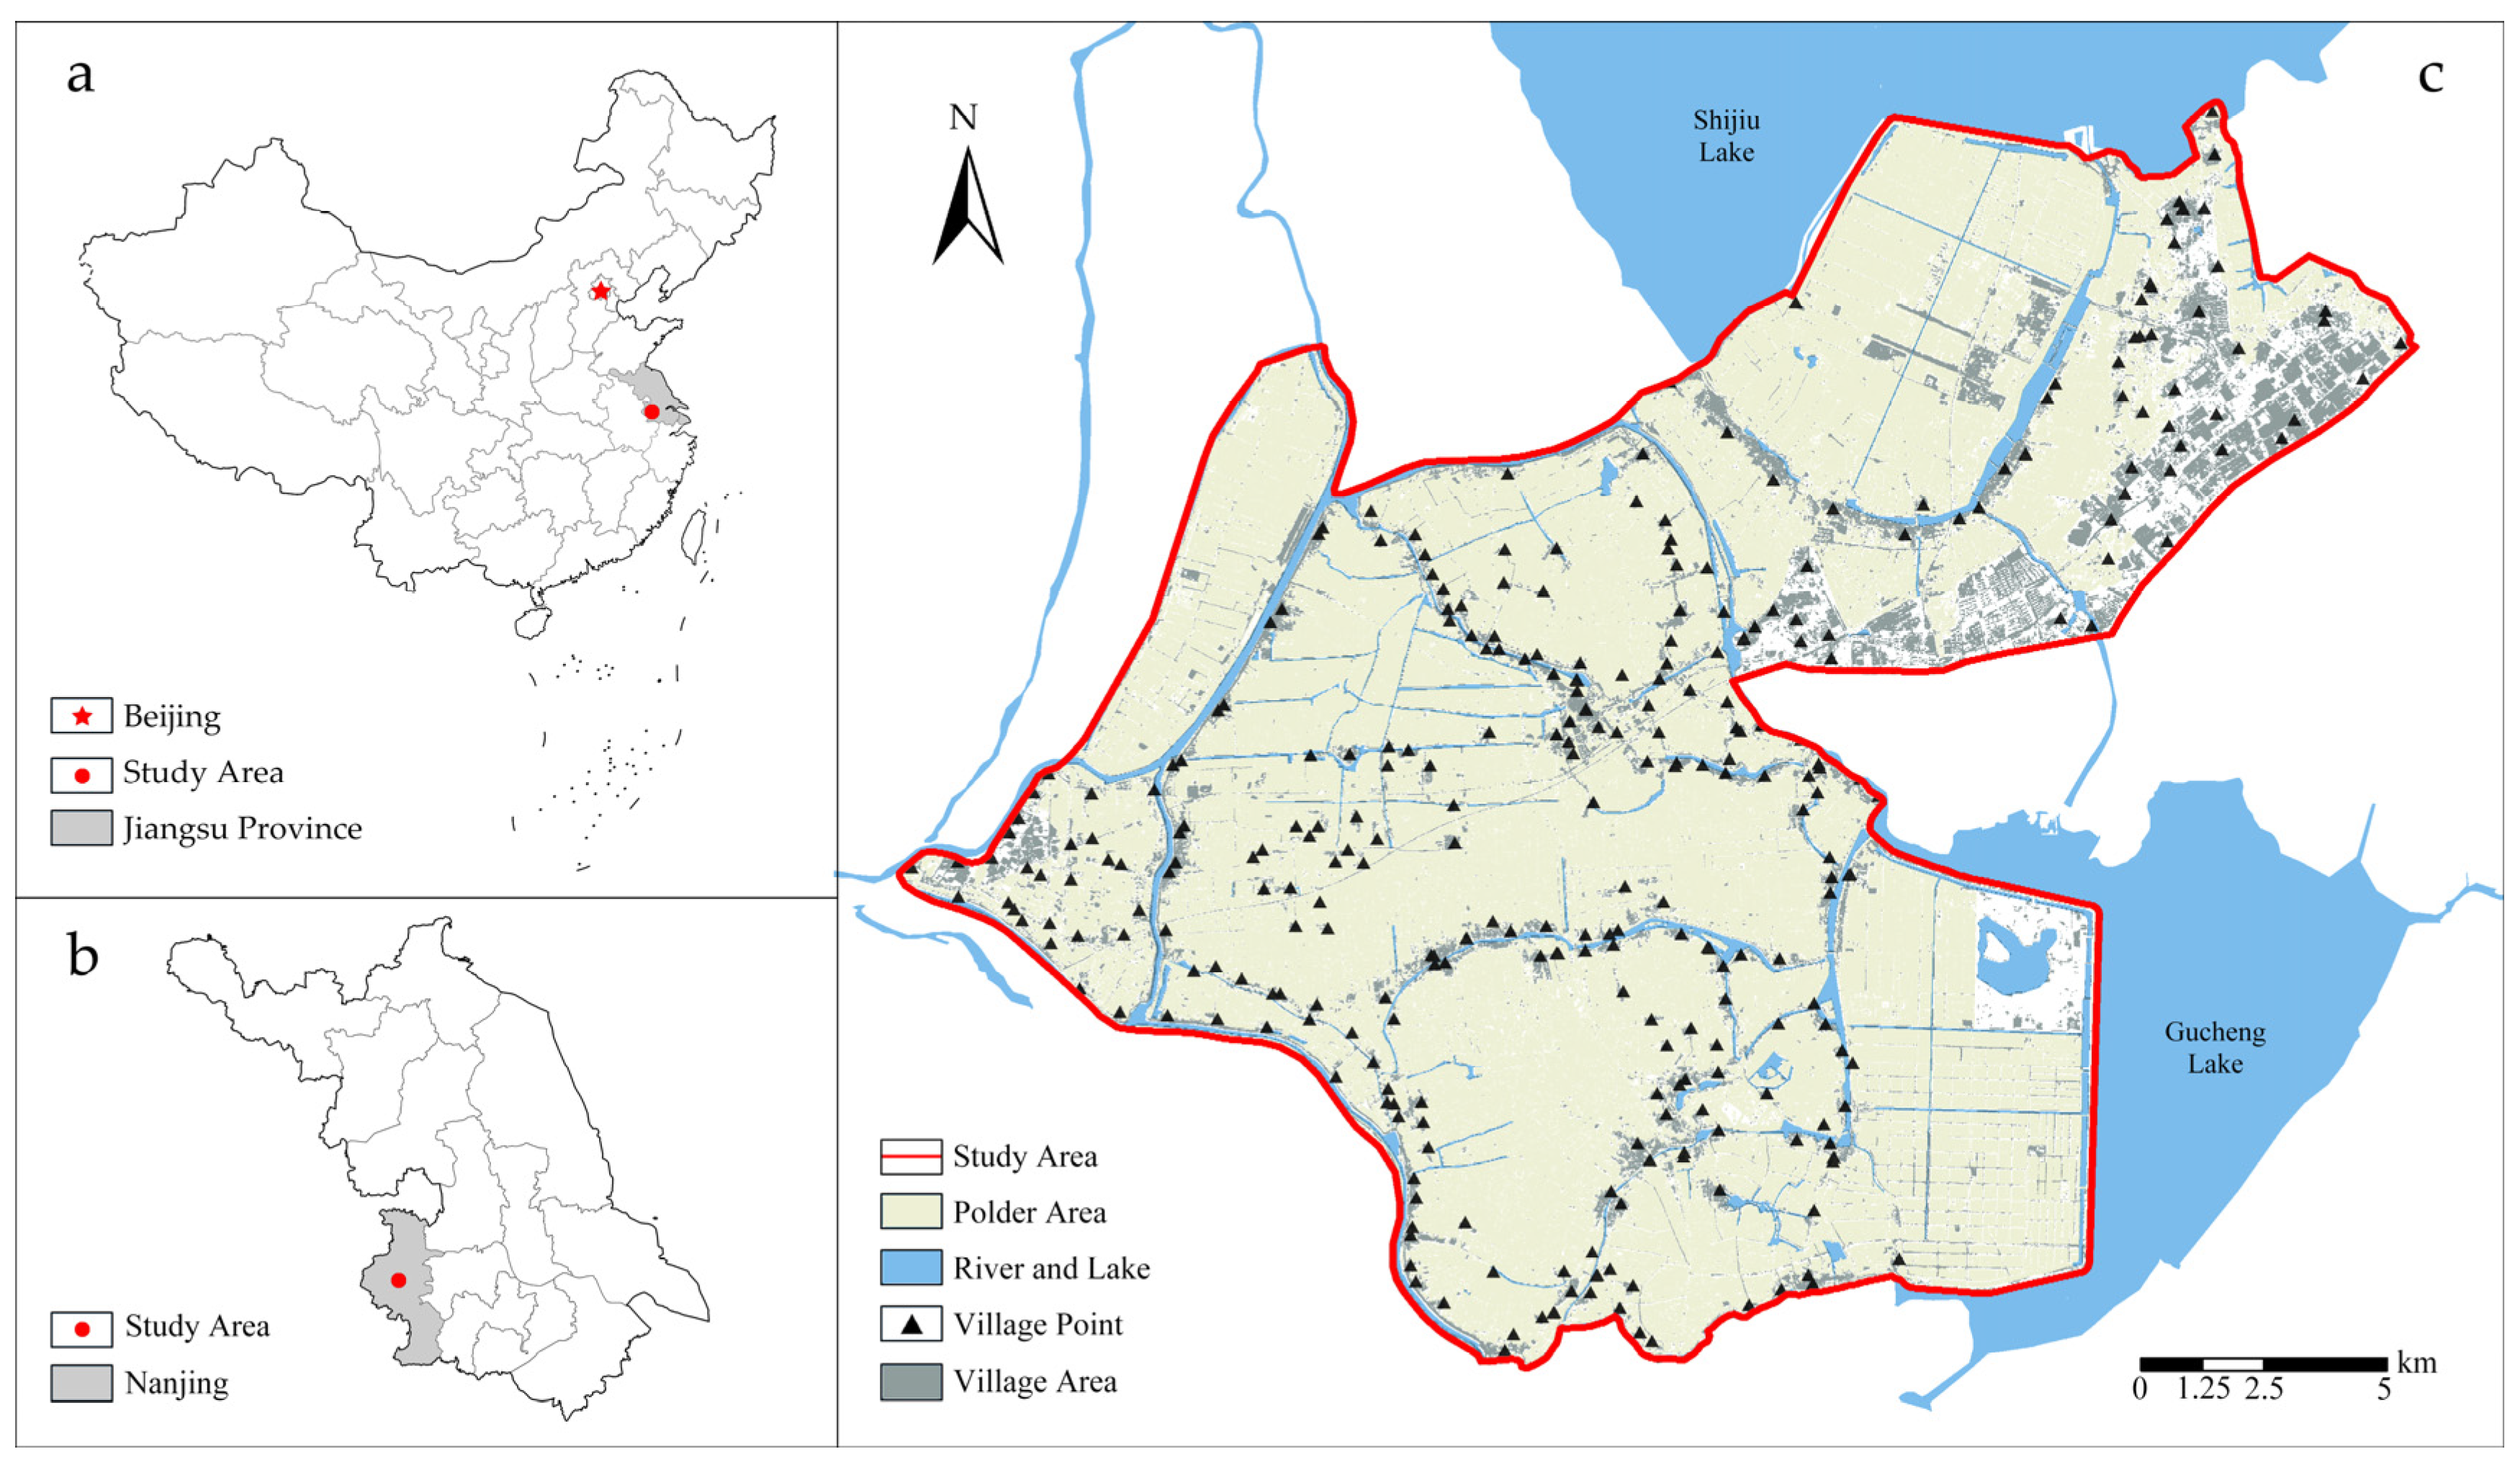
2.1. Study Area

In China, polder originated in the Spring and Autumn Period, before the common era, and its forms and production processes matured around 1000 CE [19]. Its distribution is primarily concentrated in two regions: the middle reaches of the Yangtze River (including Hunan, Hubei, and Jiangxi) and the Yangtze River Delta (including Anhui, Jiangsu, Zhejiang, and Shanghai) [19]. The study area is located in Gaochun District, Nanjing, Jiangsu Province, which is part of the Yangtze River Delta. It is adjacent to Shijiu Lake and Gucheng Lake in the north and east, with a total area of 28,037.22 hectares (Figure 1). As a typical polder area in the Yangtze River Delta, the area has a long history of land reclamation and lake enclosure activities, dating back to the Wu in the late Spring and Autumn Period, around 770 BCE [19]. Over the past millennia, the distribution of the water network, agricultural production, and the daily lives of residents have been closely interrelated.
We use “water-polder-village” in this article to refer to the fundamental spatial elements and land use of the polder area. Figure 2 presents the land-use classification and illustration. Lakes, rivers, streams, and ditches for drainage were merged into “water”; polders and other green spaces are classified as “polder”; and finally, “village” represents artificial or constructed facilities, such as buildings, dikes, roads, squares, and so on.

2.2. Data

Several studies focusing on polder areas have indicated the necessity of gathering land-use data at different scales, ranging from local to regional, in order to obtain data with suitable precision and spatial resolution (9,24). Owing to the small-scale, intricate water network of the study area’s polders, obtaining high spatial resolution and accurate land-use data is the primary issue that needs to be addressed. Drawing on relevant research, we selected Sentinel-2 data as the base data for our study and employed principal component analysis (PCA) and the K-means algorithm to derive land-use data for the polders [29,30,31].
Sentinel-2 data were obtained from the Level-2A product publicly released by the European Space Agency (ESA), which can be freely accessed on the Copernicus Open Access Hub 2. Level-2A data, compared to lower-level data such as Level-0 and Level-1, refers to calibrated and preprocessed Sentinel-2 data, which exhibit higher quality and usability. The data were generated by the multispectral instrument (MSI) onboard the Sentinel-2 satellite, which was primarily designed to provide high-resolution multispectral remote sensing images for land cover/use, forest, and vegetation monitoring; water monitoring; global crop monitoring; and disaster monitoring. Compared to other same-type spatial resolution satellite images, Sentinel-2 has clear advantages in temporal resolution, spatial resolution, and spectral range. For temporal resolution, the Sentinel-2 satellite consists of two satellites with a repeat cycle of 10 days each; when combined, they acquire images of the same area every five days, with data collection beginning in June 2015. Sentinel-2 offers a distinct advantage over other data types, with spatial resolutions ranging from 10 m to 60 m. Finally, the Sentinel-2 data cover 13 spectral bands, a broader range of bands than other data, such as Landsat data, which enables the capture of various additional surface features.
In the land use classification, to improve the efficiency of Python program classification, this study utilized Principal Component Analysis (PCA) to process the image data of 13 bands [31,32]. PCA is a widely used dimensionality reduction method in statistics and machine learning. Studies have shown that using PCA for land-use classification is more effective than directly using the entire original dataset [33]. After calculation, it was found that when the number of principal components extracted was four, the variances explained by the principal components in 2017 and 2022 were 95.56% and 95.89%, respectively, making them suitable for further analysis.
Next, we applied the K-means algorithm, an unsupervised machine learning technique, to classify land use in the polder area using two years of data. Studies have shown that K-means is effective for image classification, urban spatial analysis, and land-use classification [28,29,34]. The land use categories considered in this study are shown in Figure 2. We found that directly clustering the polder area using three first-level categories (corresponding to the classification in Figure 2) in the program resulted in low accuracy. Thus, to improve accuracy, we first used the K-means algorithm to cluster land use into seven categories, corresponding to the seven second-level land-use types in Figure 2. Next, we labeled each cluster with its respective first-level category, which resulted in three elements: water, polder, and village. Figure 3 displays the satellite images for 2017 and 2022 along with the classification of these three elements. By comparing our classification results with current satellite images, we observed that our method yielded relatively accurate land-use categories for the research area. We used software programs including SNAP 9.0.0, Python 3.9, and ArcGis10.2. The data were recorded on 9 October 2017, and 3 October 2022, respectively.

2.3. Methodology

This section provides a detailed description of the methods used in the study, including the land-use change index, driving factors, and driving force model.

2.3.1. Index

After obtaining the land-use data and referring to relevant research on land-use change [35,36,37], we utilized three indices to discuss transfer between different land-use types. These indices are “land-use transfer flow,” “activity degree of land use,” and “dominant change” indices. We used them to analyze the amount of land-use change, the degree or extent of land-use activity, and the main types of change among water, polder, and village use. The following are brief descriptions of each index.

Land-Use Transfer Flow

The land-use transfer flow and net land-use transfer flow were used to characterize numerical changes in land-use transfers for each type. Land-use transfer flow represents the total area of land-use changes that occurred during the study period, which is the sum of inflow and outflow. The net land-use transfer flow, defined as the difference between inflow and outflow during the study period, represents the net area of land-use change for a type of land use. These two indices are calculated as follows:
L f = L i n + L o u t
L n f = L i n L o u t
where L f is the land-use transfer flow, L n f is the net land-use transfer flow, L i n is the inflow amount, and L o u t is the outflow amount.

Degree of Land Use

The degree of land-use activity, based on the calculation of land-use transfer flow, is used to characterize the degree of change in a type of land use relative to its existing distribution. Specifically, it is the ratio of land-use transfer flow (the sum of outflow and inflow) to the total area of existing land use, and the formula is
L a = ( L o u t + L i n ) A 1 / t × 100 %
where L a is the activity degree of land-use, A 1 is the initial area of the land-use type during the study period, and t is the study period (unit is year).

Dominant Change Index

The dominant change index ( D C ) is used to characterize the type of change in a single land-use component during the study period, which can be classified into “spatial replacement” and “quantitative change.” When land-use type A is converted to land-use type B in one area while simultaneously converting land-use type B to land-use type A in another area, this type of land transformation is referred to as spatial replacement [35], whereas if land-use type A is converted to land-use type B in one area and an A-to-B conversion occurs in another area simultaneously, this is referred to as a quantitative change in land use. Generally, the presence of both spatial replacement and quantitative changes in land use within a specific area necessitates the use of the D c index to precisely classify the main types of land-use change based on numerical values. The dominant change index is calculated according to land-use transfer flow and net land-use transfer flow. D c ≤ 50% indicates that spatial replacement is dominant, while D c > 50% indicates that land-use conversion is dominated by quantitative change. In extreme cases, when the D c index is equal to 1, it indicates that land-use changes are solely quantitative changes, while a value of 0 indicates that land-use changes are solely spatial replacement changes. The calculation formula is as follows:
D c = | L i n L o u t | L f × 100 % = | L n f | L f × 100 %

2.3.2. Factors

To investigate the driving forces behind land-use changes in the polder area, we divided the research area into rectangular raster units of 500 m × 500 m as spatial analysis units and used the proportion of polder in each grid as the dependent variable (Y) of the driving force model. In addition, we referred to the literature to identify six categories of driving factors (independent variables): ecology, transportation, topography, population, services, and construction [36,38,39].
Each driving factor corresponds to an independent variable, and the specific indicators and calculation methods are listed in Table 1. The data for distance to water (X1) and distance to road (X3) were obtained from the OpenStreetMap (OSM) dataset 3. The elevation data (X2) were obtained from the ALOS PALSAR dataset, which is freely provided to the public by the US National Aeronautics and Space Administration (NASA) with a resolution of 12.5 m 4. Population density (X5) is sourced from the WorldPop open dataset, with data from the year 2020 5. We then extracted the POI data for the study area from the Amap Open Platform 6. The catering service POI was used to calculate the density of catering points (X6). Additionally, we used the keyword “villagers’ committee” to extract POI data for villages in the polder area and calculated the distance from each grid center point to the nearest village (X4). The spatial distributions of the independent variables are presented in Appendix A Figure A1, Figure A2, Figure A3, Figure A4, Figure A5 and Figure A6.

2.3.3. Model

Regression analysis is commonly used to explore the driving relationships between dependent and independent variables. OLS and other traditional regression methods are commonly employed to analyze data by assuming that the relationship between the dependent and independent variables is consistent in space [40]. In contrast, the geographically weighted regression (GWR) model allows the estimation of coefficients that vary locally in space, thus explaining the spatial heterogeneity of the impacts of independent variables [41,42]. We used the GWR model to explore the mechanisms underlying the spatiotemporal evolution in the study area. The GWR model formula is as follows:
y i = β i u i , v i + k = 1 n β i k u i , v i x i k + ε i
where y i is the dependent variable at location i , that is, the polder proportion of grid i in the research area. Then, u i , v i are the coordinates of the center point of the i -th grid, and β i u i , v i are the intercepts of the i -th grid. Further, x i k represents the value of the k -th independent variable at grid i , and n is the number of independent variables. In addition, β i k u i , v i is the estimated coefficient of the k -th independent variable in grid i ; then, ε i is the random error at the grid i . By estimating the independent variable with differences across different spatial locations, it is possible to observe the spatial heterogeneity of the effects of independent variables on the dependent variable more accurately. We used ArcGIS 10.2 to build the GWR model.
All variables were normalized before regression analysis to eliminate dimensional differences. Additionally, to avoid potential multicollinearity between the variables, a variance inflation factor (VIF) test was performed, which was obtained from the OLS model. Third, considering the spatial autocorrelation that may exist in the dependent variable in each grid, a spatial autocorrelation test was required before conducting the GWR analysis. Drawing on relevant literature [43,44,45], we employed Moran’s I test to examine the spatial autocorrelation of the independent variable.

3. Spatiotemporal Evolutions
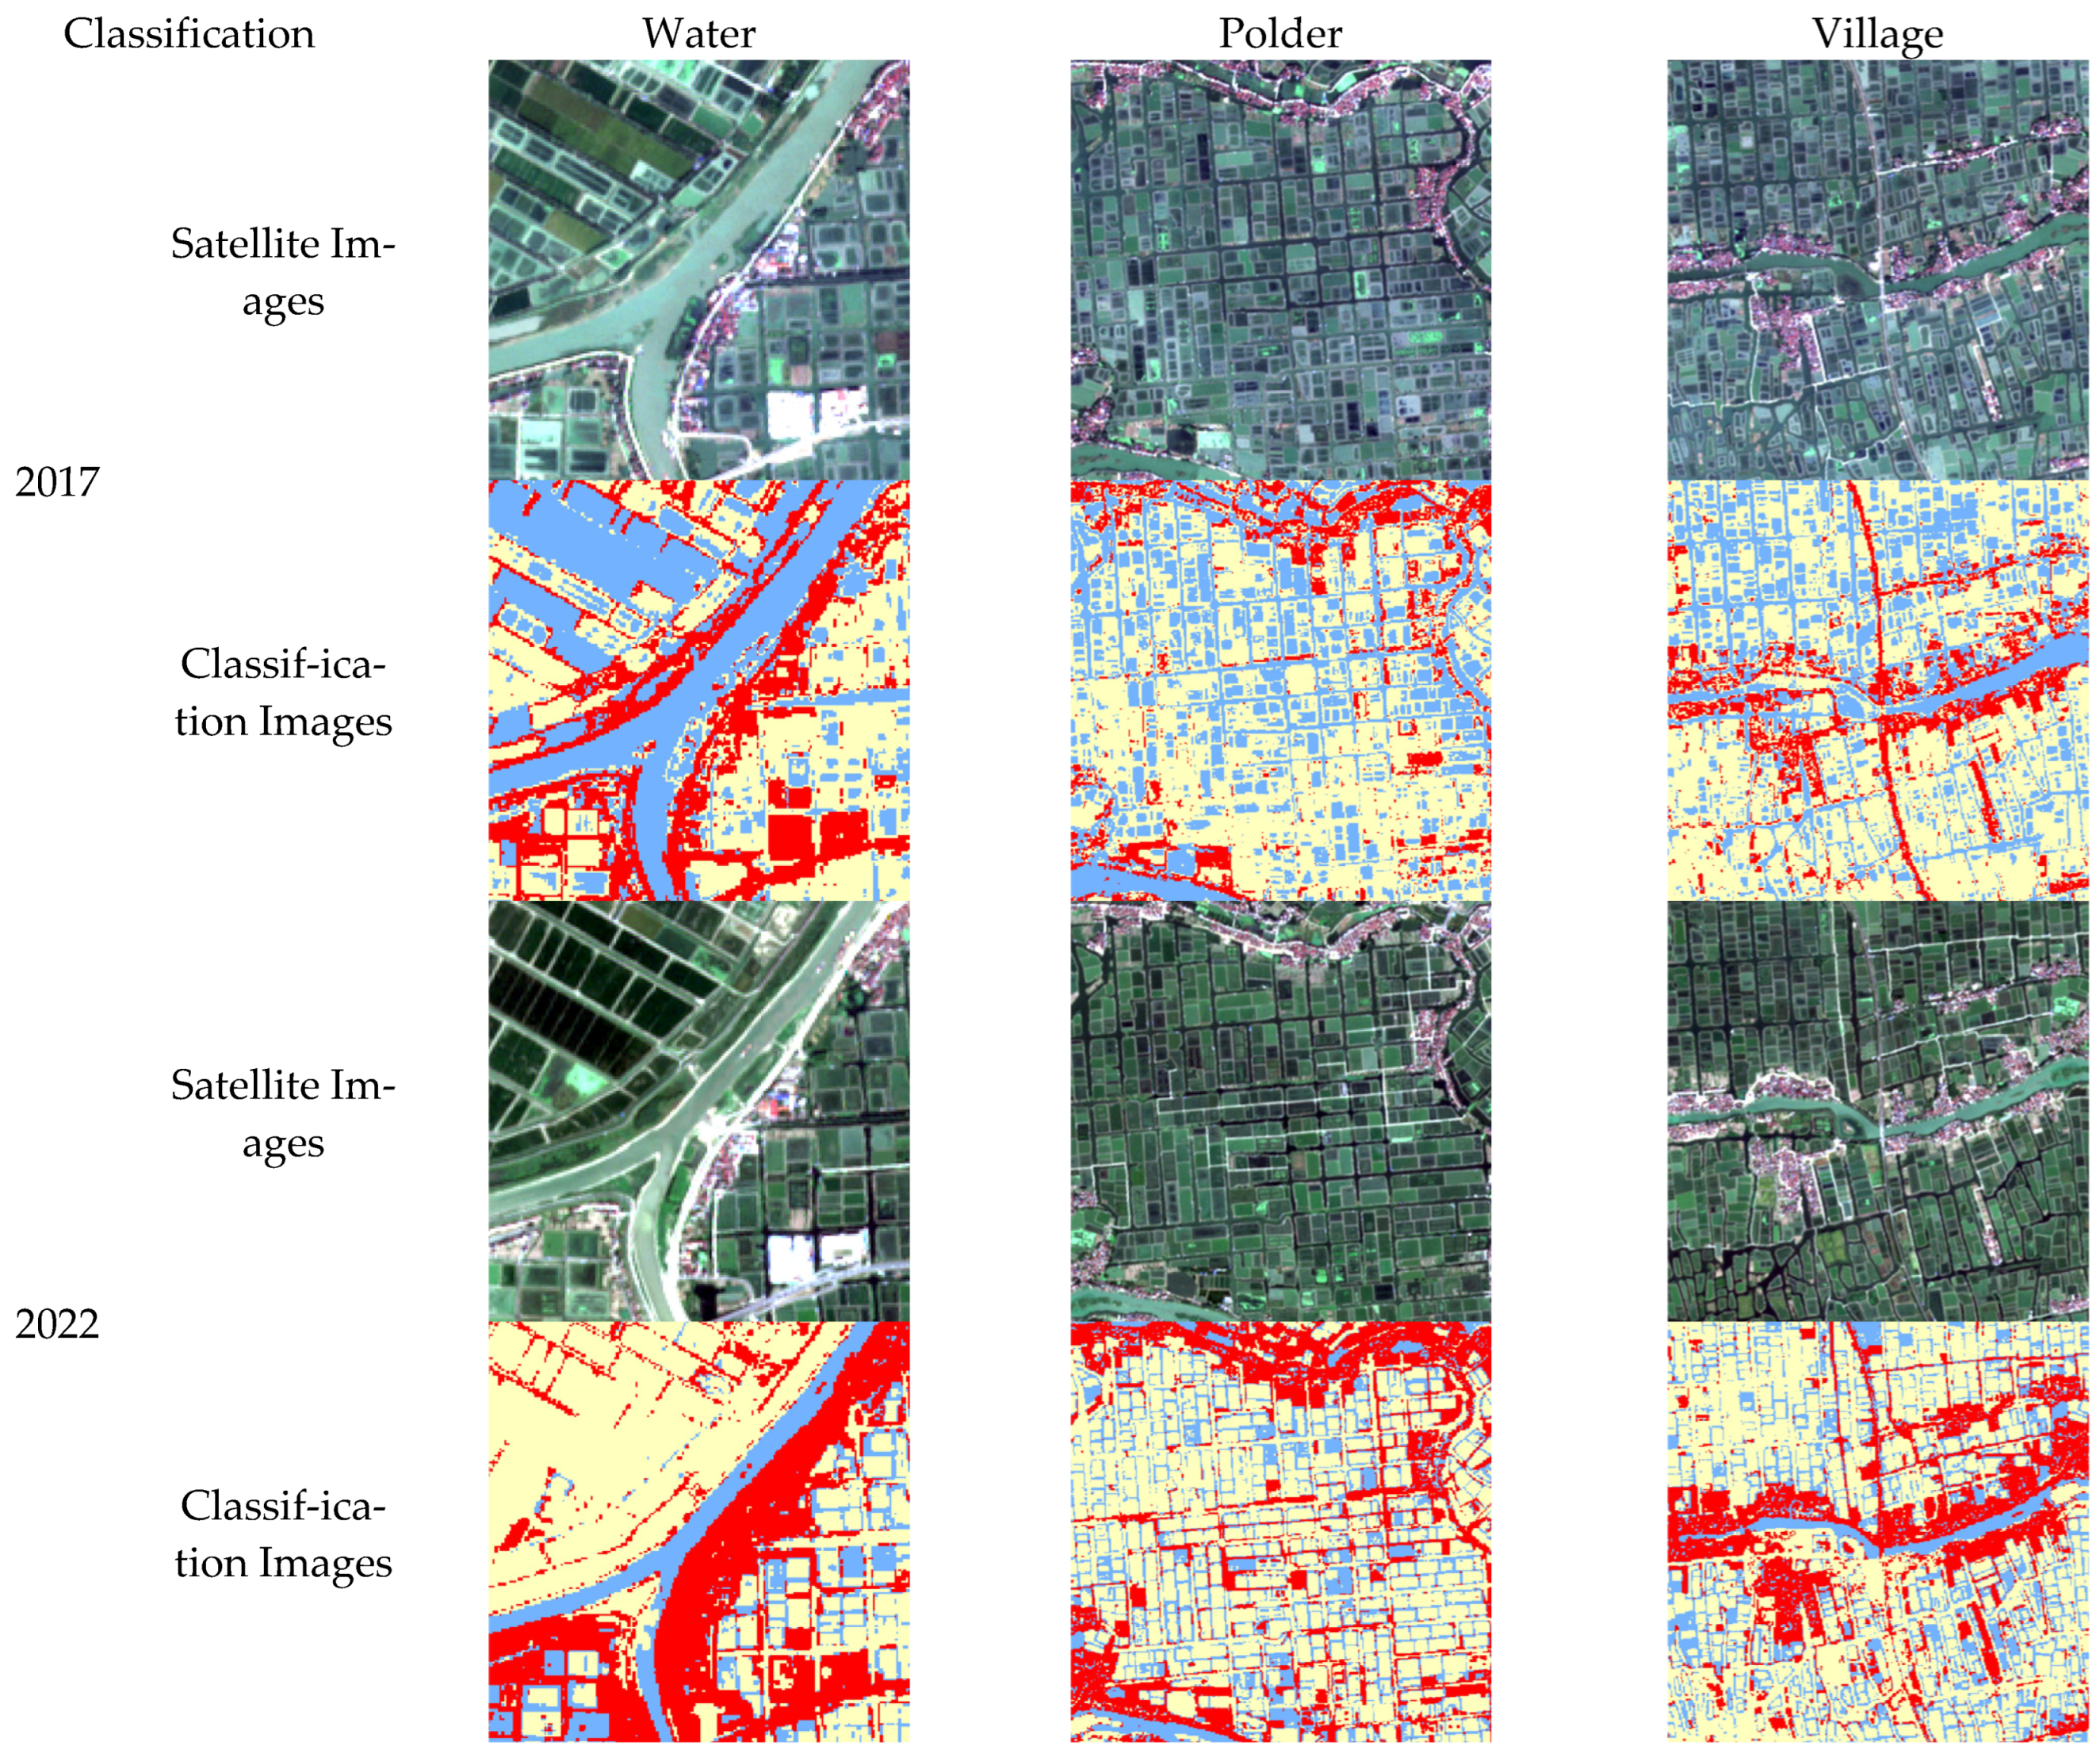
3.1. Land Use

Throughout the study period, polder was the predominant land-use type in the research area. However, the total polder area decreased during this period (Figure 4 and Table 2). In 2017, polder land area accounted for 53.15% of the total research area; by 2022, this proportion had decreased to 48.95%, reflecting a total reduction of 1177.99 ha. Furthermore, during the period 2017–2022, there was a decrease in the water area by 1773.16 ha, accounting for 6.32% of the total. Only village land recorded an increase of 2951.15 ha, accounting for 10.53% of the total area.

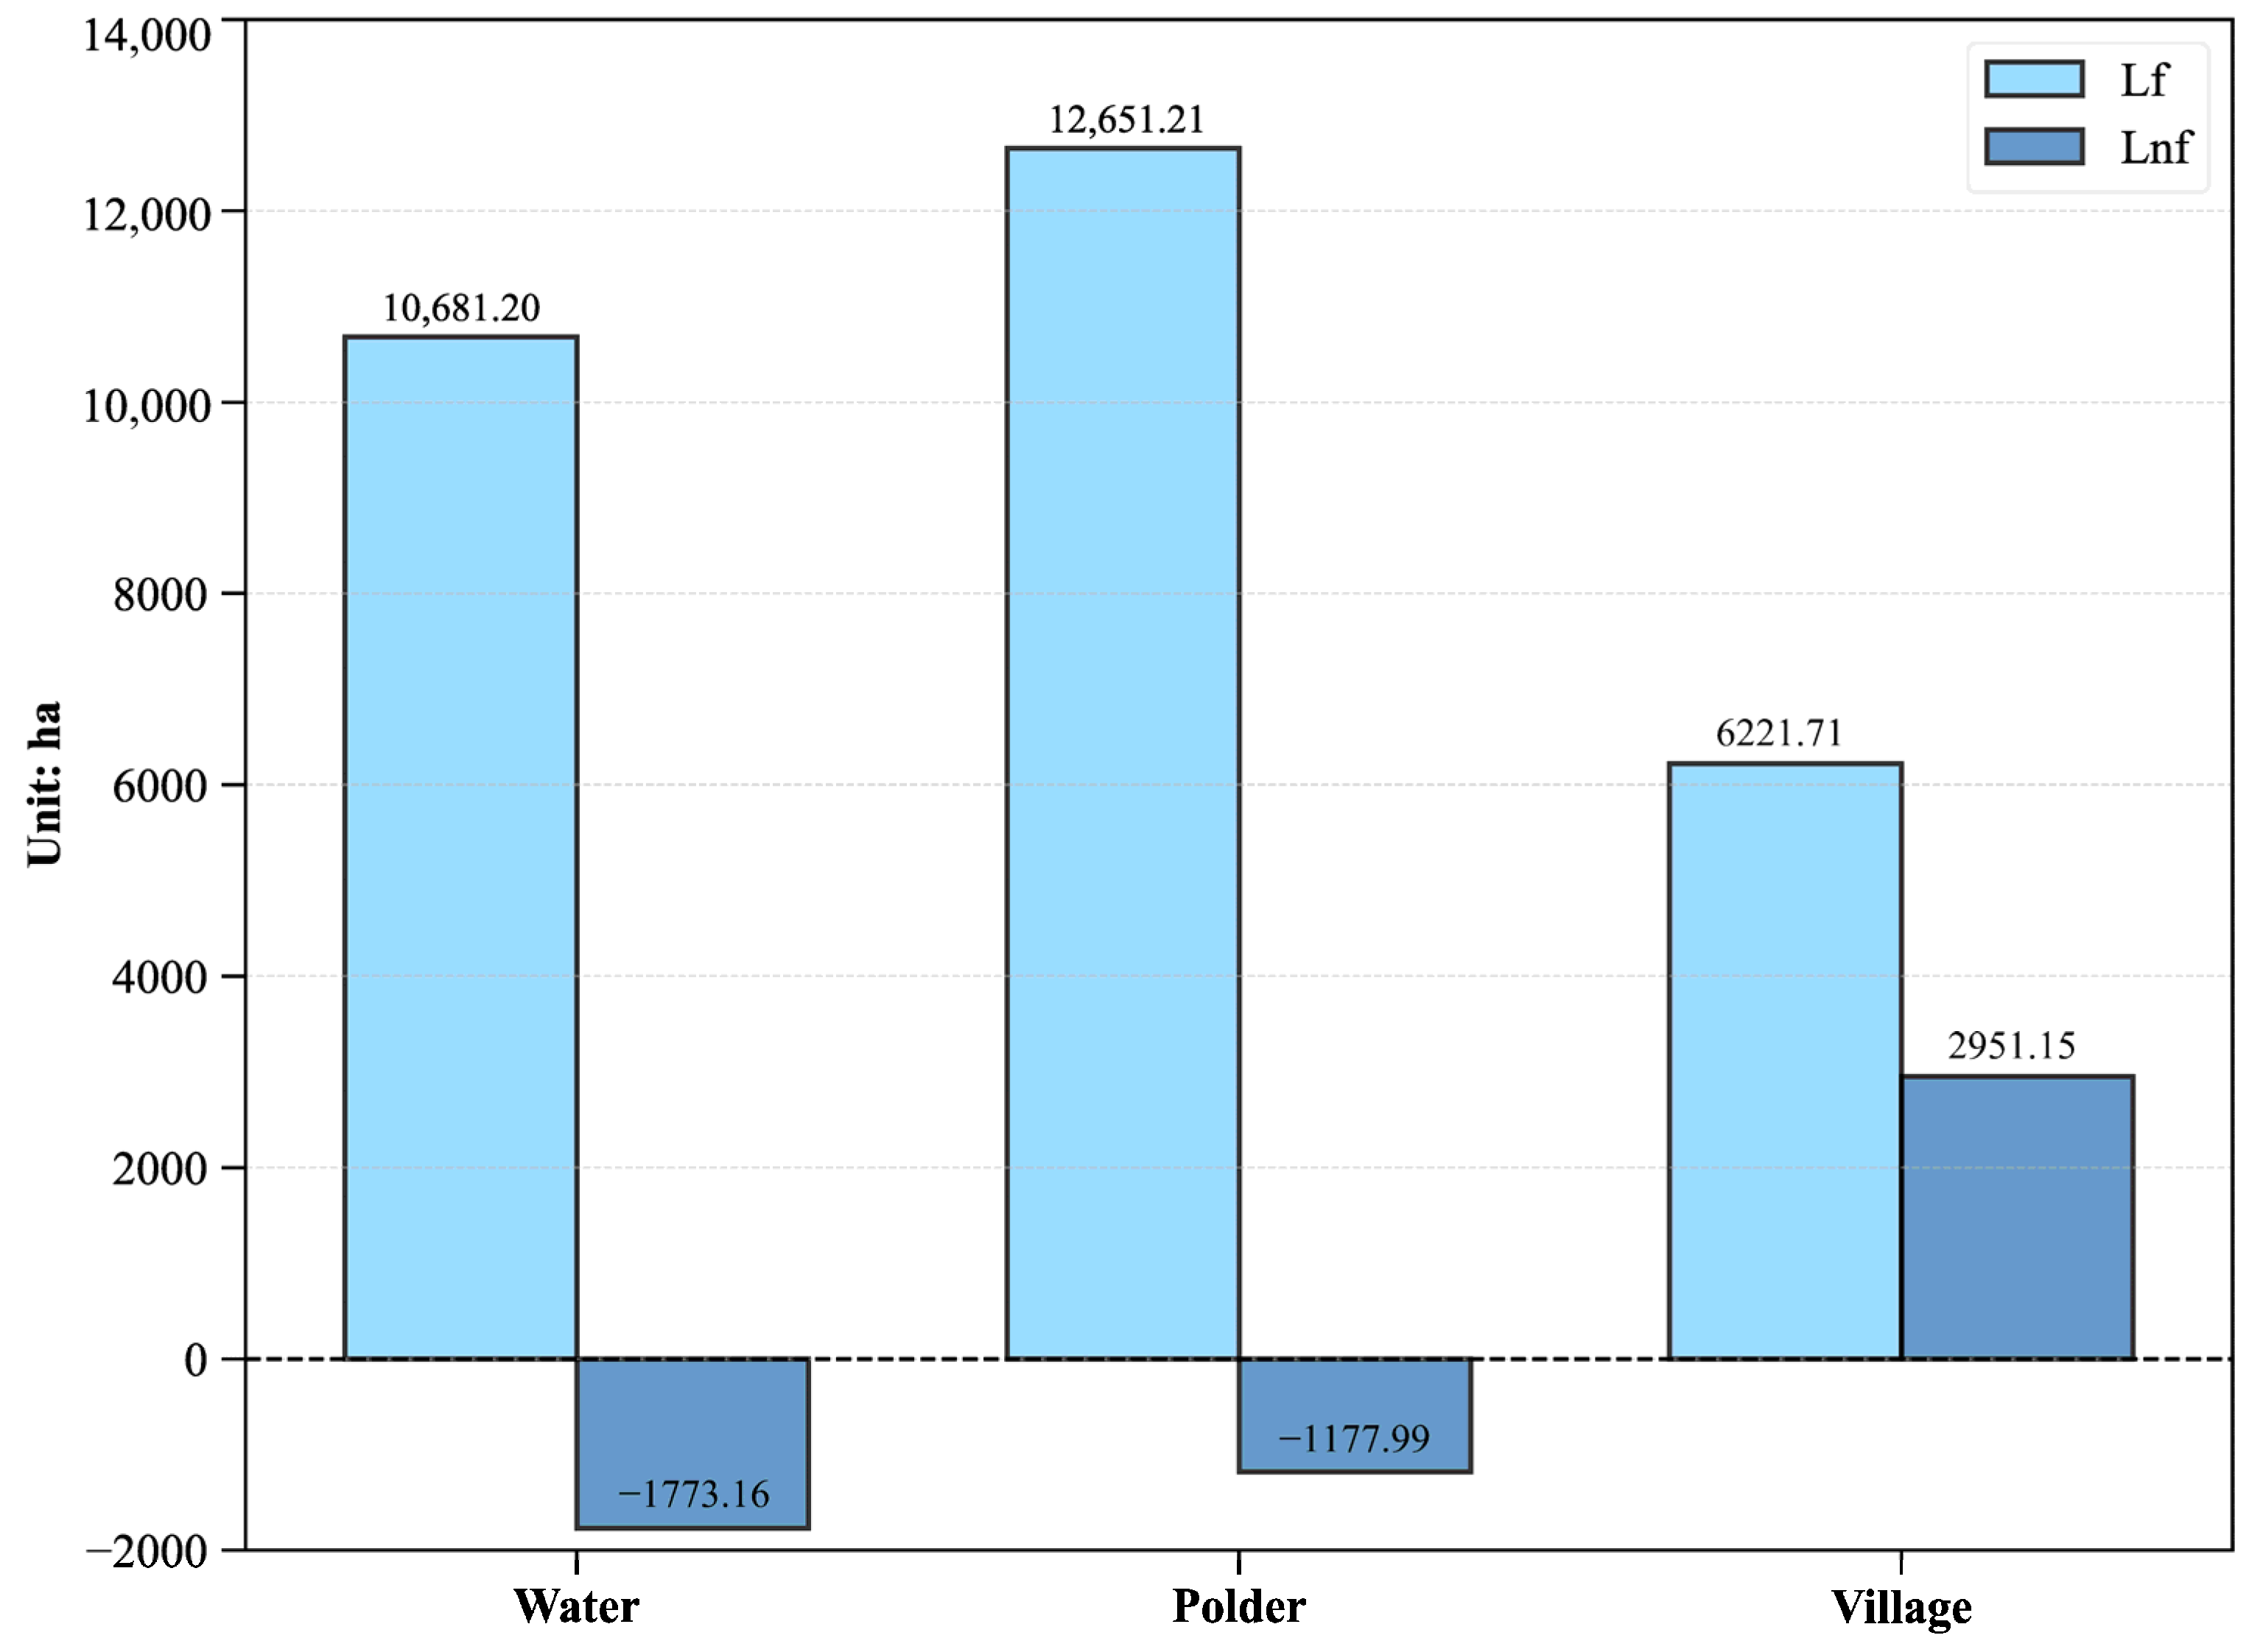
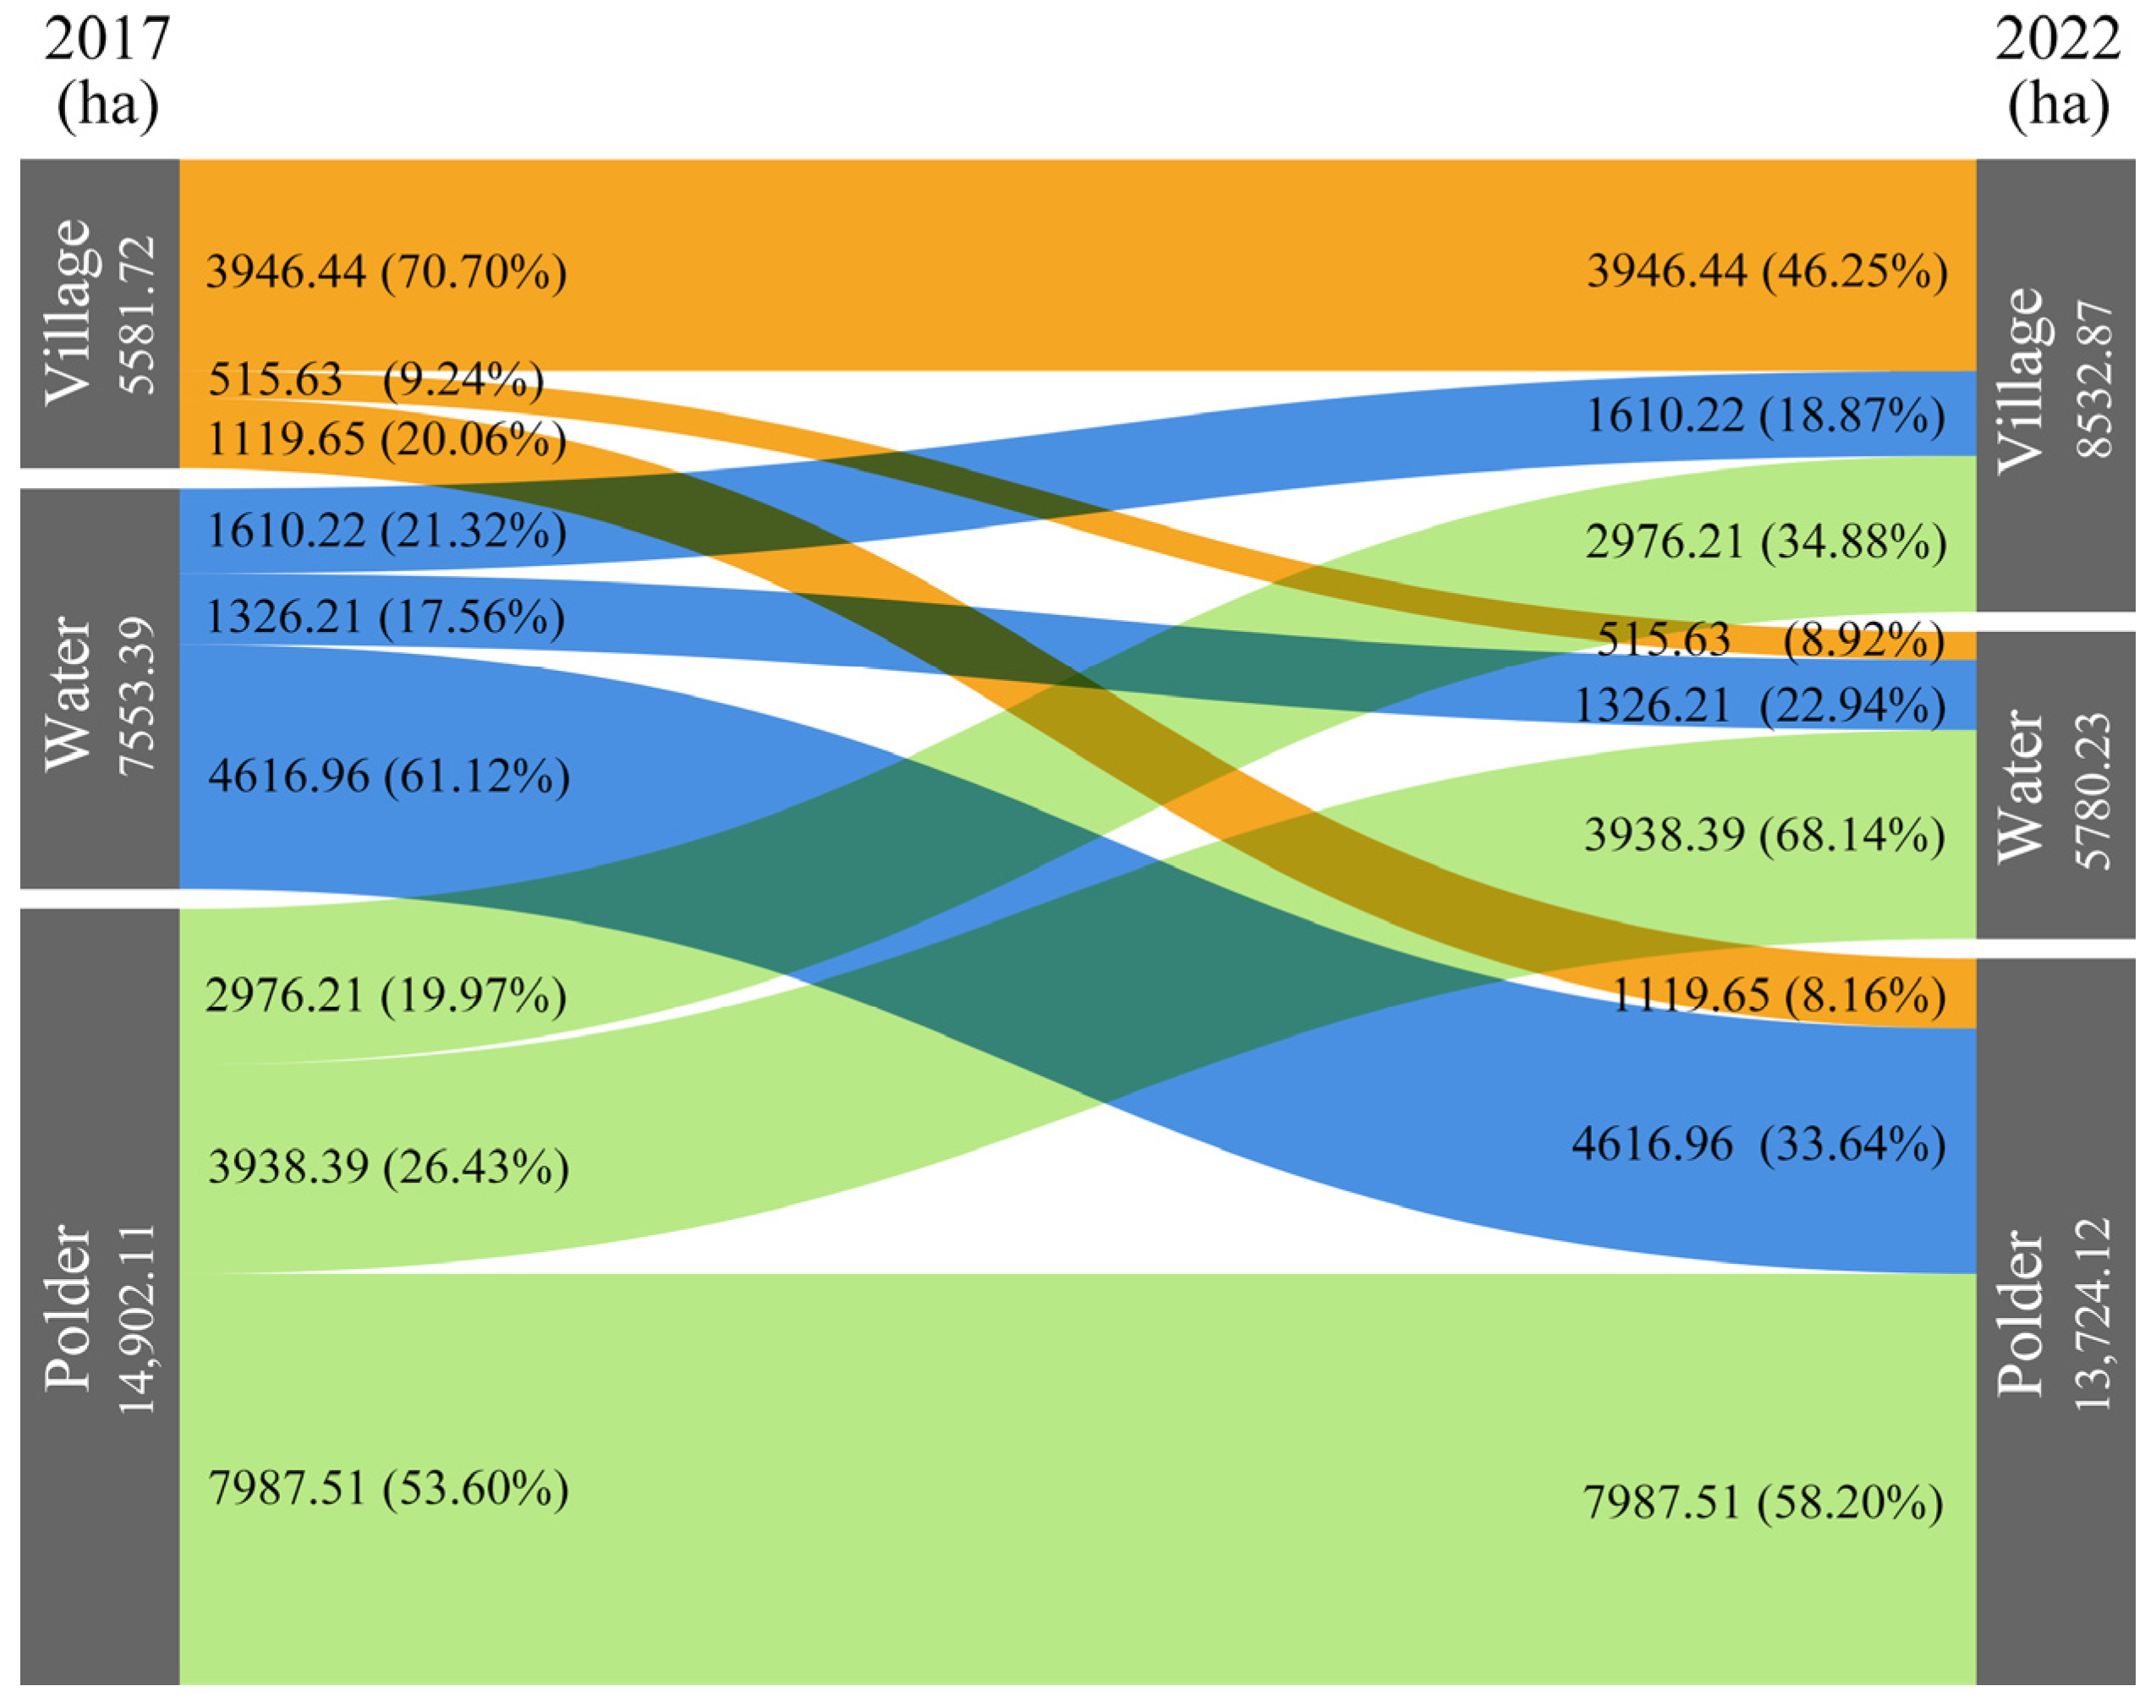
3.2. Land-Use Transfer and Indices

Land-use transition is commonly used to quantify changes in land use and cover [46]. Figure 5 presents the calculated results of the land-use transfer flows for each type. The land-use transfer flow ( L f ) for water and polder land was higher than that for village land. However, the net land-use transfer flow ( L n f ) exhibited the opposite trend, indicating that the spatial replacement of water and polder was more obvious than the quantitative changes. This observation is consistent with the previously mentioned characteristics of the interchange between water and polder. On the other hand, the village had the lowest L f , while demonstrating the highest L n f . This suggests that the majority of the changes in village land were net growth, with limited participation in spatial replacement by the polder.
The transitions among the three land-use types are shown in Figure 6. The land transition in the research area can be categorized into three main types: first, the unchanged type; second, the interconversion type between water and polder; and third, the type of transition from polder and water areas to village land. Specifically, nearly half (47.29%) of the land in the research area remained unchanged for five years. Polder land accounted for 28.49% of the total land, indicating that more than half of the polder remained relatively stable. Second, the interconversion between water and polder accounted for 16.47% (water to polder) and 14.05% (polder to water) of the research area, totaling nearly one-third of the total area. This is consistent with the characteristics of traditional polder areas, where water and polder undergo frequent interchanges. Third, village land primarily originated from the conversion of water and polders. The conversion of “water to village” and “polder to village” accounts for 1610.22 and 2976.21 hectares, respectively. This conversion will contribute 53.75% of the total area of village land in 2022, with the polder being the primary source of village land.
La can explain land-use transfer based on the degree of change (Table 3). Among them, water land exhibited the highest level of activity (28.28%), whereas polder demonstrated the lowest level (16.98%). This indicates that the water network in the study area experienced the highest degree of activity during the study period.
The magnitude of the Dominance Change Index (Dc) reflects whether land-use change is primarily characterized by quantitative change or spatial replacement. For instance, the Dc values of water and polder were 16.60% and 9.31%, respectively, indicating that spatial replacement was the predominant form of change. The Dc value for villages was close to 50%, indicating that compared to water and polder, the change in village land was primarily in terms of quantity rather than spatial replacement.

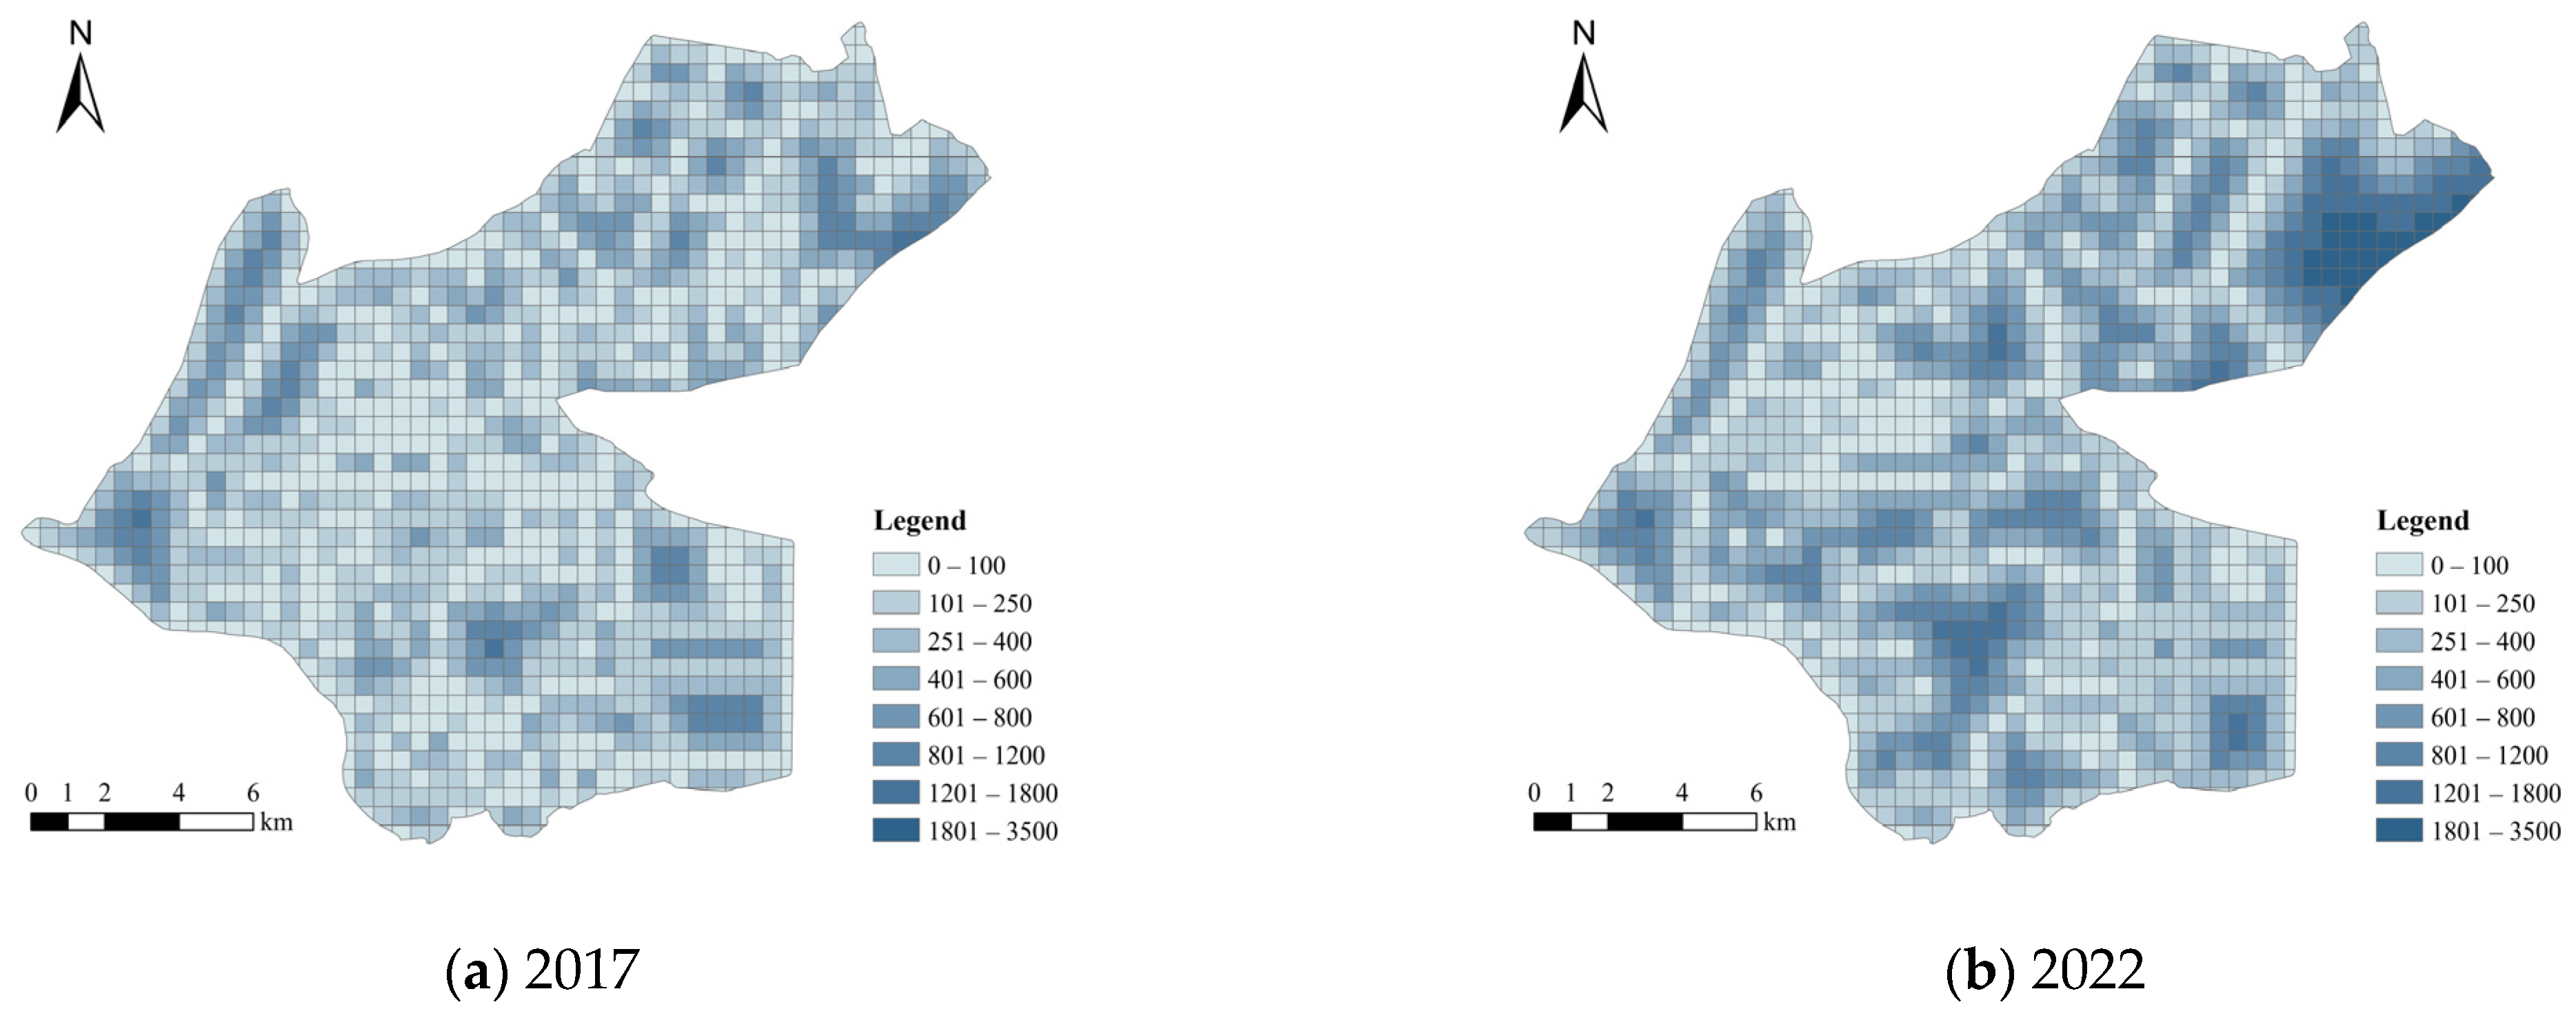
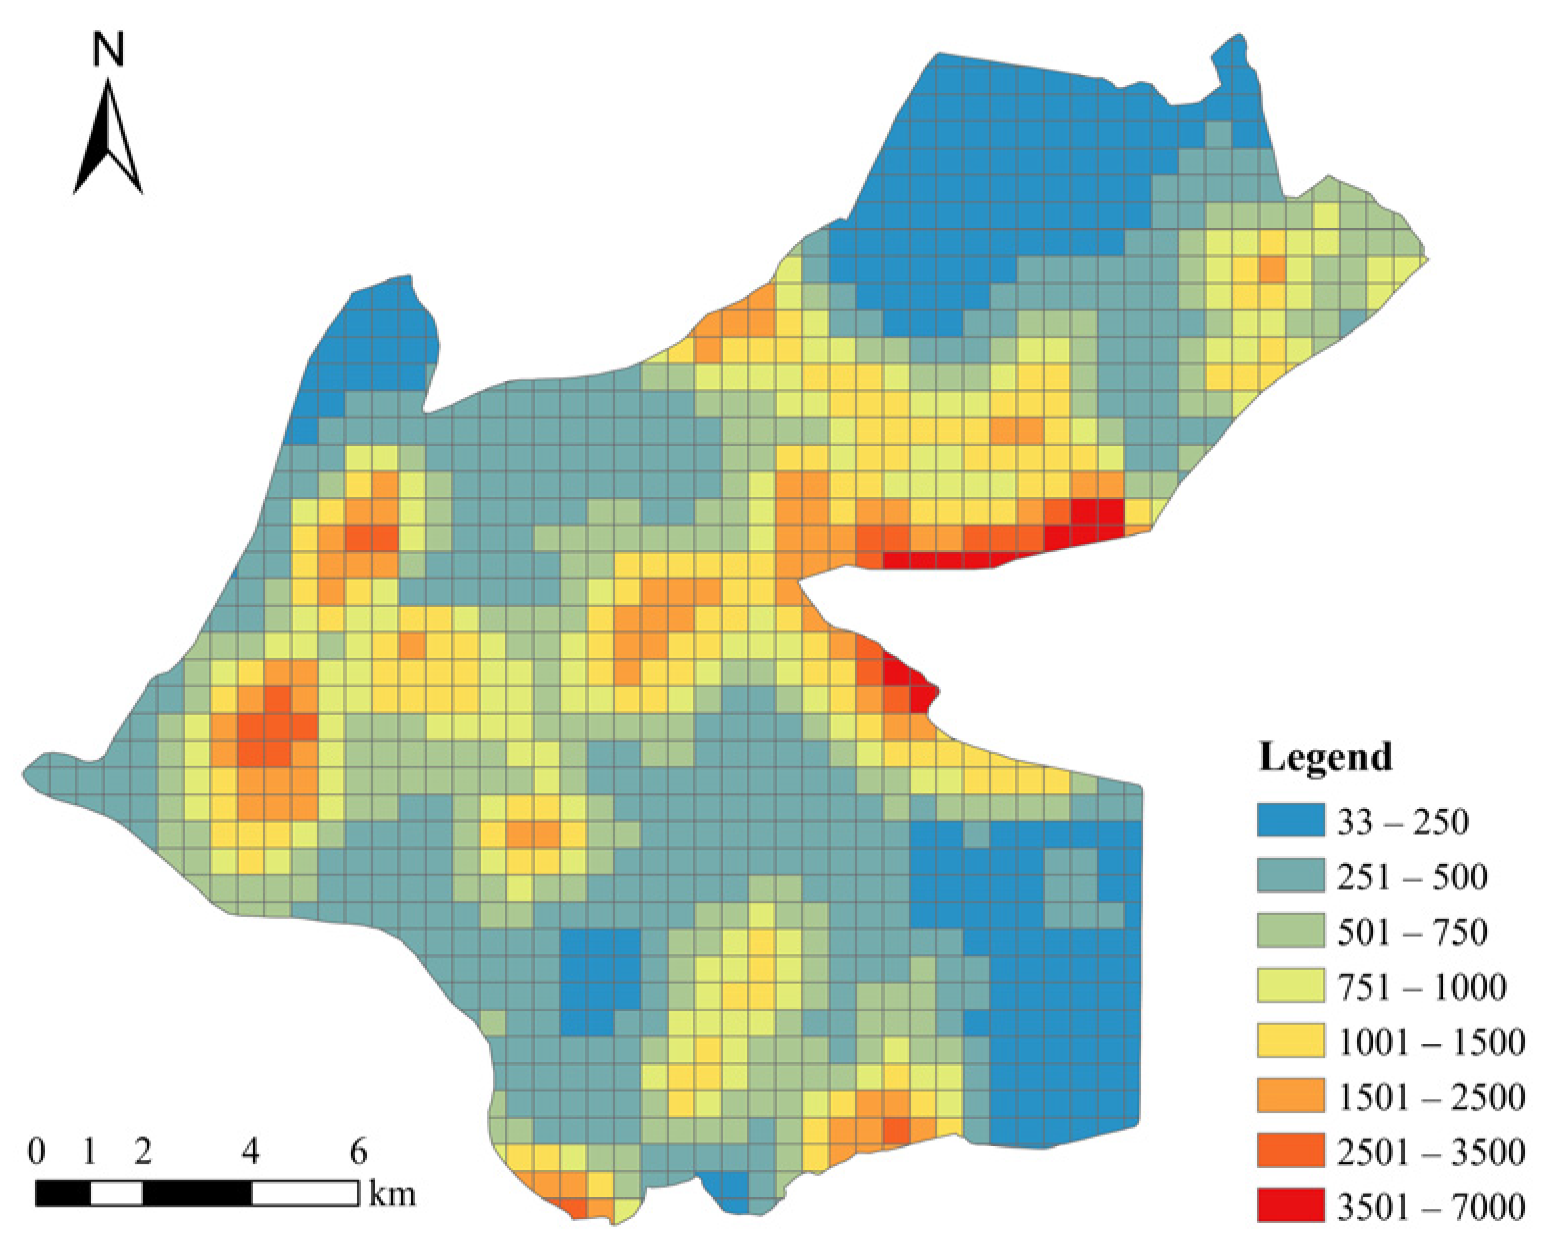
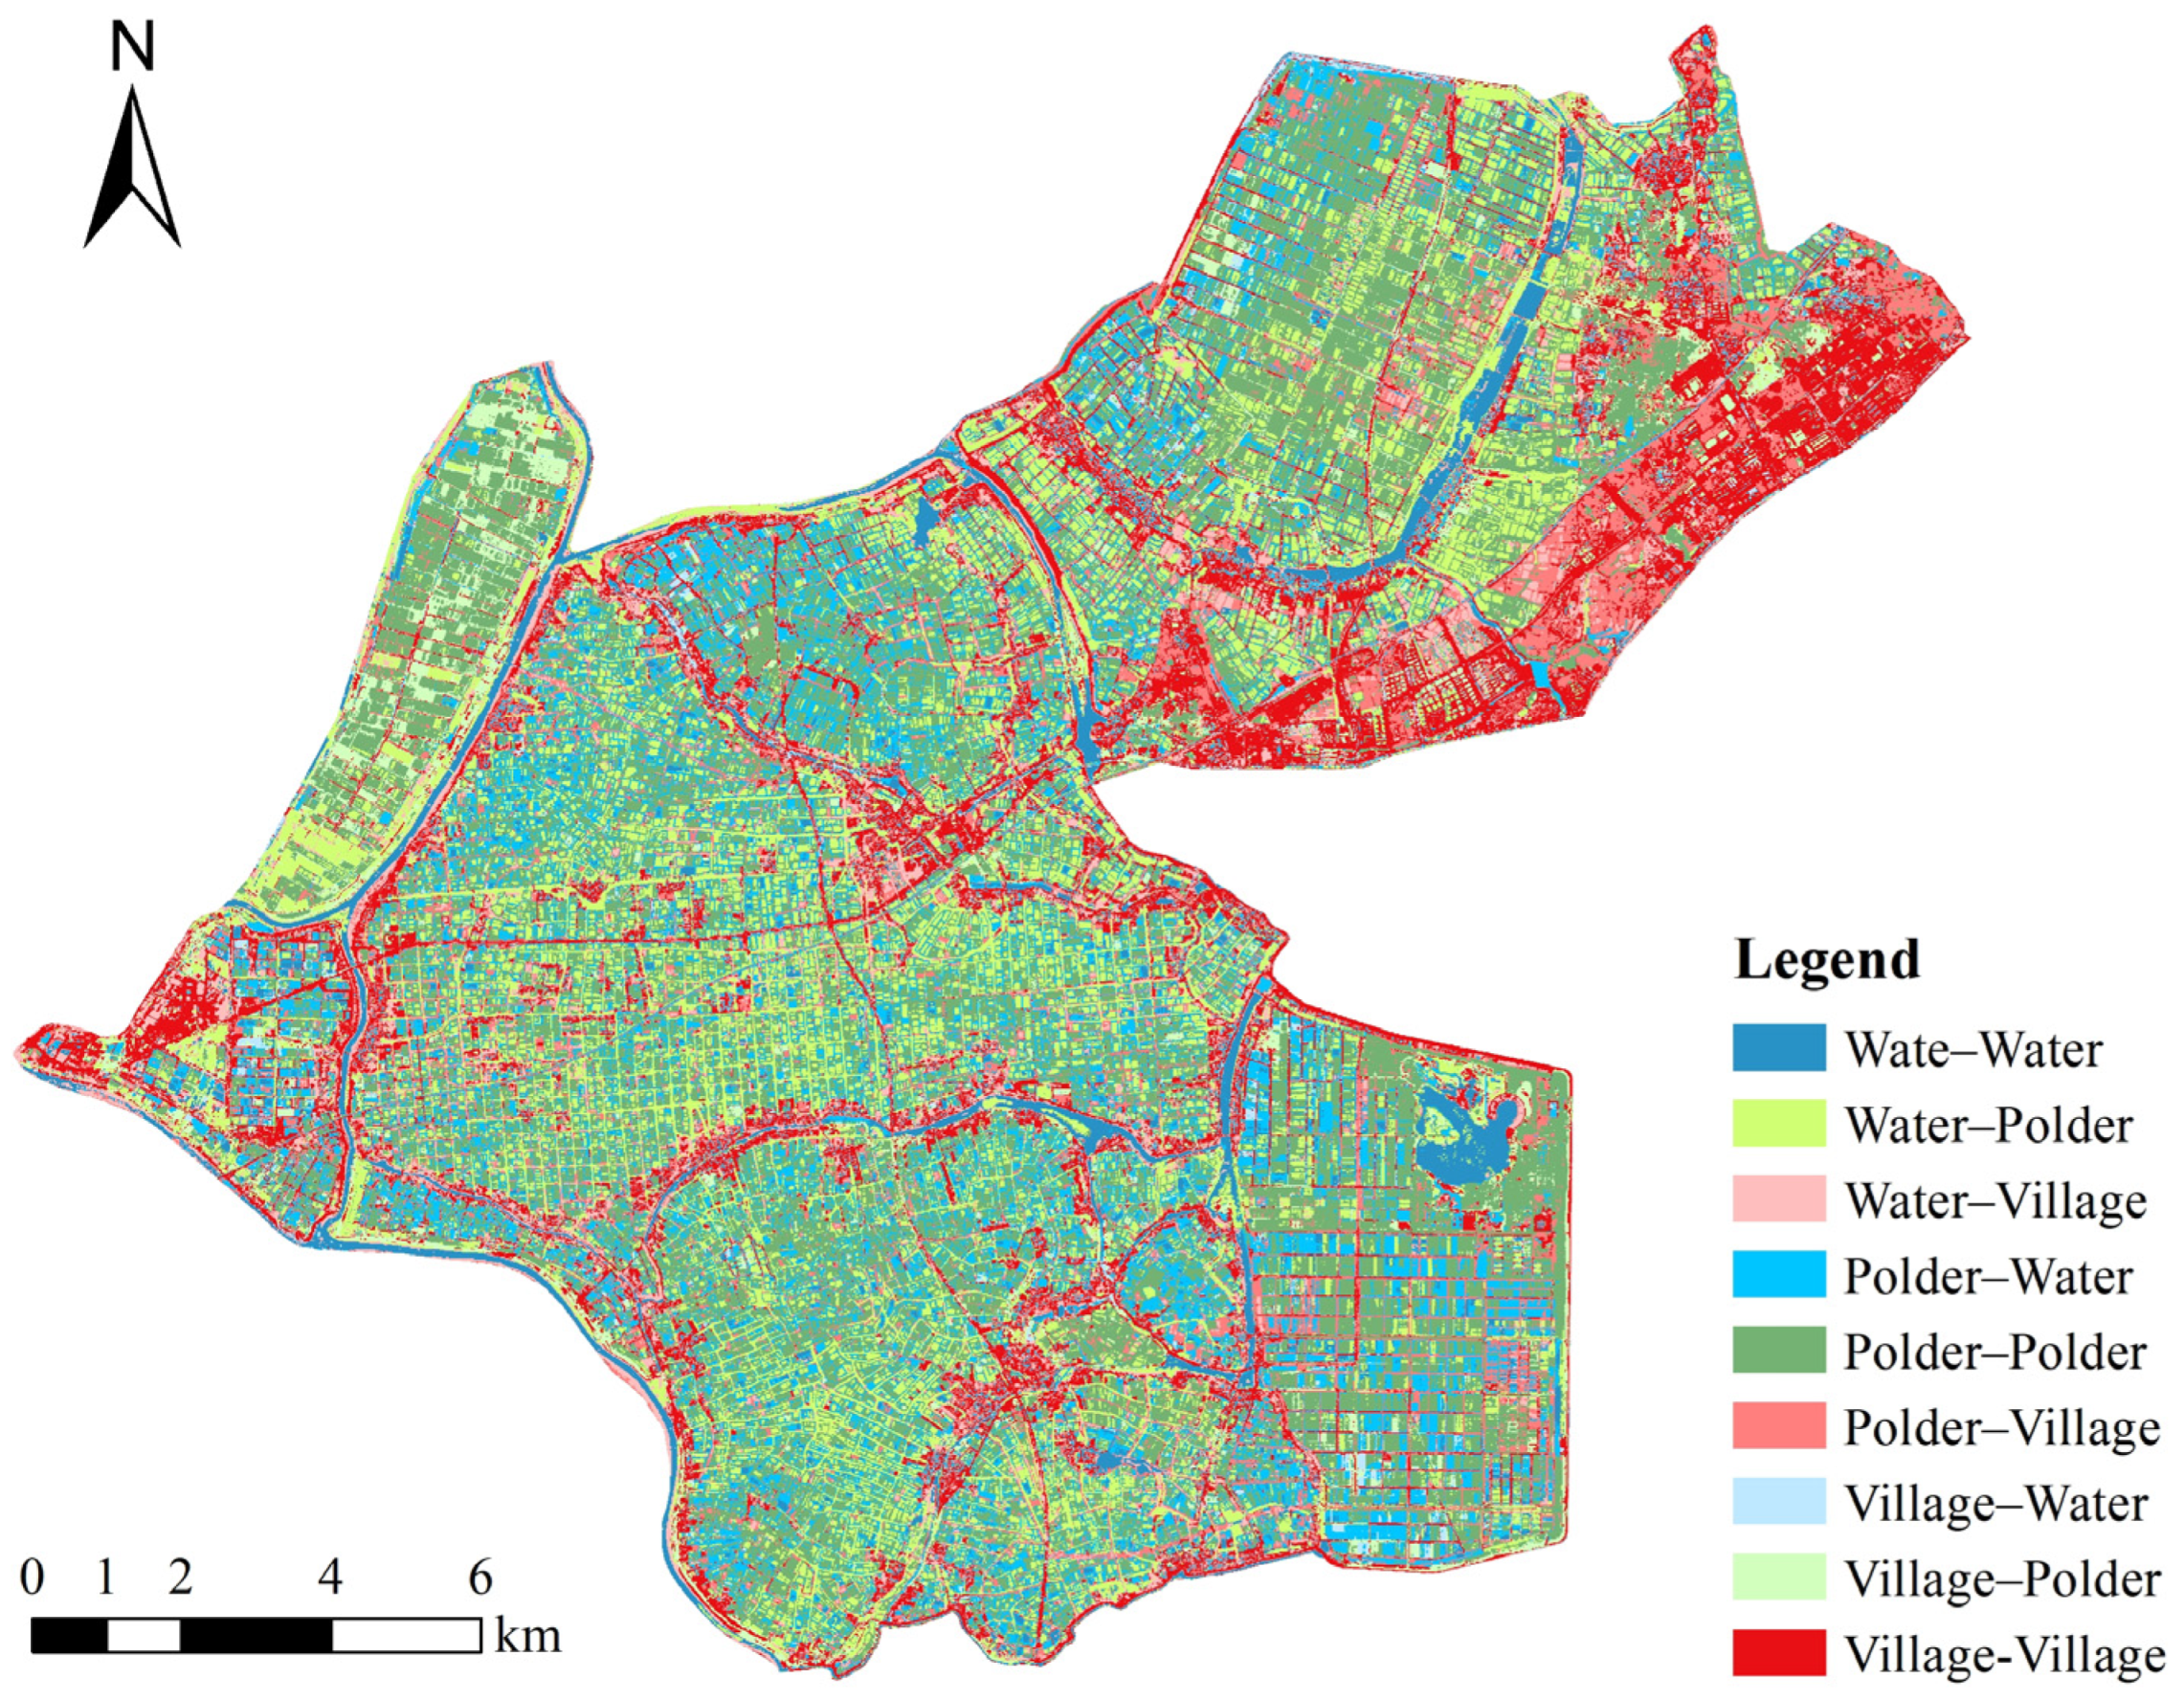
3.3. Spatial Change in Land Use

The spatial distribution of land-use type transfers is illustrated in Figure 7. Within the study area, the three land-use types underwent nine different land–flow relationships during the study period, which were categorized into four main types. Type 1 represents the conversion between “water–polder” and “polder–water,” characterized by fragmented spatial transfers. Type 2 represents the conversion between “water–village” and “polder–village” land use. These conversions were primarily in the vicinity of the village construction land in 2017, demonstrating a contiguous expansion trend. Type 3 encompasses the land use situations of “water–water,” “polder–polder,” and “village–village” conversions, where no land-use changes occurred within the study period. Type 4 entails the conversion between “village–water” and “village–polder.” This type of land conversion is relatively limited and primarily concentrated in the vicinity of village construction land.

4. Model Results

In this section, we explore and compare the factors that influence the proportion of polder land in 2017 and 2022. We constructed global regression models and diagnosed variable collinearity. The model coefficients were then visualized, and the results were analyzed.

4.1. Model Parameters
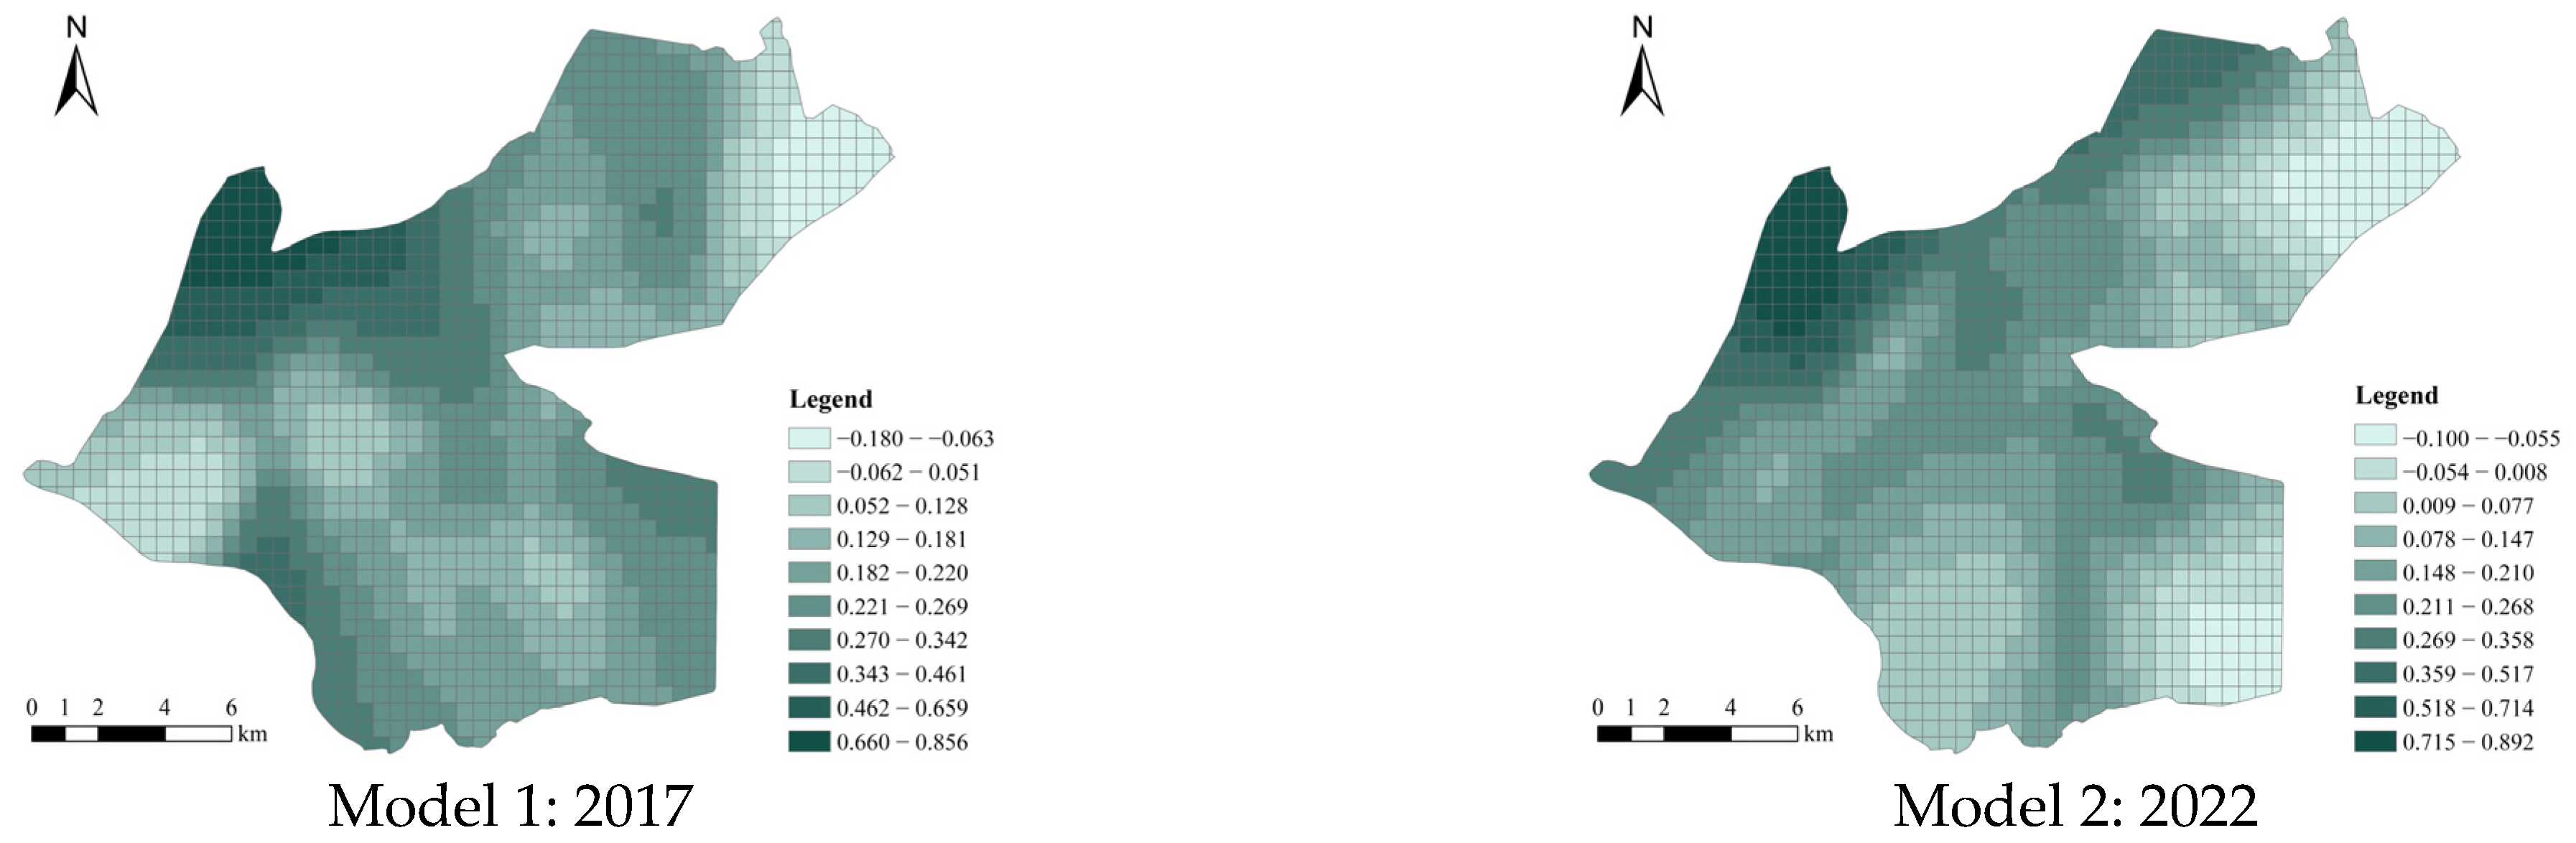
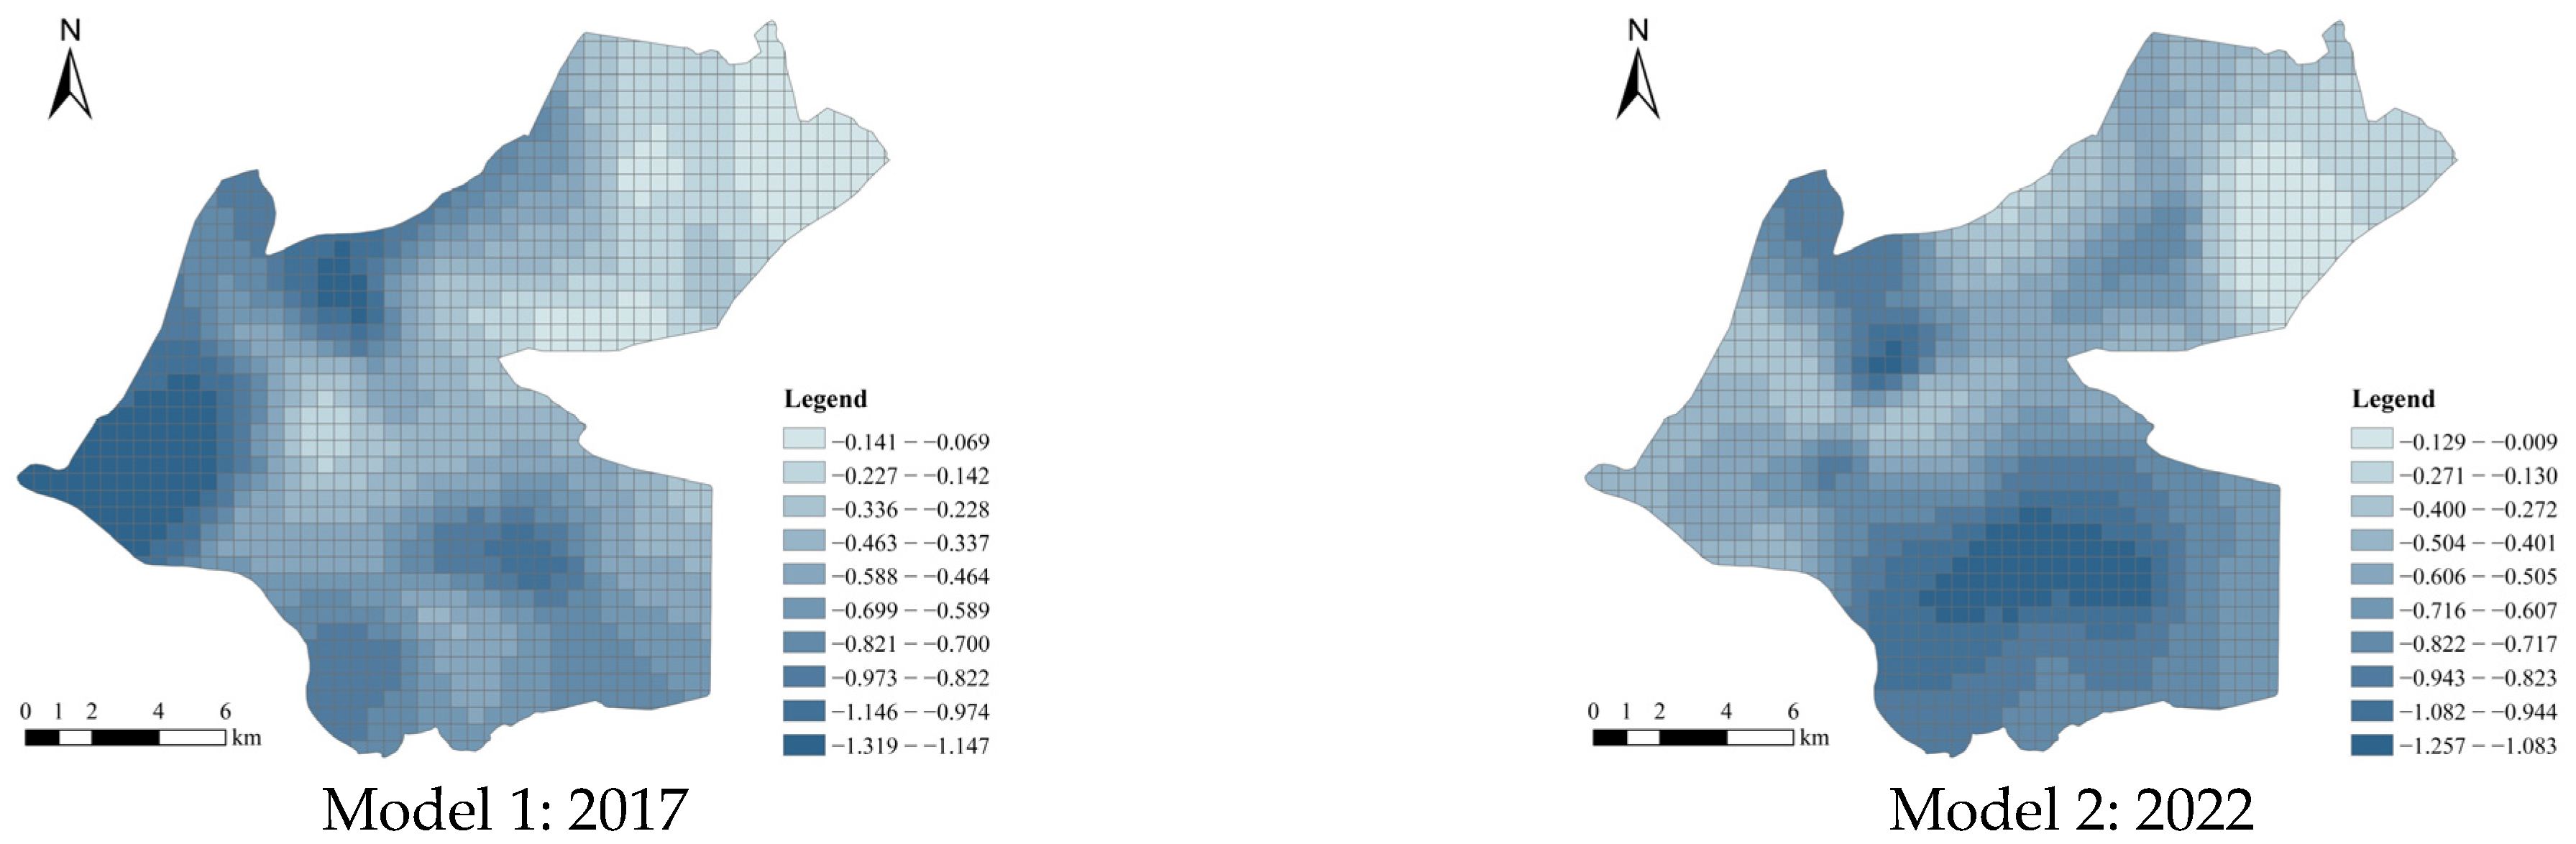
The GWR model was employed to investigate the factors influencing the proportion of polders in different areas within the study area. As discussed in Section 2.3.3, we first examined multicollinearity among the independent variables. The VIF values of each independent variable and the OLS model coefficients are presented in Appendix A Table A1. The VIF values of all the independent variables in both models were below 10, indicating that the selection of variables effectively avoided multicollinearity. The Moran’s I index results are presented in Table 4. Based on the Z-scores and p-values, the spatial distribution of the independent variables in the study area was not random. Therefore, the utilization of the GWR model to analyze the mechanisms of land-use change is deemed appropriate.
Comparing the R2 results (Table 5), it is observed that in the OLS model, the six selected independent variables explain the variations in the dependent variable by 32.3% (in 2017) and 36.5% (in 2022), respectively. However, the GWR model, which incorporates spatial heterogeneity, offers a stronger explanation, reaching 61.4% (in 2017) and 58.6% (in 2022). The GWR models for both 2017 and 2022 demonstrated superior goodness of fit and explanatory ability compared to OLS.

4.2. Mechanisms

Utilizing the GWR model results, we examined the influences of natural and ecological factors, development and construction, population, and economy on the proportion of polder, as shown in Figure 8, Figure 9, Figure 10, Figure 11, Figure 12 and Figure 13.

4.2.1. Natural and Ecological Factors

The distance to water (DW) reflects the association between natural factors and polder. The model results revealed that the distribution of the DW coefficient varied similarly in the 2017 and 2022 models (Figure 8). The northwestern region consistently exhibits the highest positive coefficient values. This indicates a positive correlation between the distance of the grid center from the water and the polder proportion in each grid, suggesting that as the distance increases, the proportion of polder land also increases. This could be attributed to the frequent occurrence of floods in the polder area, where polders located farther away from the water are less affected by flooding disasters. In contrast, negative impacts were concentrated in the northeastern area, which is closer to the urban development zone in Gaochun District. This area exhibited a feature in which the polder proportion increased as the distance from the water decreased. This could be attributed to the proximity of the urban development zone, where the urban drainage system is located. As a result, a polder situated closer to the water network not only remains unaffected by flooding but also benefits from convenient irrigation practices.
A DEM (digital elevation model) can reflect the correlation between topography and polder. In the two models, the DEM had a negative impact on the dependent variable (see Figure 9), indicating that a lower elevation was associated with a higher proportion of polders. However, the peak values of the coefficients exhibit different geographical distributions in the 2017 and 2022 models. Specifically, the maximum peak value in 2017 was observed in the western area, whereas the location of the peak value will shift toward the central area by 2022. The lowest coefficient values were found in the northeastern part of the study area near the urban construction zone of Gaochun District, indicating that the polders in proximity to the construction area were least affected by topographical factors.

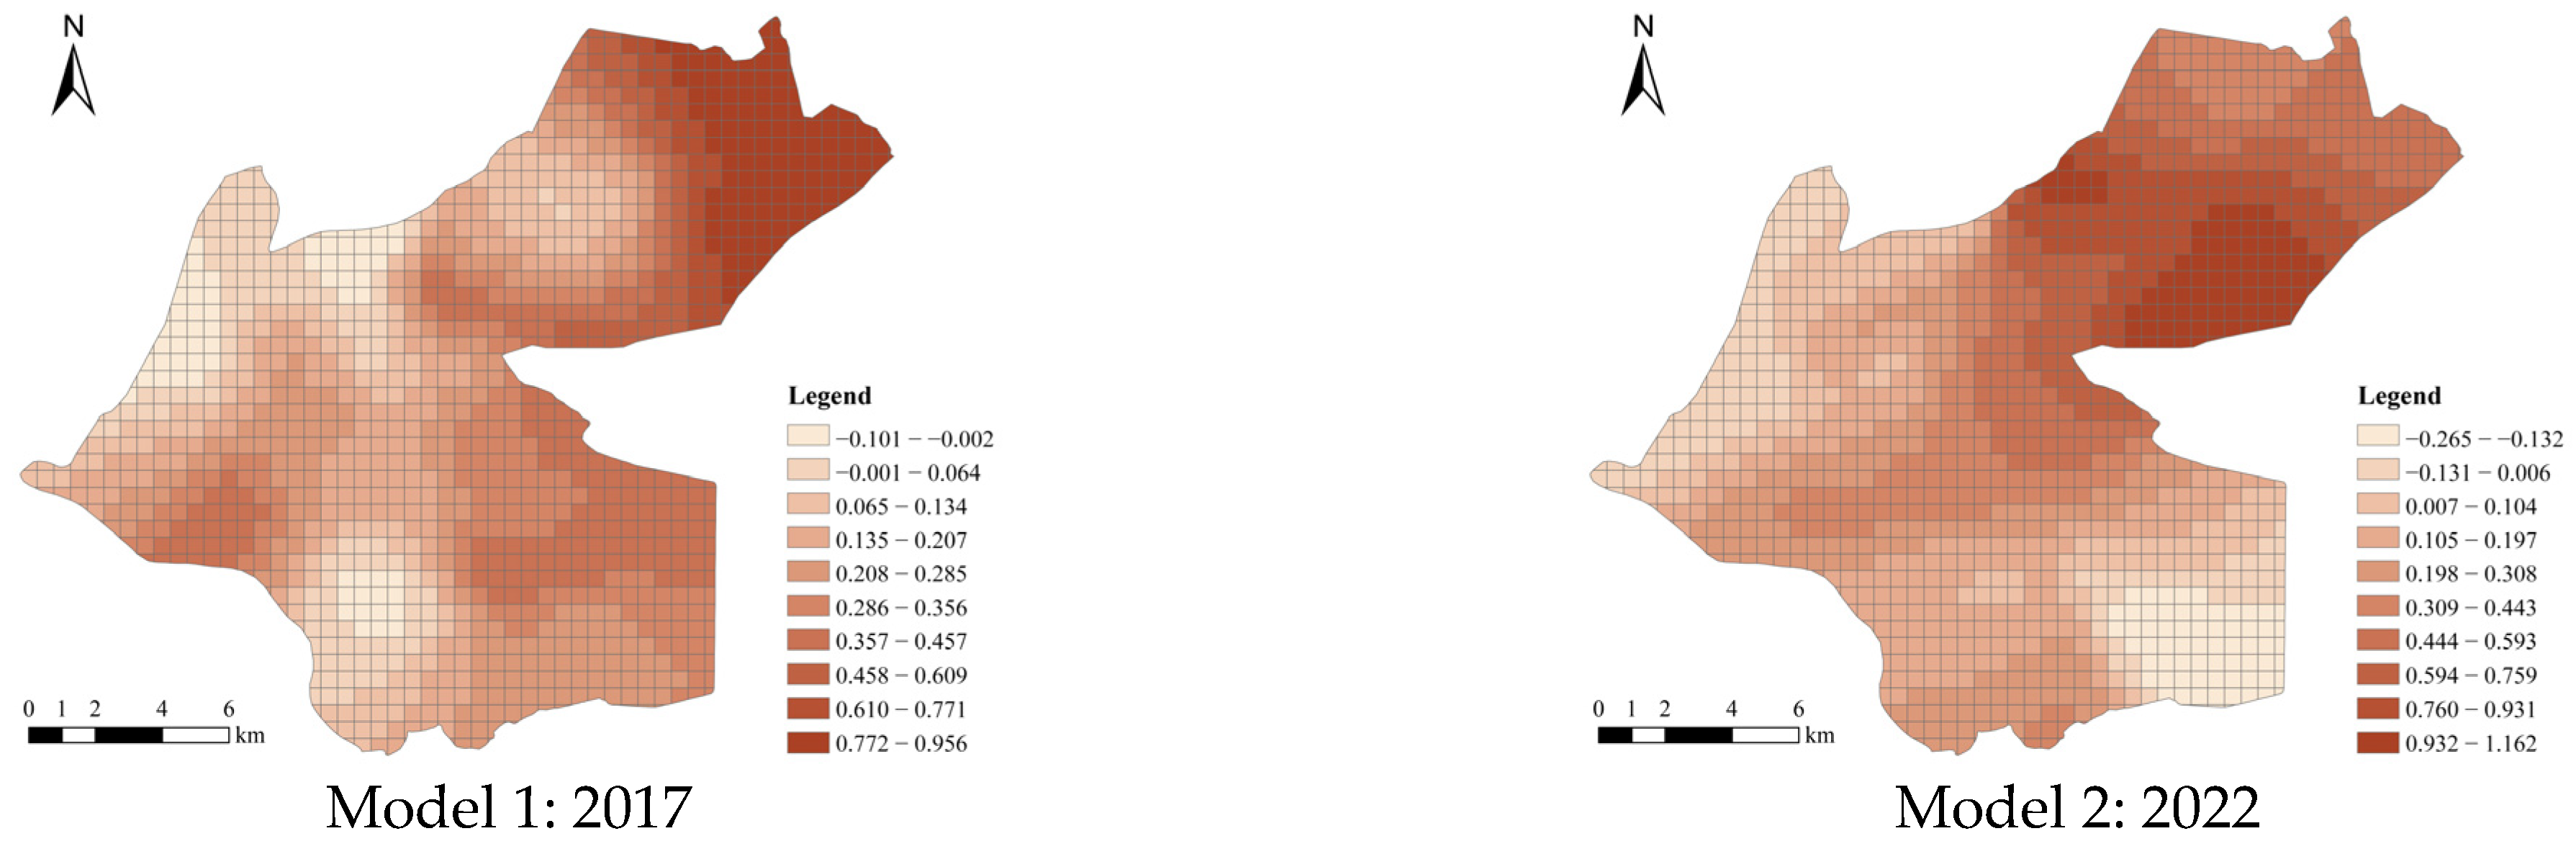
4.2.2. Development and Construction Factors

Regarding the association between transportation and polder, the models for the two years indicated that the northeastern zone near the development area had the highest DR coefficients (see Figure 10). This suggests that road construction and urban expansion led to a reduction in polder. By contrast, the DR coefficient in the southeastern region was negative. The area is located east of Gucheng Lake, and in recent years, the ecological features surrounding the lake have been capitalized on to develop roads and restore polders, thereby further promoting the development of rural polder tourism.
Regarding the impact of village construction density on the polder area, the regression coefficients from the two models indicate that in the northern and southeastern areas, characterized by lower village density, an increase in VD (village density) facilitates the development of the polder (see Figure 11). This suggests a correlation between the demand for agricultural labor in polder cultivation and the availability of residential areas in close proximity. Conversely, for those with high VD, such as those in the central and southwestern areas, the regression coefficients exhibited a spatial distribution of negative impacts. This could be attributed to the concentration and development of these villages, where an increase in village density is often accompanied by population growth and intensified human–environment interactions. Consequently, this situation is less favorable for the preservation and protection of polders.

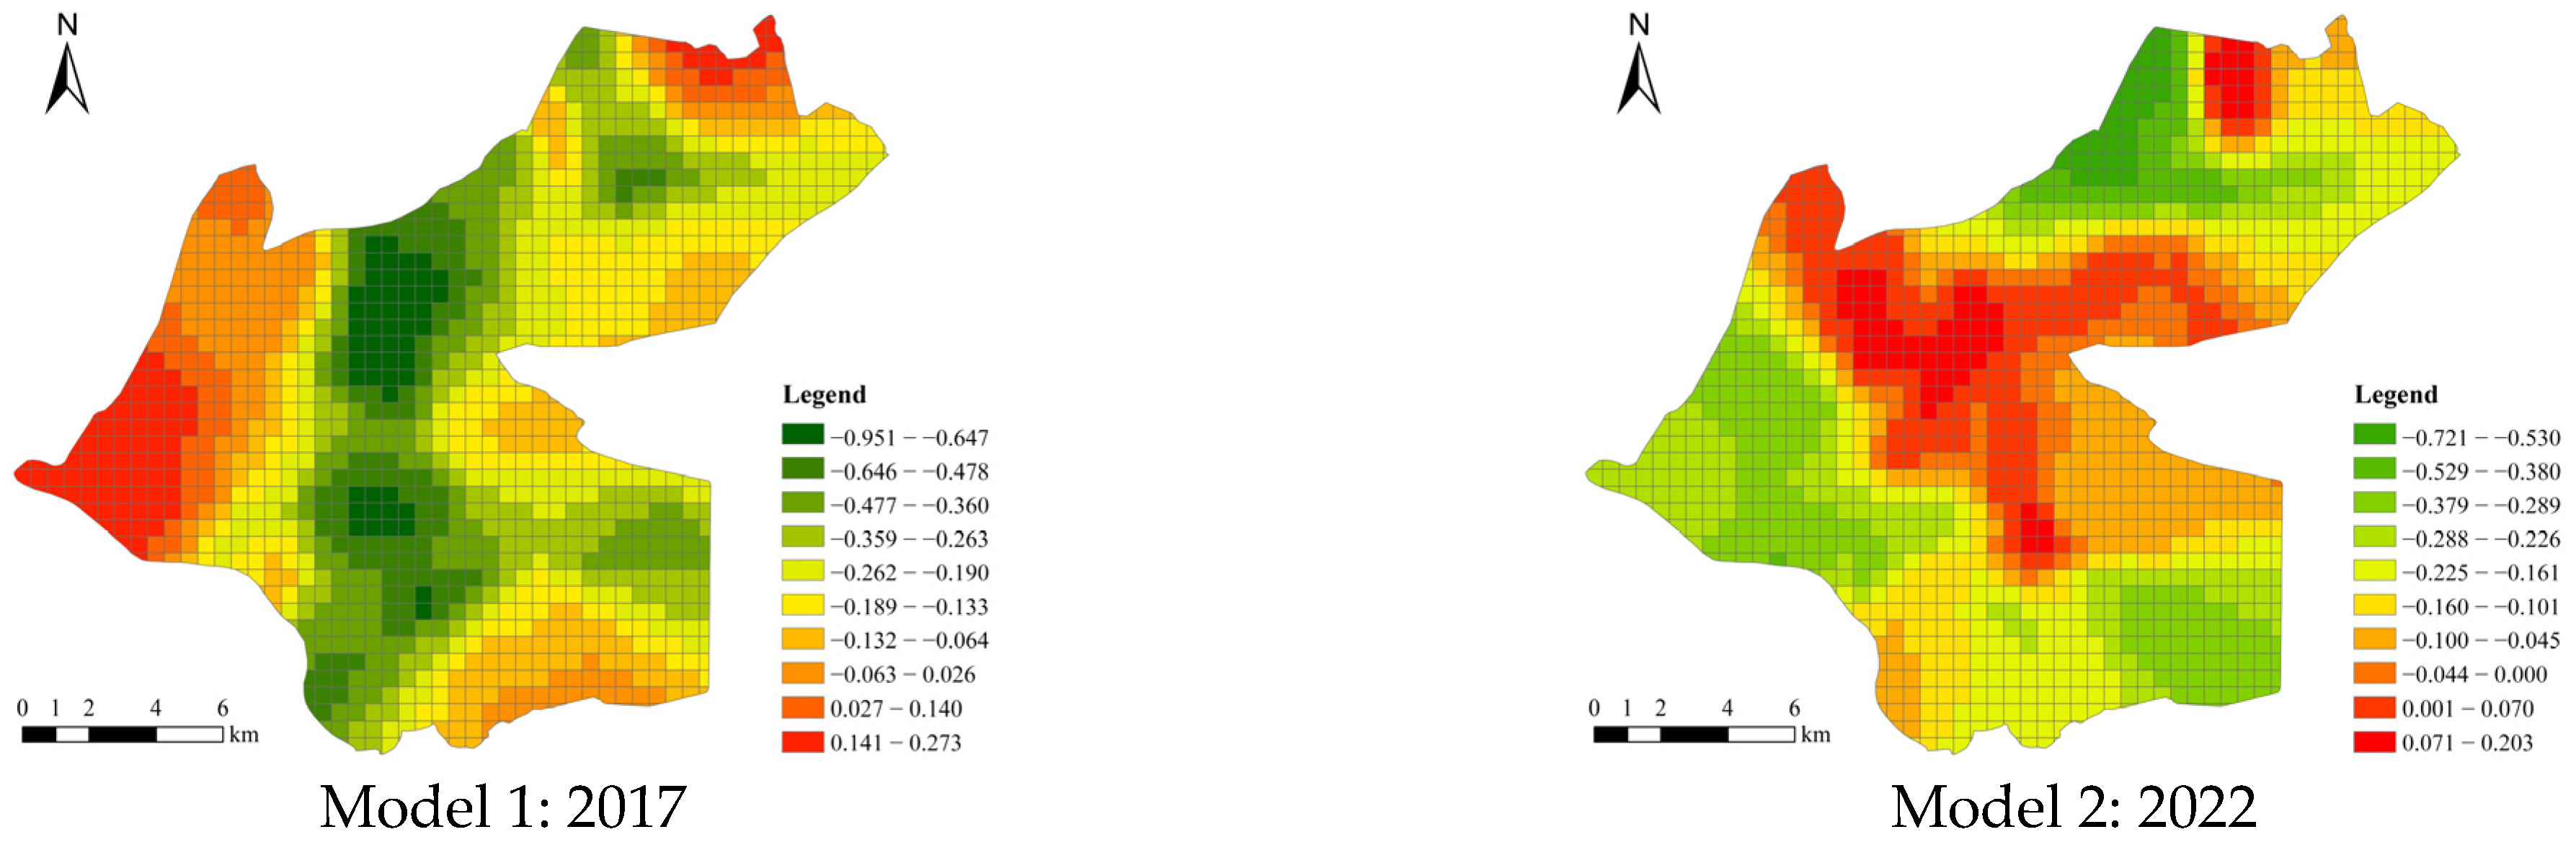
4.2.3. Population and Economic Factors

Regarding the association between PD (population density) and polder, the peak of the negative correlation coefficient was observed in the central part of the study area in the 2017 model, indicating a negative relationship between population density and the proportion of polder (see Figure 12). This finding aligns with the previous discussion on the tense human–land relationship, which increases the likelihood of polder land occupation. However, in the 2022 model, the PD coefficient shows a positive correlation. This can be attributed to the recent focus on planning and development, particularly on promoting ecotourism around the polder, enhancing the tertiary sector of the economy, and restoring the polder. These efforts led to an increase in the PD, which was positively associated with the dependent variables.
The catering density (CD) is employed as a measure of the impact of economic development on polders (see Figure 13). The findings on the influence of CD aligned with those on PD. In the central area, CD exhibited a negative impact on the proportion of polders in 2017 and a positive effect in 2022.
The coefficient variations of the six factors revealed spatial and temporal differences in their impact on the proportion of polder. In the northeastern part of the study area, which is in proximity to the urban development area of Gaochun District, the proportion of polder land is primarily influenced by natural and ecological factors as well as development and construction factors. This is evident from the decrease in the proportion of polder owing to road construction and urban development. Additionally, polder fields located farther from the water tended to have lower proportions. In the central area, where village density is already high, it is constrained by the equilibrium of human–land relationships. This is manifested in the negative impact of village density on polder conservation. However, the impact of population and economic factors may transition from negative to positive due to the development of ecotourism. The southeastern area shows a contrasting trend. This can be attributed to the relatively low PD and VD in the area, suggesting that development and construction may have contributed to the increase in the proportion of polders. In rapidly developing areas, the continuous growth of the population, economy, and construction is more likely to have a negative impact on polder, which hinders the inheritance and conservation of the human–ecological system associated with polder. Over time, owing to variations in human activities, development priorities, and industrial growth, the impacts of the same factors on polder changes may exhibit contradictions, necessitating a comprehensive analysis.

5. Discussion

5.1. Change in Land Use

Discussion of spatiotemporal evolution and mechanisms of land use is essential for the sustainable development of polder areas. Although most studies have extensively discussed the characteristics of urban or rural land-use change, few studies have examined land use in polder, a special geographical space. According to our research results, during the study period, water and polder were primarily represented by spatial replacement, and village areas were represented by quantitative changes. At the same time, the main source of land for the village was through the occupation of polders and water areas. Similar research conclusions also appear in land use studies for different objects. For example, Liu et al. [35] found that from 2005 to 2015, the tourism land area of each village in Jiuzhaigou increased because of the development of tourism. Research by An et al. [47] on wetlands in China found that accelerated urbanization and population growth negatively affected wetland change. Li et al.’s study [48] concerning rural settlements within Beijing’s Tongzhou District observed that between 2000 and 2015, the expansion of new rural settlement land primarily occurred through the utilization of cultivated land and water areas. Thus, rapid economic development and expansion have varying degrees of impact on different types of land use, especially in villages, farmland, wetland, forestland, and the polders. Formulating appropriate policies and strategies for sustainable use of land while encompassing both the preservation of natural ecosystems and the promotion of economic development is crucial to polders and maintaining a global scale.

5.2. Mechanisms of Change

While most studies have discussed the mechanisms of land use impacts, there has been relatively little research on the mechanisms of land-use change in polder areas. Studies have shown that the influence of various factors on polders shows spatiotemporal differences, which may be due to differences in human activities and development priorities. In addition, because the same factors have different impact mechanisms on polders, we believe that the impact of various factors should be considered comprehensively in subsequent research.
Natural and Ecological: Unlike ordinary farmland, the production and maintenance of polders are inseparable from natural and ecological factors, especially water and elevation. The study results suggest that the relationship between polders and water differs due to geographical location. On the one hand, the water system can promote the construction of polders; on the other hand, excessive floods have the opposite impact on polders. Therefore, comprehensively considering the relationship between water and polder can effectively promote the utilization and protection of polder. Similar conclusions also appear in the research by Song et al. [49], who found that the Beitang landscape, a land use pattern originating from the farming culture, and its spatial distribution are affected by factors such as elevation, slope, aspect, and river, showcasing a close relationship with the natural environment.
Development and Construction: In general, development and construction factors are more likely to adversely affect areas that feature natural ecology and agricultural production. Our results also show that areas near the development area are more likely to impact polders adversely due to construction. Wei et al. [50] reached a similar conclusion in their research on cultivated land in Harbin; they argued that the increase in industrial and urban land demand led to the occupation of cultivated land. However, development and construction may also benefit the polder, which we believe may be related to the development of ecotourism.
Population and Economic: Historically, polders are positively correlated with population growth [9]. However, with the change in society and times, considering various factors, population growth may lead to reduced polders. Our research findings indicate a negative correlation between population density and the proportion of polders in areas with higher village density. However, like other factors, there are exceptions, and we attribute this phenomenon to differences caused by human activities and development priorities.

6. Conclusions

This study focuses on land use, with water-polder-village as the research subject in the polder area. Utilizing Sentinel-2 data, land-use change indices, and the GWR model, it examines the spatiotemporal evolution and mechanisms of land use. The results revealed that changes in water and polder primarily involved spatial replacement, whereas the main aspect of village transfer was characterized by quantitative change. Additionally, the predominant source of newly added village land can be attributed to the transfer of polder. In addition, there is spatiotemporal heterogeneity in the impacts of natural and ecological factors, development and construction factors, and population and economic factors on polder areas. In terms of natural and ecological factors, in addition to the negative correlation between elevation values and the dependent variable, the distance from the river and the proportion of polders exhibited a positive correlation because of the possibility of flood disasters but a negative correlation because of the proximity to urban construction areas. Development and construction factors show that road construction and urban expansion lead to a reduction in polder land. However, the opposite effect has been observed in areas focused on developing ecotourism. Additionally, the impact of VD on the polder varies depending on the human–land relationship. In terms of population and economic factors, both PD and CD have positive and negative effects on the polder, depending on the changing human–land relationship and the focus of planning and development.
This study has several implications for the planning, design, and implementation of polder areas. First, it is crucial to emphasize the value of the human–ecological system in the polder and integrate the conservation and inheritance of the polder into the construction process, ensuring its adaptability. The second aspect involves emphasizing the balance and coordination of the “water-polder-village,” taking into account their roles in production, living, and ecological functions within the human–ecological system. The third aspect involves different development strategies based on variations in nature and ecology, development and construction, and population and economic factors that influence the polder. For example, in terms of natural ecology, it is important to establish a control platform for management of the relationship between the polder and water networks during urban development and to provide early warning of excessive encroachment on polders and water. Furthermore, actively promote the construction of modernized polder hydraulic facilities to mitigate the impact of natural disasters on polders. For development and construction, efforts should be made to enhance the use efficiency of construction land while avoiding excessive disruption to the existing spatial pattern of polder areas. Additionally, it is important to formulate appropriate industrial development plans based on the characteristics of the polder areas. Regarding the population and economy, it will be useful to enhance coordination between human activities and polder areas while encouraging local residents to actively participate in productive, educational, and research activities related to polder.
This study had some limitations. While this study provides a detailed analysis of the polder area in Gaochun District, Nanjing, it is important to acknowledge that the relationship between “water-polder-village” and “production-living-ecology” may vary depending on the environmental conditions. In future work, it would be meaningful to extend the study to other areas and explore the similarities and differences among various polder areas. Second, limited by the spatial resolution and accuracy of the historical data, the land-use data used in this study were dated to 2017 and 2022. Future studies should consider analyzing data from a broader time range to further enhance this analysis. At the same time, it may be beneficial for future studies to incorporate a broader range of land-use elements into their analysis.

Author Contributions

Author Contributions: Conceptualization, Y.Z.; methodology, Y.Z.; software, Y.Z. and Y.T.; validation, Y.Z.; formal analysis, Y.Z.; data curation, Y.Z. and Y.T.; writing—original draft preparation, Y.Z.; writing—review and editing, W.Z. and Y.Z.; visualization, Y.Z. and Y.T.; supervision, W.Z. All authors have read and agreed to the published version of the manuscript.

Funding

This research was funded by supported by National Key Research and Development Program of China (No. 2019YFD1100700).

Data Availability Statement

Not applicable.

Acknowledgments

Thank you to everyone who contributed to this study.

Conflicts of Interest

The authors declare no conflict of interest.

Appendix A

Figure A1. Distribution of distance to water.
Land 12 01714 g0a1
Figure A2. Distribution of distance to the road.
Land 12 01714 g0a2
Figure A3. Distribution of DEM.
Land 12 01714 g0a3
Figure A4. Distribution of village density.
Land 12 01714 g0a4
Figure A5. Distribution of population density.
Land 12 01714 g0a5
Figure A6. Distribution of catering density.
Land 12 01714 g0a6
Table A1. OLS model coefficients and collinearity diagnosis.
VariablesModel 1: 2017Model 2: 2022
CoefficientVIFCoefficientVIF
X10.279 ***1.050.177 ***1.26
X2−0.389 ***1.19−0.475 ***1.39
X30.064 **1.150.180 ***1.09
X4−0.064 **1.25−0.104 ***1.23
X5−0.150 ***2.11−0.098 ***2.15
X6−0.0431.96−0.072 **1.99
** p < 0.05, *** p < 0.01.

Notes

1
Local gazetteers are comprehensive records of China’s local history, compiled by officials and local gentry, containing detailed information about landscapes, culture, and notable figures.
2
https://scihub.copernicus.eu/ (accessed on 26 October 2022).
3
https://www.openstreetmap.org (accessed on 5 January 2023).
4
https://www.earthdata.nasa.gov/ (accessed on 29 December 2022).
5
https://www.worldpop.org/ (accessed on 5 January 2023).
6
https://lbs.amap.com/ (accessed on 9 January 2023).

References

  1. Li, Y.; Ye, Y.; Zhang, C.; Li, J.; Fang, X. A spatially explicit reconstruction of cropland based on expansion of polders in the Dongting Plain in China during 1750–1985. Reg. Environ. Chang. 2019, 19, 2507–2519. [Google Scholar] [CrossRef]
  2. Segeren, W.A. Introduction to polders of the world. Water Int. 1983, 8, 51–54. [Google Scholar] [CrossRef]
  3. Wang, J.; Gao, M.; Guo, H.; Chen, E. Spatiotemporal distribution and historical evolution of polders in the Dongting Lake area. China. J. Geogr. Sci. 2016, 26, 1561–1578. [Google Scholar] [CrossRef]
  4. Qiu, M.; Dai, D. Inheritance and development of traditional eco-wisdom of polder landscape in Yangtze River Region based on landscape regeneration. Chin. Landsc. Archit. 2019, 35, 94–98. [Google Scholar]
  5. Ji, F.; Zhang, X.; Ding, R.; Zheng, W. Planning strategy and practice of polder blue-green space in the lower reaches of the Shuiyang River. Planners 2023, 39, 139–144. [Google Scholar]
  6. Wang, J.; Tang, C.; Yan, W. Mechanism and pattern of polders in the Yangtze River Delta: Effective physical form for ecosystem services provision. Landsc. Archit. 2018, 1, 38–44. [Google Scholar] [CrossRef]
  7. Guo, W.; Hou, X. From land consolidation to comprehensive planning summary and implications of the evolution of rural landscape renovation in The Netherlands. Landsc. Archit. 2016, 9, 115–120. [Google Scholar]
  8. Li, Z.; Lu, X.; Han, X.; Wang, L.; Tang, X.; Lin, X. Quantitative morphology of polder landscape based on SOM identification model: Case study of typical polders in the south of Yangtze River. Comput. Intel. Neurosci. 2022, 2022, 1362272. [Google Scholar] [CrossRef]
  9. Li, Y.; Ye, Y.; Li, J.; Zhang, C.; Fang, X. Reconstructing the spatiotemporal distribution of polders in modern Dongting Plain, Hunan Province. Appl. Geogr. 2020, 123, 102250. [Google Scholar] [CrossRef]
  10. Xie, Y.; Ying, J.; Chen, L. Typology, morphogenesis and adaptive transformation of Polder landscape in the Yangtze River Delta. Urb. Dev. Stud. 2022, 29, 70–77. [Google Scholar]
  11. Nijhuis, S.; Bing, H. Polderscapes: The landscape architecture of the Dutch Lowlands. Landsc. Archit. 2016, 8, 38–57. [Google Scholar] [CrossRef]
  12. Sun, J.; Zhang, L. Analysis on traditional polder landscape of Jiangnan area: A case study of Furongwei polder. Agric. Hist. China 2022, 41, 55–65. [Google Scholar]
  13. Adnan, M.S.G.; Abdullah, A.M.; Dewan, A.; Hall, J.W. The effects of changing land use and flood hazard on poverty in coastal Bangladesh. Land Use Policy 2020, 99, 104868. [Google Scholar] [CrossRef]
  14. Gao, Y.; Yuan, Y.; Wang, H.; Zhang, Z.; Ye, L. Analysis of impacts of polders on flood processes in Qinhuai River Basin, China, using the HEC-RAS model. Water Supp. 2018, 18, 1852–1860. [Google Scholar] [CrossRef]
  15. Laks, I.; Walczak, Z. Efficiency of polder modernization for flood protection. case study of golina polder (Poland). Sustainability 2020, 12, 8056. [Google Scholar] [CrossRef]
  16. Dewan, C.; Mukherji, A.; Buisson, M.-C. Evolution of water management in coastal Bangladesh: From temporary earthen embankments to depoliticized community-managed polders. Water Int. 2015, 40, 401–416. [Google Scholar] [CrossRef]
  17. Yan, R.; Li, L.; Gao, J. Modelling the regulation effects of lowland polder with pumping station on hydrological processes and phosphorus loads. Sci. Total Environ. 2020, 637, 200–207. [Google Scholar] [CrossRef]
  18. Wang, Y.W.; Pendlebury, J.; Nolf, C. The water heritage of China: The polders of Tai Lake Basin as continuing landscape. Plan. Perspect. 2022, 117315. [Google Scholar] [CrossRef]
  19. Tang, B.; Zhan, X.; Zhang, J. The agricultural heritage value of the polder system in Gaochun, Nanjing. Built Herit. 2019, 3, 47–58. [Google Scholar] [CrossRef]
  20. Fei, H.T. Peasant. Life in China: A Field Study of Country Life in the Yangtze Valley; Routledge: London, UK, 1939. [Google Scholar]
  21. Guo, W.; Hou, X. Dike, Reclamation and settlement: Landscape architectural analysis of polder landscape in Xiaoshao region. Chin. Landsc. Archit. 2016, 32, 41–48. [Google Scholar]
  22. Zhuang, H.; Man, C. The construction and management of Weitian along the Yangtze River region within Anhui Province. J. Grad. School Chin. Acad. Soc. Sci. 2013, 6, 120–124. [Google Scholar]
  23. Hooimeijer, F.L. The Tradition of Making: Polder Cities; Delft University of Technology: Delft, The Netherlands, 2011. [Google Scholar]
  24. Spoormans, L.; Navas-Carrillo, D.; Zijlstra, H.; Pérez-Cano, T. Planning history of a Dutch new town: Analysing Lelystad through its residential neighbourhoods. Urb. Plan. 2019, 4, 102–116. [Google Scholar] [CrossRef]
  25. Missiaen, T.; Jongepier, I.; Heirman, K.; Soens, T.; Gelorini, V.; Verniers, J.; Verhegge, J.; Crombe, P. Holocene landscape evolution of an estuarine wetland in relation to its human occupation and exploitation: Waasland Scheldt polders, northern Belgium. Neth. J. Geosci. 2017, 96, 35–62. [Google Scholar] [CrossRef]
  26. Wei, X.; Ye, Y.; Zhang, Q.; Li, B.; Wei, Z. Reconstruction of cropland change in North China Plain Area over the past 300 years. Glob. Planet. Change 2019, 176, 60–70. [Google Scholar] [CrossRef]
  27. Long, Y.; Jin, X.; Yang, X.; Zhou, Y. Reconstruction of historical arable land use patterns using constrained cellular automata: A case study of Jiangsu, China. Appl. Geogr. 2014, 52, 67–77. [Google Scholar] [CrossRef]
  28. Li, Z.; Lu, X.; Shi, J.; Huang, R.; Gao, Y. Quantitative research of landscape texture for polders in Xuanwu Plain based on morphological index: A case study of Yongfeng Polder, Gucheng Lake. Chin. Landsc. Archit. 2023, 39, 41–46. [Google Scholar] [CrossRef]
  29. Paradis, E. Probabilistic unsupervised classification for large-scale analysis of spectral imaging data. Int. J. Appl. Earth Observ. Geoinf. 2022, 107, 102675. [Google Scholar] [CrossRef]
  30. Phiri, D.; Simwanda, M.; Salekin, S.; Nyirenda, V.R.; Murayama, Y.; Ranagalage, M. Sentinel-2 data for land cover/use mapping: A review. Remote Sens. 2020, 12, 2291. [Google Scholar] [CrossRef]
  31. Rana, V.K.; Venkata Suryanarayana, T.M. Performance evaluation of MLE, RF and SVM classification algorithms for watershed scale land use/land cover mapping using sentinel 2 bands. Remote Sens. Appl. Soc. Environ. 2020, 19, 100351. [Google Scholar] [CrossRef]
  32. Alves, A.; Marcelino, F.; Gomes, E.; Rocha, J.; Caetano, M. Spatiotemporal land-use dynamics in continental Portugal 1995–2018. Sustainability 2020, 14, 14450. [Google Scholar] [CrossRef]
  33. Uddin, M.P.; Al Mamun, M.; Hossain, M.A. PCA-based feature reduction for hyperspectral remote sensing image classification. IETE Technol. Rev. 2021, 38, 377–396. [Google Scholar] [CrossRef]
  34. Peña Zamalloa, G.R. Spatial classification of urban land by speculative land value and MSI satellite imagery using K-means, in Huancayo, Peru. Urbano 2021, 24, 70–83. [Google Scholar] [CrossRef]
  35. Liu, J.; Wang, J.; Wang, S.; Wang, J.; Deng, G. Analysis and simulation of the spatiotemporal evolution pattern of tourism lands at the Natural World Heritage Site Jiuzhaigou, China. Hab Int. 2018, 79, 74–88. [Google Scholar] [CrossRef]
  36. Qin, F.; Fukamachi, K.; Shibata, S. Land-use/landscape pattern changes and related environmental driving forces in a Dong ethnic minority village in Southwestern China. Land 2022, 11, 349. [Google Scholar] [CrossRef]
  37. Zhang, Q.; Luo, G.; Li, L.; Zhang, M.; Lv, N.; Wang, X. An analysis of oasis evolution based on land use and land cover change: A case study in the Sangong River Basin on the northern slope of the Tianshan Mountains. J. Geogr. Sci. 2017, 27, 223–239. [Google Scholar] [CrossRef]
  38. Simwanda, M.; Murayama, Y. Spatiotemporal patterns of urban land use change in the rapidly growing city of Lusaka, Zambia: Implications for sustainable urban development. Sustain. Cities Soc. 2018, 39, 262–274. [Google Scholar] [CrossRef]
  39. Tian, G.; Qiao, Z.; Gao, X. Rural settlement land dynamic modes and policy implications in Beijing metropolitan region, China. Hab Int. 2014, 44, 237–246. [Google Scholar] [CrossRef]
  40. Yang, S.; Hu, S.; Wang, S.; Zou, L. Effects of rapid urban land expansion on the spatial direction of residential land prices: Evidence from Wuhan, China. Hab Int. 2020, 101, 102186. [Google Scholar] [CrossRef]
  41. Pan, Y.; Chen, S.; Niu, S.; Ma, Y.; Tang, K. Investigating the impacts of built environment on traffic states incorporating spatial heterogeneity. J. Transp. Geogr. 2019, 83, 102663. [Google Scholar] [CrossRef]
  42. Zhao, R.; Zhan, L.; Yao, M.; Yang, L. A geographically weighted regression model augmented by Geodetector analysis and principal component analysis for the spatial distribution of PM2. 5. Sustain. Cities Soc. 2020, 56, 102106. [Google Scholar] [CrossRef]
  43. Huang, Z.; Chen, R.; Xu, D.; Zhou, W. Spatial and hedonic analysis of housing prices in Shanghai. Hab Int. 2017, 67, 69–78. [Google Scholar] [CrossRef]
  44. Pan, Y.; Chen, S.; Li, T.; Niu, S.; Tang, K. Exploring spatial variation of the bus stop influence zone with multi-source data: A case study in Zhenjiang, China. J. Transp. Geogr. 2019, 76, 166–177. [Google Scholar] [CrossRef]
  45. Zhang, W.; Wang, M.Y. Spatial-temporal characteristics and determinants of land urbanization quality in China: Evidence from 285 prefecture-level cities. Sustain. Cities Soc. 2018, 38, 70–79. [Google Scholar] [CrossRef]
  46. Li, L.; Wang, L.; Qi, Z. The spatiotemporal variation of farmland use transition and its critical influential factors in coordinated urban-rural regions: A case of Chongqing in western China. Sustain. Cities Soc. 2021, 70, 102921. [Google Scholar] [CrossRef]
  47. An, X.; Jin, W.; Zhang, H.; Liu, Y.; Zhang, M. Analysis of long-term wetland variations in China using land use/land cover dataset derived from landsat images. Ecol. Indic. 2022, 145, 109689. [Google Scholar] [CrossRef]
  48. Li, H.; Song, W. Evolution of rural settlements in the Tongzhou District of Beijing under the new-type urbanization policies. Habitat. Int. 2020, 101, 102198. [Google Scholar] [CrossRef]
  49. Song, S.; Wang, S.; Ye, H.; Guan, Y. Exploratory analysis on the spatial distribution and influencing factors of Beitang landscape in the Shangzhuang Basin. Land 2022, 11, 418. [Google Scholar] [CrossRef]
  50. Wei, H.; Lu, C.; Liu, Y. Farmland changes and their ecological impact in the Huangshui River Basin. Land 2021, 10, 1082. [Google Scholar] [CrossRef]
Figure 1. Study area: (a) The location of the study area in China; (b) The location of the study area in Jiangsu Province; (c) The boundary of the study area and the distribution of geographical elements.
Land 12 01714 g001
Figure 2. Land use classification.
Land 12 01714 g002
Figure 3. Satellite and classification images for 2017 and 2022.
Land 12 01714 g003aLand 12 01714 g003b
Figure 4. Land use in 2017 and 2022.
Land 12 01714 g004
Figure 5. Index of change amount.
Land 12 01714 g005
Figure 6. Sankey diagram of land-use type transfer. The values in the left column in parentheses represent the ratio of outflow area to total area in 2017, whereas the values in the right column in parentheses represent the ratio of inflow area to total area in 2022. Orange, blue, and green represent the land use of the village, water, and polder in 2017.
Land 12 01714 g006
Figure 7. Spatial distribution of land-use transfer types.
Land 12 01714 g007
Figure 8. Spatial distribution for the coefficients of distance to the water.
Land 12 01714 g008
Figure 9. Spatial distribution for the coefficients of DEM.
Land 12 01714 g009
Figure 10. Spatial distribution for the coefficients of distance to the road.
Land 12 01714 g010
Figure 11. Spatial distribution for the coefficients of village density.
Land 12 01714 g011
Figure 12. Spatial distribution for the coefficients of population density.
Land 12 01714 g012
Figure 13. Spatial distribution for the coefficients of catering density.
Land 12 01714 g013
Table 1. Variables of the driving force model.
CategoryVariable NameAbbreviationDescription
PolderProportion of polderY/PPProportion of polder in each grid
Natural and ecological factorsDistance to waterX1/DWThe Euclidean distance to water spaces (meter)
ElevationX2/DEMMean elevation of each grid
Development and construction factorsDistance to roadX3/DRThe Euclidean distance to roads (meter)
Village densityX4/VDThe density of village POI
Population and economic factorsPopulation densityX5/PDMean population density of each grid
Catering densityX6/SDThe density of catering POI
Table 2. Land use area and proportion in 2017 and 2022.
YearWaterPolderVillageTotal
20177553.39 (26.94%)14,902.11 (53.15%)5581.72 (19.91%)28,037.22 (100%)
20225780.22 (20.62%)13,724.12 (48.95%)8532.87 (30.43%)
(The land use areas are measured in hectares, with the proportion of each type’s area to the total area indicated in parentheses.)
Table 3. Index of change degree and type.
Land-Use TypeLa D c
Water28.28%16.60%
Polder16.98%9.31%
Village22.29%47.43%
Table 4. Moran’s I test result for independent variables.
VariablesMoran’s Iz-Scorep-Value
X1 (17)0.60129.1060.000
X1 (22)0.83640.5180.000
X20.83740.6350.000
X3 (17)0.82440.0050.000
X3 (22)0.85341.5930.000
X40.97847.2650.000
X50.87142.4310.000
X60.84542.1530.000
Table 5. Regression results and diagnosis.
OLSGWR
2017202220172022
Model 1Model 2Model 3Model 4
R20.3230.3650.6140.586
AICC3058.072978.382500.58 2585.82
Disclaimer/Publisher’s Note: The statements, opinions and data contained in all publications are solely those of the individual author(s) and contributor(s) and not of MDPI and/or the editor(s). MDPI and/or the editor(s) disclaim responsibility for any injury to people or property resulting from any ideas, methods, instructions or products referred to in the content.

