Does Urban Green Infrastructure Increase the Property Value? The Example of Magdeburg, Germany
Abstract
:1. Introduction
2. Materials and Methods
3. Results
3.1. Results of Data Matrix Test and Data Refinement Procedure
3.2. Evaluation of the PC Analysis
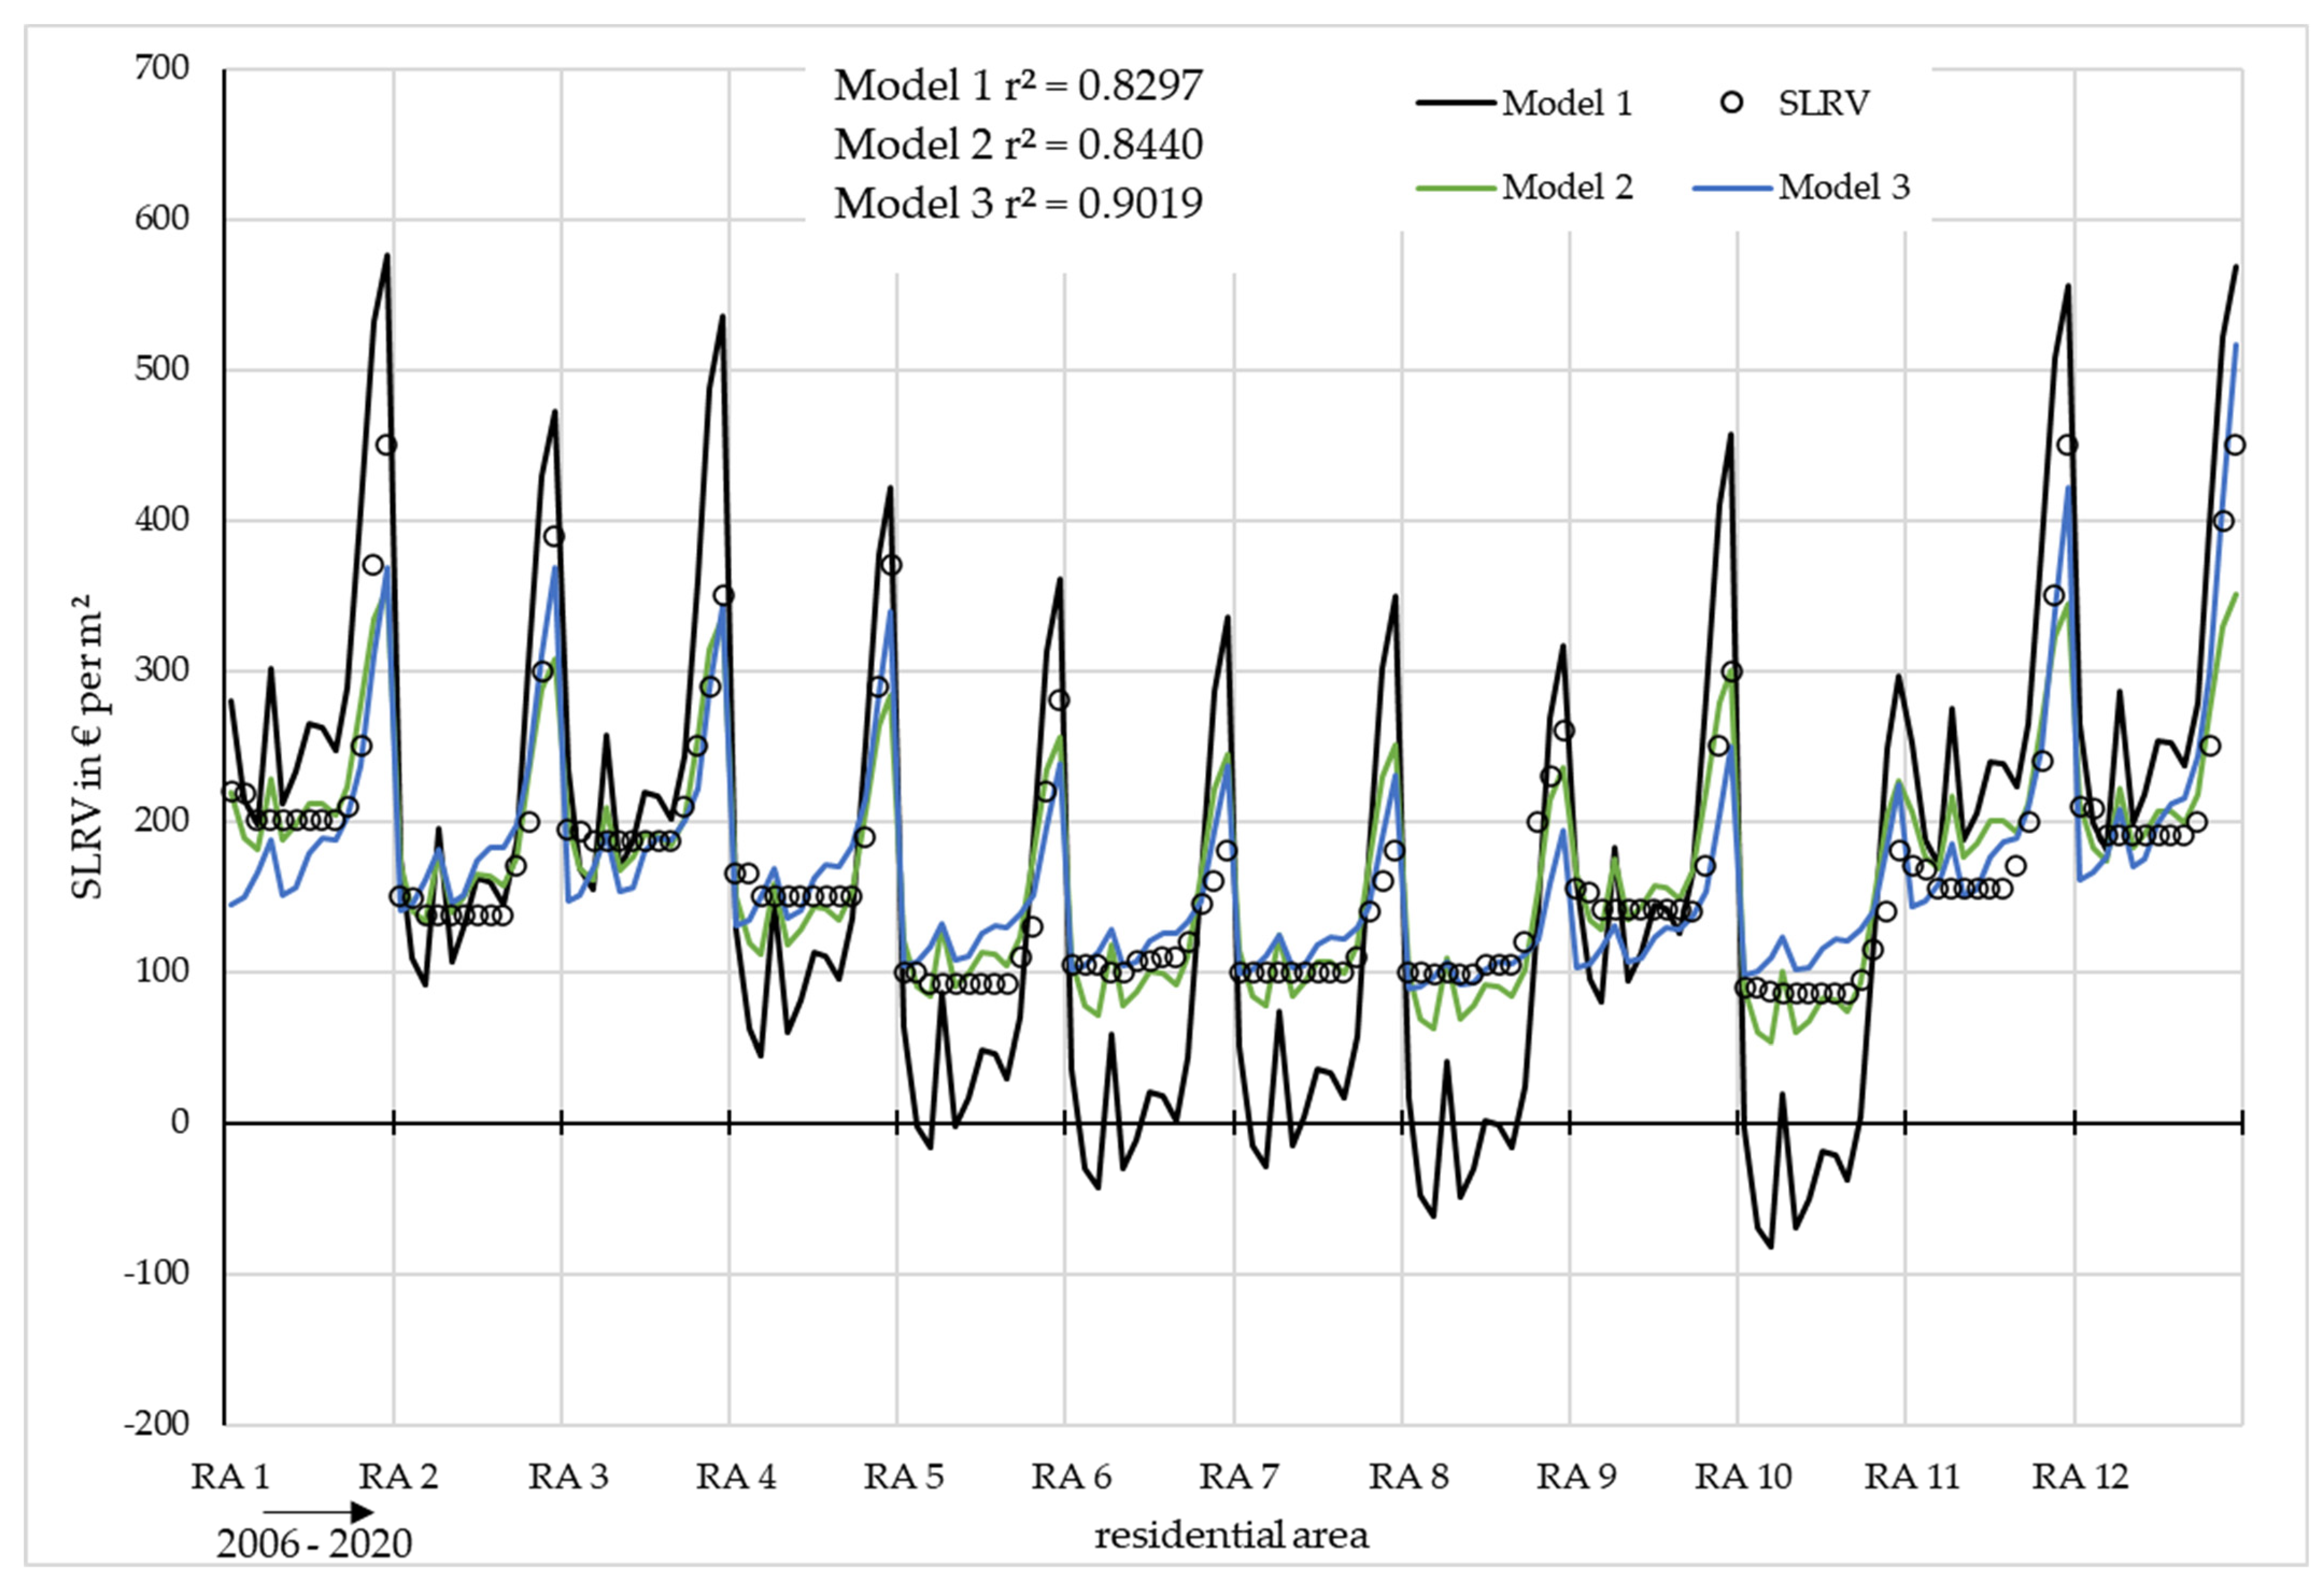
3.3. Results of the Multiple Regression
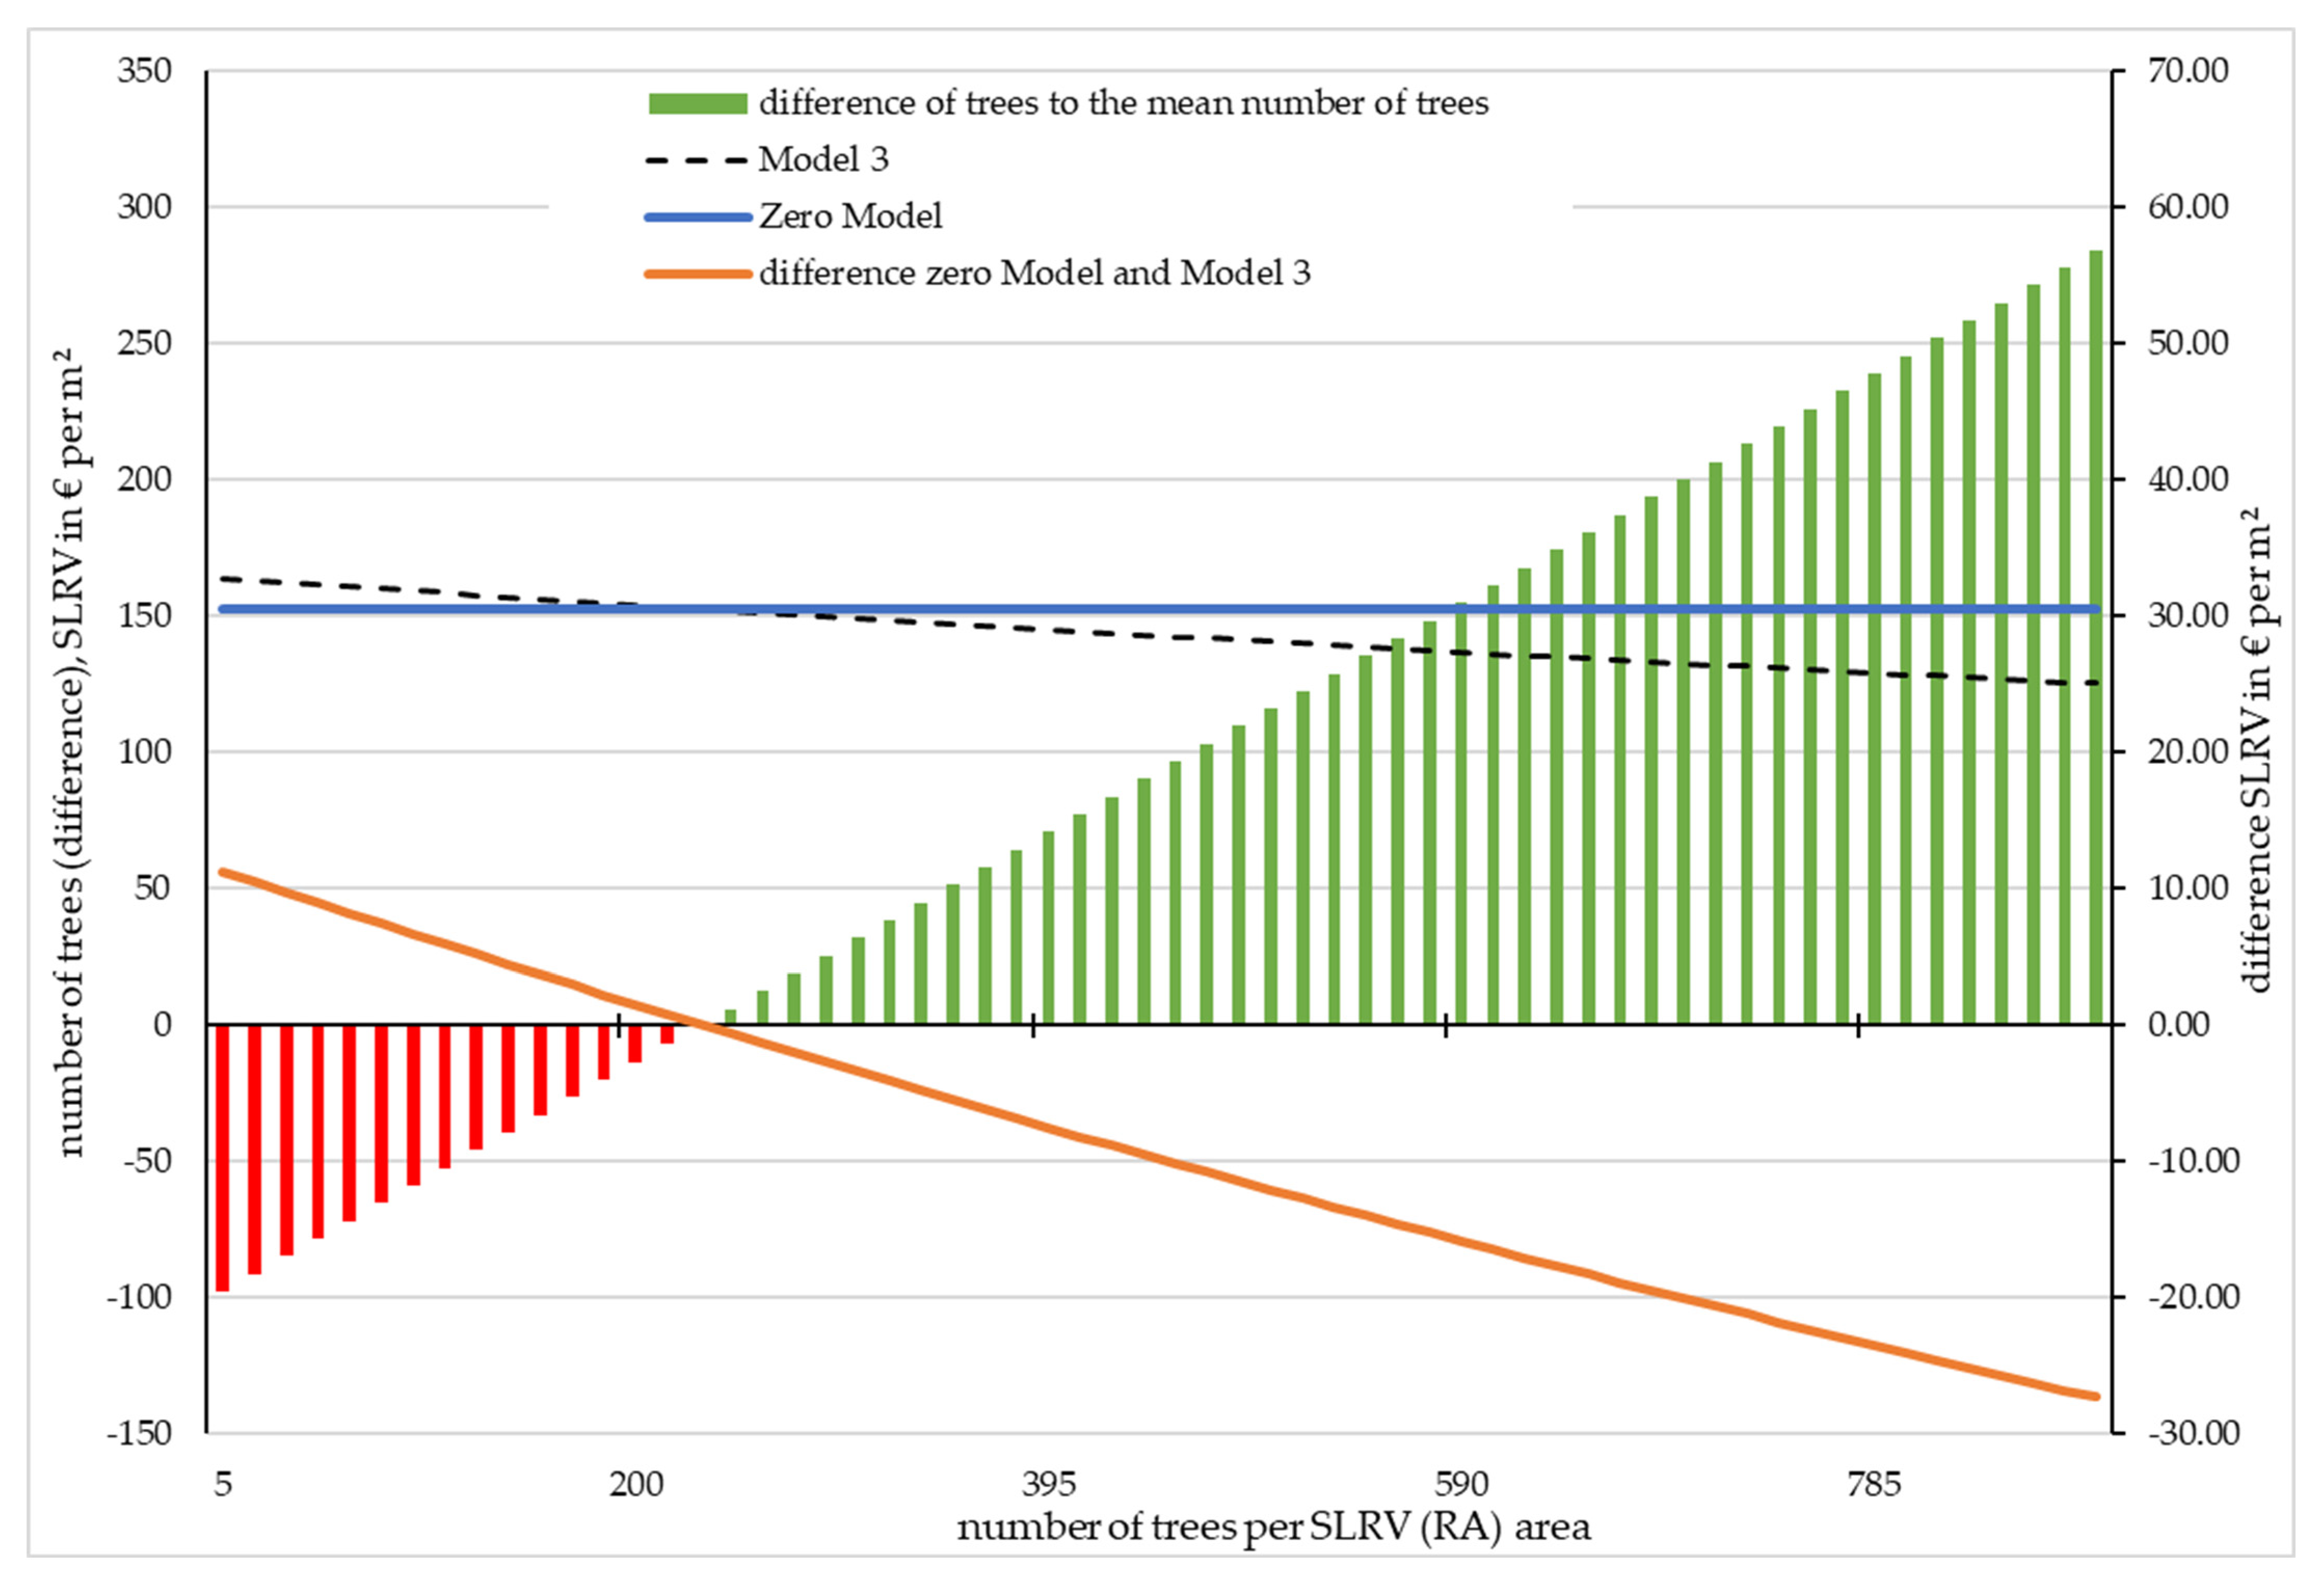
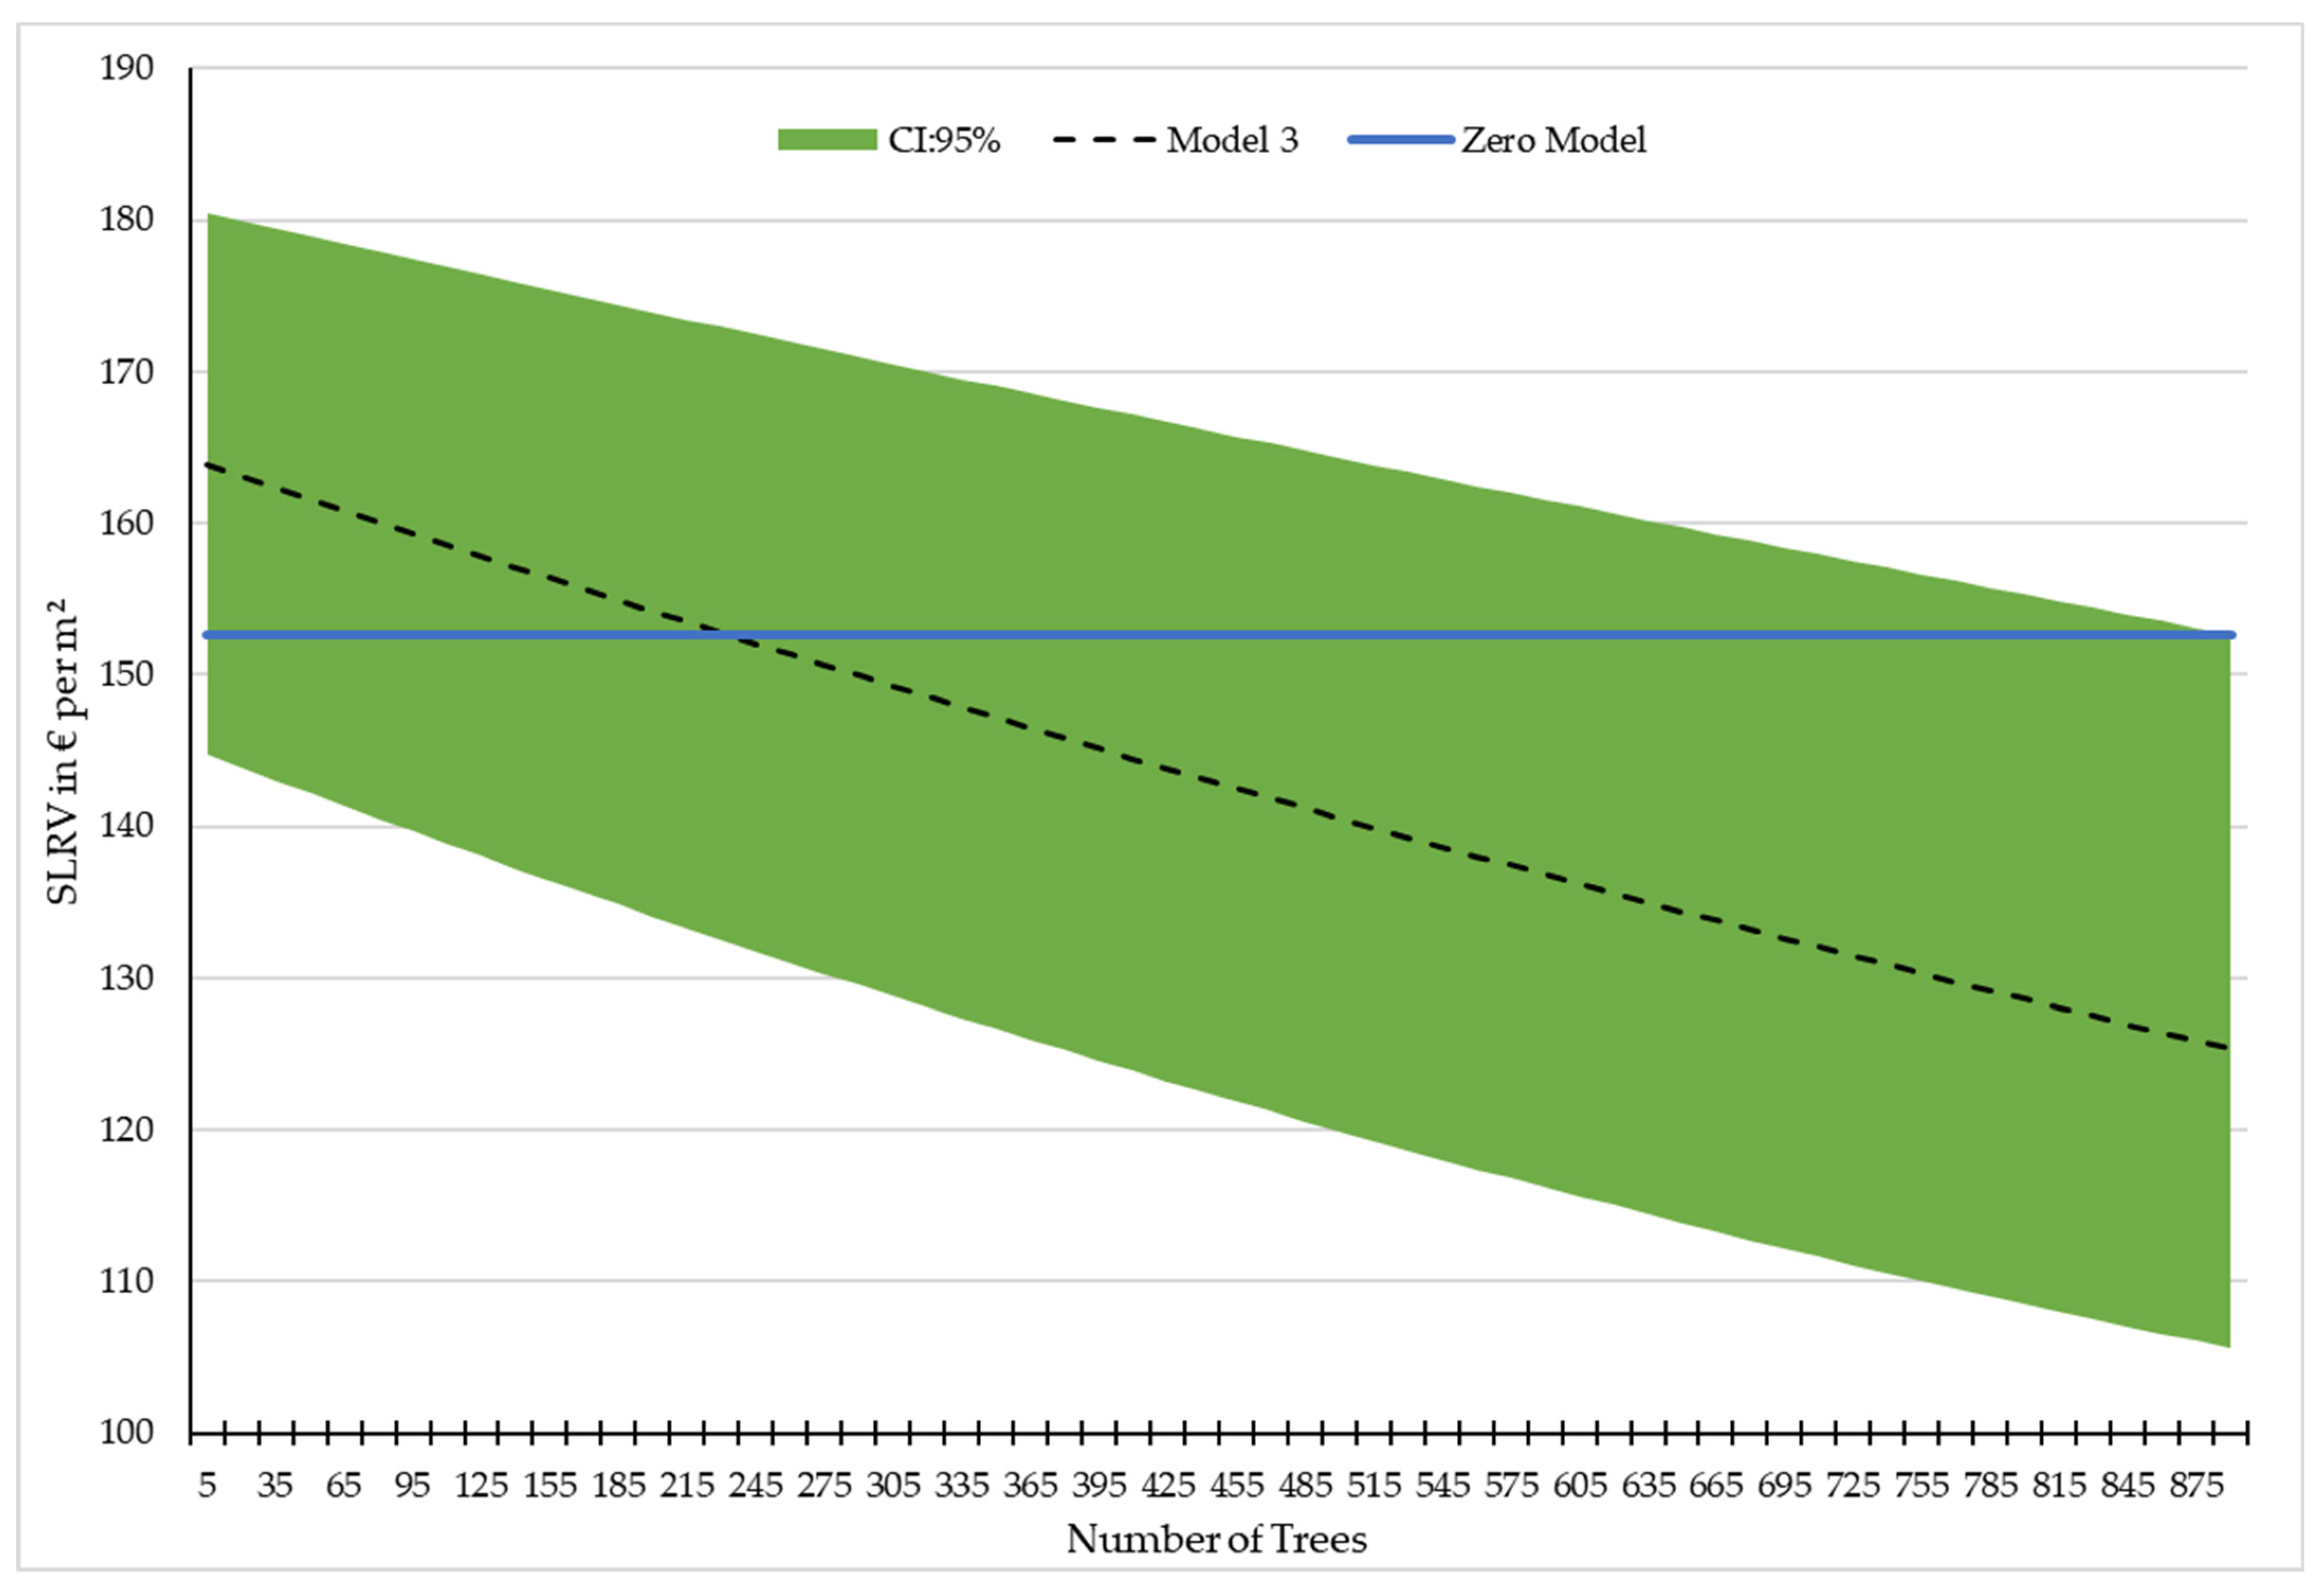
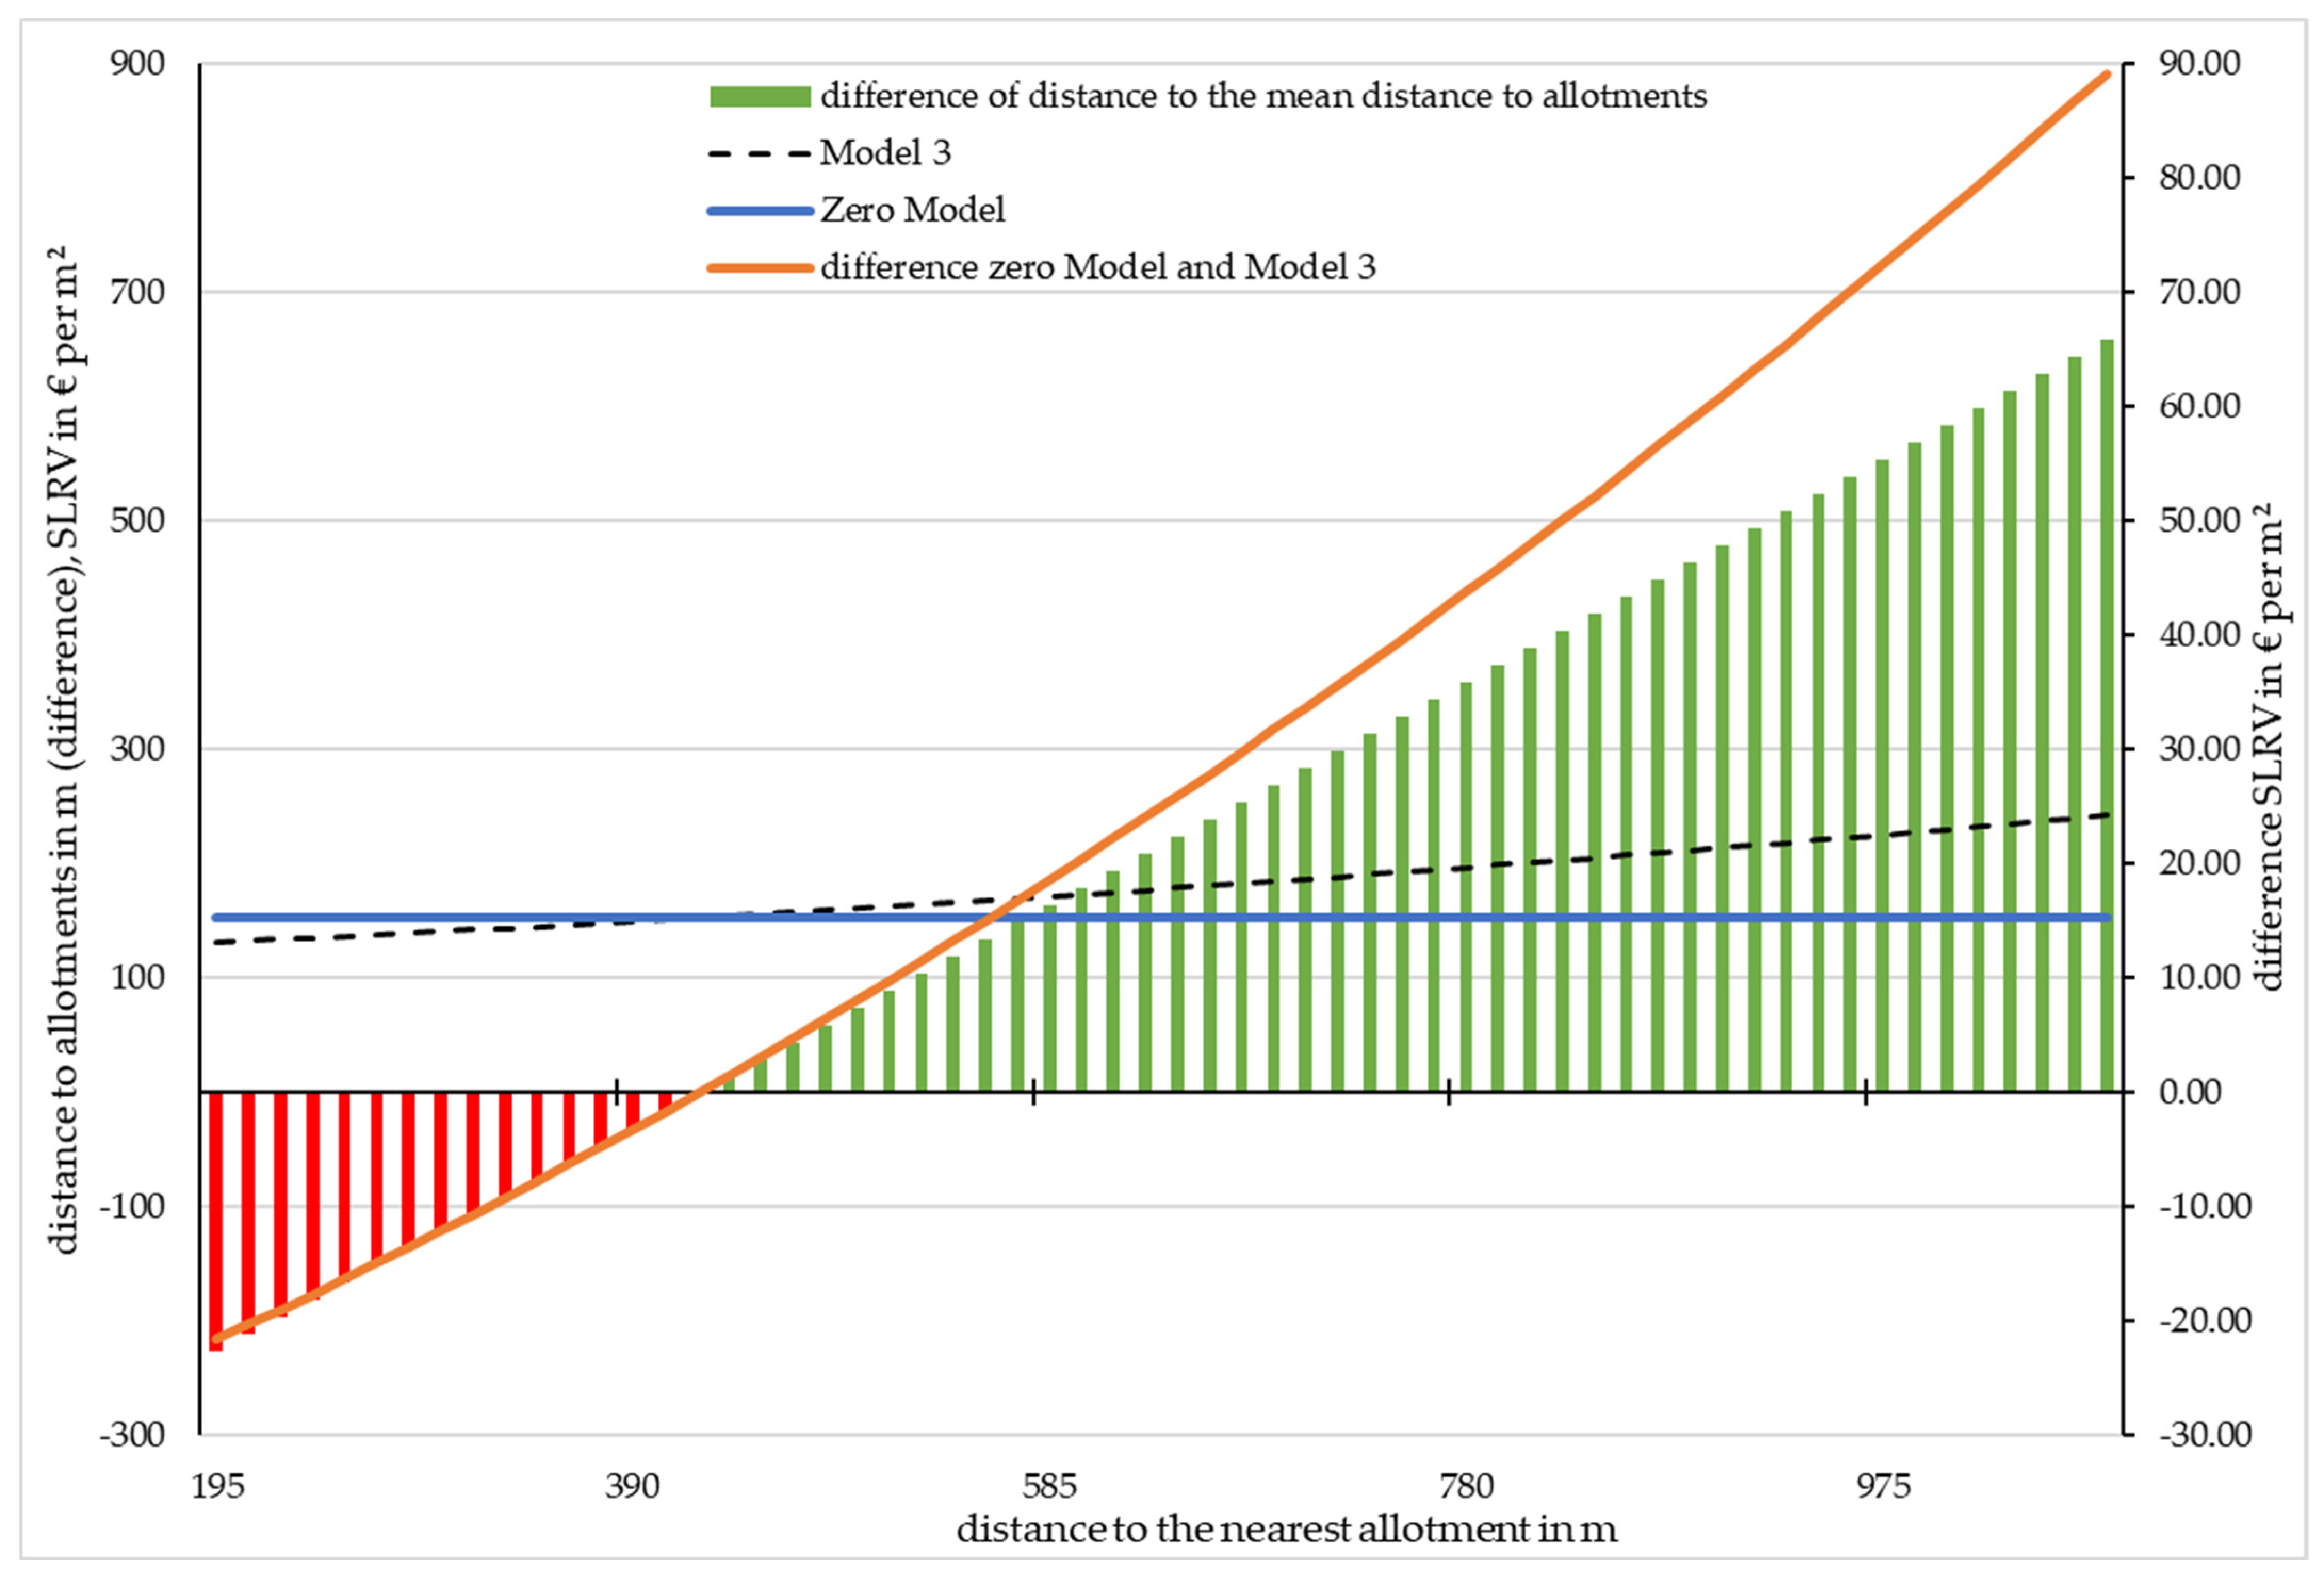
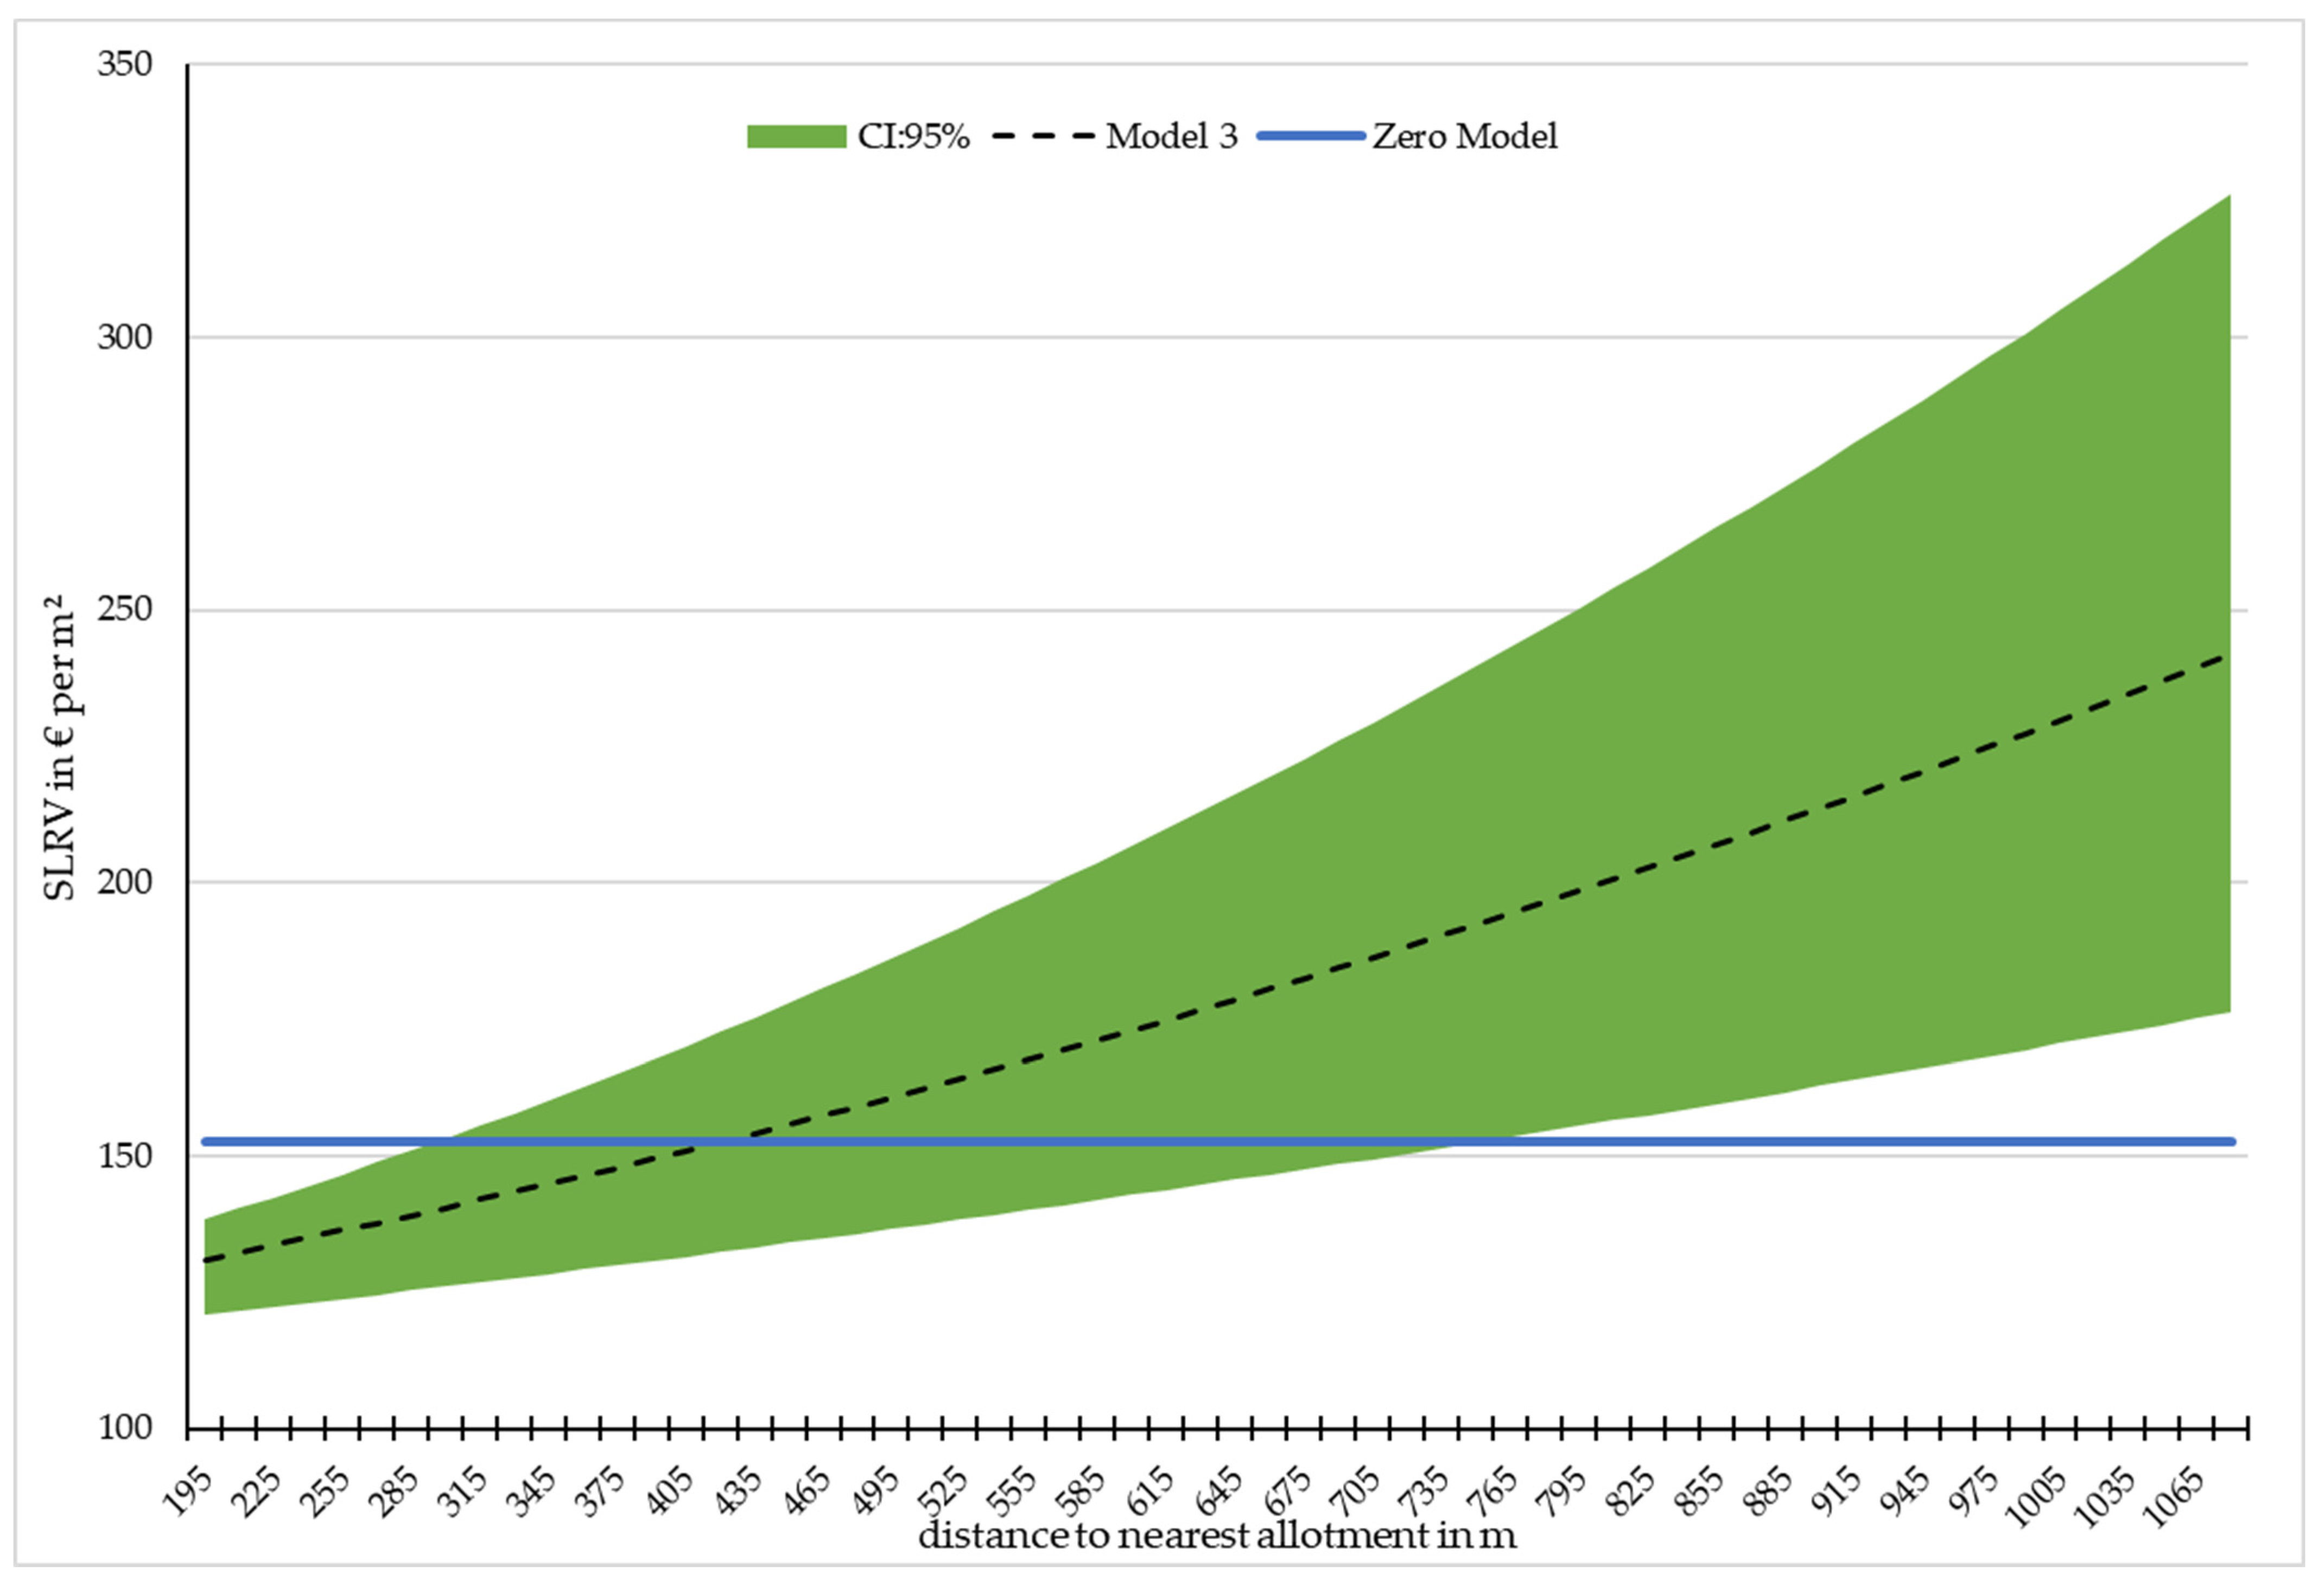
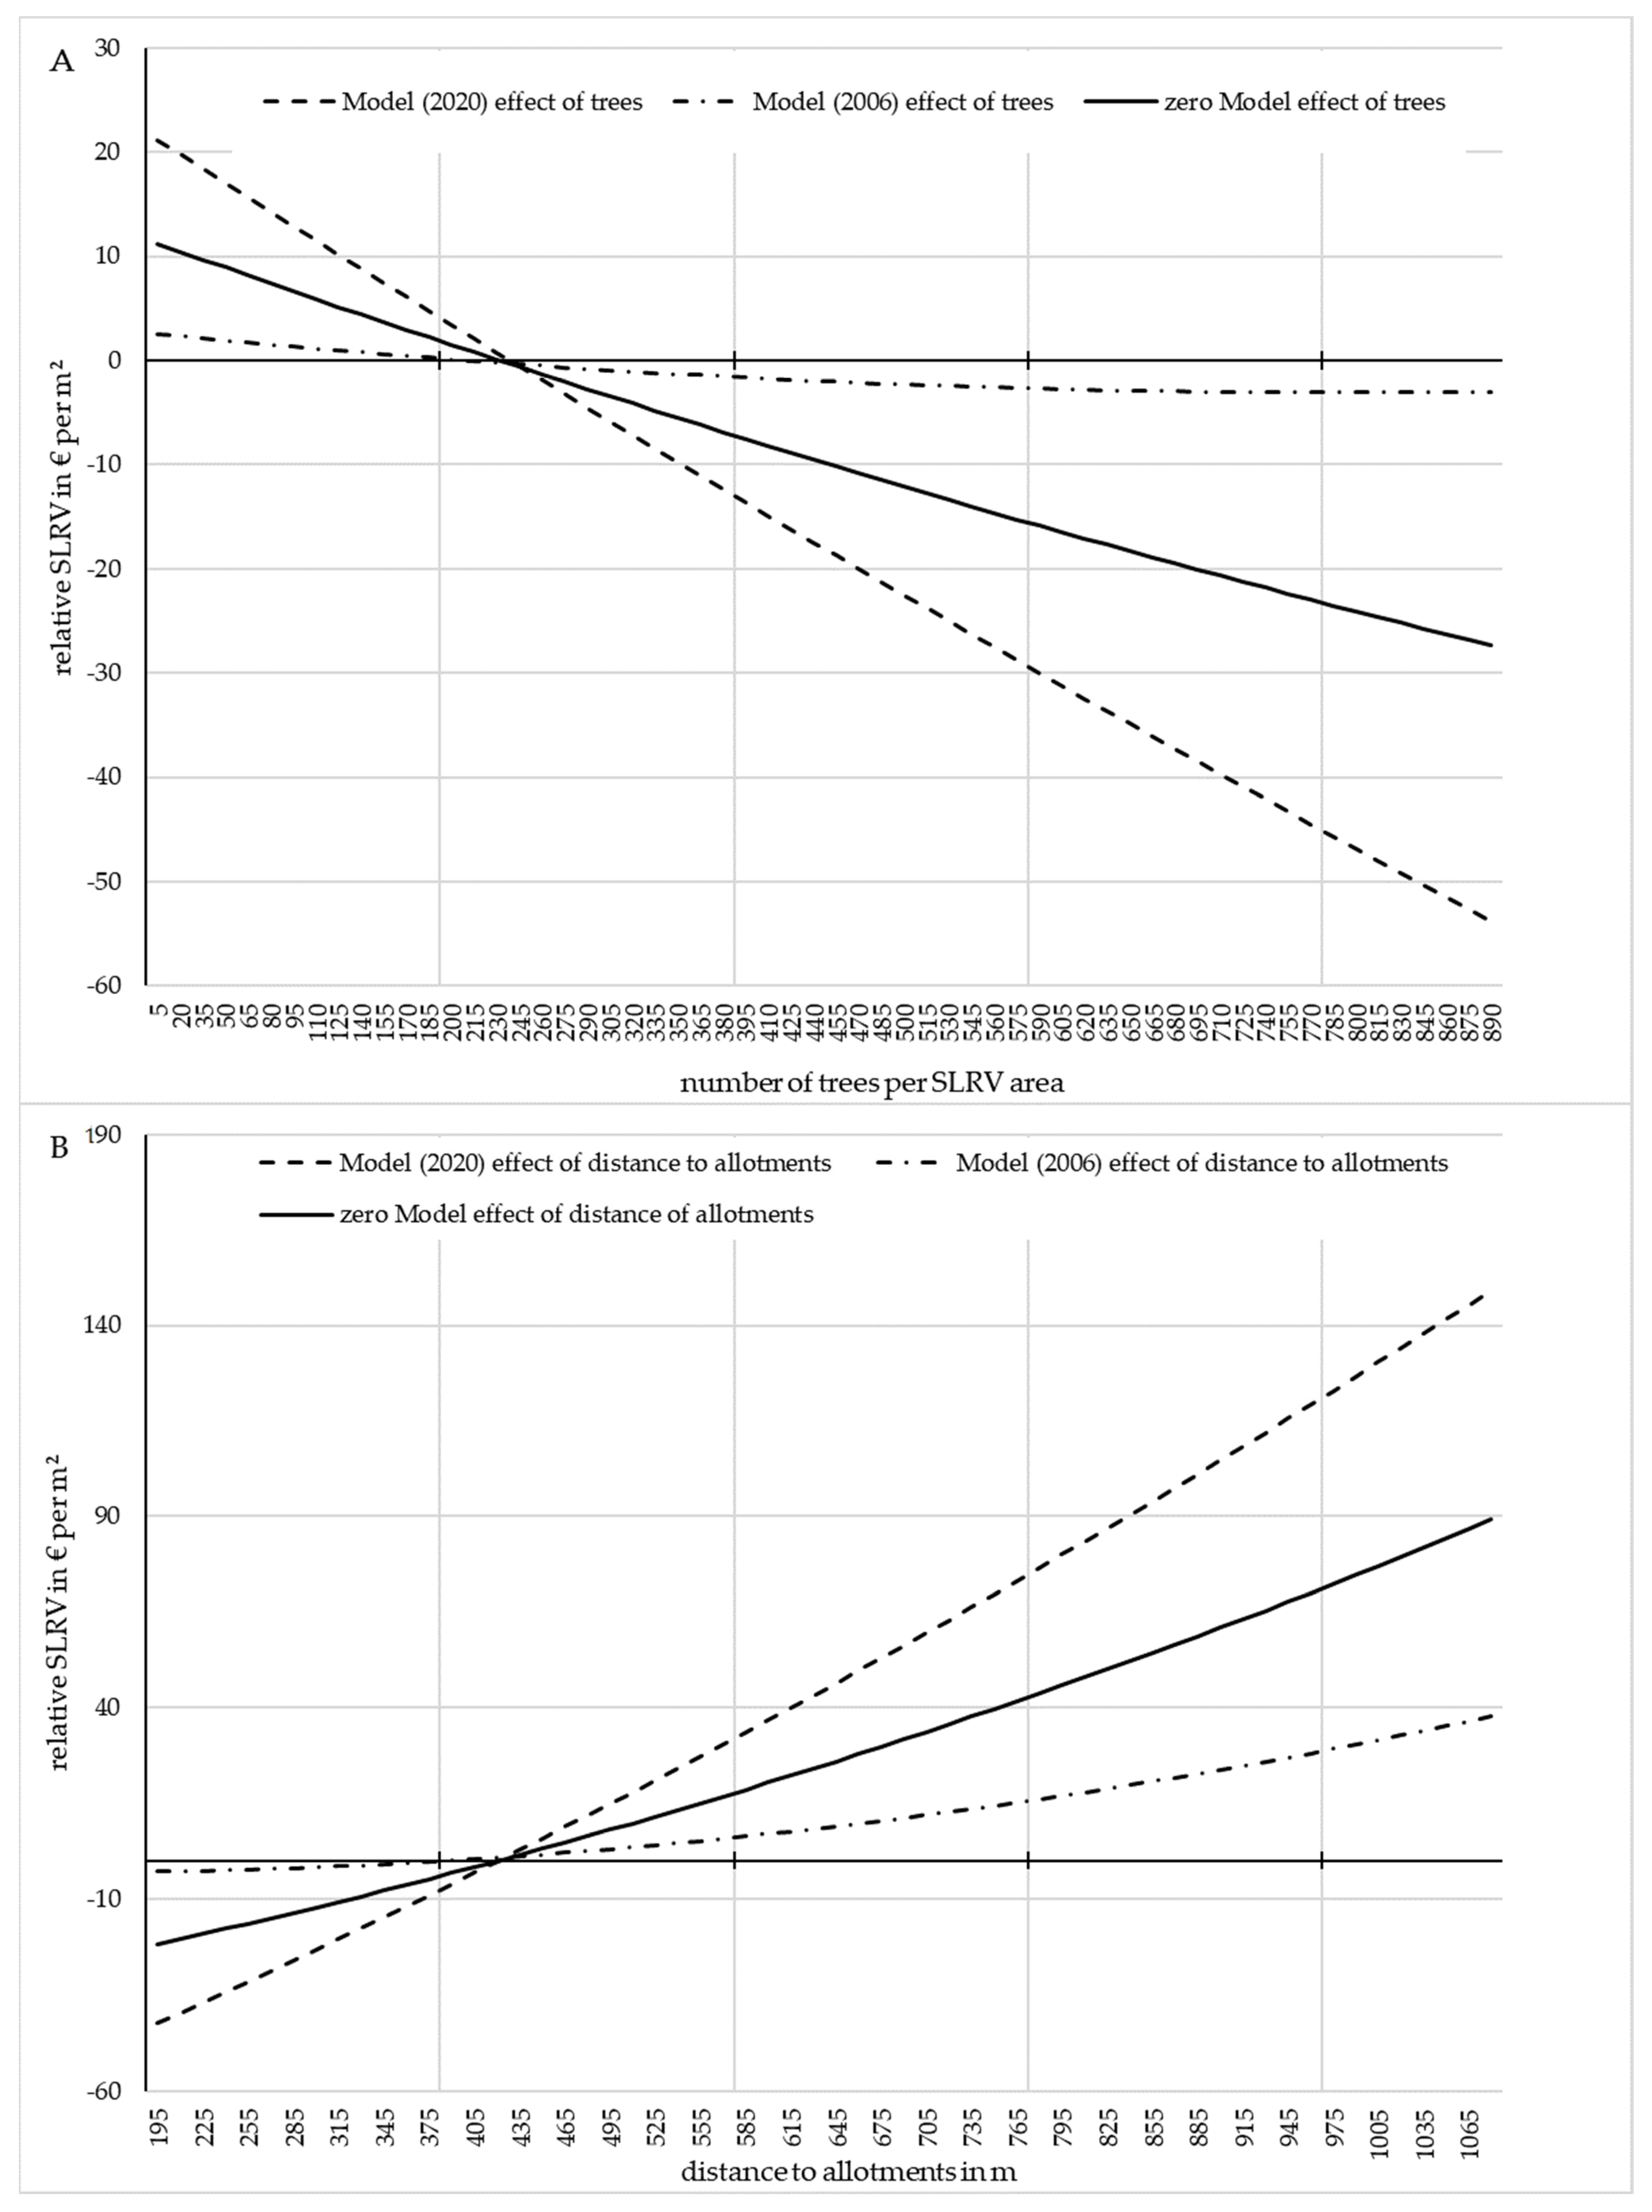
3.4. Relationship between the Standard Land Values and Components of the Green Infrastructure
4. Discussion
5. Conclusions
Author Contributions
Funding
Data Availability Statement
Conflicts of Interest
References
- LABO Bund/Länder-Arbeitsgemeinschaft Bodenschutz (Hrsg.) (2012): Reduzierung der Flächeninanspruchnahme. Statusbericht zu den LABO-Berichten vom 21.09.2011 sowie 30.03.2010. Bericht zur Vorlage an die Umweltministerkonferenz. Available online: https://www.labo-deutschland.de/documents/1_Anlage_LABO_Reduzierung_der_Flaecheninanspruchnahme_f11.PDF (accessed on 14 October 2015).
- Hoymann, J.; Goetzke, R. Flächenmanagement, pp. 154–196, ARL—Akademie für Raumforschung und Landesplanung (Hrsg.): Handwörterbuch der Stadt-und Raumentwicklung Hannover 2018, ISBN 978-3-88838-559-9 (PDF-Version). 2018. Available online: http://nbn-resolving.de/urn:nbn:de:0156-55993 (accessed on 10 July 2023).
- Ingenieurtechnischer Verband Altlasten, e.V. (ITVA), Berlin 1998, 25 S., Erarbeitet im ITVA-Fachausschuss C 5 Flächenrecycling“. Available online: https://www.itv-altlasten.de/publikationen/arbeitshilfen-und-richtlinien/flaechenrecycling.html (accessed on 28 June 2023).
- Bundesministerium für Umwelt, Naturschutz, Bau und Reaktorsicherheit (BMUB). Grün in der Stadt—Für eine Lebenswerte Zukunft; Grünbuch Stadtgrün: Berlin, Germany, 2015. [Google Scholar]
- Government of Germany; Thiel, F. Wertsteigerung Durch Grünflächen—Wer Profitiert? Informationen zur Raumentwicklung: Bonn, Germany, 2016; pp. 691–701. [Google Scholar]
- Schneider, P.; Fauk, T.; Mihai, F.-C. Reclaiming Urban Brownfields and Industrial Areas-Potentials for Agroecology. In Agroecological Approaches for Sustainable Soil Management; Prasad, M.N.V., Kumar, C., Eds.; Wiley: Hoboken, NJ, USA, 2023; pp. 409–436. ISBN 978-1-119-91198-2. [Google Scholar]
- Debus, M. Bodenrichtwertableitung in der Praxis. In Kreditwirtschaftliche Wertermittlungen. 8; Pohnert, F., Ed.; Auflage: Wiesbaden, Germany, 2015. [Google Scholar]
- Kleiber, W. Verkehrswertermittlung von Grundstücken, Kommentar und Handbuch. 7; Auflage: Köln, Germany, 2014. [Google Scholar]
- The American Society of Landscape Architects. Professional Practice—Green Infrastructure. 2019. Available online: https://www.asla.org/greeninfrastructure.aspx (accessed on 22 January 2019).
- Kardan, O.; Gozdyra, P.; Misic, B.; Moola, F.; Palmer, L.J.; Paus, T.; Berman, M.G. Neighborhood greenspace and health in a large urban center. Sci. Rep. 2015, 5, 11610. [Google Scholar] [CrossRef]
- Gann, G.; Lamb, D. Ecological Restoration: A Means of Conserving Biodiversity and Sustaining Livelihoods; Society for Ecological Restoration International: Tucson, AZ, USA, 2006. [Google Scholar]
- Fauk, T. Entwicklung eines biologisch-physikalisch basierten Ansatz zur Quantifizierung und Inwertsetzung ausgewählter Ökosystemleistungen von Dachbegrünungen als auch Dachbewässerungssystemen anhand des Stadtteils Stadtfeld Ost der Landeshauptstadt Magdeburg. Master‘s Thesis, Magdeburg-Stendal University of Applied Sciences, Magdeburg, Germany, 2021. [Google Scholar]
- Schwaiger, E.; Berthold, A.; Gaugitsch, H.; Götzl, M.; Milota, E. Wirtschaftliche Bedeutung von Ökosystemleistungen Monetäre Bewertung—Risiken und Potenziale. Umweltbundesamt. 2015. Available online: http://hdl.handle.net/11159/78 (accessed on 10 July 2023).
- Wittowsky, D.; Hoekveld, J.; Welsch, J.; Steier, M. Residential housing prices: Impact of housing characteristics, accessibility and neighbouring apartments—A case study of Dortmund, Germany. Urban Plan. Transp. Res. 2020, 8, 44–70. [Google Scholar] [CrossRef]
- Anderson, S.T.; West, S.E. Open space, residential property values, and spatial context. Reg. Sci. Urban Econ. 2006, 36, 773–789. [Google Scholar] [CrossRef]
- Boyle, A.; Barrilleaux, C.; Scheller, D. Does walkability influence housing prices? Soc. Sci. Q. 2014, 95, 852–867. [Google Scholar] [CrossRef]
- Cervero, R.; Duncan, M. Neighbourhood composition and residential land prices: Does exclusion raise or lower values? Urban Stud. 2004, 41, 299–315. [Google Scholar] [CrossRef]
- Li, W.; Joh, K.; Lee, C.; Kim, J.-H.; Park, H.; Woo, A. Assessing Benefits of Neighborhood Walkabiliy to Single-Family Property Values—A Spatial Hedonic Study in Austin, Texas. J. Plan. Educ. Res. 2015, 35, 471–488. [Google Scholar] [CrossRef]
- Lynch, A.K.; Rasmussen, D.W. Measuring the impact of crime on house prices. Appl. Econ. 2001, 33, 1981–1989. [Google Scholar] [CrossRef]
- Song, Y.; Knaap, G.-J. Measuring the effects of mixed land uses on housing values. Reg. Sci. Urban Econ. 2004, 34, 663–680. [Google Scholar] [CrossRef]
- Geurs, K.T.; van Wee, B. Accessibility evaluation of land-use and transport strategies: Review and research directions. J. Transp. Geogr. 2004, 12, 127–140. [Google Scholar] [CrossRef]
- Bourne, L. The Geography of Housing; Halsted Press: New York, NY, USA, 1981. [Google Scholar] [CrossRef]
- Hanhörster, H.; Lobato, R. Migrants Access to the Rental Housing in Germany: Housing Providers and Allocation Policies. Urban Plan. 2021, 6, 7–18. [Google Scholar] [CrossRef]
- Galvin, R. Do housing rental and sales markets incentivise energy-efficient retrofitting of western Germany’s post-war apartments? Challenges for property owners, tenants, and policymakers. Energy Effic. 2023, 16, 25. [Google Scholar] [CrossRef] [PubMed]
- Köhler, T. Bewertung ausgewählter Ökosystemleistungen im Grünzug der Goetheanlage Magdeburg, Master thesis an der Hochschule Magdeburg-Stendal, Studiengang Ingenieurökologie. Master’s Thesis, Magdeburg-Stendal University of Applied Sciences, Magdeburg, Germany, 2022. [Google Scholar]
- Ali, L.; Haase, A.; Heiland, S. Gentrification through Green Regeneration? Analyzing the Interaction between Inner-City Green Space Development and Neighborhood Change in the Context of Regrowth: The Case of Lene-Voigt-Park in Leipzig, Eastern Germany. Land 2020, 9, 24. [Google Scholar] [CrossRef]
- Bockarjova, M.; Botzen, W.J.W.; van Schie, M.H.; Koetse, M.J. Property price effects of green interventions in cities: A meta-analysis and implications for gentrification. Environ. Sci. Policy 2020, 112, 293–304. [Google Scholar] [CrossRef]
- Rigolon, A.; Németh, J. “We’re not in the business of housing”: Environmental gentrification and the nonprofitization of green infrastructure projects. Cities 2018, 81, 71–80. [Google Scholar] [CrossRef]
- Tsai, I.-C.; Lin, C.-C. Influence of migration policy risk on international market segmentation: Analysis of housing and rental markets in the euro area. Econ. Res. Ekon. Istraživanja 2023, 36, 2121740. [Google Scholar] [CrossRef]
- Mell, I.C.; Henneberry, J.; Hehl-Lange, S.; Keskin, B. To green or not to green: Establishing the economic value of green infrastructure investments in The Wicker, Sheffield. Urban For. Urban Green. 2016, 18, 257–267. [Google Scholar] [CrossRef]
- Dell’Anna, F.; Bravi, M.; Bottero, M. Urban Green infrastructures: How much did they affect property prices in Singapore? Urban For. Urban Green. 2022, 68, 127475. [Google Scholar] [CrossRef]
- Gloor, S.; Göldi Hofbauer, M. Der ökologische Wert von Stadtbäumen bezüglich der Biodiversität (The ecological value of urban trees with respect to biodiversity). In Jahrbuch der Baumpflege; 22. Jg.; SWILD: Zürich, Switzerland, 2018; pp. 33–48. ISBN 978-3-87815-257-6. [Google Scholar]
- Landesvermessungsamt Sachsen-Anhalt, Germany: © GeoBasis-DE/LVermGeo ST (2023). Available online: https://www.geodatenportal.sachsen-anhalt.de/ASmobile/?appid=BORIS (accessed on 25 April 2023).
- Kaltmieten für Magdeburg: HOMEDAY—Preisatlas. Available online: https://www.meinestadt.de/magdeburg/immobilien/mietspiegel (accessed on 25 April 2023).
- Wohnungsboerse—Magdeburg: Tabelle Wohnungsmieten Vergleich im Jahr 2011–2022. Available online: https://www.wohnungsboerse.net/mietspiegel-Magdeburg/7772 (accessed on 25 April 2023).
- Deutsche Bundesbank. Entwicklung des Durchschnittlichen Zinssatzes für Spareinlagen* in Deutschland in den Jahren von 1975 bis 2022 [Graph]. In Statista. von. Available online: https://de.statista.com/statistik/daten/studie/202295/umfrage/entwicklung-des-zinssatzes-fuer-spareinlagen-in-deutschland/ (accessed on 2 February 2023).
- Anzahl der Erwerbstätigen in Deutschland nach dem Inlandskonzept von 1991 bis 2022 (in 1.000) [Graph], Statistisches Bundesamt. Available online: https://de.statista.com/statistik/daten/studie/214465/umfrage/erwerbstaetige-in-deutschland-nach-inlandskonzept/ (accessed on 16 May 2023).
- Höhe des Durchschnittlichen Nettolohns/Nettogehalts im Jahr je Arbeitnehmer in Deutschland von 1991 bis 2022 [Graph], Statistisches Bundesamt. [Online]. Available online: https://de.statista.com/statistik/daten/studie/74510/umfrage/nettogehalt-im-jahr-je-arbeitnehmer-in-deutschland/ (accessed on 2 June 2023).
- Inflationsrate in Deutschland von 1992 bis 2022 (Veränderung des Verbraucherpreisindex Gegenüber Vorjahr) [Graph], Statistisches Bundesamt. [Online]. Available online: https://de.statista.com/statistik/daten/studie/1046/umfrage/inflationsrate-veraenderung-des-verbraucherpreisindexes-zum-vorjahr/ (accessed on 22 February 2023).
- Landesvermessungsamt Sachsen-Anhalt, Germany: © GeoBasis-DE/LVermGeo ST. 2023. Available online: https://www.lvermgeo.sachsen-anhalt.de/de/gdp-open-data.html (accessed on 10 July 2023).
- Ziegler, C. Bevölkerung und Demografie 2021—Magdeburger Statistik (Population and Demographics 2021—Magdeburger Statistics). City of Magdeburg (eds.). 2021. Available online: https://www.magdeburg.de/PDF/Bev%C3%B6lkerung_Demografie_2021_Heft_110.PDF?ObjSvrID=37&ObjID=49447&ObjLa=1&Ext=PDF&WTR=1&_ts=1660024825 (accessed on 5 November 2022).
- Landeshauptstadt-Magdeburg—Amt für Stadtgärten und Friedhöfe. 2022. Available online: https://opendata.unser-magdeburg.de/dataset/baumkataster-magdeburg-2021 (accessed on 10 November 2022).
- Kalusche, D. Ökologie in Zahlen (Ecology in Numbers); Springer: Berlin/Heidelberg, Germany, 2016; ISBN 978-3-662-47986-5. [Google Scholar]
- Fauk, T.; Schneider, P. Modeling urban tree growth as a part of the green infrastructure to estimate ecosystem services in urban planning. Front. Environ. Sci. 2023, 11, 1090652. [Google Scholar] [CrossRef]
- Tucker, C.J.; Sellers, P.J. Satellite remote sensing of primary production. Int. J. Remote Sens. 1986, 7, 1395–1416. [Google Scholar] [CrossRef]
- Schneider, P.; Fauk, T. The Role of Allotment Gardens for Connecting Nature and People. In Human-Nature Interactions—Exploring Nature’s Values Across Landscapes; Misiune, I., Depellegrin, D., Egarter Vigl, L., Eds.; Springer Nature: Berlin/Heidelberg, Germany, 2022; pp. 261–271. [Google Scholar] [CrossRef]
- Bartlett, M.S. The Effect of Standardization on a X2 Approximation in Factor Analysis; Biometrika—Oxford Press: Oxford, UK, 1951; pp. 337–344. [Google Scholar] [CrossRef]
- Backhaus, K.; Erichson, B.; Gensler, S.; Weiber, R.; Weiber, T. Multivariate Analysemethoden (Multivariate Analysis Methods). Münster, Magdeburg, München and Trier (Germany); Springer: Berlin/Heidelberg, Germany, 2021. [Google Scholar] [CrossRef]
- Steiner, M.; Grieder, S.G. EFAtools: An R package with fast and flexible implementations of exploratory factor analysis tools. J. Open Source Softw. 2020, 5, 2521. [Google Scholar] [CrossRef]
- Kassambara, A.; Mundt, F. Package: Factoextract, Version 1.0.7. 2020. Available online: https://cran.r-project.org/web/packages/factoextra/factoextra.pdf (accessed on 10 July 2023).
- Methorst, J.; Rehdanz, K.; Mueller, T.; Hansjürgens, B.; Bonn, A.; Böhning-Gaese, K. The importance of species diversity for human well-being in Europe. Ecol. Econ. 2021, 181, 106917. [Google Scholar] [CrossRef]
- Dosch, F.; Bergmann, E.; Jakubowski, P. Perspektive Flächenkreislaufwirtschaft, Kreislaufwirtschaft in der Städtischen/Stadtregionalen, Flächennutzung—Fläche im Kreis. Ein ExWoSt-Forschungsfeld, Band 1 Theoretische Grundlagen und Planspielkonzeption. 2006. Available online: https://www.bbsr.bund.de/BBSR/DE/veroeffentlichungen/ministerien/bmvbs/sonderveroeffentlichungen/2006/flaechenkreislaufwirtschaft.html (accessed on 28 August 2023).
- Jakubowski, P.; Dosch, F.; Bergmann, E. Zur Theoretischen Konzeption einer Flächenkreislaufwirtschaft. Z. Für Umweltpolit. Und Umweltr. 2007, 30, 325–350. [Google Scholar]
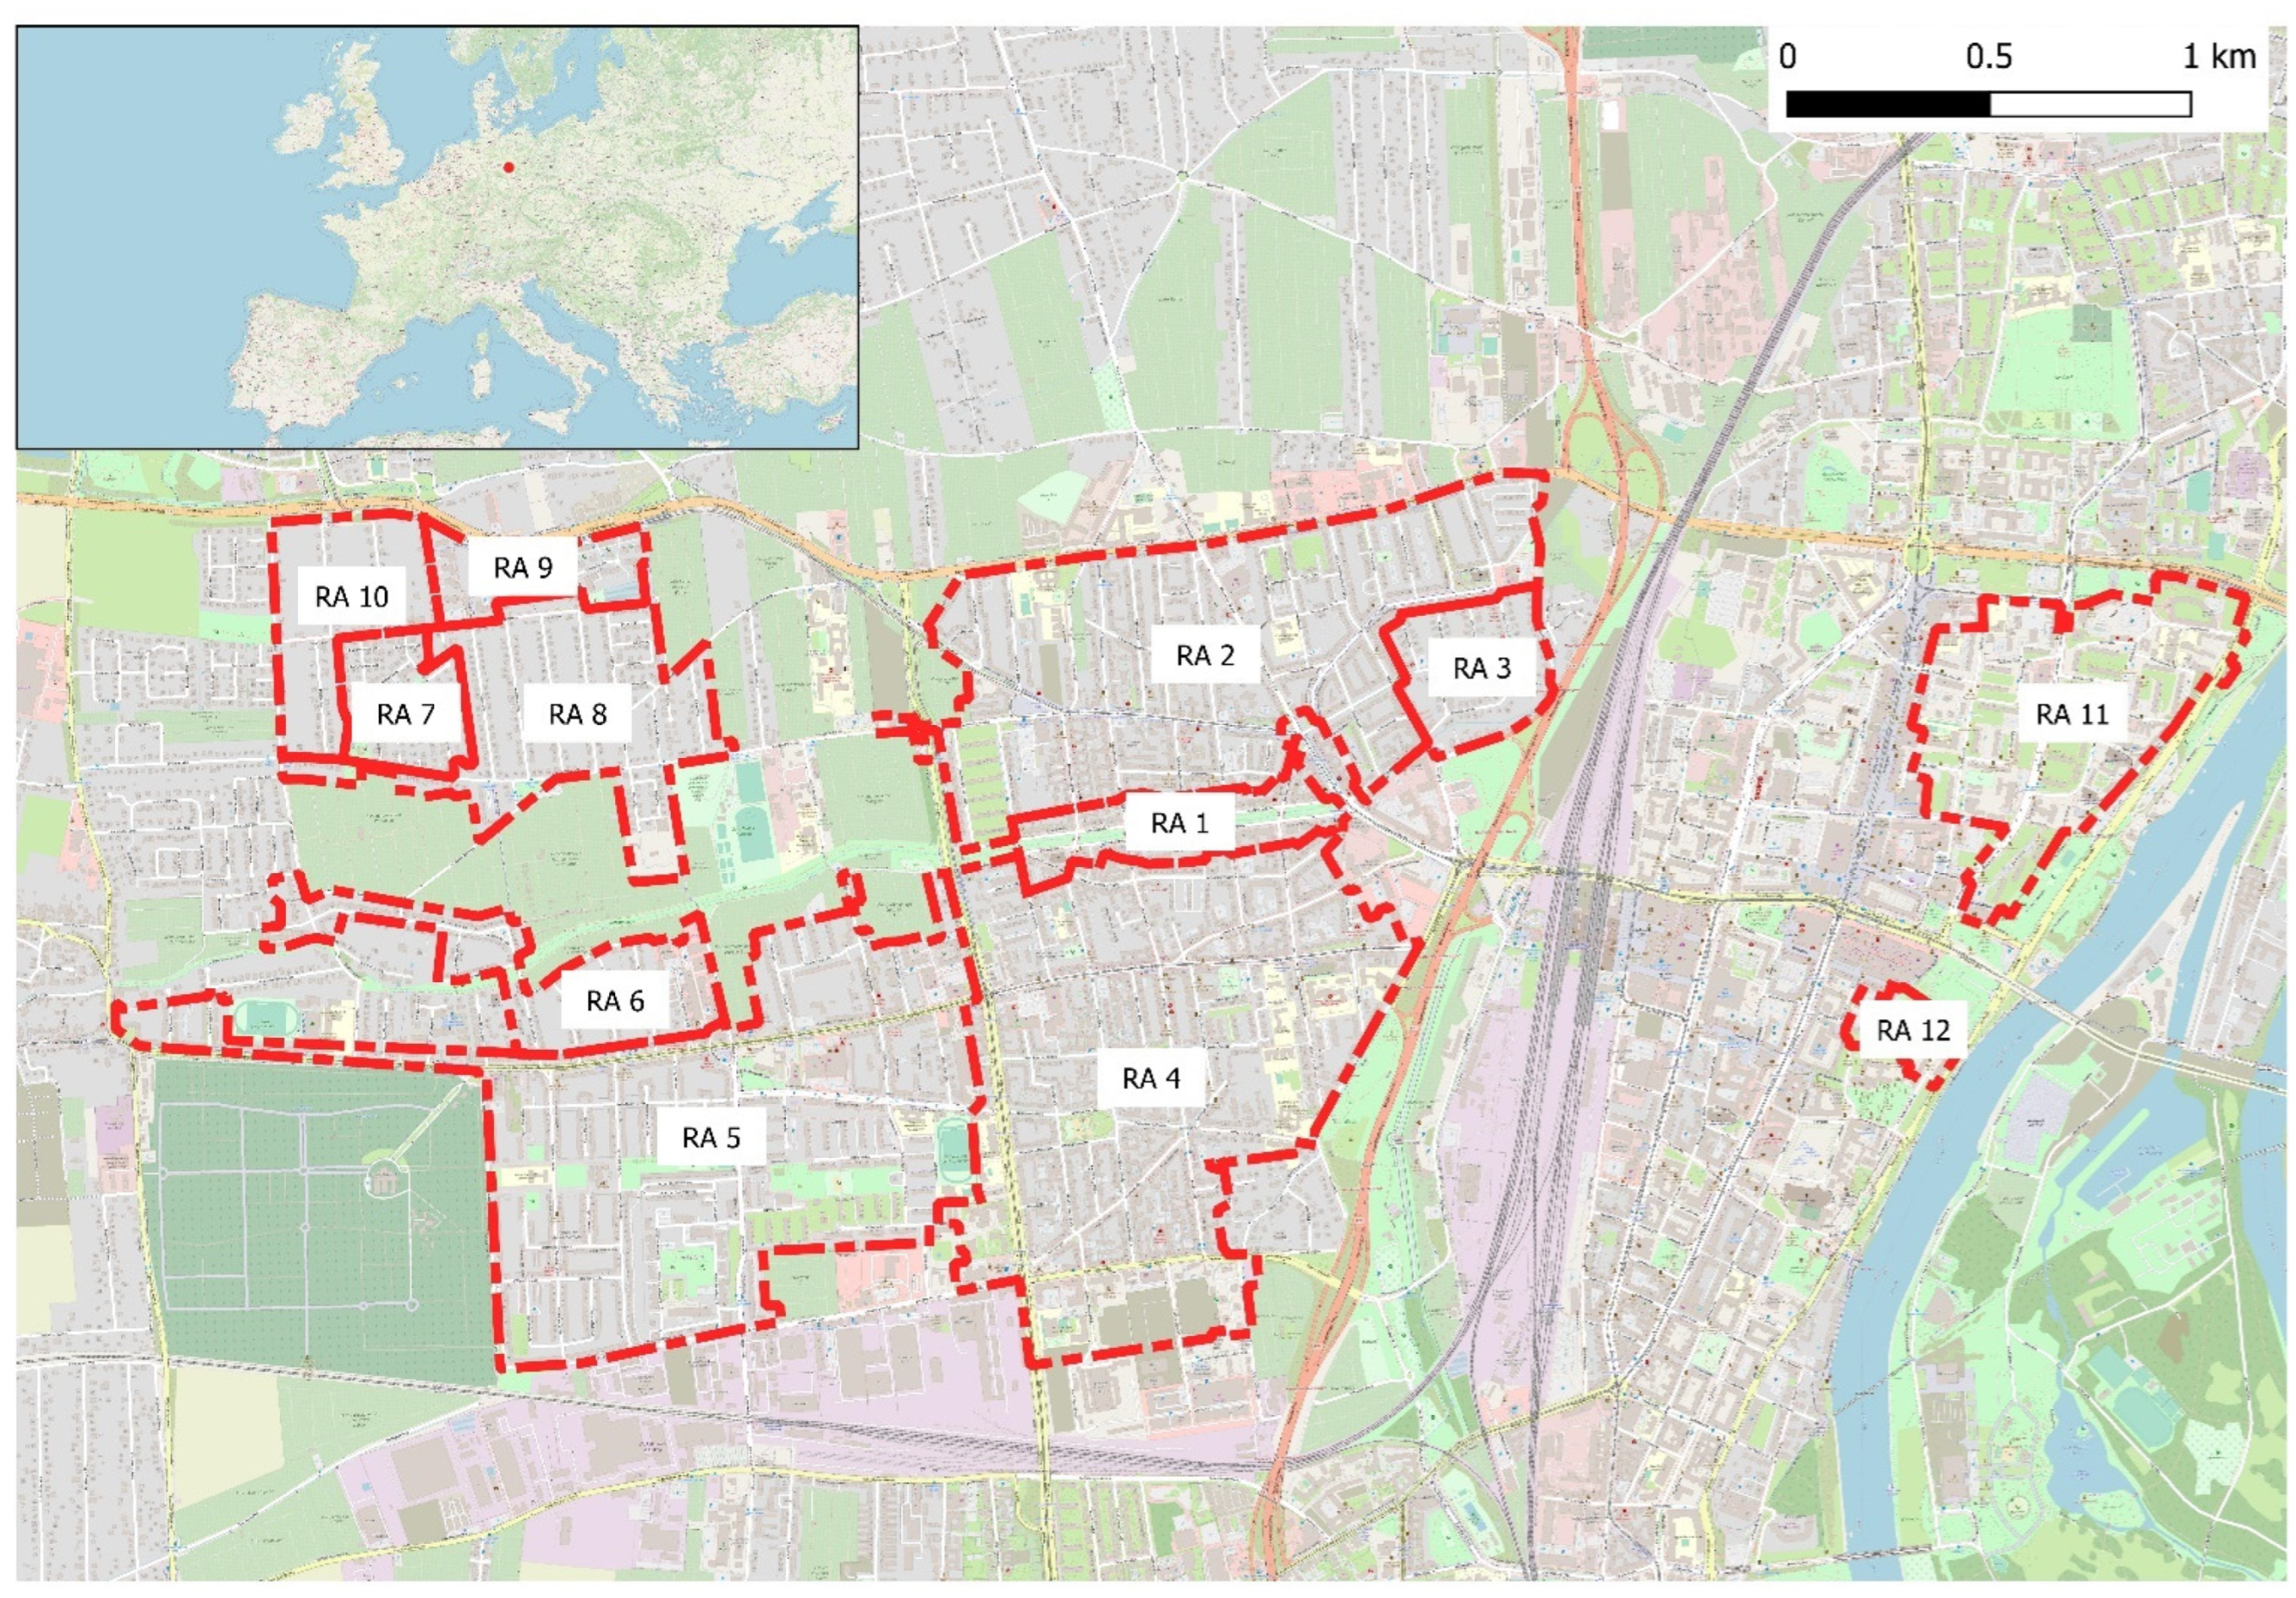


| District | Residential Area j | Total Area in ha ASLVR | Area of Green Spaces in ha AGI |
|---|---|---|---|
| Stadtfeld Ost | RA 1 | 12.5 | 4.0 |
| Stadtfeld Ost | RA 2 | 80.0 | 28.6 |
| Stadtfeld Ost | RA 3 | 12.1 | 6.9 |
| Stadtfeld Ost | RA 4 | 102.2 | 30.0 |
| Stadtfeld West | RA 5 | 98.6 | 47.8 |
| Stadtfeld West | RA 6 | 18.6 | 9.4 |
| Stadtfeld West | RA 7 | 9.7 | 5.5 |
| Stadtfeld West | RA 8 | 32.1 | 19.5 |
| Stadtfeld West | RA 9 | 8.7 | 4.6 |
| Stadtfeld West | RA 10 | 16.1 | 9.8 |
| Altstadt | RA 11 | 38.7 | 15.3 |
| Altstadt | RA 12 | 4.1 | 1.8 |
| Design. | Start | Iter. 1 | Iter. 2 | Iter. 3 | Iter. 4 | Iter. 5 | Iter. 6 | Iter. 7 | Iter. 8 |
|---|---|---|---|---|---|---|---|---|---|
| SLRV | 0.577 | 0.632 | 0.568 | 0.533 | 0.464 | 0.557 | 0.564 | 0.566 | 0.495 |
| INH | 0.518 | 0.546 | 0.382 | 0.362 | 0.463 | 0.639 | 0.633 | 0.670 | 0.675 |
| IMIG | 0.655 | 0.584 | 0.505 | 0.407 | 0.321 | 0.507 | 0.445 | 0.483 | |
| OCR | 0.677 | 0.507 | 0.391 | 0.299 | 0.399 | 0.521 | 0.740 | 0.754 | 0.823 |
| INC | 0.704 | 0.652 | 0.670 | 0.642 | 0.607 | 0.560 | 0.602 | 0.597 | 0.567 |
| ISD | 0.659 | 0.545 | 0.626 | 0.600 | 0.679 | 0.757 | 0.746 | 0.742 | 0.733 |
| IR | 0.658 | 0.570 | 0.541 | 0.478 | 0.566 | 0.707 | 0.673 | 0.663 | 0.650 |
| Es | 0.216 | 0.368 | 0.298 | 0.565 | 0.330 | 0.301 | |||
| LAI | 0.242 | 0.406 | 0.298 | 0.238 | 0.284 | ||||
| Ntree | 0.237 | 0.327 | 0.455 | 0.320 | 0.532 | 0.427 | 0.491 | 0.629 | 0.663 |
| GS | 0.578 | 0.461 | 0.440 | 0.774 | 0.595 | 0.608 | 0.580 | 0.791 | 0.733 |
| BDI | 0.199 | 0.145 | |||||||
| AlG | 0.323 | 0.528 | 0.451 | 0.356 | 0.489 | 0.680 | 0.648 | 0.584 | 0.617 |
| min_gi | 0.160 | ||||||||
| Water | 0.209 | 0.339 | 0.324 | 0.241 | 0.403 | 0.433 | 0.382 | ||
| school | 0.265 | 0.274 | 0.291 | 0.261 | 0.583 | 0.568 | 0.538 | 0.563 | 0.561 |
| min_med | 0.471 | 0.328 | 0.329 | 0.292 | 0.458 | 0.653 | 0.642 | 0.575 | 0.711 |
| tra | 0.267 | 0.241 | 0.241 | 0.203 | |||||
| ret | 0.365 | 0.211 | 0.163 | ||||||
| rest_pkt | 0.367 | 0.344 | 0.407 | 0.326 | 0.417 | 0.531 | 0.654 | 0.748 | 0.803 |
| KMO | 0.374 | 0.407 | 0.395 | 0.368 | 0.466 | 0.562 | 0.595 | 0.641 | 0.661 |
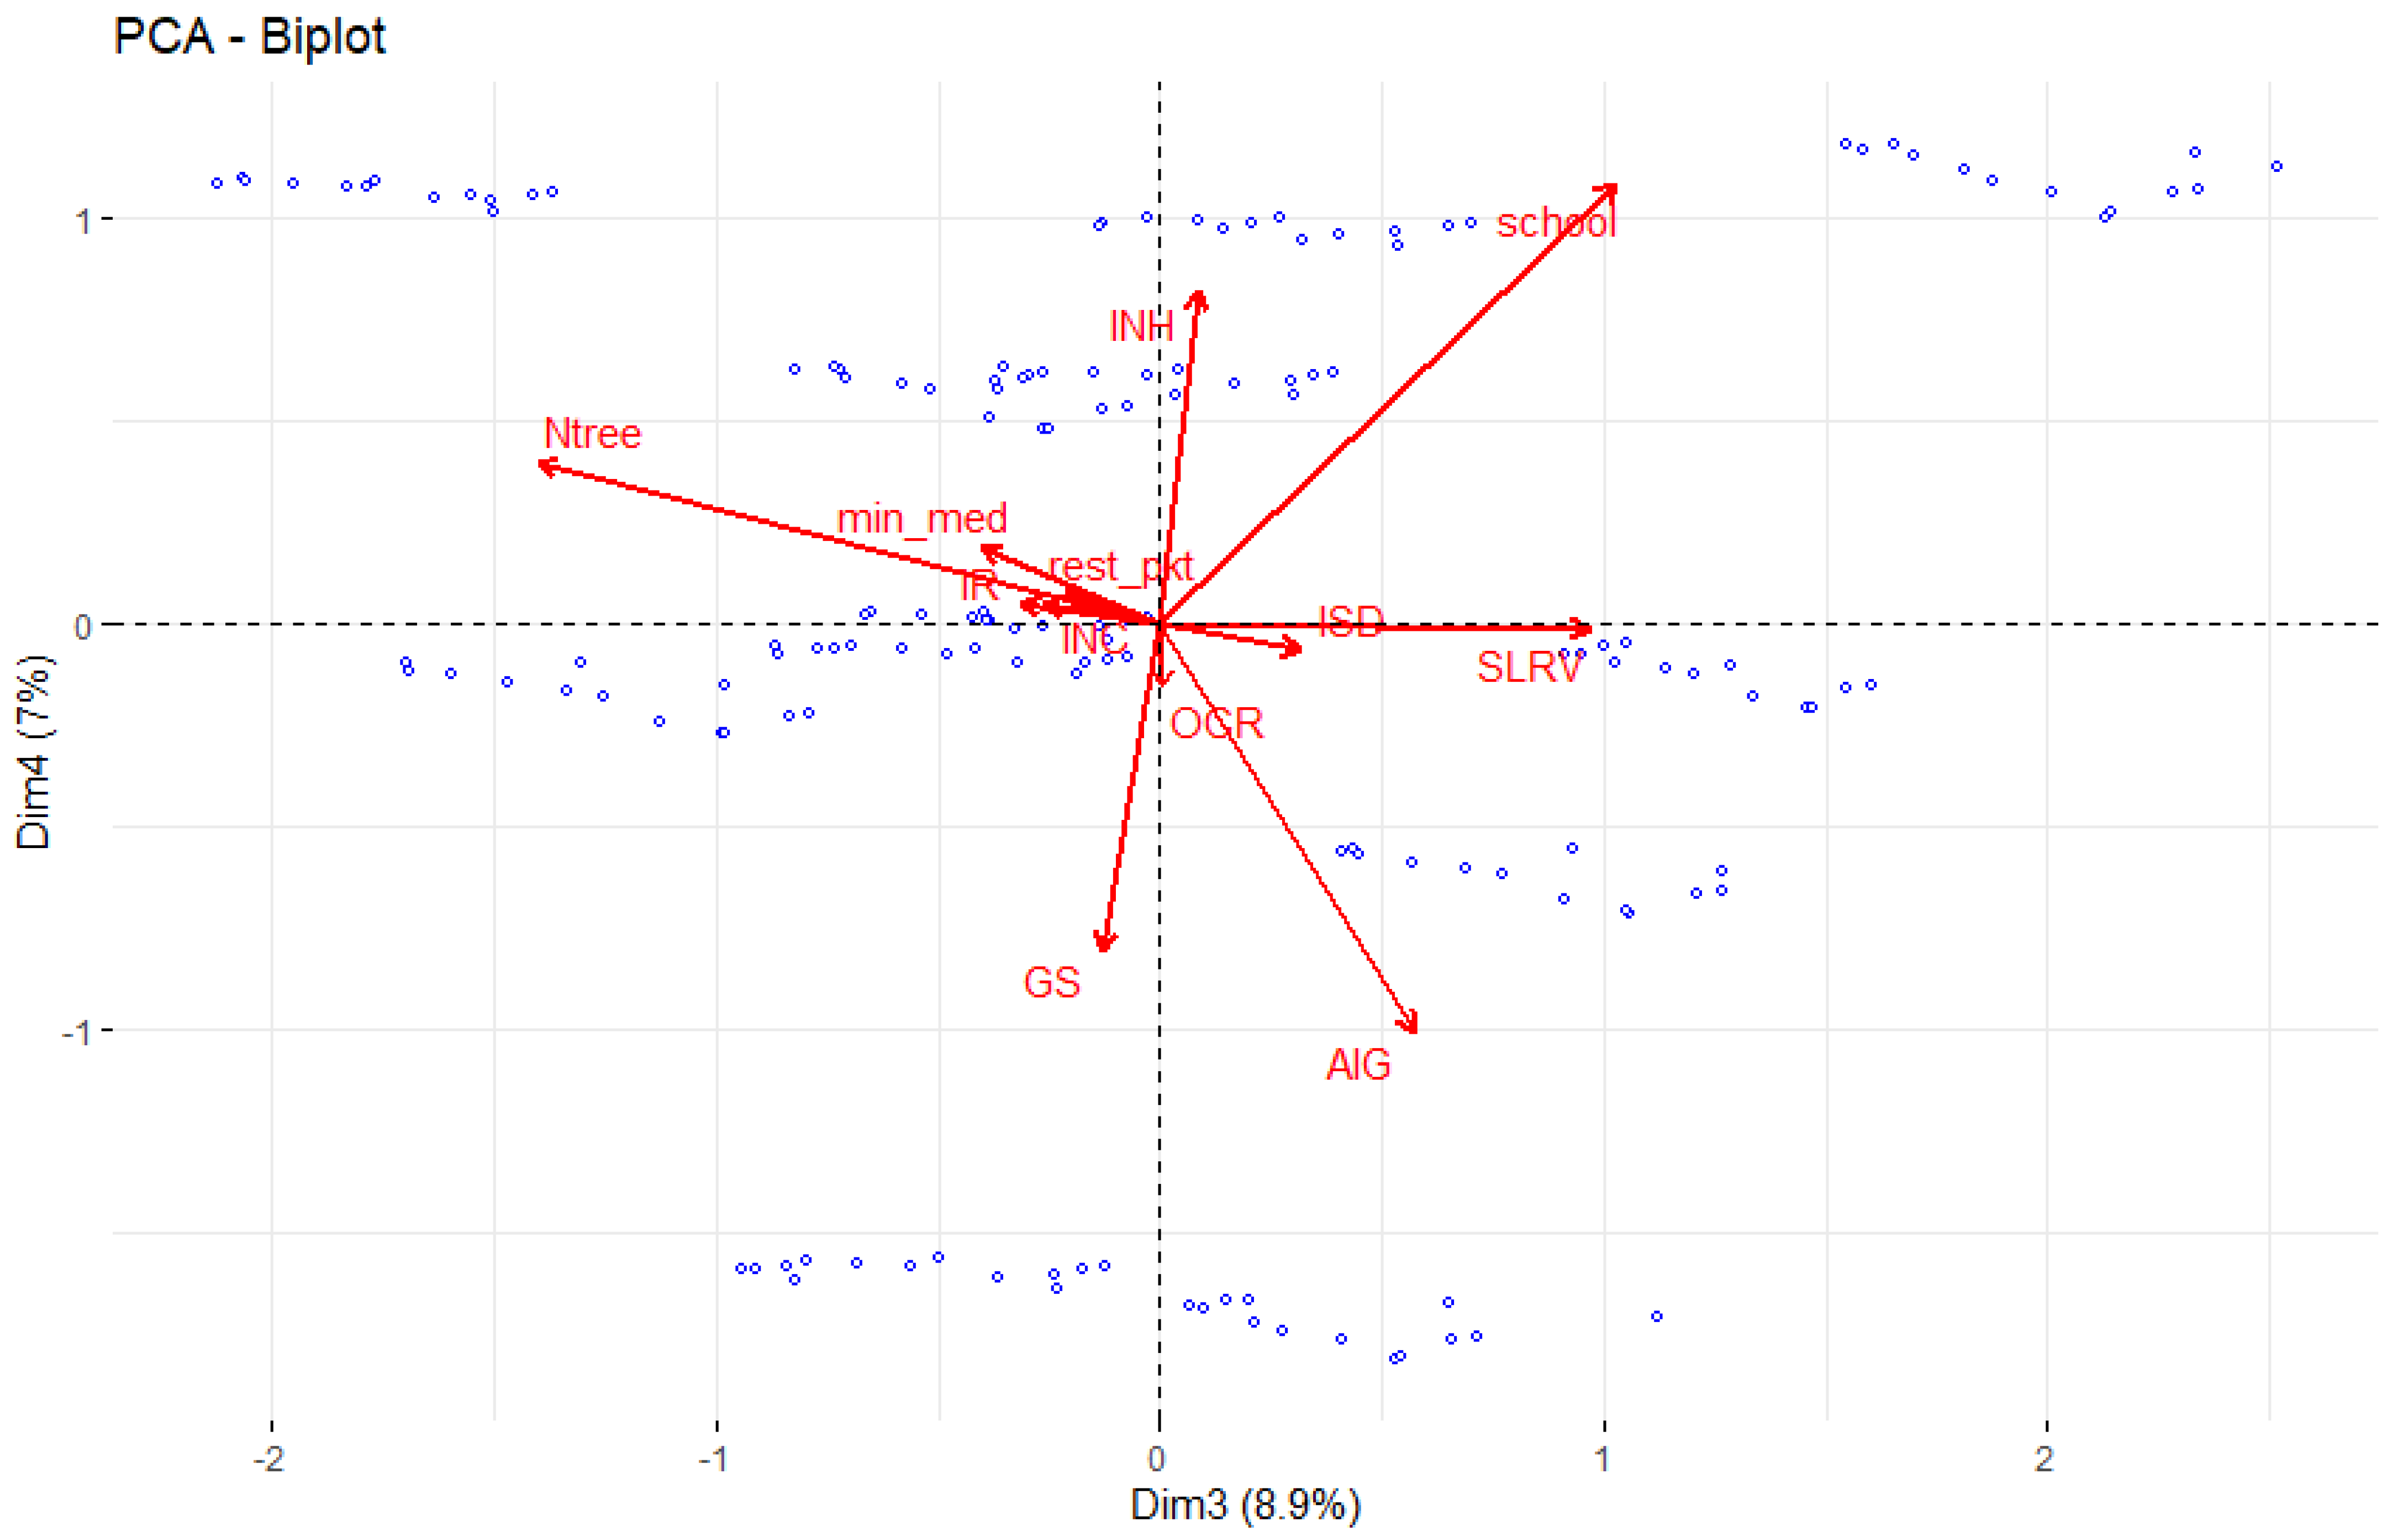
| Dimension | Dim.1 | Dim.2 | Dim.3 | h2 | |
|---|---|---|---|---|---|
| Indicator | |||||
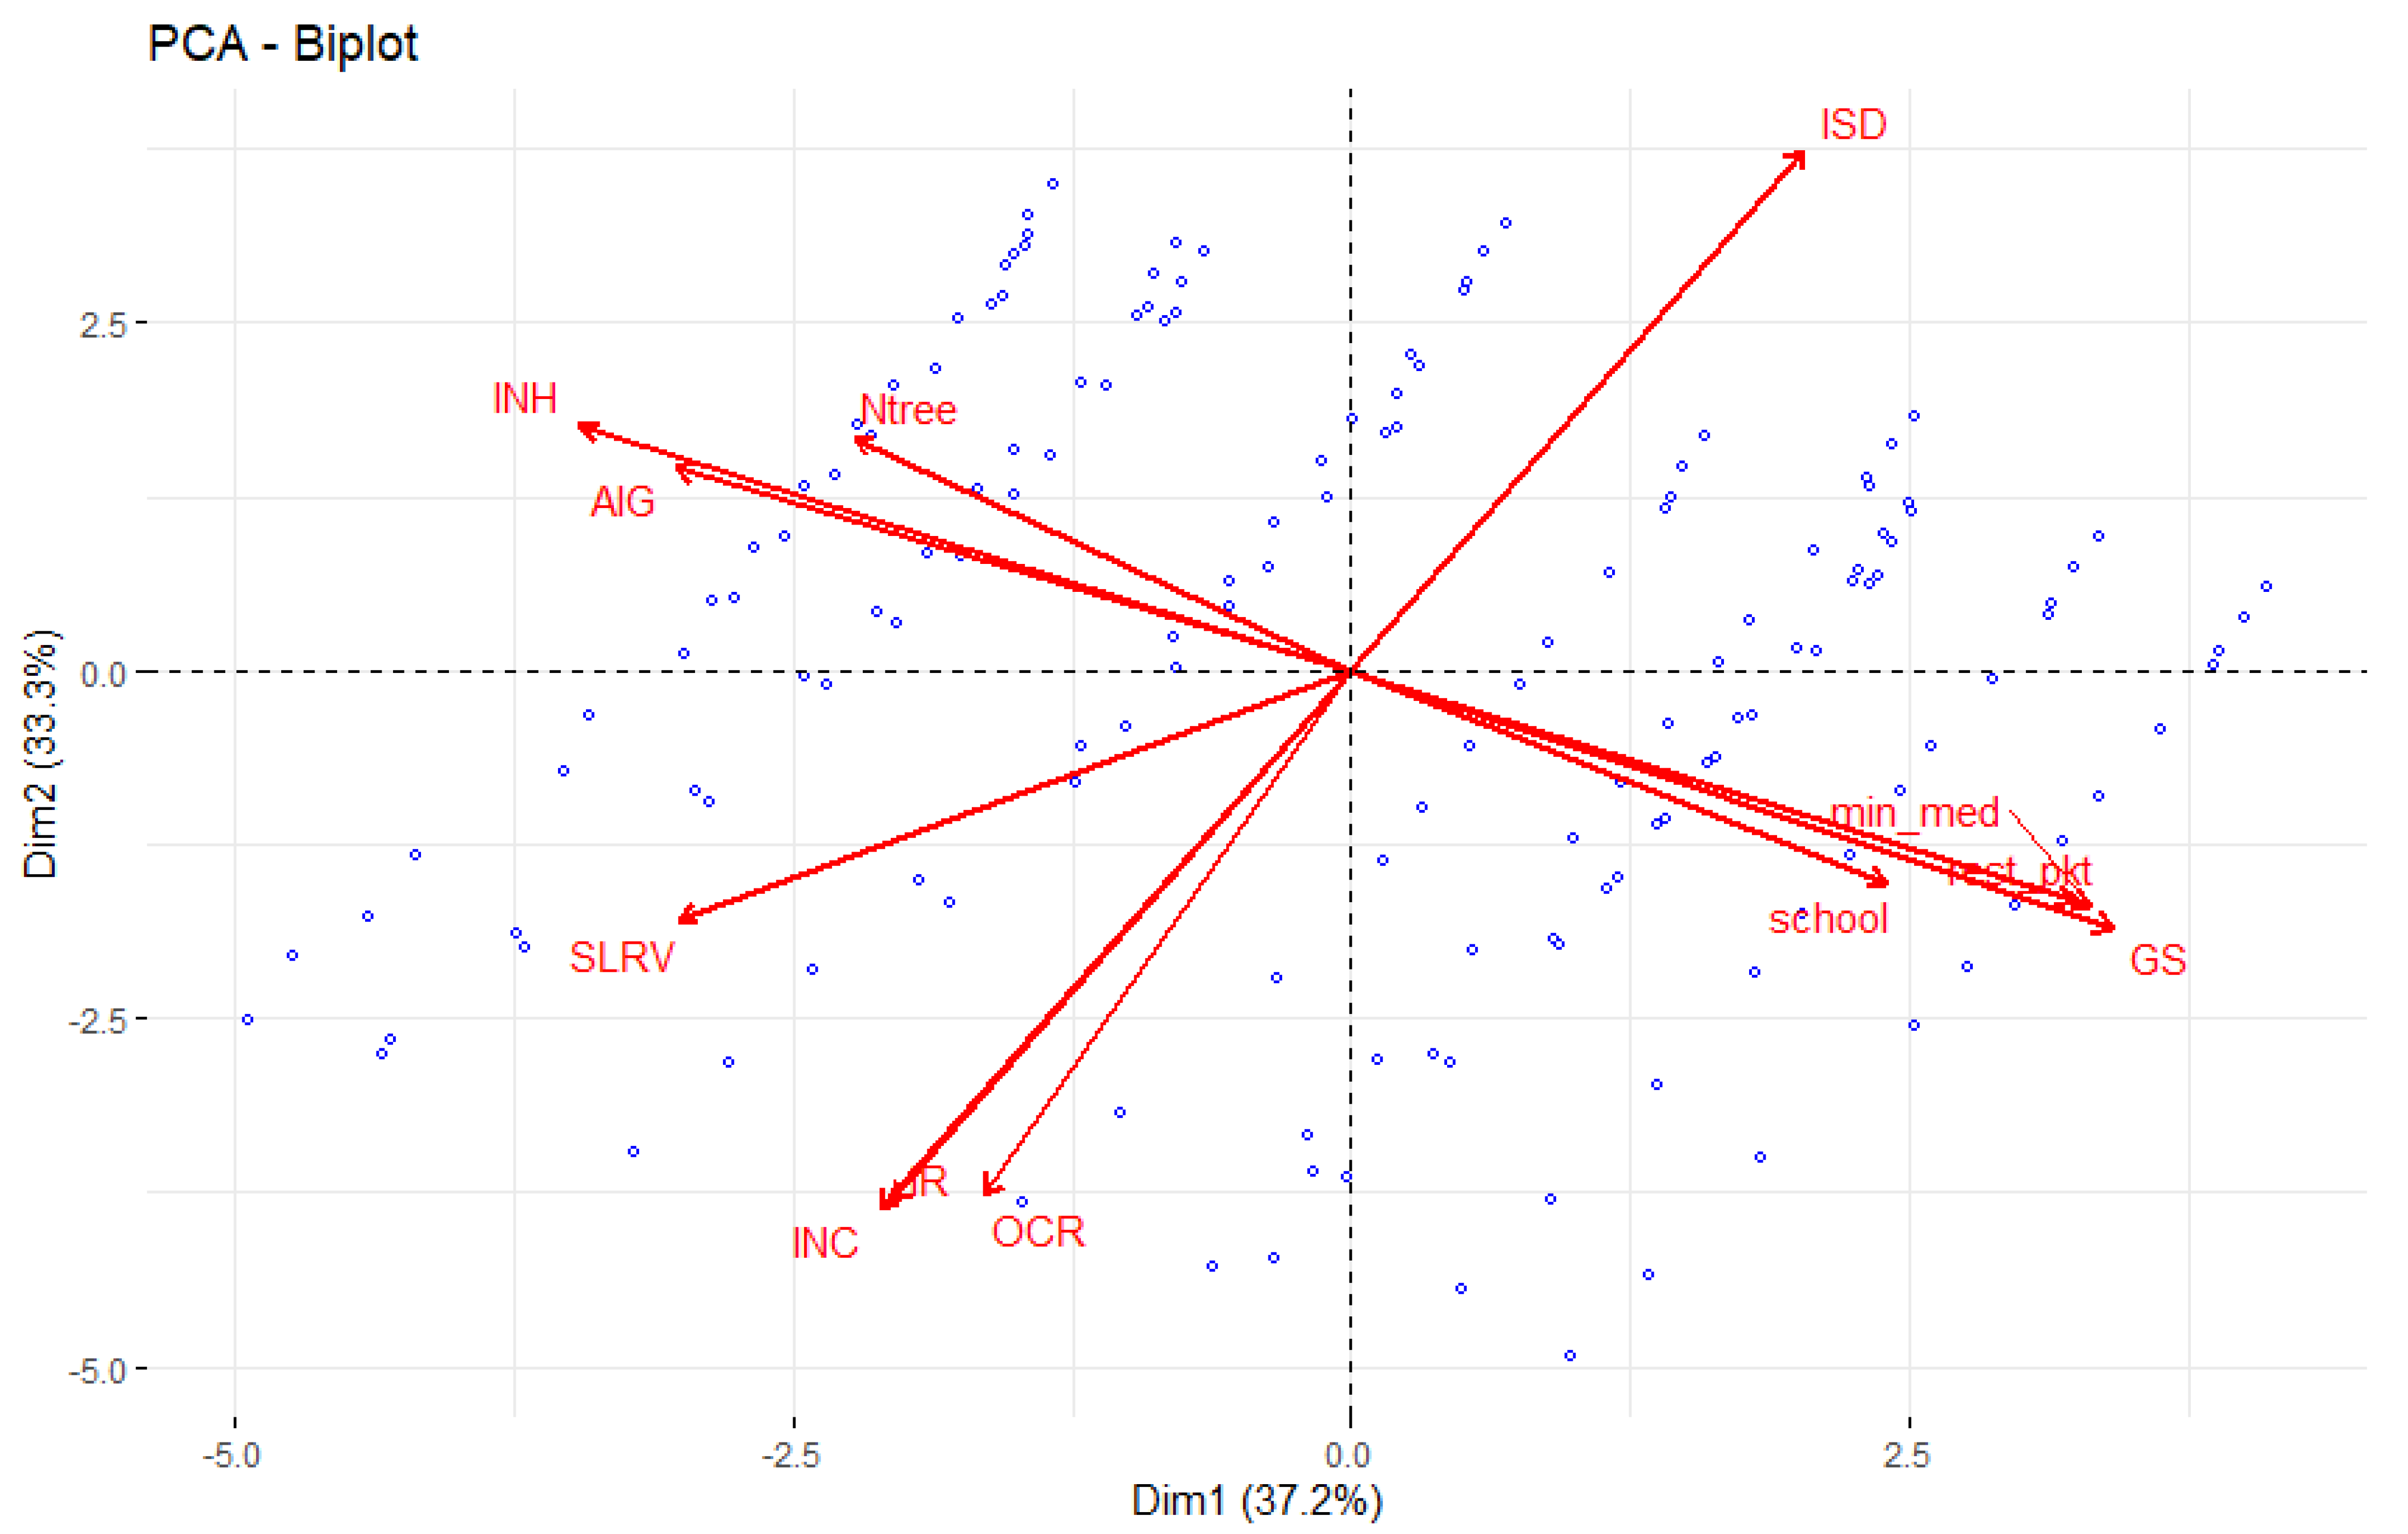
| SLRV | −0.6730 | −0.3993 | 0.4578 | 0.8220 | |
| INH | −0.7719 | 0.3924 | 0.0403 | 0.7515 | |
| OCR | −0.3679 | −0.8388 | 0.0022 | 0.8390 | |
| INC | −0.4715 | −0.8631 | −0.1230 | 0.9824 | |
| ISD | 0.4523 | 0.8346 | 0.1495 | 0.9235 | |
| IR | −0.4588 | −0.8500 | −0.1482 | 0.9550 | |
| Ntree | −0.4972 | 0.3709 | −0.6629 | 0.8242 | |
| GS | 0.7615 | −0.4143 | −0.0620 | 0.7554 | |
| AlG | −0.6744 | 0.3258 | 0.2712 | 0.6345 | |
| school | 0.5361 | −0.3397 | 0.4851 | 0.6380 | |
| min_med | 0.7405 | −0.3764 | −0.1894 | 0.7258 | |
| rest_pkt | 0.7248 | −0.3704 | −0.1007 | 0.6727 | |
| EV | 4.46 | 3.99 | 1.07 | ||
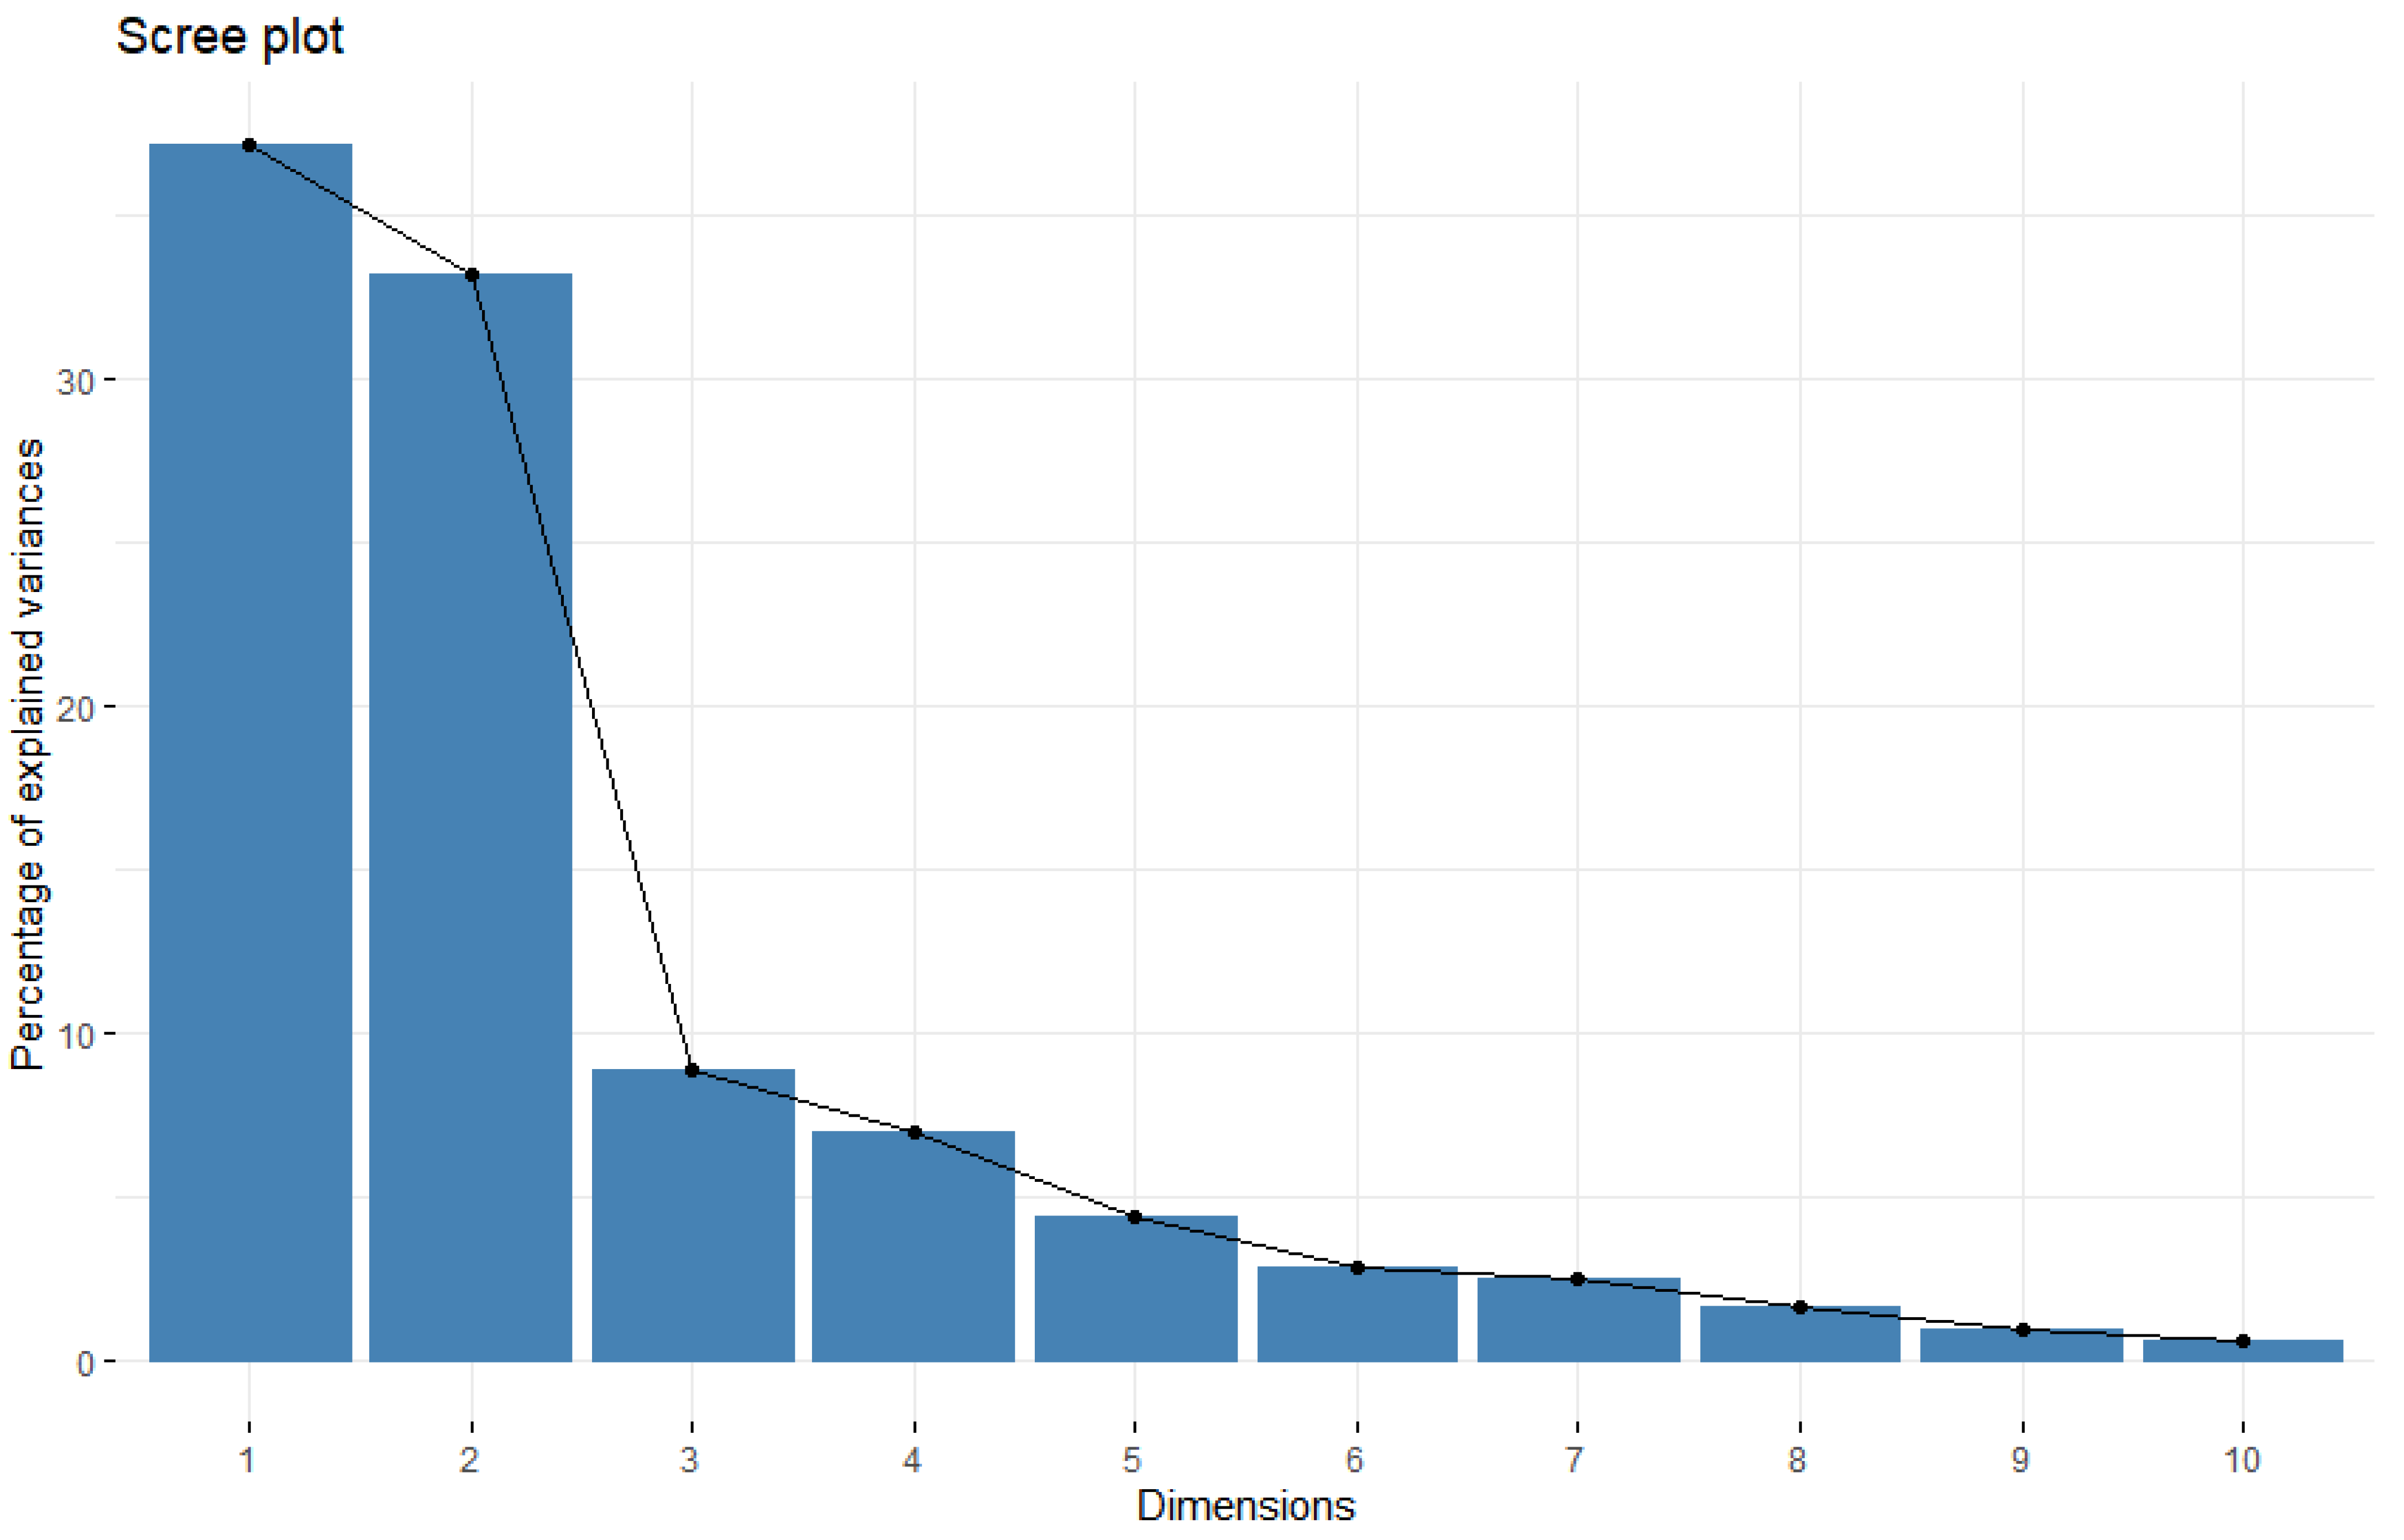
| Var | 37.20% | 33.26% | 8.91% | ||
| cum Var | 37.20% | 70.46% | 79.37% | ||
| Dimension | Dim.1 | Dim.2 | Dim.3 | Dim.4 | Dim.5 | Dim.6 | Dim.7 | Dim.8 | Dim.9 | Dim.10 | Dim.11 | Dim.12 | h2 | |
|---|---|---|---|---|---|---|---|---|---|---|---|---|---|---|
| Indicator | ||||||||||||||
| SLRV | −0.6730 | −0.3993 | 0.4578 | −0.0058 | −0.2939 | 0.0080 | 0.0352 | −0.2983 | 0.0246 | 0.0036 | −0.0211 | 0.0157 | 1.0000 | |
| INH | −0.7719 | 0.3924 | 0.0403 | 0.3873 | 0.1722 | −0.1718 | −0.0620 | −0.0528 | −0.0481 | 0.1069 | 0.1378 | −0.0059 | 1.0000 | |
| OCR | −0.3679 | −0.8388 | 0.0022 | −0.0732 | 0.2674 | −0.0219 | −0.1471 | −0.0268 | −0.2309 | 0.0186 | −0.0875 | 0.0007 | 1.0000 | |
| INC | −0.4715 | −0.8631 | −0.1230 | 0.0240 | −0.0489 | 0.0097 | 0.0439 | −0.0024 | 0.0570 | −0.0546 | 0.0299 | −0.0742 | 1.0000 | |
| ISD | 0.4523 | 0.8346 | 0.1495 | −0.0305 | 0.0161 | −0.0024 | −0.0448 | −0.1286 | −0.1457 | −0.1801 | 0.0520 | −0.0198 | 1.0000 | |
| IR | −0.4588 | −0.8500 | −0.1482 | 0.0245 | −0.0079 | 0.0064 | 0.0303 | 0.0911 | −0.0039 | −0.1435 | 0.1113 | 0.0455 | 1.0000 | |
| Es | −0.4972 | 0.3709 | −0.6629 | 0.1879 | −0.2411 | 0.1831 | 0.1748 | −0.0631 | −0.1144 | 0.0191 | −0.0278 | 0.0030 | 1.0000 | |
| LAI | 0.7615 | −0.4143 | −0.0620 | −0.3806 | −0.0274 | 0.2441 | −0.0327 | −0.0894 | −0.0535 | 0.1070 | 0.1266 | −0.0026 | 1.0000 | |
| Ntree | −0.6744 | 0.3258 | 0.2712 | −0.4759 | −0.0041 | −0.0989 | 0.3238 | 0.1273 | −0.0842 | 0.0253 | 0.0186 | −0.0055 | 1.0000 | |
| GI | 0.5361 | −0.3397 | 0.4851 | 0.5132 | −0.0539 | 0.2036 | 0.1782 | 0.1240 | −0.0828 | 0.0154 | 0.0016 | −0.0043 | 1.0000 | |
| AlG | 0.7405 | −0.3764 | −0.1894 | 0.0901 | 0.3126 | −0.1763 | 0.3209 | −0.1821 | 0.0318 | −0.0054 | −0.0086 | 0.0064 | 1.0000 | |
| school | 0.7248 | −0.3704 | −0.1007 | 0.0345 | −0.4206 | −0.3681 | −0.0364 | 0.0530 | −0.0917 | 0.0311 | 0.0130 | −0.0022 | 1.0000 | |
| EV | 4.46 | 3.99 | 1.07 | 0.84 | 0.53 | 0.34 | 0.30 | 0.20 | 0.12 | 0.08 | 0.06 | 0.01 | ||
| Var | 37.20% | 33.26% | 8.91% | 6.97% | 4.39% | 2.84% | 2.53% | 1.64% | 1.00% | 0.68% | 0.50% | 0.07% | ||
| cum Var | 37.20% | 70.46% | 79.37% | 86.34% | 90.73% | 93.57% | 96.11% | 97.75% | 98.75% | 99.43% | 99.93% | 100.00% | ||
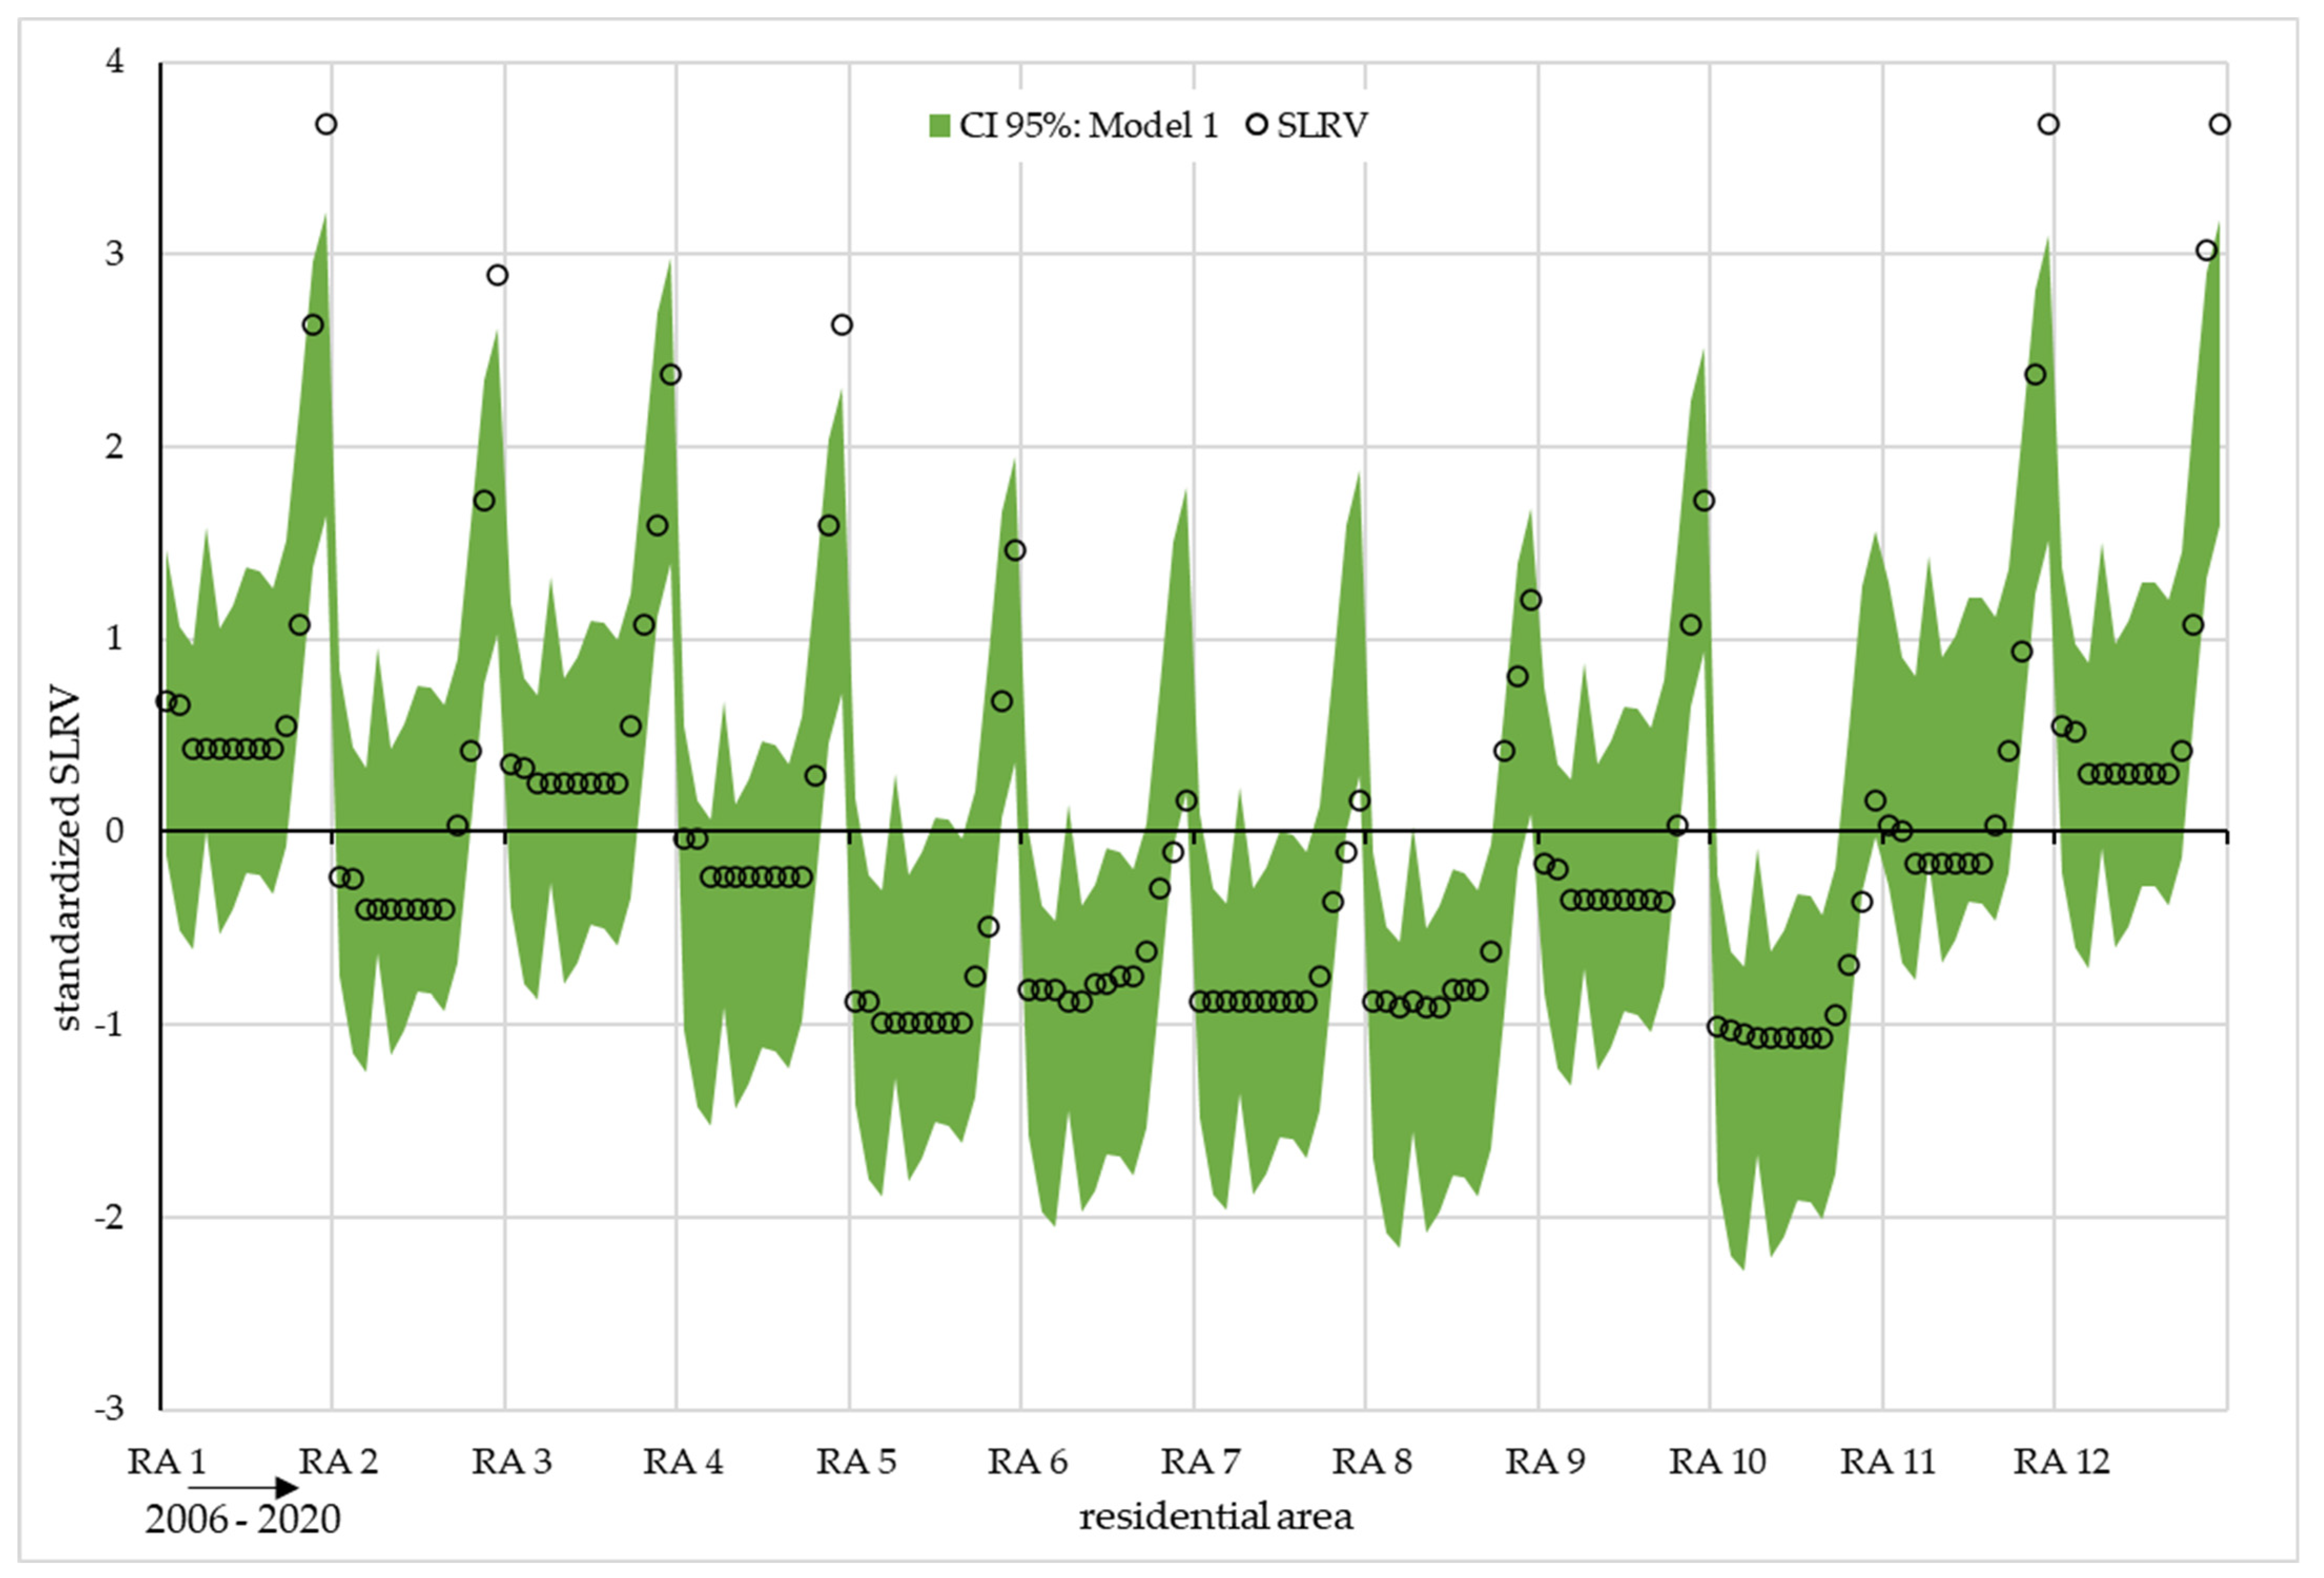
| Variable | Coefficienten | Standard Error | t-Statistic | p-Value | Lower 95% | Upper 95% |
|---|---|---|---|---|---|---|
| INH | 0.2077 | 0.0506 | 4.1019 | 0.0001 | 0.1077 | 0.3078 |
| INC | 2.5286 | 0.1950 | 12.9670 | 0.0000 | 2.1432 | 2.9139 |
| ISD | 0.6203 | 0.1054 | 5.8850 | 0.0000 | 0.4120 | 0.8286 |
| IR | −1.3472 | 0.1566 | −8.6040 | 0.0000 | −1.6566 | −1.0377 |
| Ntree | −0.1871 | 0.0430 | −4.3529 | 0.0000 | −0.2721 | −0.1022 |
| AlG | 0.3255 | 0.0485 | 6.7130 | 0.0000 | 0.2297 | 0.4213 |
| min_med | −0.3928 | 0.0482 | −8.1507 | 0.0000 | −0.4881 | −0.2976 |
| rest_pkt | 0.1095 | 0.0511 | 2.1439 | 0.0337 | 0.0086 | 0.2104 |
| school | 0.2610 | 0.0442 | 5.9002 | 0.0000 | 0.1736 | 0.3484 |
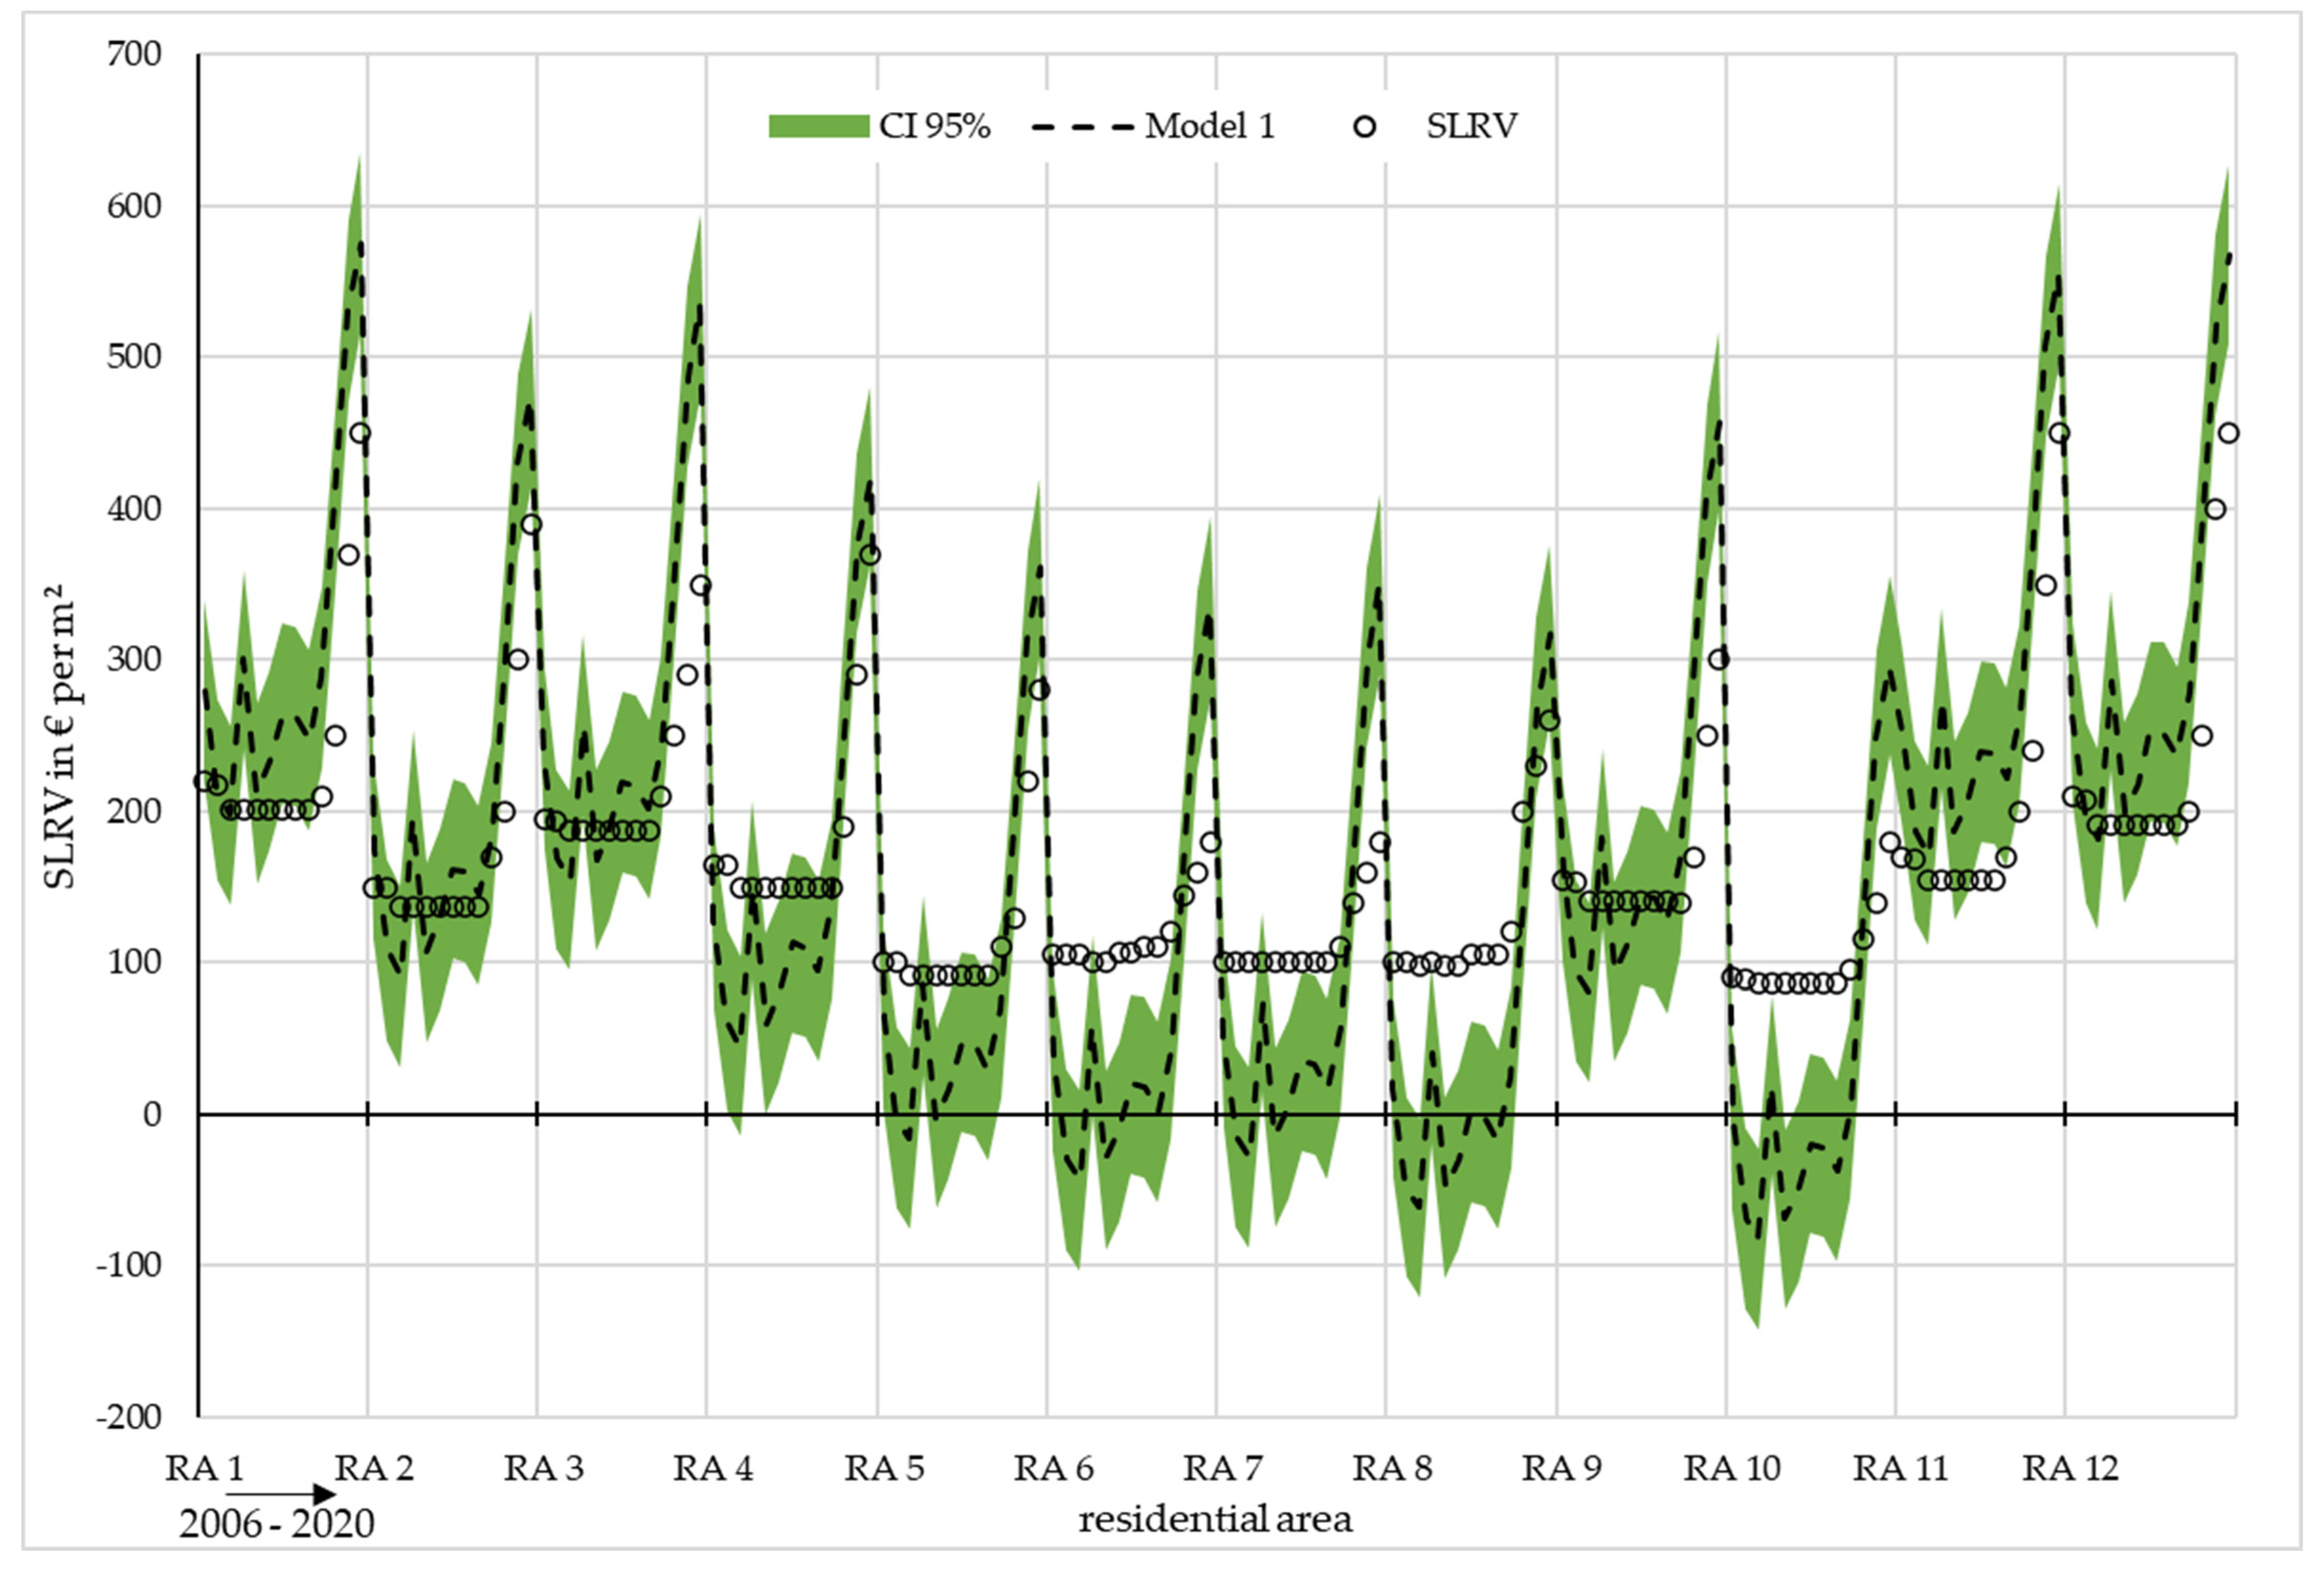
| Variable | Coefficienten | Standard Error | t-Statistic | p-Value | Lower 95% | Upper 95% |
|---|---|---|---|---|---|---|
| b | 90.9930 | 3.5926 | 25.3282 | 0.0000 | 83.8960 | 98.0901 |
| m | 0.4575 | 0.0158 | 28.9734 | 0.0000 | 0.4263 | 0.4887 |
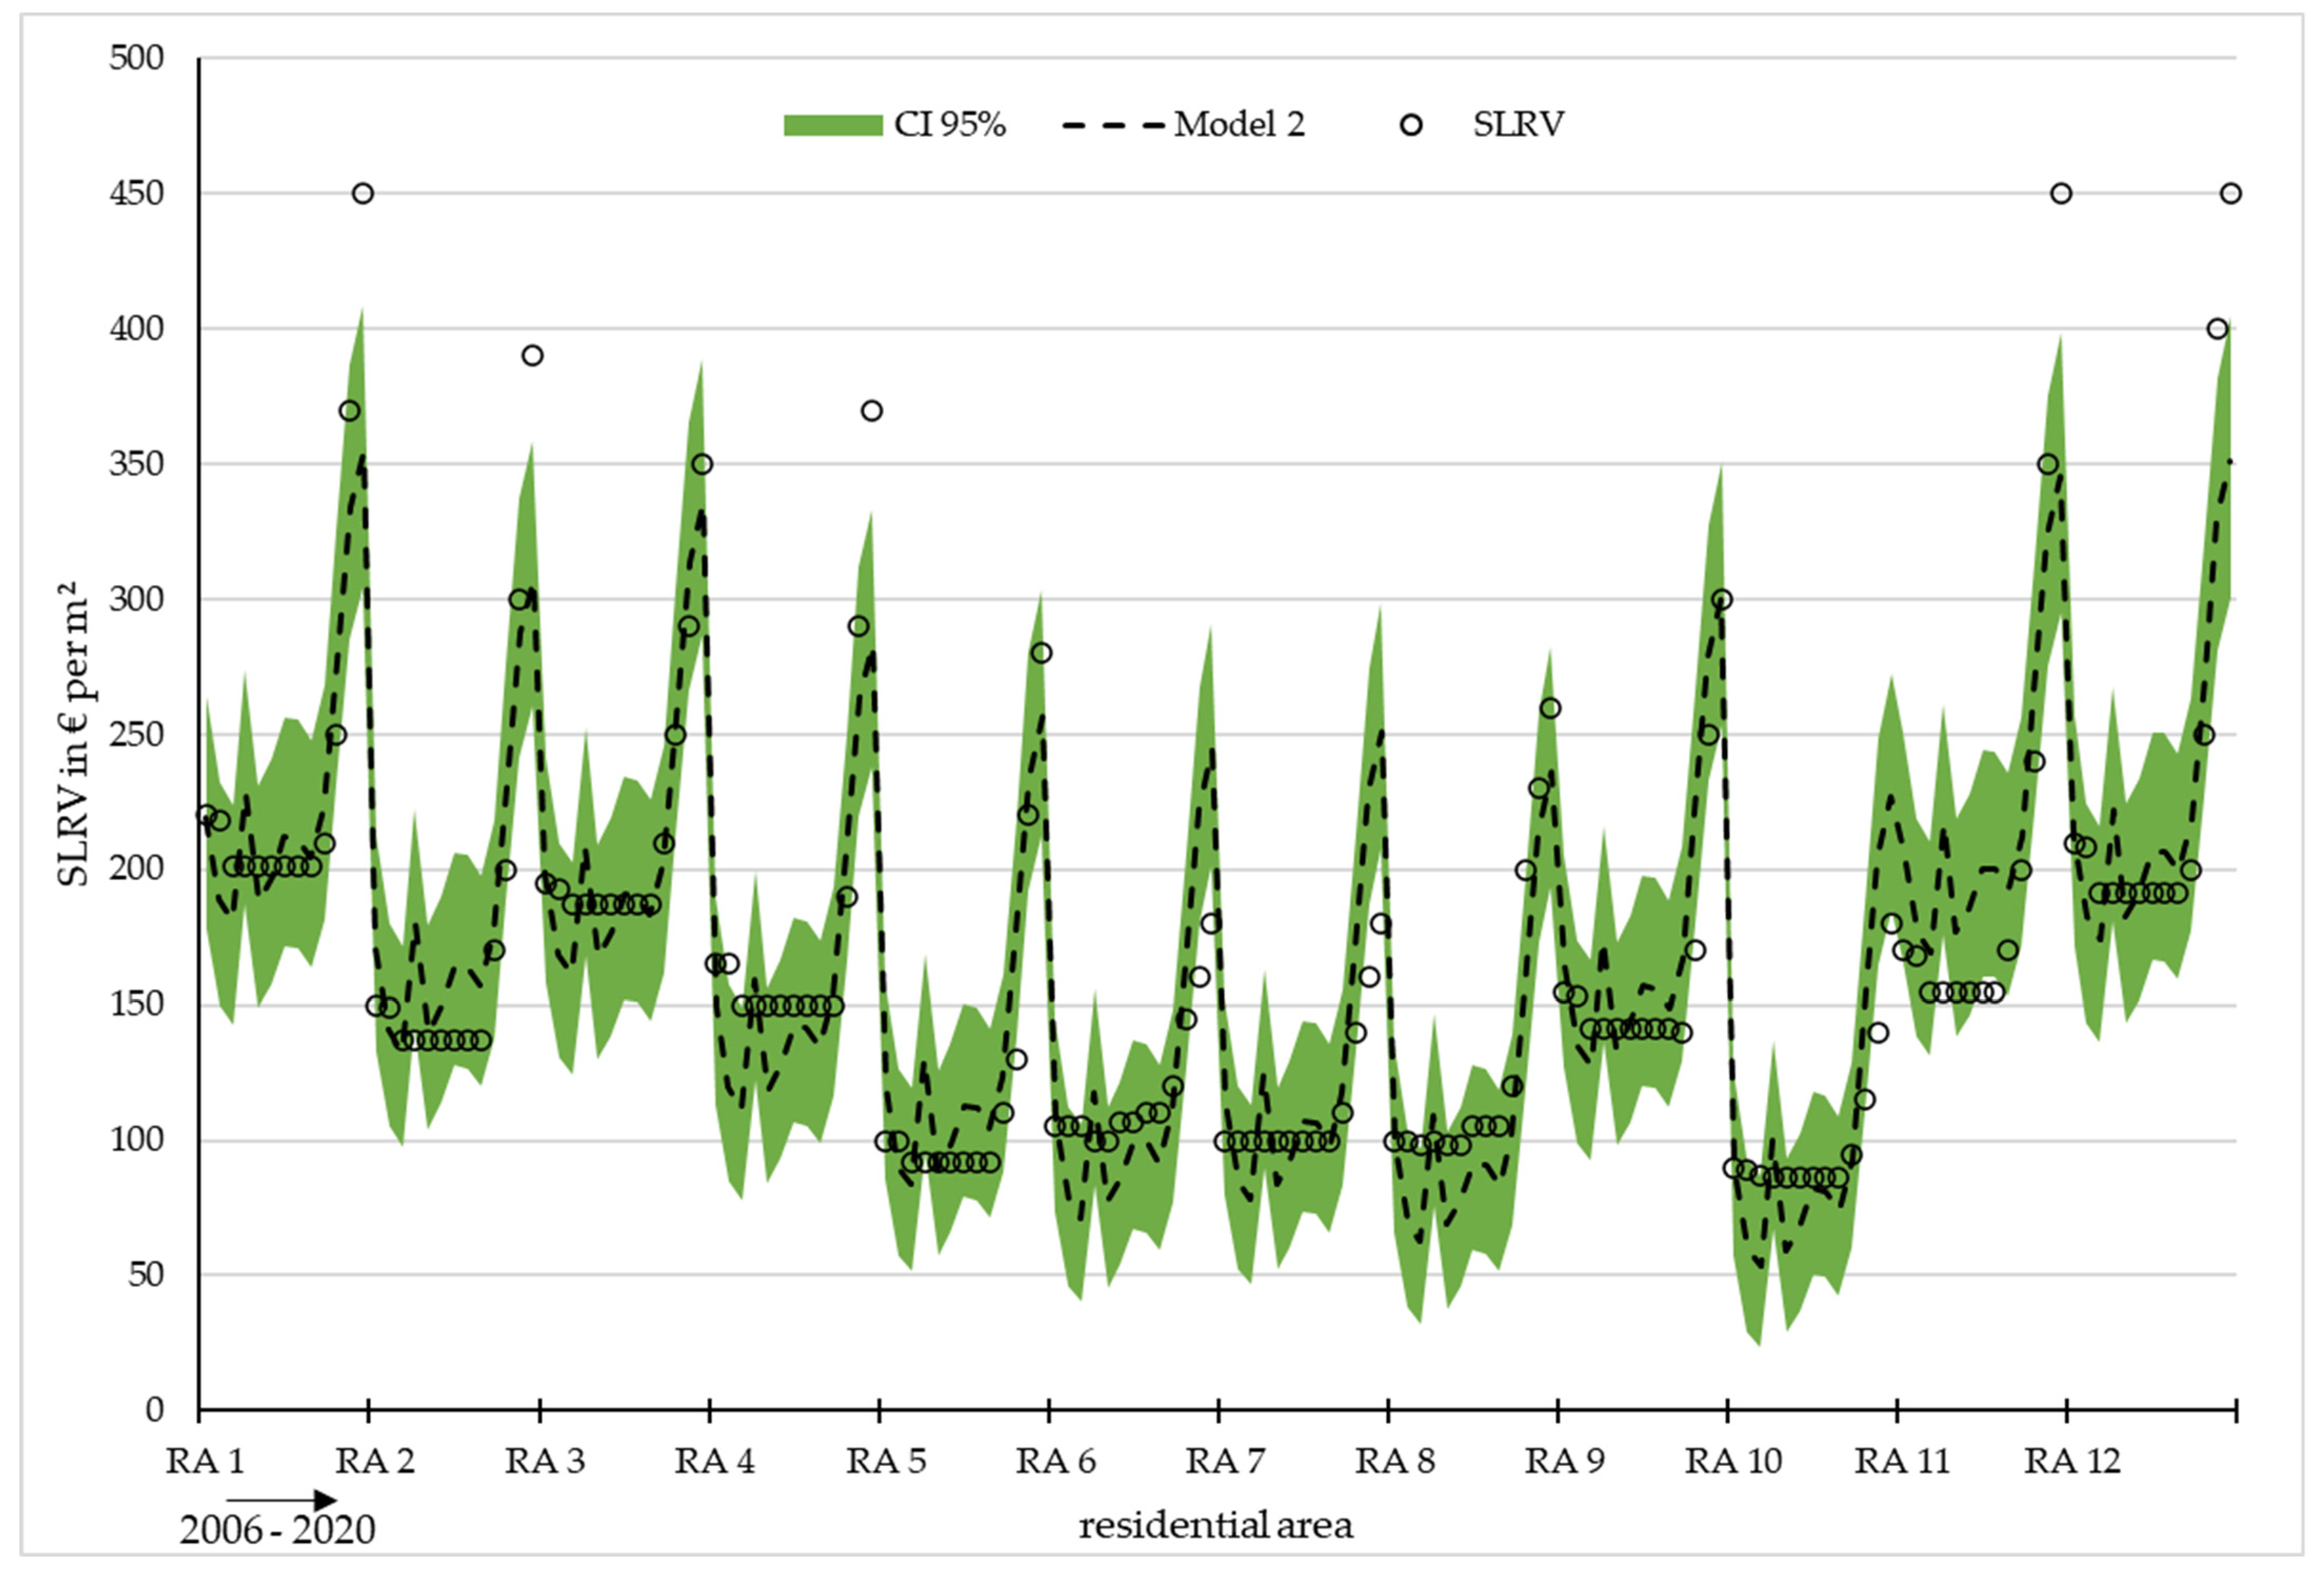
| Variable | Coefficienten | Standard Error | t-Statistic | p-Value | Lower 95% | Upper 95% |
|---|---|---|---|---|---|---|
| b | 103.7918 | 3.1455 | 32.9971 | 0.0000 | 97.5776 | 110.0060 |
| m | 0.1844 | 0.0311 | 5.9293 | 0.0000 | 0.1230 | 0.2459 |
| n | 0.0006 | 0.0001 | 9.5908 | 0.0000 | 0.0005 | 0.0008 |
| SLRV (Model 3) EUR per m2 | INH Items per ha | School m | INC EUR per a | ISD % per a | IR % | Ntree Items | AlG m | min_med m | rest_pkt m | |
|---|---|---|---|---|---|---|---|---|---|---|
| Mean | 152.67 | 77 | 504 | 866,933,142,769 | 1.3 | 10.6 | 231 | 421 | 212 | 237 |
| Z | 0 | 0 | 0 | 0 | 0 | 0 | 0 | 0 | 0 | 0 |
Disclaimer/Publisher’s Note: The statements, opinions and data contained in all publications are solely those of the individual author(s) and contributor(s) and not of MDPI and/or the editor(s). MDPI and/or the editor(s) disclaim responsibility for any injury to people or property resulting from any ideas, methods, instructions or products referred to in the content. |
© 2023 by the authors. Licensee MDPI, Basel, Switzerland. This article is an open access article distributed under the terms and conditions of the Creative Commons Attribution (CC BY) license (https://creativecommons.org/licenses/by/4.0/).
Share and Cite
Fauk, T.; Schneider, P. Does Urban Green Infrastructure Increase the Property Value? The Example of Magdeburg, Germany. Land 2023, 12, 1725. https://doi.org/10.3390/land12091725
Fauk T, Schneider P. Does Urban Green Infrastructure Increase the Property Value? The Example of Magdeburg, Germany. Land. 2023; 12(9):1725. https://doi.org/10.3390/land12091725
Chicago/Turabian StyleFauk, Tino, and Petra Schneider. 2023. "Does Urban Green Infrastructure Increase the Property Value? The Example of Magdeburg, Germany" Land 12, no. 9: 1725. https://doi.org/10.3390/land12091725
APA StyleFauk, T., & Schneider, P. (2023). Does Urban Green Infrastructure Increase the Property Value? The Example of Magdeburg, Germany. Land, 12(9), 1725. https://doi.org/10.3390/land12091725


