


Spatio-Temporal Evolution of Key Areas of Territorial Ecological Restoration in Resource-Exhausted Cities: A Case Study of Jiawang District, China


Abstract
:1. Introduction
2. Overview and Data Sources of the Study Area
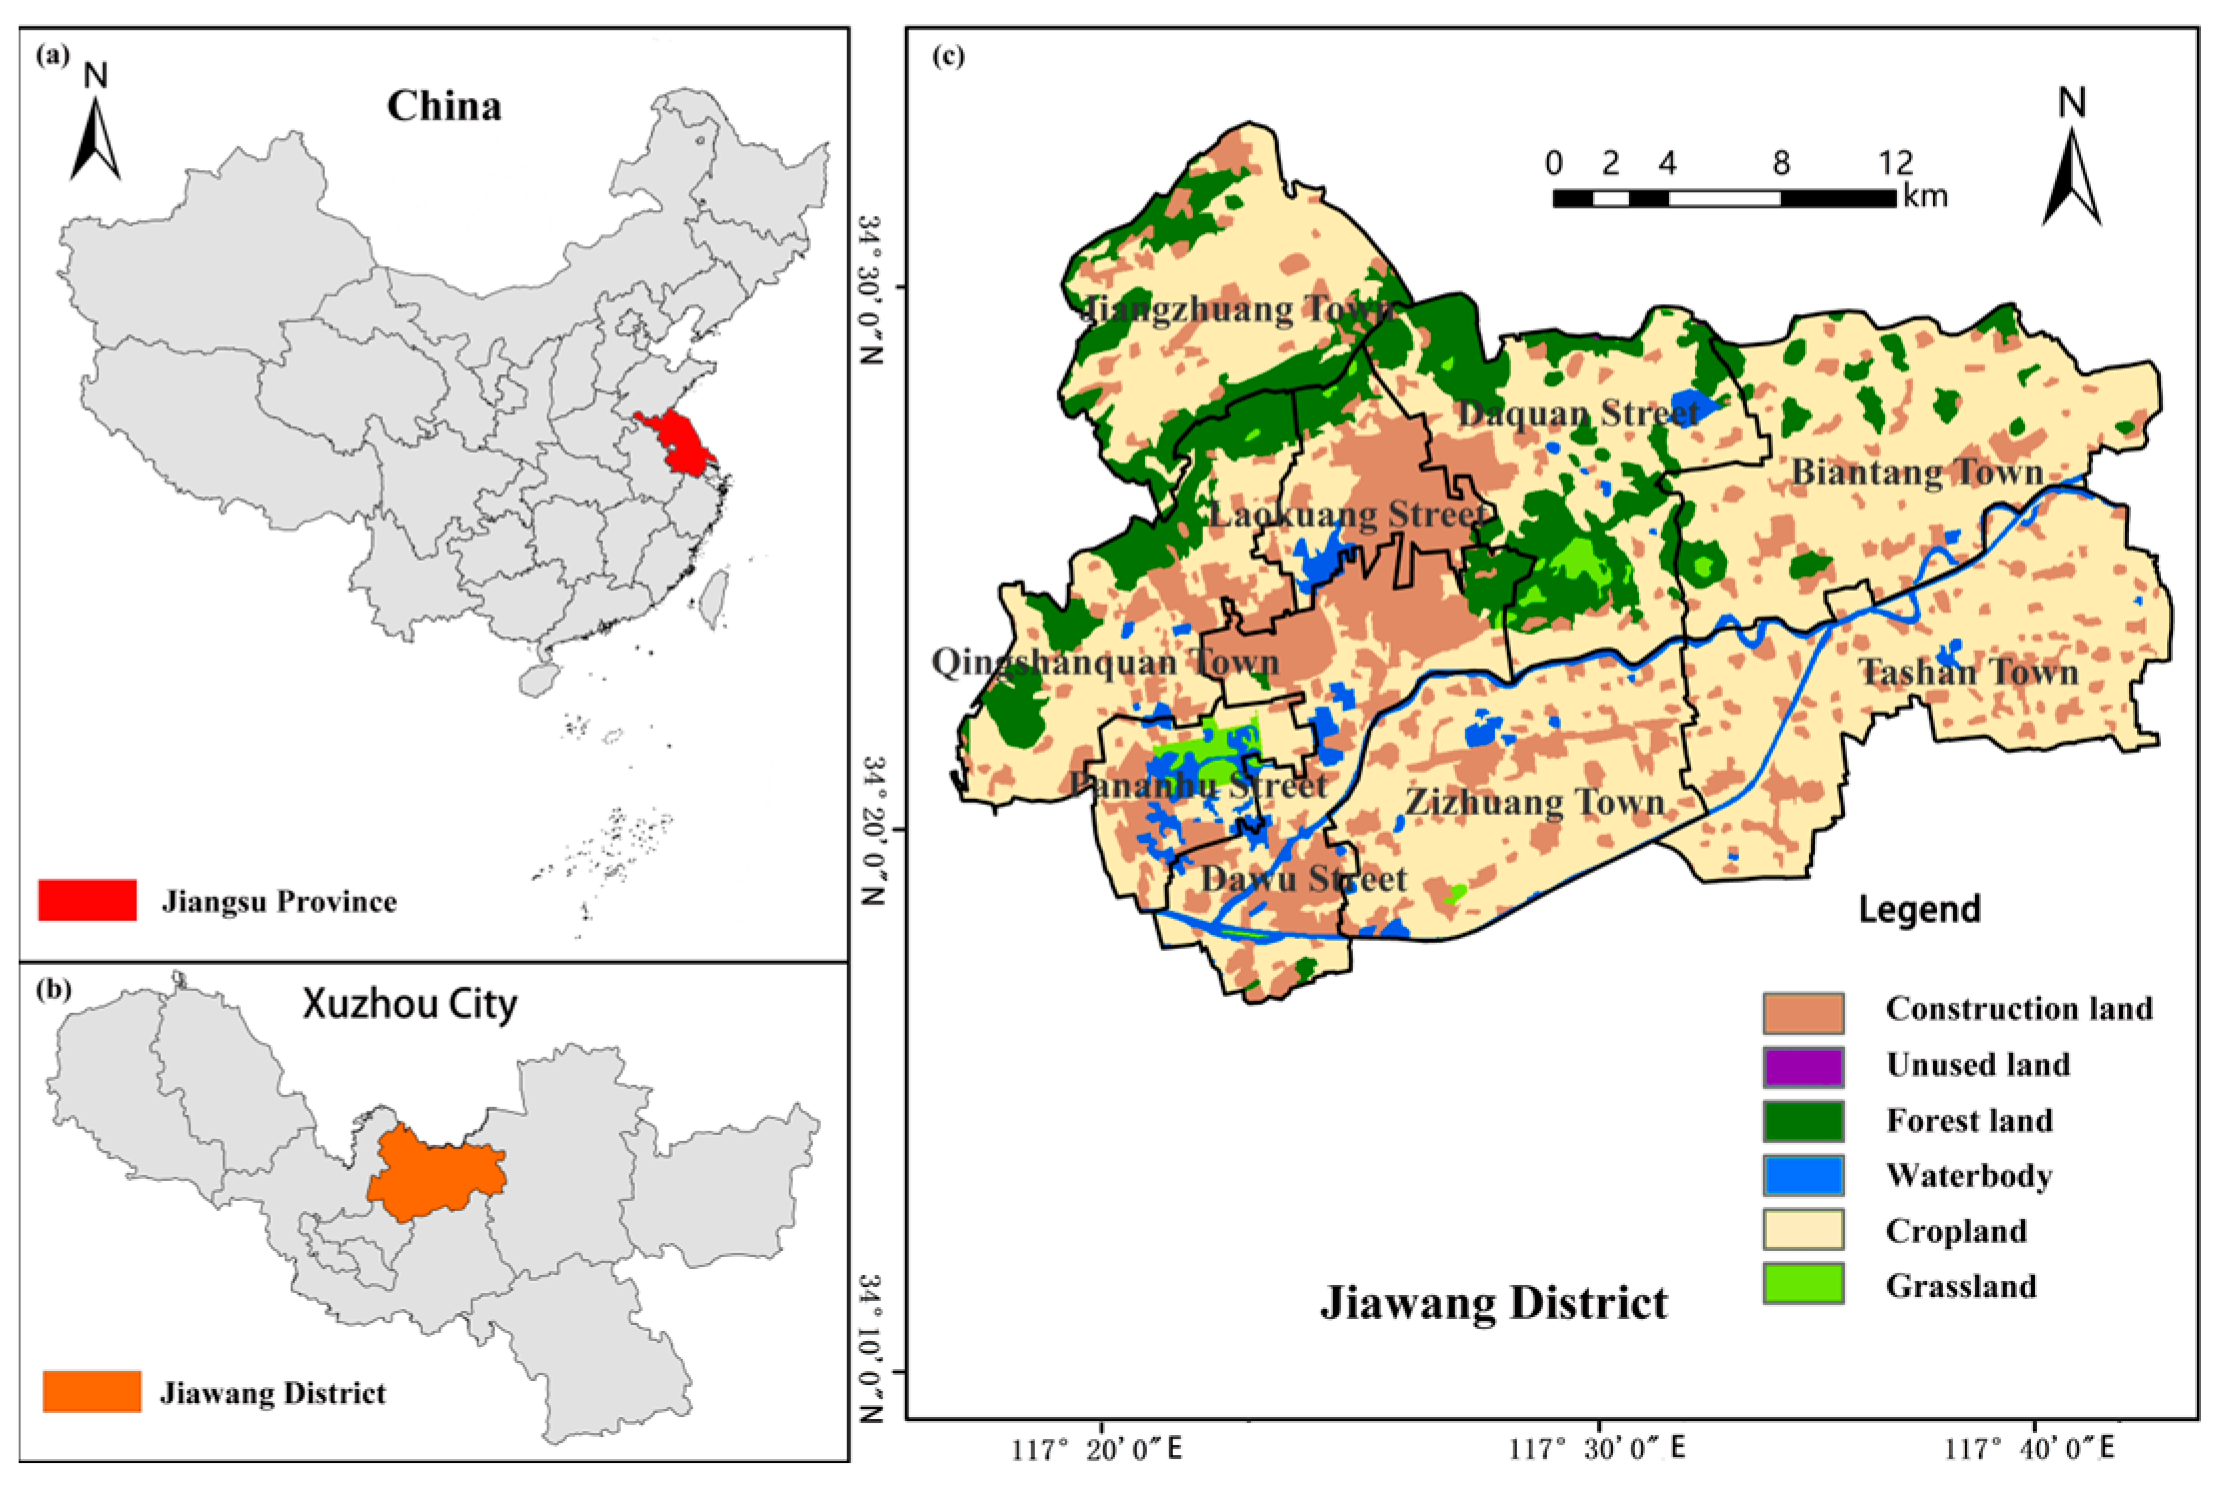
2.1. Overview of the Study Area
2.2. Data Sources
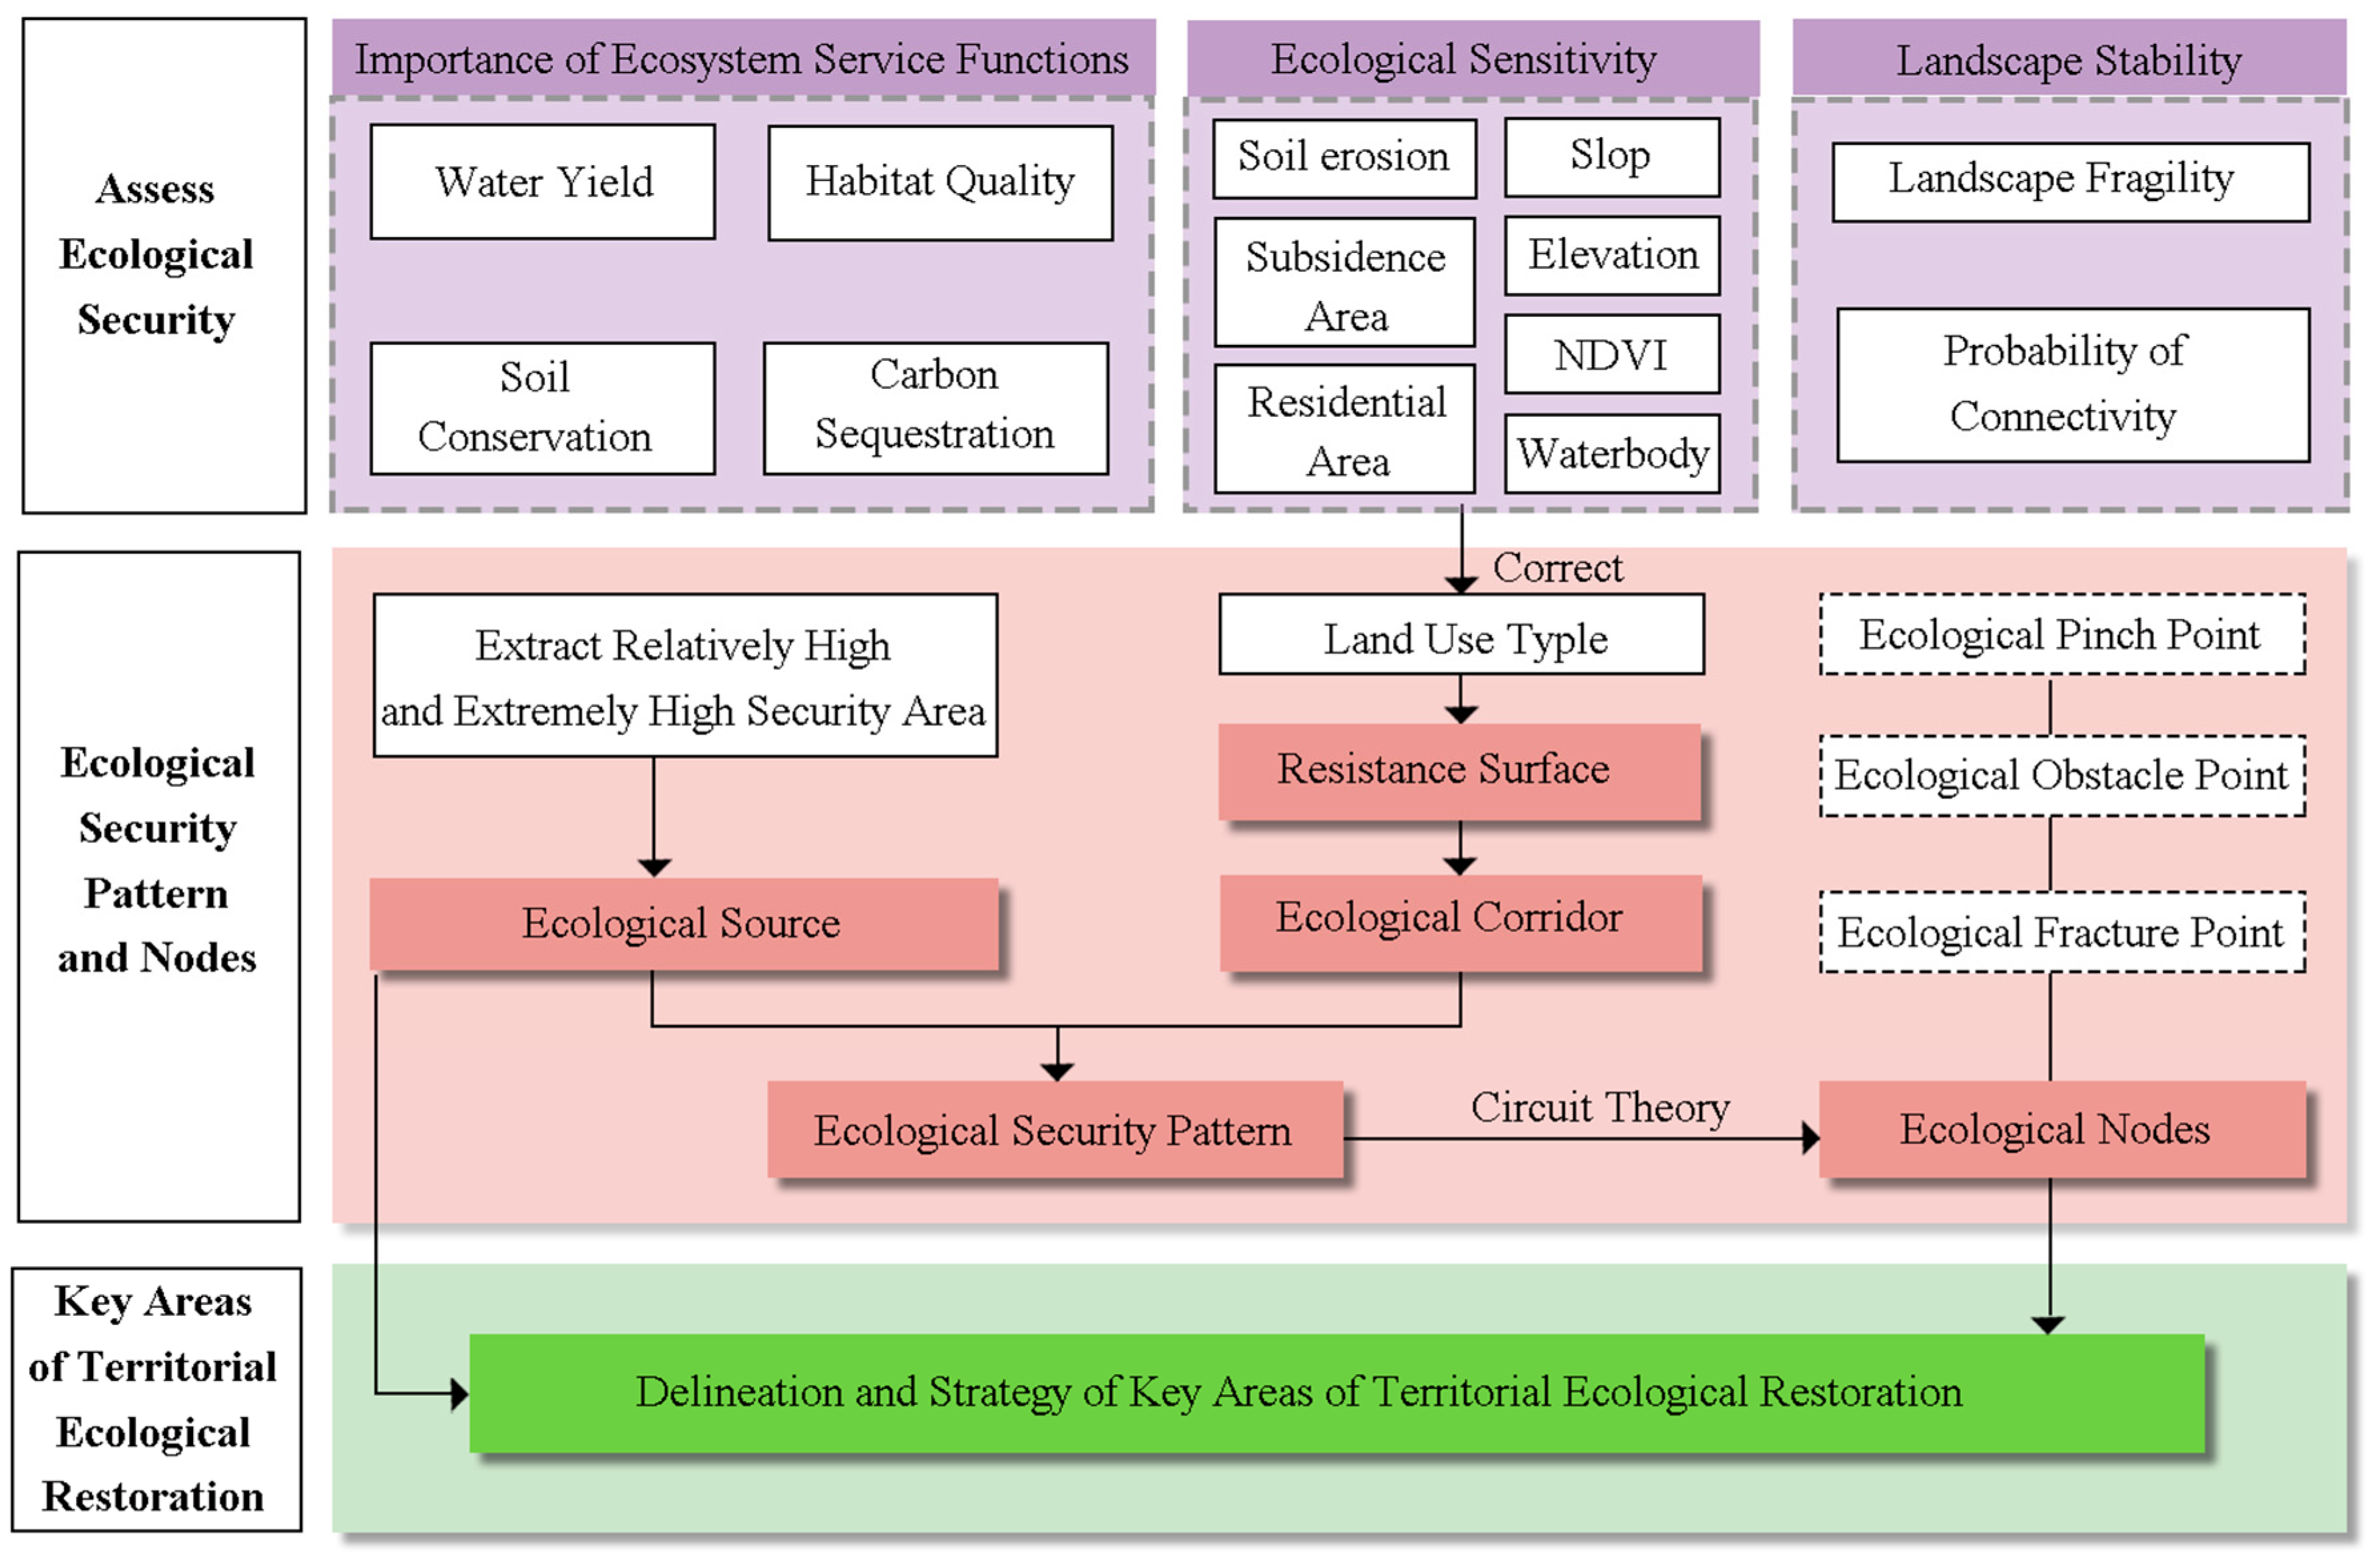
3. Research Methods
3.1. Identify Ecological Sources through Ecological Security Assessment
3.2. Construction of Ecological Resistance Surface and Corridor
3.3. Ecological Node Identification
3.3.1. Ecological Pinch Points
3.3.2. Ecological Obstacle Points
3.3.3. Ecological Fracture Points
4. Results
4.1. Identification Results of Ecological Sources
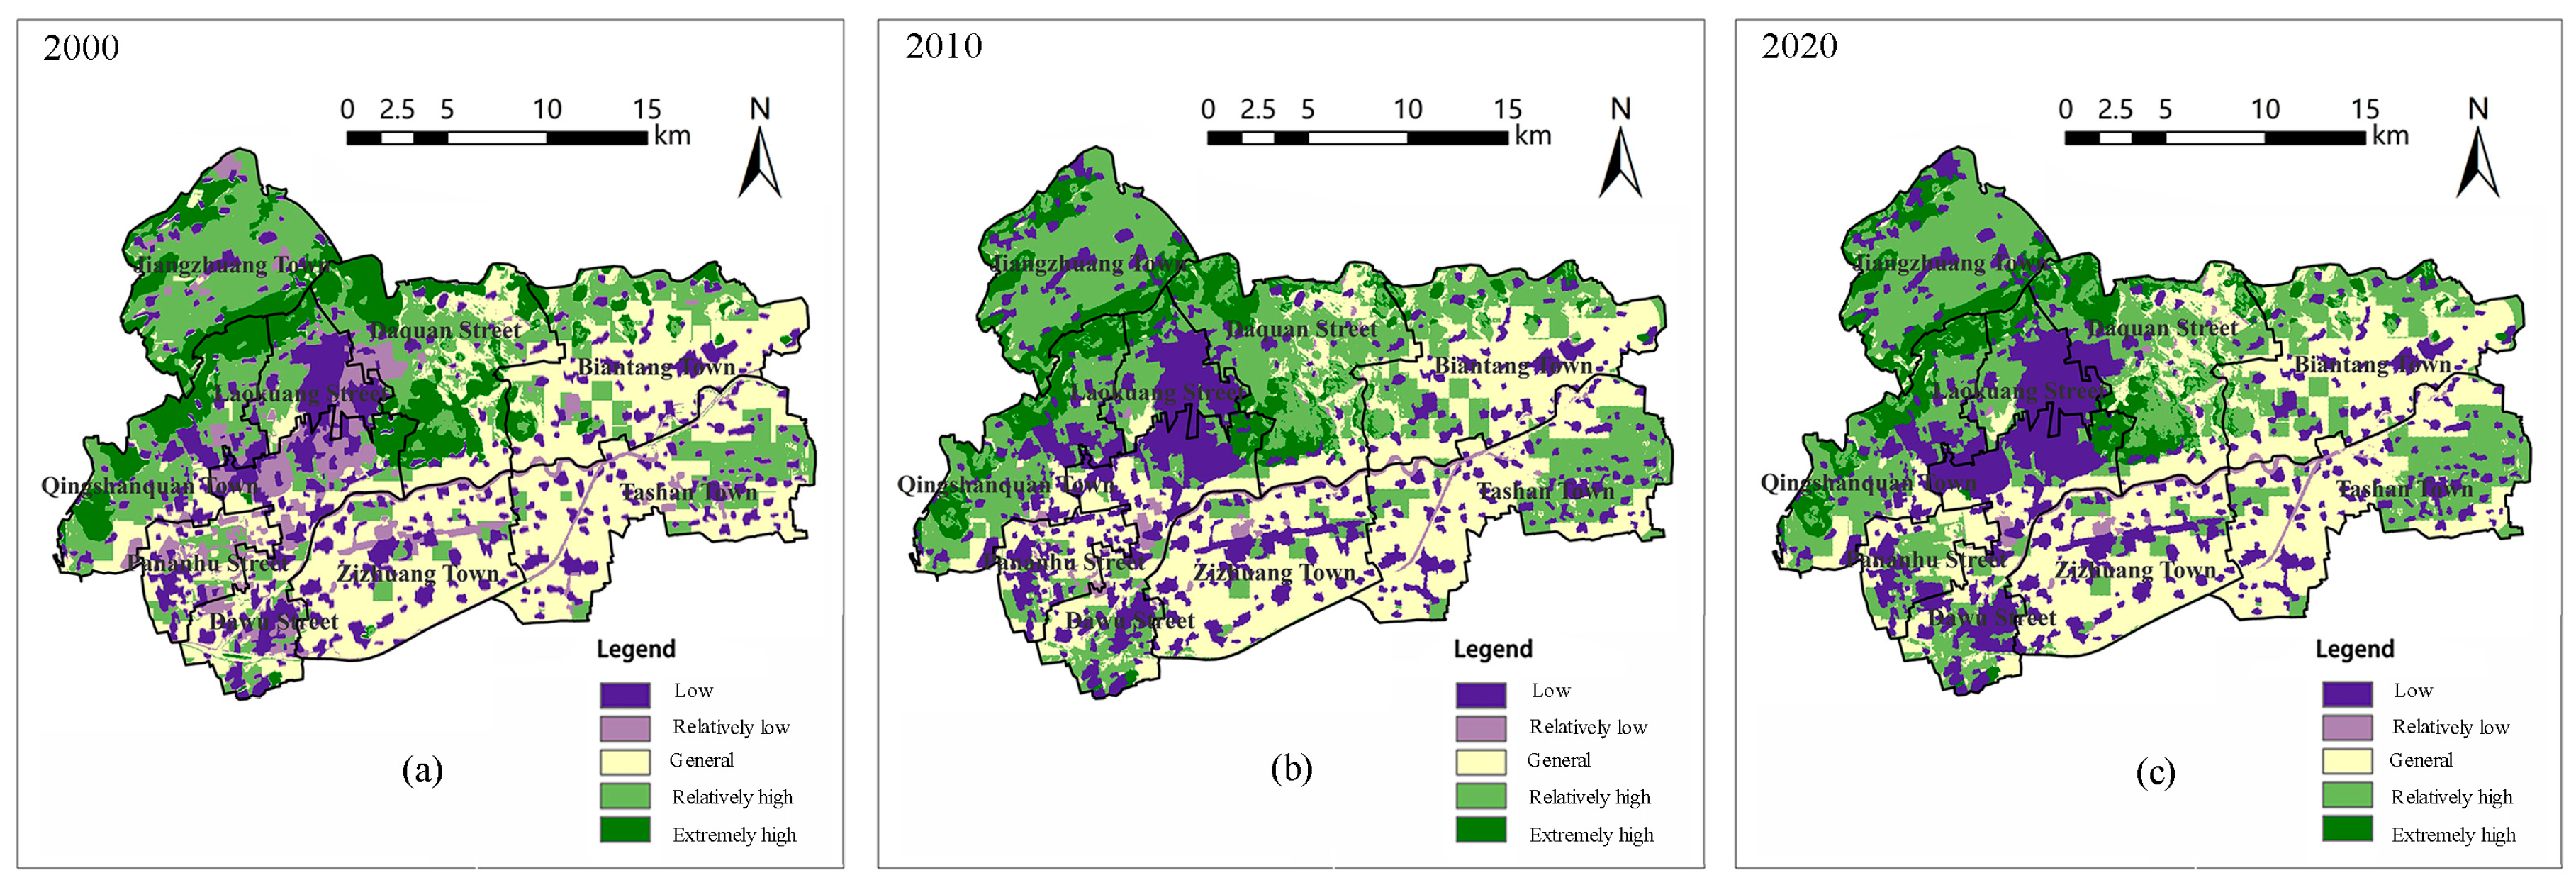
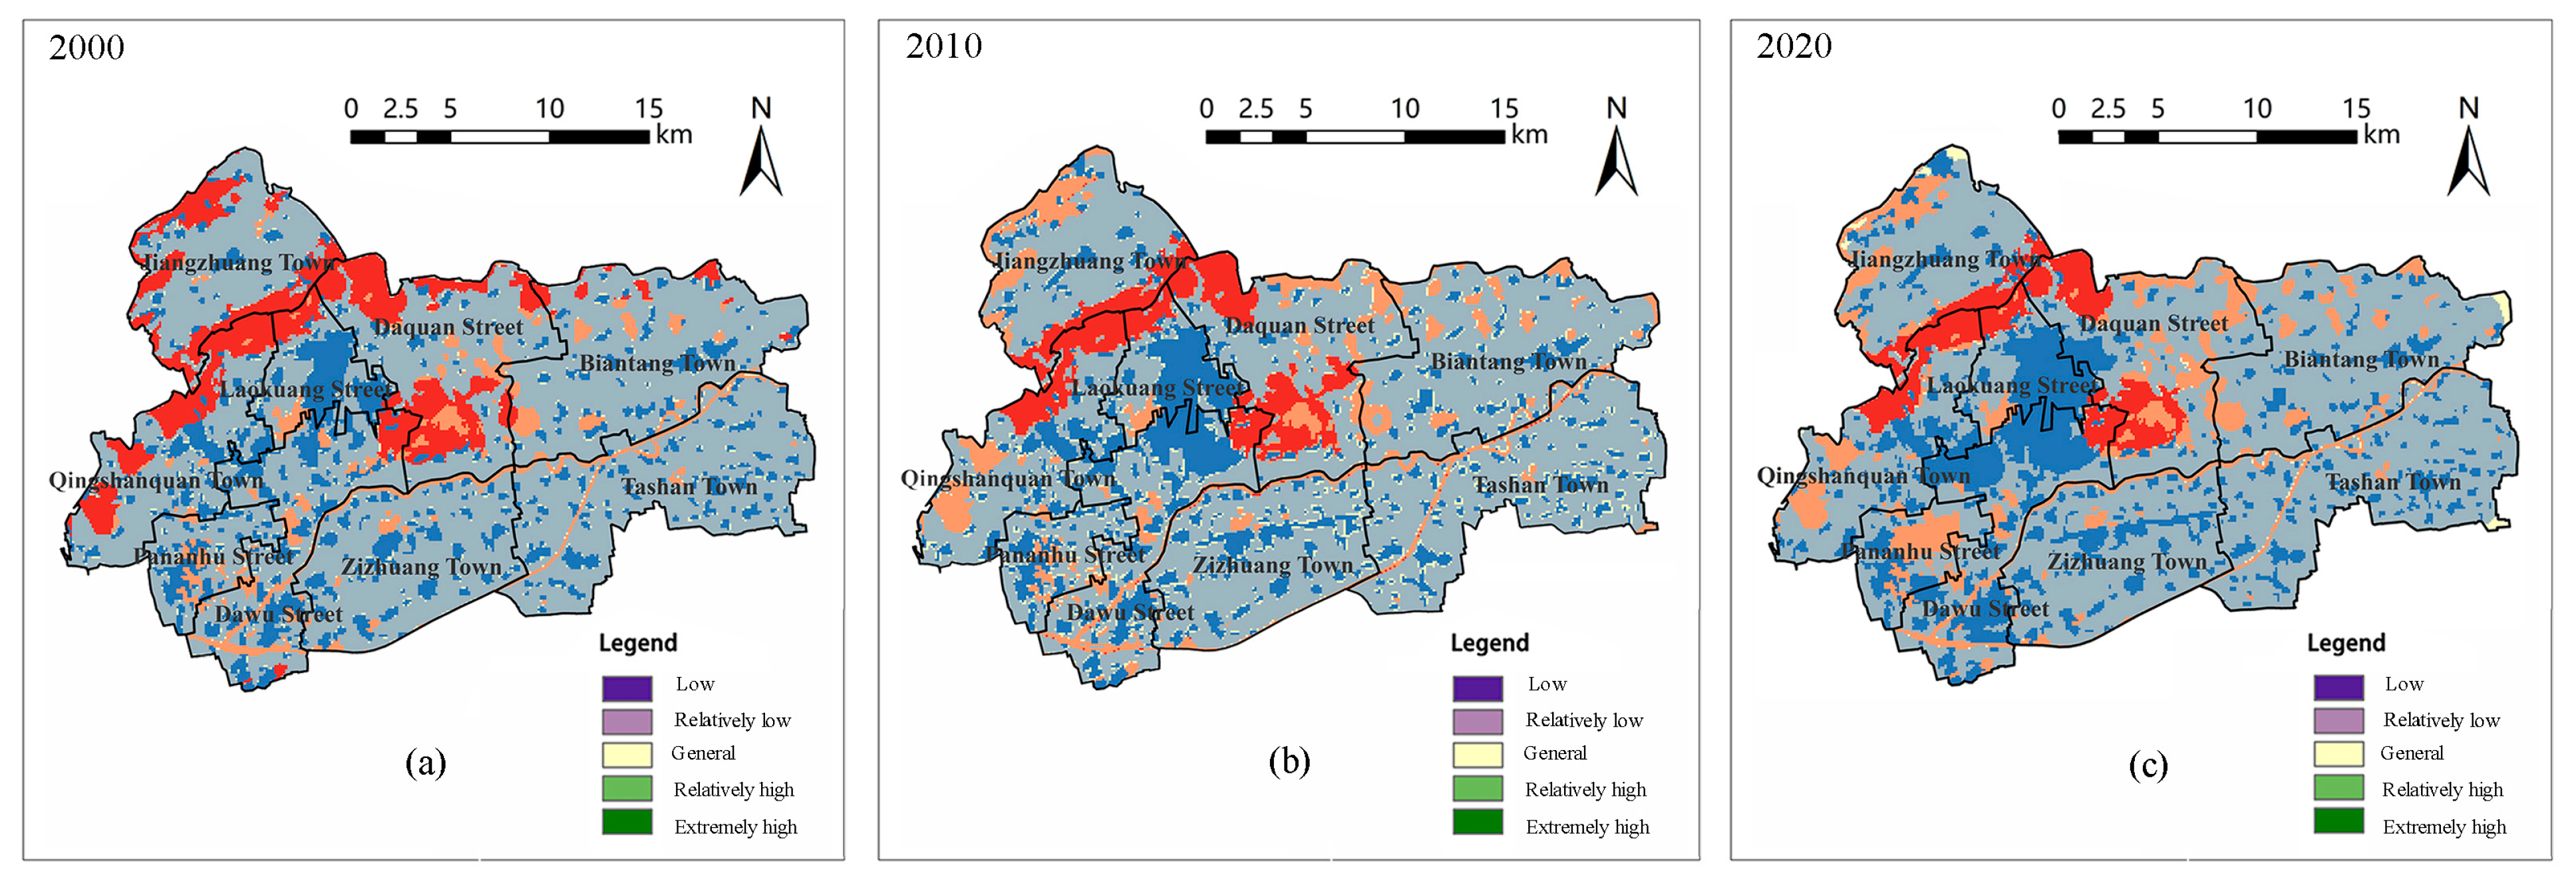
4.1.1. Ecological Security Assessment
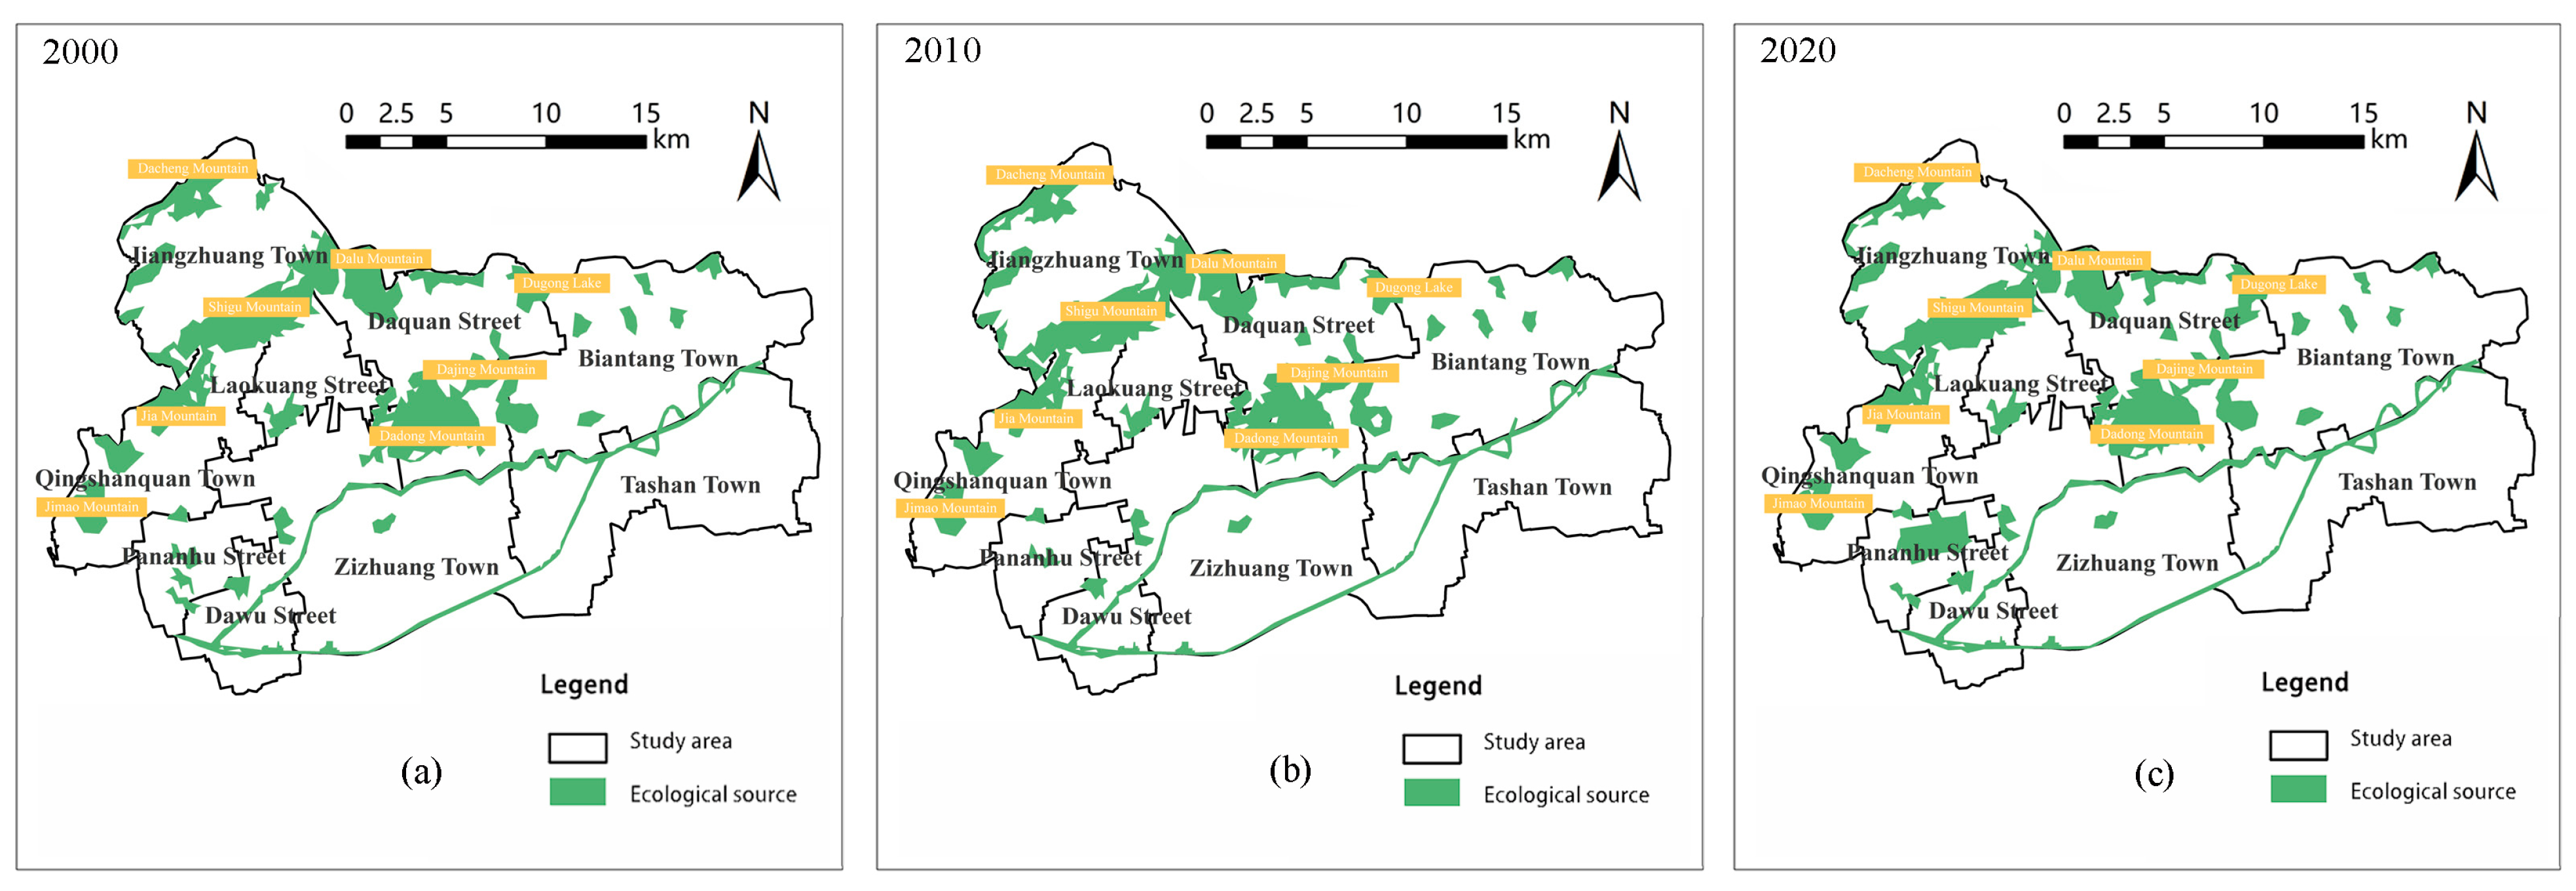
4.1.2. Extraction of Ecological Sources
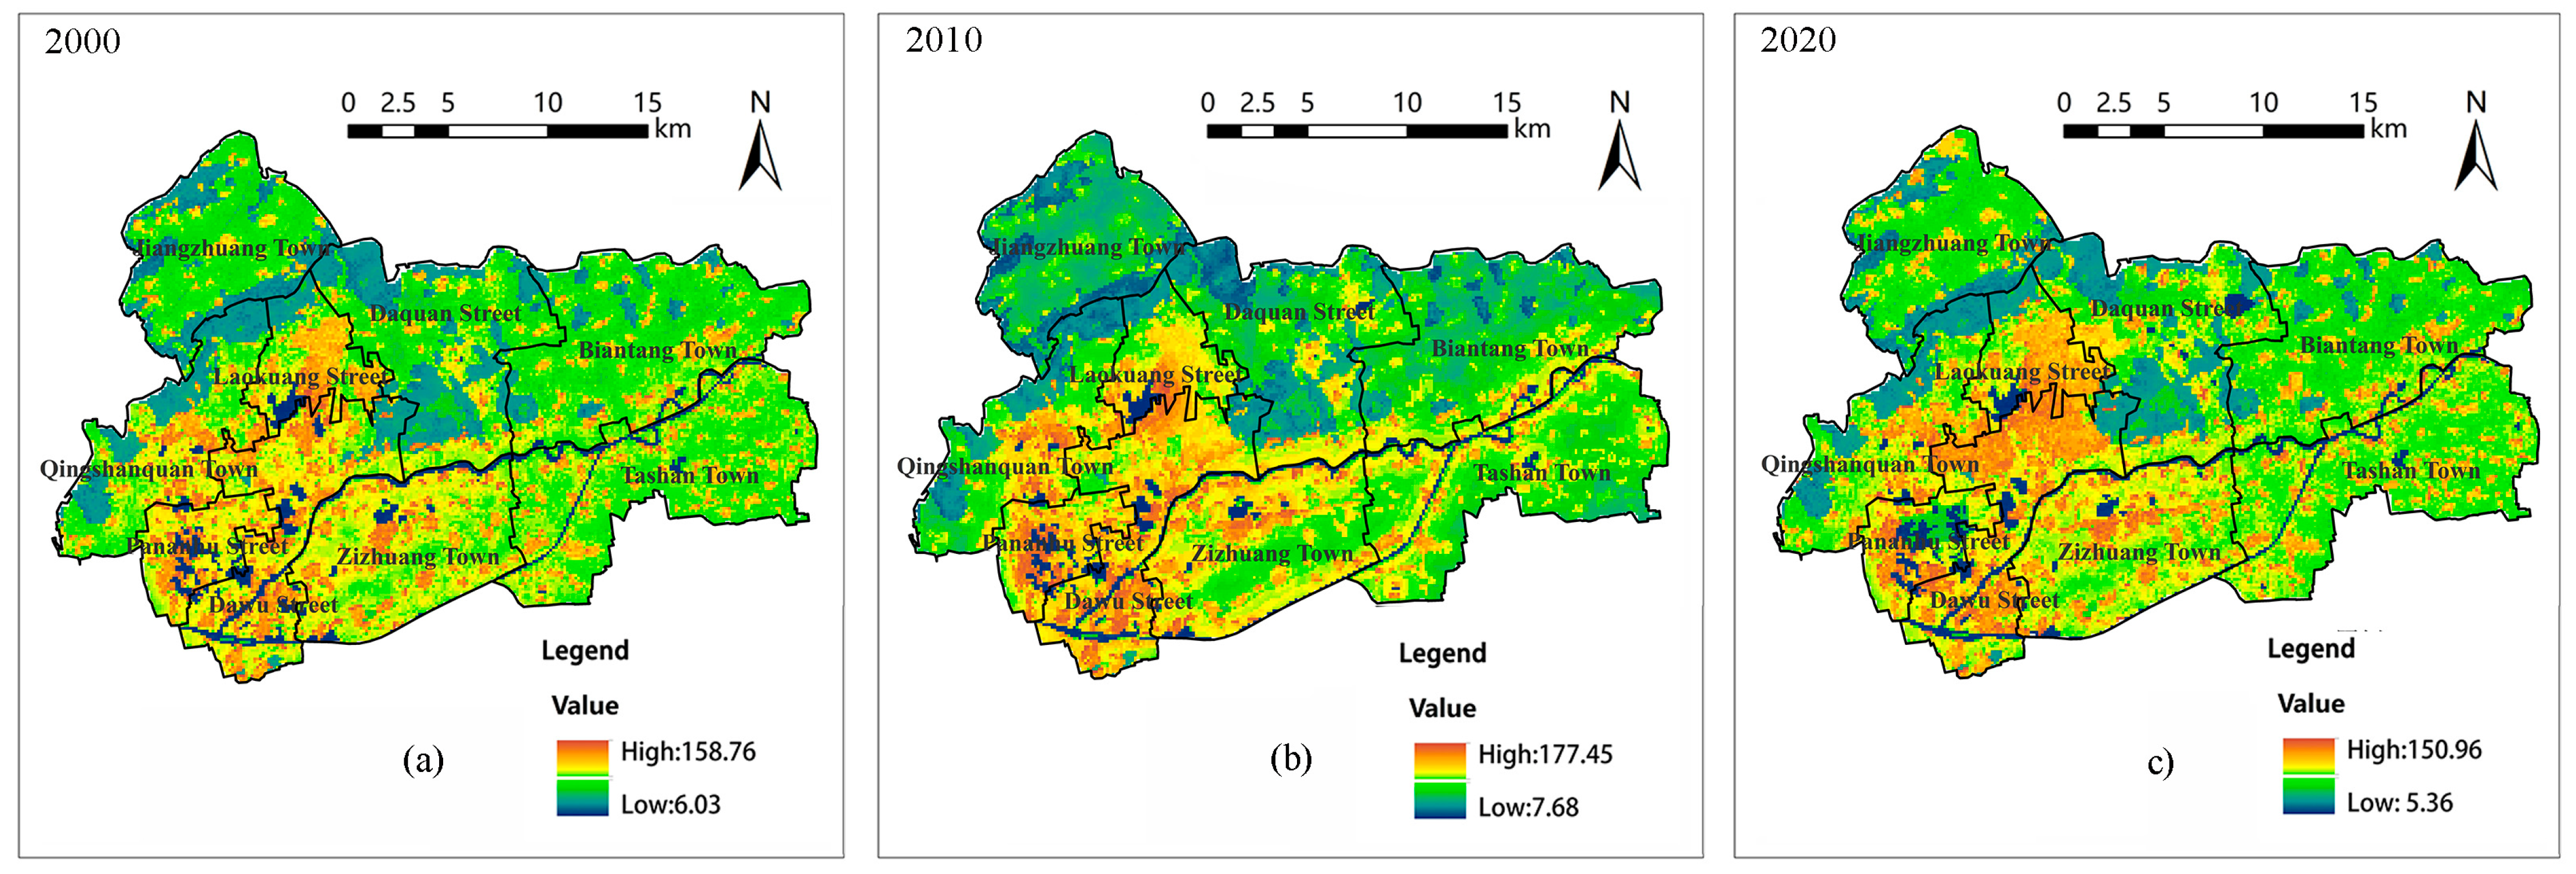
4.2. Results of Ecological Resistance Surface Construction
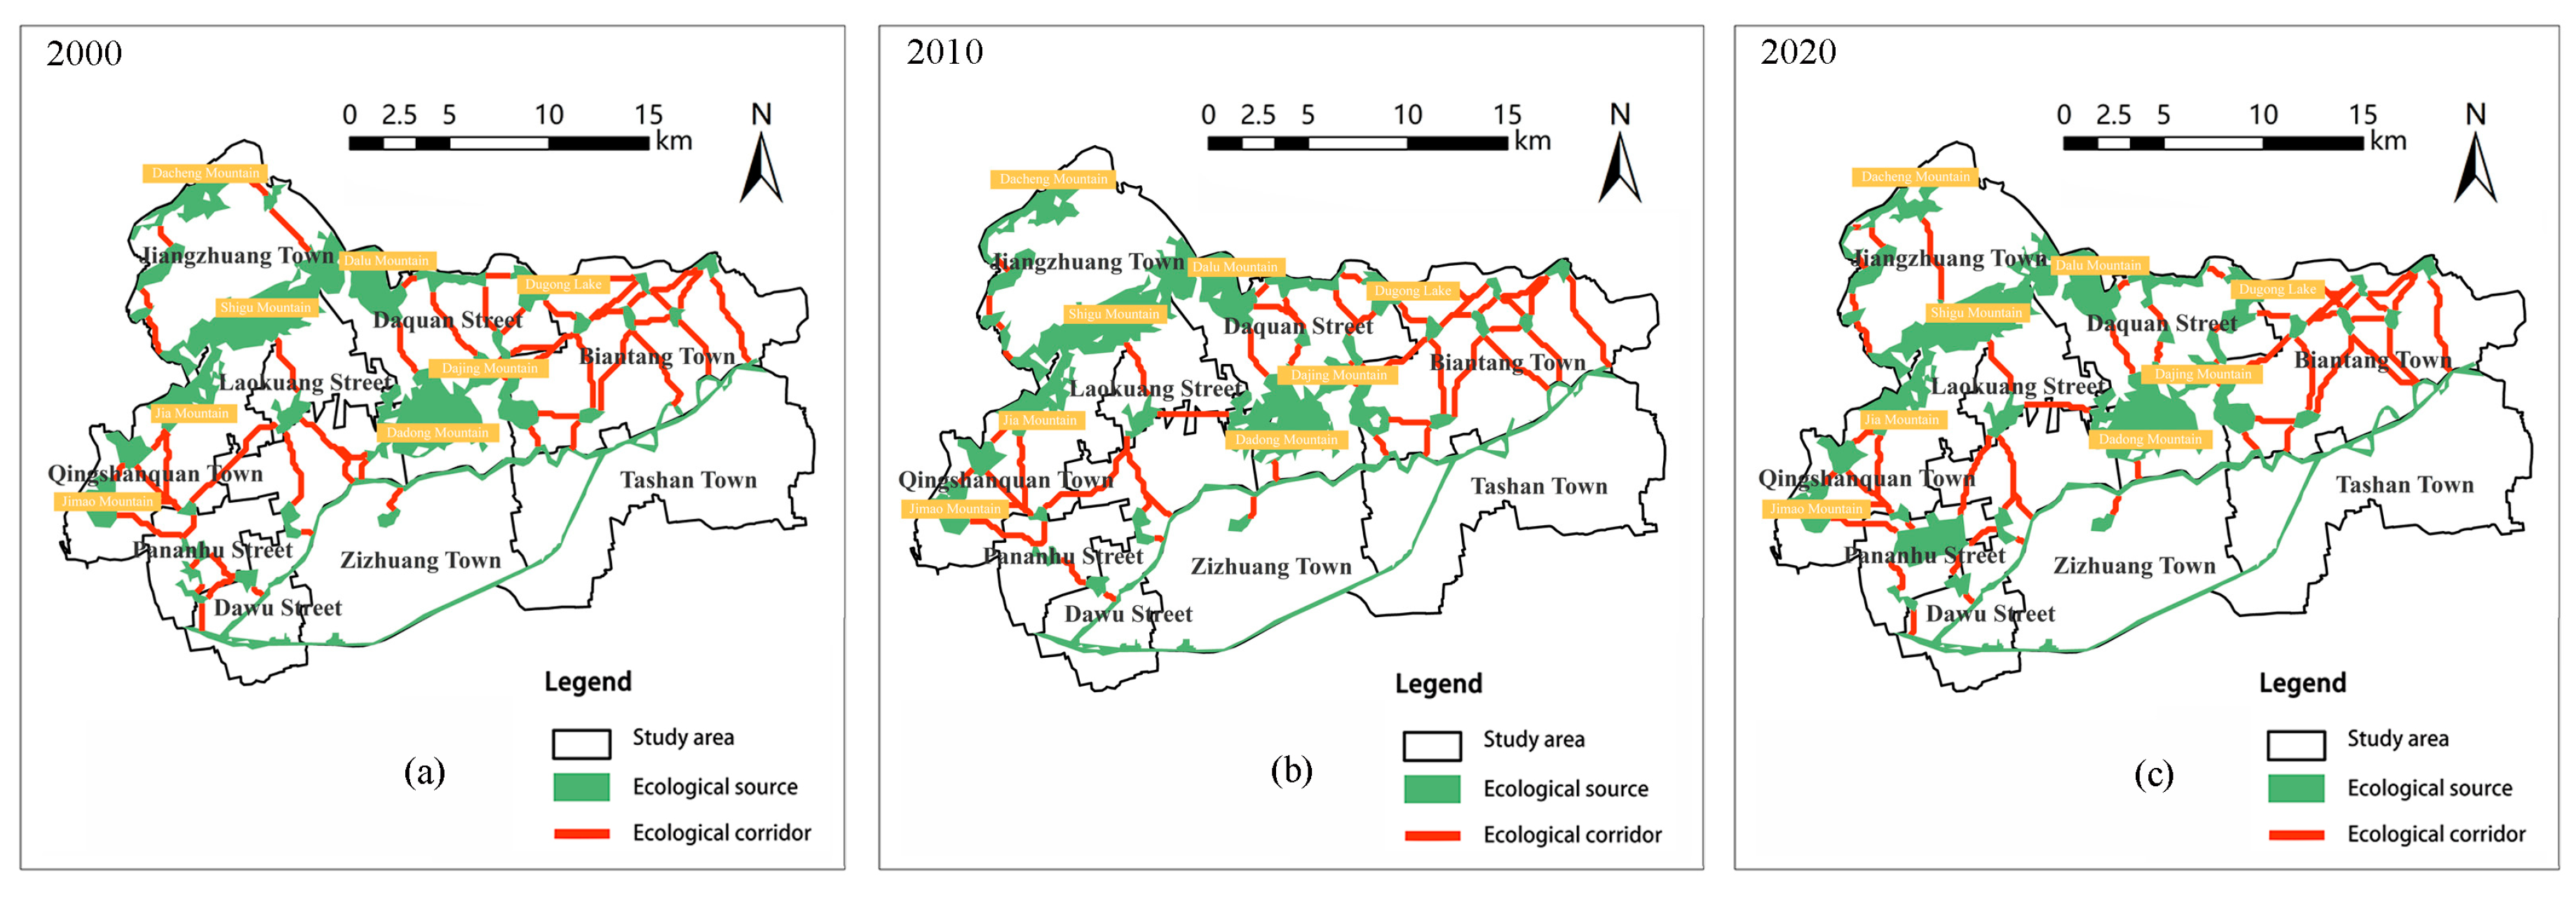
4.3. Ecological Corridor Identification Results
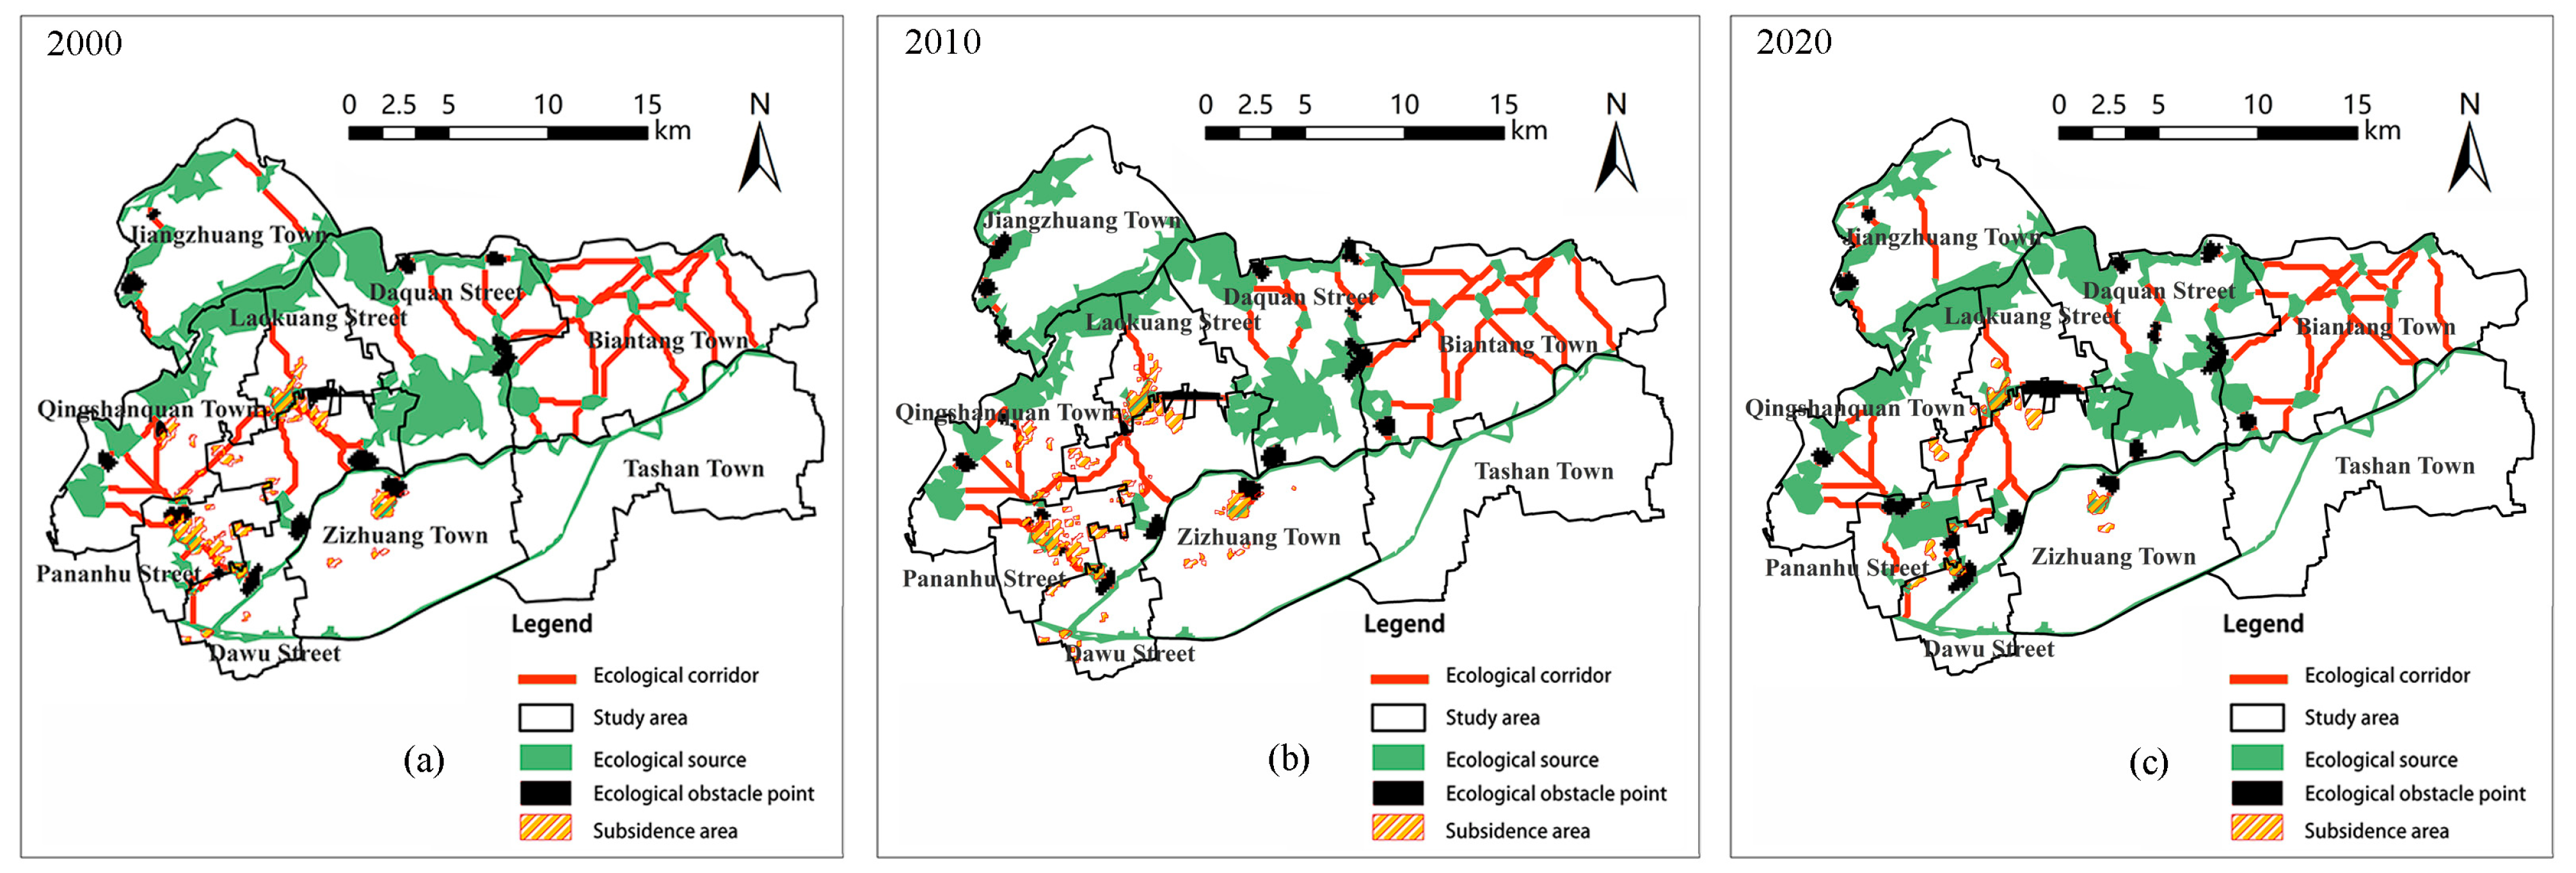
4.4. Ecological Node Identification
4.4.1. Ecological Pinch Point
4.4.2. Ecological Obstacle Points
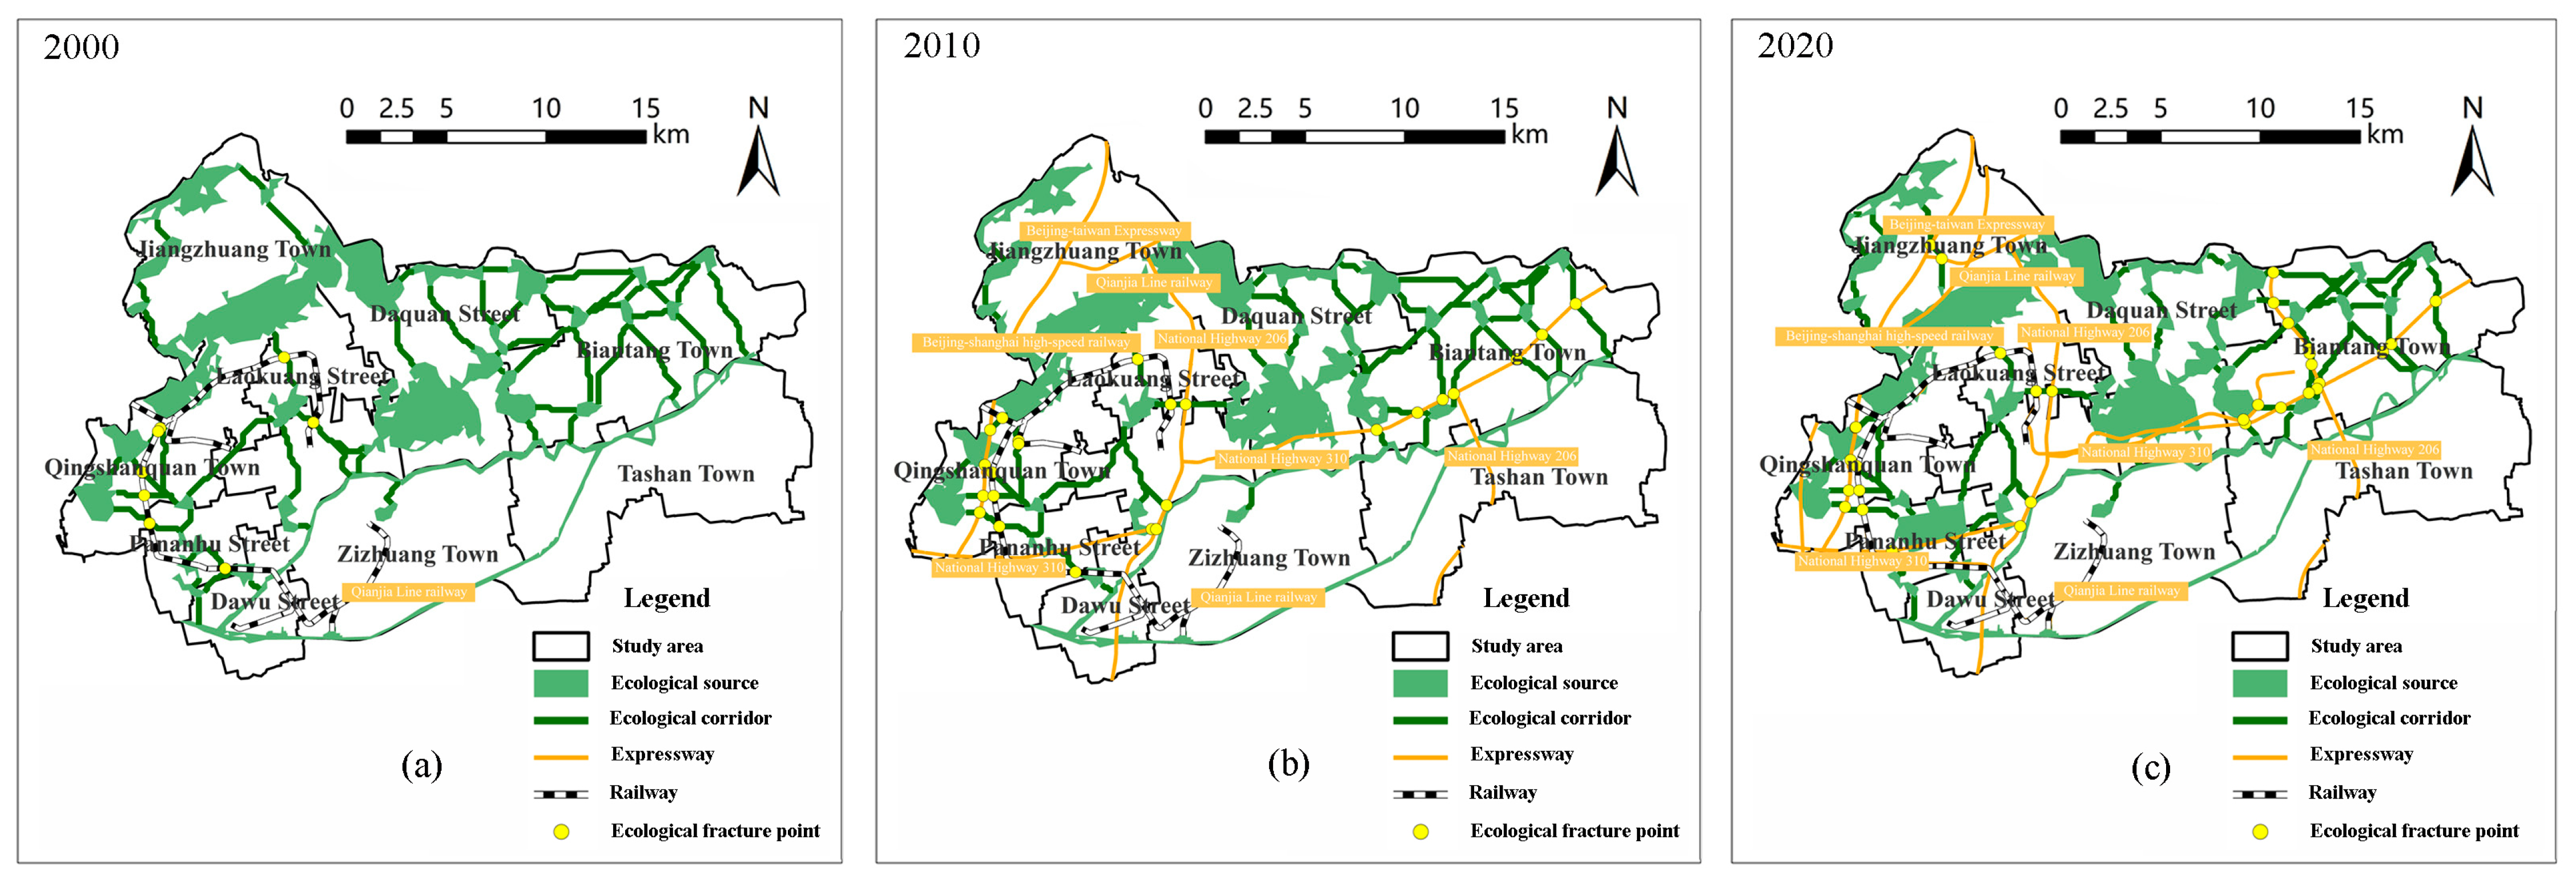
4.4.3. Ecological Fracture Point
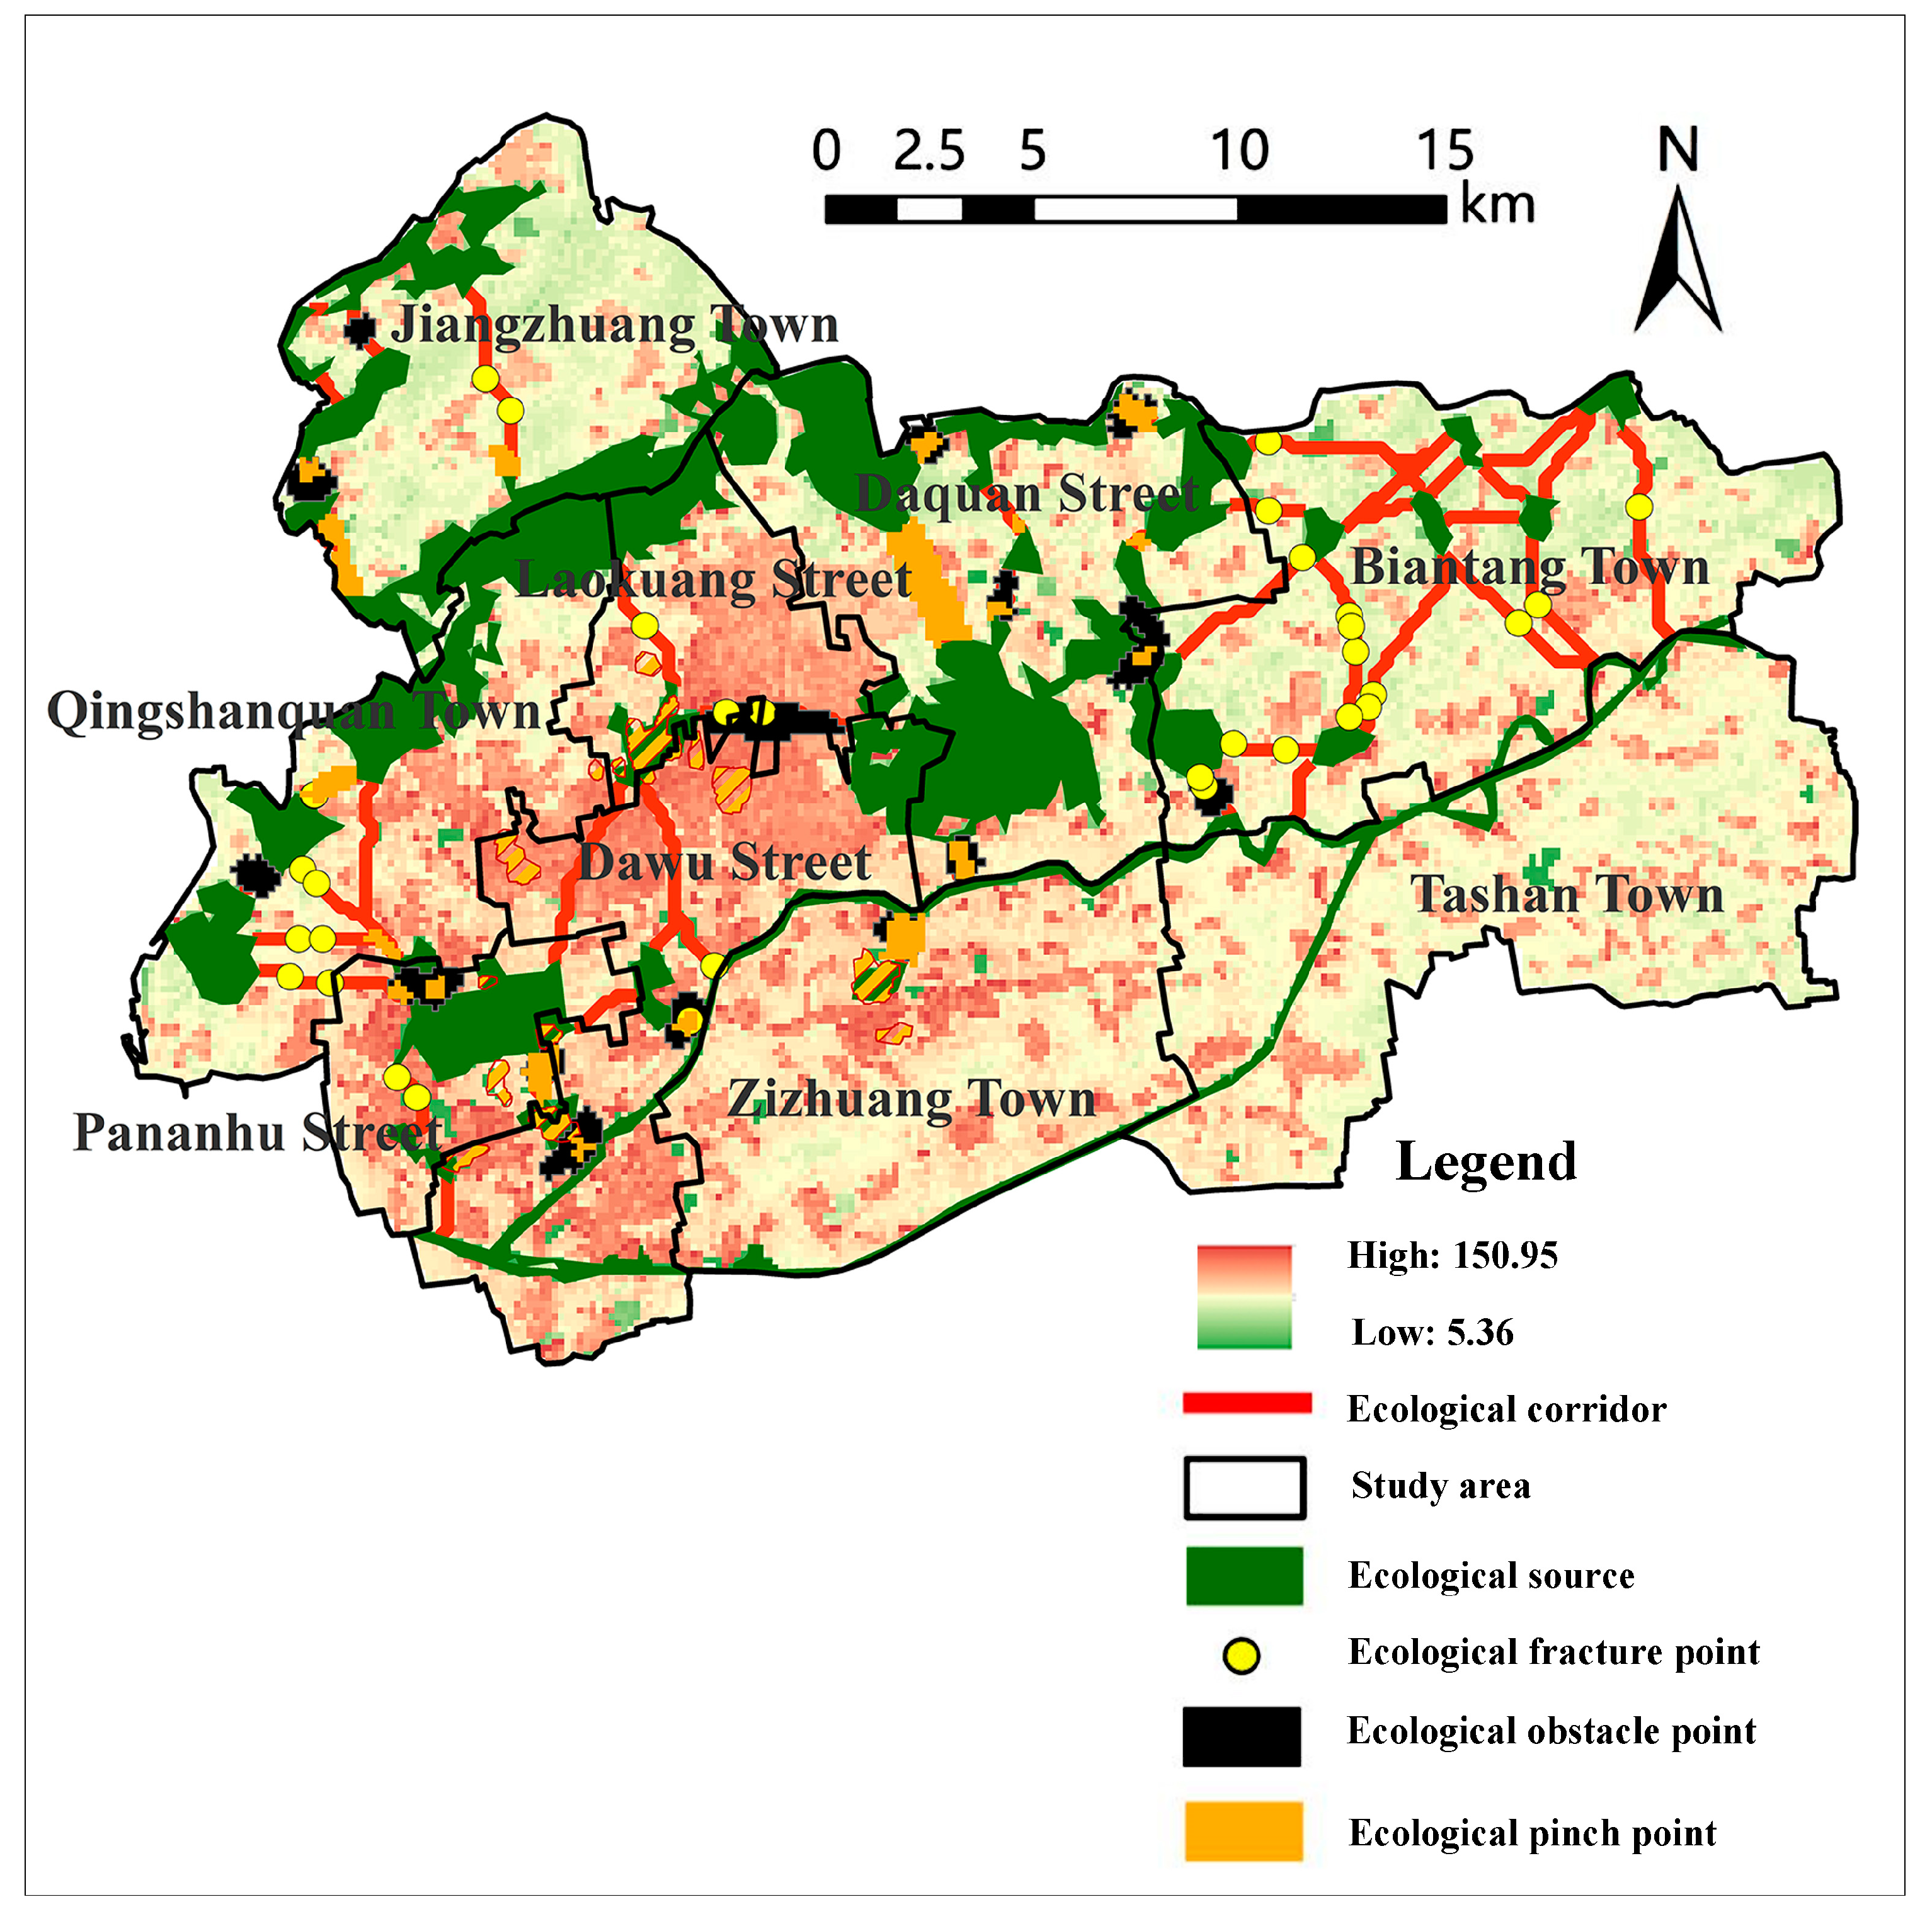
4.5. Identification of Key Areas of Territorial Ecological Restoration
5. Discussion
5.1. Strengths and Limitations
5.2. Characteristics of Spatial and Temporal Evolution of Territorial Ecological Restoration Critical Areas
5.3. Optimization Measures for Key Areas of Territorial Ecological Restoration
6. Conclusions
Author Contributions
Funding
Data Availability Statement
Acknowledgments
Conflicts of Interest
References
- Meng, Y.; Liu, L.; Wang, J.; Ran, Q.; Yang, X.; Shen, J. Assessing the Impact of the National Sustainable Development Planning of Resource-Based Cities Policy on Pollution Emission Intensity: Evidence from 270 Prefecture-Level Cities in China. Sustainability 2021, 13, 7293. [Google Scholar] [CrossRef]
- Du, Z.; Feng, L.; Wang, H.; Dong, Y.; Luo, D.; Zhang, X.; Liu, H.; Zhang, M. Identification of Ground Deformation Patterns in Coal Mining Areas via Rapid Topographical Analysis. Land 2023, 12, 1221. [Google Scholar] [CrossRef]
- Wen, B.; Pan, Y.; Zhang, Y.; Liu, J.; Xia, M. Does the Exhaustion of Resources Drive Land Use Changes? Evidence from the Influence of Coal Resources-Exhaustion on Coal Resources–Based Industry Land Use Changes. Sustainability 2018, 10, 2698. [Google Scholar] [CrossRef]
- Li, S.; Xiao, W.; Zhao, Y.; Lv, X. Incorporating ecological risk index in the multi-process MCRE model to optimize the ecological security pattern in a semi-arid area with intensive coal mining: A case study in northern China. J. Clean. Prod. 2020, 247, 119143. [Google Scholar] [CrossRef]
- Hu, X.; Xu, W.; Li, F. Spatiotemporal Evolution and Optimization of Landscape Patterns Based on the Ecological Restoration of Territorial Space. Land 2022, 11, 2114. [Google Scholar] [CrossRef]
- Mace, G. Global change: Ecology must evolve. Nature 2013, 503, 191–192. [Google Scholar] [CrossRef]
- Arifeen, H.M.; Chowdhury, M.S.; Zhang, H.; Suepa, T.; Amin, N.; Techato, K.; Jutidamrongphan, W. Role of a Mine in Changing Its Surroundings & mdash;Land Use and Land Cover and Impact on the Natural Environment in Barapukuria, Bangladesh. Sustainability 2021, 13, 13602. [Google Scholar]
- Takatsuka, H.; Zeng, D.-Z.; Zhao, L. Resource-based cities and the Dutch disease. Resour. Energy Econ. 2015, 40, 57–84. [Google Scholar] [CrossRef]
- Zhao, G.; Li, M.; Hu, Z.; Li, H.; Cao, T. Electrocatalytic redox of hydroquinone by two forms of l-Proline. J. Mol. Catal. A Chem. 2006, 255, 86–91. [Google Scholar] [CrossRef]
- Allen, M. Undermining the Japanese Miracle: Work and Conflict in a Japanese Coal-Mining Community; Cambridge University Press: Cambridge, UK, 1994. [Google Scholar] [CrossRef]
- Hou, H.; Ding, Z.; Zhang, S.; Guo, S.; Yang, Y.; Chen, Z.; Mi, J.; Wang, X. Spatial estimate of ecological and environmental damage in an underground coal mining area on the Loess Plateau: Implications for planning restoration interventions. J. Clean. Prod. 2020, 287, 125061. [Google Scholar] [CrossRef]
- Zhang, H.; Yan, Q.; Xie, F.; Ma, S. Evaluation and Prediction of Landscape Ecological Security Based on a CA-Markov Model in Overlapped Area of Crop and Coal Production. Land 2023, 12, 207. [Google Scholar] [CrossRef]
- Sklenicka, P.; Charvatova, E. Stand continuity—A useful parameter for ecological networks in post-mining landscapes. Ecol. Eng. 2003, 20, 287–296. [Google Scholar] [CrossRef]
- Wang, N.; Lee, J.C.K.; Zhang, J.; Chen, H.; Li, H. Evaluation of Urban circular economy development: An empirical research of 40 cities in China. J. Clean. Prod. 2018, 180, 876–887. [Google Scholar] [CrossRef]
- Zhang, H.; Xiong, L.; Li, L.; Zhang, S. Political incentives, transformation efficiency and resource-exhausted cities. J. Clean. Prod. 2018, 196, 1418–1428. [Google Scholar] [CrossRef]
- Tan, J.; Zhang, P.; Lo, K.; Li, J.; Liu, S. The Urban Transition Performance of Resource-Based Cities in Northeast China. Sustainability 2016, 8, 1022. [Google Scholar] [CrossRef]
- Bian, Z.; Lu, Q. Ecological effects analysis of land use change in coal mining area based on ecosystem service valuing: A case study in Jiawang. Environ. Earth Sci. 2013, 68, 1619–1630. [Google Scholar] [CrossRef]
- Chen, Z.; Yang, Y.; Zhou, L.; Hou, H.; Zhang, Y.; Liang, J.; Zhang, S. Ecological restoration in mining areas in the context of the Belt and Road initiative: Capability and challenges. Environ. Impact Assess. Rev. 2022, 95, 106767. [Google Scholar] [CrossRef]
- Song, P.; Xu, D.; Yue, J.; Ma, Y.; Dong, S.; Feng, J. Recent advances in soil remediation technology for heavy metal contaminated sites: A critical review. Sci. Total Environ. 2022, 838, 156417. [Google Scholar] [CrossRef] [PubMed]
- Lei, K.; Pan, H.; Lin, C. A landscape approach towards ecological restoration and sustainable development of mining areas. Ecol. Eng. 2016, 90, 320–325. [Google Scholar] [CrossRef]
- Kalin, M. Biogeochemical and ecological considerations in designing wetland treatment systems in post-mining landscapes. Waste Manag. 2001, 21, 191–196. [Google Scholar] [CrossRef]
- King, M.; van Zyll de Jong, M.; Piercey, D.E.; Nunn, A.D.; Cowx, I.G. An integrated decision driven design framework to support the ecological restoration of rivers. J. Environ. Plan. Manag. 2021, 65, 1483–1506. [Google Scholar] [CrossRef]
- Peng, J.; Wang, A.; Luo, L.; Liu, Y.; Li, H.; Hu, Y.n.; Meersmans, J.; Wu, J. Spatial identification of conservation priority areas for urban ecological land: An approach based on water ecosystem services. Land Degrad. Dev. 2019, 30, 683–694. [Google Scholar] [CrossRef]
- Xu, J.; Xu, D.; Qu, C. Construction of Ecological Security Pattern and Identification of Ecological Restoration Zones in the City of Changchun, China. Int. J. Environ. Res. Public Health 2023, 20, 289. [Google Scholar] [CrossRef] [PubMed]
- Li, S.; Sanhueza, P.; Zhang, Q.; Nakamura, F.; Lu, X.; Wang, J.; Liu, T.; Tatematsu, K.; Jackson, J.M.; Silva, A.; et al. The ALMA Survey of 70 μm Dark High-mass Clumps in Early Stages (ASHES). II. Molecular Outflows in the Extreme Early Stages of Protocluster Formation. Astrophys. J. 2020, 903, 119. [Google Scholar] [CrossRef]
- Di Marino, M.; Tiitu, M.; Lapintie, K.; Viinikka, A.; Kopperoinen, L. Integrating green infrastructure and ecosystem services in land use planning. Results from two Finnish case studies. Land Use Policy 2019, 82, 643–656. [Google Scholar] [CrossRef]
- Li, Y.-Y.; Zhang, Y.-Z.; Jiang, Z.-Y.; Guo, C.-X.; Zhao, M.-Y.; Yang, Z.-G.; Guo, M.-Y.; Wu, B.-Y.; Chen, Q.-L. Integrating morphological spatial pattern analysis and the minimal cumulative resistance model to optimize urban ecological networks: A case study in Shenzhen City, China. Ecol. Process. 2021, 10, 63. [Google Scholar] [CrossRef]
- Ran, Y.; Lei, D.; Li, J.; Gao, L.; Mo, J.; Liu, X. Identification of crucial areas of territorial ecological restoration based on ecological security pattern: A case study of the central Yunnan urban agglomeration, China. Ecol. Indic. 2022, 143, 109318. [Google Scholar] [CrossRef]
- Zhao, Y.; Kasimu, A.; Liang, H.; Reheman, R. Construction and Restoration of Landscape Ecological Network in Urumqi City Based on Landscape Ecological Risk Assessment. Sustainability 2022, 14, 8154. [Google Scholar] [CrossRef]
- Miao, Z.; Pan, L.; Wang, Q.; Chen, P.; Yan, C.; Liu, L. Research on Urban Ecological Network Under the Threat of Road Networks—A Case Study of Wuhan. ISPRS Int. J. Geo-Inf. 2019, 8, 342. [Google Scholar] [CrossRef]
- Peng, J.; Pan, Y.; Liu, Y.; Zhao, H.; Wang, Y. Linking ecological degradation risk to identify ecological security patterns in a rapidly urbanizing landscape. Habitat Int. 2018, 71, 110–124. [Google Scholar] [CrossRef]
- Elbakidze, M.; Angelstam, P.; Yamelynets, T.; Dawson, L.; Gebrehiwot, M.; Stryamets, N.; Johansson, K.-E.; Garrido, P.; Naumov, V.; Manton, M. A bottom-up approach to map land covers as potential green infrastructure hubs for human well-being in rural settings: A case study from Sweden. Landsc. Urban Plan. 2017, 168, 72–83. [Google Scholar] [CrossRef]
- Aminzadeh, B.; Khansefid, M. A case study of urban ecological networks and a sustainable city: Tehran’s metropolitan area. Urban Ecosyst. 2010, 13, 23–36. [Google Scholar] [CrossRef]
- Tang, Y.; Gao, C.; Wu, X. Urban Ecological Corridor Network Construction: An Integration of the Least Cost Path Model and the InVEST Model. ISPRS Int. J. Geo-Inf. 2020, 9, 33. [Google Scholar] [CrossRef]
- Peng, J.; Yang, Y.; Liu, Y.; Hu, Y.n.; Du, Y.; Meersmans, J.; Qiu, S. Linking ecosystem services and circuit theory to identify ecological security patterns. Sci. Total Environ. 2018, 644, 781–790. [Google Scholar] [CrossRef]
- Niu, X.; Ni, H.; Ma, Q.; Wang, S.; Zong, L. Identifying Ecological Security Patterns Based on Ecosystem Service Supply and Demand Using Remote Sensing Products (Case Study: The Fujian Delta Urban Agglomeration, China). Sustainability 2023, 15, 578. [Google Scholar] [CrossRef]
- Jiao, S.; Liu, Y.C.; Han, Z.W.; Zhou, K.J.; Hu, L.; Liu, T.X. Determining priority areas for land ecological restoration based on ecological network-human disturbance: A case study of Changsha-Zhuzhou-Xiangtan Urban Agglomeration. J. Nat. Resour. 2021, 36, 2294–2307. [Google Scholar] [CrossRef]
- Xiao, S.; Wu, W.; Guo, J.; Ou, M.; Pueppke, S.G.; Ou, W.; Tao, Y. An evaluation framework for designing ecological security patterns and prioritizing ecological corridors: Application in Jiangsu Province, China. Landsc. Ecol. 2020, 35, 2517–2534. [Google Scholar] [CrossRef]
- Zhou, D.; Lin, Z.; Ma, S.; Qi, J.; Yan, T. Assessing an ecological security network for a rapid urbanization region in Eastern China. Land Degrad. Dev. 2021, 32, 2642–2660. [Google Scholar] [CrossRef]
- Xu, X.; Wang, S.; Yan, G.; He, X. Ecological Security Assessment Based on the Importance–Sensitivity–Connectivity Index and Pattern Construction: A Case Study of Xiliu Ditch in the Yellow River Basin, China. Land 2023, 12, 1296. [Google Scholar] [CrossRef]
- Tang, B.; Wang, H.; Peng, L.; Wang, Z.; Liu, J.; Liwei, Z.; Jiao, L. Integrating ecosystem organization, quality and services indicators in the ecological security assessment. Land Degrad. Dev. 2023, in press. [CrossRef]
- Ying, B.; Liu, T.; Ke, L.; Xiong, K.; Li, S.; Sun, R.; Zhu, F. Identifying the Landscape Security Pattern in Karst Rocky Desertification Area Based on Ecosystem Services and Ecological Sensitivity: A Case Study of Guanling County, Guizhou Province. Forests 2023, 14, 613. [Google Scholar] [CrossRef]
- Zhou, S.; Song, Y.; Li, Y.; Wang, J.; Zhang, L. Construction of Ecological Security Pattern for Plateau Lake Based on MSPA–MCR Model: A Case Study of Dianchi Lake Area. Sustainability 2022, 14, 14532. [Google Scholar]
- Yang, C.; Guo, H.; Huang, X.; Wang, Y.; Li, X.; Cui, X. Ecological Network Construction of a National Park Based on MSPA and MCR Models: An Example of the Proposed National Parks of “Ailaoshan-Wuliangshan” in China. Land 2022, 11, 1913. [Google Scholar]
- Taylor, P.D.; Fahrig, L.; Henein, K.; Merriam, G. Connectivity Is a Vital Element of Landscape Structure. Oikos 1993, 68, 571–573. [Google Scholar] [CrossRef]
- Li, J.; Xu, J.; Chu, J. The Construction of a Regional Ecological Security Pattern Based on Circuit Theory. Sustainability 2019, 11, 6343. [Google Scholar] [CrossRef]
- Pickett, S.T.A.; Cadenasso, M.L.; Rosi-Marshall, E.J.; Belt, K.T.; Groffman, P.M.; Grove, J.M.; Irwin, E.G.; Kaushal, S.S.; LaDeau, S.L.; Nilon, C.H.; et al. Dynamic heterogeneity: A framework to promote ecological integration and hypothesis generation in urban systems. Urban Ecosyst. 2017, 20, 1–14. [Google Scholar] [CrossRef]
- Keeley, A.T.H.; Beier, P.; Gagnon, J.W. Estimating landscape resistance from habitat suitability: Effects of data source and nonlinearities. Landsc. Ecol. 2016, 31, 2151–2162. [Google Scholar] [CrossRef]
- Zhang, G.; Wang, J.; Jiang, Y.; Zhou, P.; Zhao, Y.; Xu, Y. On-Orbit Geometric Calibration and Validation of Luojia 1-01 Night-Light Satellite. Remote Sens. 2019, 11, 264. [Google Scholar] [CrossRef]
- Ke, S.; Pan, H.; Jin, B. Identification of Priority Areas for Ecological Restoration Based on Human Disturbance and Ecological Security Patterns: A Case Study of Fuzhou City, China. Sustainability 2023, 15, 2842. [Google Scholar] [CrossRef]
- Lai, X.; Yu, H.; Liu, G.; Zhang, X.; Feng, Y.; Ji, Y.; Zhao, Q.; Jiang, J.; Gu, X. Construction and Analysis of Ecological Security Patterns in the Southern Anhui Region of China from a Circuit Theory Perspective. Remote Sens. 2023, 15, 1385. [Google Scholar] [CrossRef]
- Belote, R.T.; Barnett, K.; Zeller, K.; Brennan, A.; Gage, J. Examining local and regional ecological connectivity throughout North America. Landsc. Ecol. 2022, 37, 2977–2990. [Google Scholar] [CrossRef]
- Li, S.; Zhao, Y.; Xiao, W.; Yue, W.; Wu, T. Optimizing ecological security pattern in the coal resource-based city: A case study in Shuozhou City, China. Ecol. Indic. 2021, 130, 108026. [Google Scholar] [CrossRef]
- Kool, J.T.; Moilanen, A.; Treml, E.A. Population connectivity: Recent advances and new perspectives. Landsc. Ecol. 2013, 28, 165–185. [Google Scholar] [CrossRef]
- Lv, L.; Zhang, S.; Zhu, J.; Wang, Z.; Wang, Z.; Li, G.; Yang, C. Ecological Restoration Strategies for Mountainous Cities Based on Ecological Security Patterns and Circuit Theory: A Case of Central Urban Areas in Chongqing, China. Int. J. Environ. Res. Public Health 2022, 19, 16505. [Google Scholar] [CrossRef]
- Wang, Z.; Luo, K.; Zhao, Y.; Lechner, A.M.; Wu, J.; Zhu, Q.; Sha, W.; Wang, Y. Modelling regional ecological security pattern and restoration priorities after long-term intensive open-pit coal mining. Sci. Total Environ. 2022, 835, 155491. [Google Scholar] [CrossRef]
- Wang, X.; Xie, X.; Wang, Z.; Lin, H.; Liu, Y.; Xie, H.; Liu, X. Construction and Optimization of an Ecological Security Pattern Based on the MCR Model: A Case Study of the Minjiang River Basin in Eastern China. Int. J. Environ. Res. Public Health 2022, 19, 8370. [Google Scholar] [CrossRef] [PubMed]
- Kong, F.; Yin, H.; Nakagoshi, N.; Zong, Y. Urban green space network development for biodiversity conservation: Identification based on graph theory and gravity modeling. Landsc. Urban Plan. 2010, 95, 16–27. [Google Scholar] [CrossRef]
- Dilts, T.E.; Weisberg, P.J.; Leitner, P.; Matocq, M.D.; Inman, R.D.; Nussear, K.E.; Esque, T.C. Multiscale connectivity and graph theory highlight critical areas for conservation under climate change. Ecol. Appl. 2016, 26, 1223–1237. [Google Scholar] [CrossRef]
- McRae, B.H.; Hall, S.A.; Beier, P.; Theobald, D.M. Where to Restore Ecological Connectivity? Detecting Barriers and Quantifying Restoration Benefits. PLoS ONE 2012, 7, e52604. [Google Scholar] [CrossRef]
- Wirth, P.; Chang, J.; Syrbe, R.-U.; Wende, W.; Hu, T. Green infrastructure: A planning concept for the urban transformation of former coal-mining cities. Int. J. Coal Sci. Technol. 2018, 5, 78–91. [Google Scholar] [CrossRef]
- Luo, P.; Miao, Y.; Chang, J. The “Classification-Strategies” method for the eco-transition of “mine-city” system-taking Xuzhou city as an example. J. Urban Manag. 2020, 9, 360–371. [Google Scholar] [CrossRef]
- Chang, J.; Zhang, H.; Ji, M.; Chen, X.-L. Case study on the redevelopment of industrial wasteland in resource-exhausted mining area. Procedia Earth Planet. Sci. 2009, 1, 1140–1146. [Google Scholar] [CrossRef]
- Li, X.F.; Wang, J.M.; Wu, K.N. Restoration of Water System in Coalmine Subsided Area with Higher Level of Underground Water—Taking Jiawang Mining Area of Xuzhou as an Example in China. Adv. Mater. Res. 2012, 518–523, 4227–4232. [Google Scholar] [CrossRef]
- Chen, W.; Li, W.; Yang, Z.; Wang, Q. Analysis of mining-induced variation of the water table and potential benefits for ecological vegetation: A case study of Jinjitan coal mine in Yushenfu mining area, China. Hydrogeol. J. 2021, 29, 1629–1645. [Google Scholar] [CrossRef]
- Huang, X.; Wang, H.; Shan, L.; Xiao, F. Constructing and optimizing urban ecological network in the context of rapid urbanization for improving landscape connectivity. Ecol. Indic. 2021, 132, 108319. [Google Scholar] [CrossRef]
- Lyu, X.; Li, X.; Wang, K.; Cao, W.; Gong, J.; Wang, H.; Lou, A. Linking regional sustainable development goals with ecosystem services to identify ecological security patterns. Land Degrad. Dev. 2022, 33, 3841–3854. [Google Scholar] [CrossRef]
- Dou, H.; Li, X.; Li, S.; Dang, D.; Li, X.; Lyu, X.; Li, M.; Liu, S. Mapping ecosystem services bundles for analyzing spatial trade-offs in inner Mongolia, China. J. Clean. Prod. 2020, 256, 120444. [Google Scholar] [CrossRef]
- Xu, W.; Wang, J.; Zhang, M.; Li, S. Construction of landscape ecological network based on landscape ecological risk assessment in a large-scale opencast coal mine area. J. Clean. Prod. 2021, 286, 125523. [Google Scholar] [CrossRef]
- Liang, Y.-X.; Wu, D.-F.; Wu, Z.-J.; Xu, Y.; Zhu, Z.-W.; Zhang, Y.-C.; Zhu, H. Construction of Ecological Corridors in Karst Areas Based on Ecological Sensitivity and Ecological Service Value. Land 2023, 12, 1177. [Google Scholar] [CrossRef]
- Chi, Y.; Zhang, Z.; Gao, J.; Xie, Z.; Zhao, M.; Wang, E. Evaluating landscape ecological sensitivity of an estuarine island based on landscape pattern across temporal and spatial scales. Ecol. Indic. 2019, 101, 221–237. [Google Scholar] [CrossRef]
- Yang, X.; Dai, X.; Li, W.; Lu, H.; Liu, C.; Li, N.; Yang, Z.; He, Y.; Li, W.; Fu, X.; et al. Socio-Ecological Vulnerability in Aba Prefecture, Western Sichuan Plateau: Evaluation, Driving Forces and Scenario Simulation. ISPRS Int. J. Geo-Inf. 2022, 11, 524. [Google Scholar] [CrossRef]
- Sahraoui, Y.; De Godoy Leski, C.; Benot, M.-L.; Revers, F.; Salles, D.; van Halder, I.; Barneix, M.; Carassou, L. Integrating ecological networks modelling in a participatory approach for assessing impacts of planning scenarios on landscape connectivity. Landsc. Urban Plan. 2021, 209, 104039. [Google Scholar] [CrossRef]
- Hu, C.; Wang, Z.; Huang, G.; Ding, Y. Construction, Evaluation, and Optimization of a Regional Ecological Security Pattern Based on MSPA–Circuit Theory Approach. Int. J. Environ. Res. Public Health 2022, 19, 16184. [Google Scholar] [PubMed]
- Shi, F.; Liu, S.; An, Y.; Sun, Y.; Zhao, S.; Liu, Y.; Li, M. Spatio-Temporal Dynamics of Landscape Connectivity and Ecological Network Construction in Long Yangxia Basin at the Upper Yellow River. Land 2020, 9, 265. [Google Scholar] [CrossRef]
- Hu, C.; Wang, Z.; Wang, Y.; Sun, D.; Zhang, J. Combining MSPA-MCR Model to Evaluate the Ecological Network in Wuhan, China. Land 2022, 11, 213. [Google Scholar] [CrossRef]
- Mcrae, B.H.; Dickson, B.G.; Keitt, T.H.; Shah, V.B. Using circuit theory to model connectivity in ecology, evolution, and conservation. Ecology 2008, 89, 2712–2724. [Google Scholar] [CrossRef]
- Ye, H.; Yang, Z.; Xu, X. Ecological Corridors Analysis Based on MSPA and MCR Model—A Case Study of the Tomur World Natural Heritage Region. Sustainability 2020, 12, 959. [Google Scholar] [CrossRef]
- Huang, J.; Hu, Y.; Zheng, F. Research on recognition and protection of ecological security patterns based on circuit theory: A case study of Jinan City. Environ. Sci. Pollut. Res. 2020, 27, 12414–12427. [Google Scholar] [CrossRef]
- Tang, F.; Zhou, X.; Wang, L.; Zhang, Y.; Fu, M.; Zhang, P. Linking Ecosystem Service and MSPA to Construct Landscape Ecological Network of the Huaiyang Section of the Grand Canal. Land 2021, 10, 919. [Google Scholar] [CrossRef]


| Type of Evaluation | Formula | Variable Description | |
|---|---|---|---|
| Ecosystem services importance | Water yield | is the water yield of raster in land use type ; is the annual average precipitation of raster ; and is the evapotranspiration of raster in land use type . | |
| Carbon sequestration | is the total carbon stock; is the aboveground carbon stock; is the soil carbon stock; is the dead carbon stock; and is the belowground carbon stock. | ||
| Soil conservation | is the amount of soil conservation (t/hm2·a); is the rainfall erosivity factor; is the soil erodibility factor; is the slope length factor; is the slope gradient factor; is the vegetation cover factor; and is the soil conservation measures factor. | ||
| Habitat quality | is the habitat quality of raster in land use type ; is the habitat suitability of land use type ; is the total habitat threat level of raster in land use type ; is the half-saturation constant, which is often regarded as 0.5; and is the normalization constant (). | ||
| Ecological sensitivity | Multifactor integrated evaluation | is the ecological sensitivity comprehensive evaluation score; is the ecological sensitivity index of the ith factor; and is the impact weight of the ith factor. | |
| Soil erosion | is the erosion sensitivity; is the rainfall erosivity factor; is the soil erodibility factor; is the topographic relief factor; and is the vegetation cover factor. | ||
| Landscape stability | Landscape fragility | refers to the degree of landscape pattern fragmentation; refers to the total number of landscape patches; and refers to the total landscape area (m2). | |
| Landscape connectivity | demonstrates the importance of plaques, and the possible connectivity index of a particular patch is demonstrated by . represents the possible connectivity index after removing the patch. The distance threshold was set to 1000 m, and the probability of connectivity was set to 1 | ||
| Evaluation Factors | Grades of Ecological Sensitivity | Weight | |||||
|---|---|---|---|---|---|---|---|
| Low | Relatively Low | General | Relatively High | Extremely High | |||
| 1 | 2 | 3 | 4 | 5 | |||
| Geomorphological factors | NDVI | >0.6 | 0.45–0.6 | 0.3–0.45 | 0.15–0.3 | 0–0.15 | 0.26 |
| Elevation (m) | <70 | 70–140 | 140–210 | 210–280 | >280 | 0.04 | |
| Slope (°) | 0–6 | 6–12 | 12–18 | 18–24 | >24 | 0.07 | |
| Distance from subsidence area (m) | >7000 | 5000–7000 | 3000–5000 | 1000–3000 | <1000 | 0.2 | |
| Distance from residential area (m) | >800 | 600–800 | 400–600 | 200–400 | <200 | 0.1 | |
| Hydrological factors | Soil erosion | Low erosion | Relatively erosion | General erosion | Relatively high erosion | High erosion | 0.18 |
| Distance from waterbody (m) | >3000 | 1500–3000 | 1000–1500 | 500–1000 | <500 | 0.15 | |
| Correct Indexes | Formula | Variable Description |
|---|---|---|
| Minimum cumulative model | is the positive correlation between the cumulative resistance value and the flow of ecological factors; min represents the minimum cumulative resistance; is the spatial distance between spatial landscape unit and ecological source ; and is the resistance coefficient of landscape element to the motion diffusion of a target element. | |
| Degree of ecological sensitivity | is the ecological resistance coefficient of grid corrected on the basis of ecological sensitivity; is the ecological sensitivity of grid ; is the average ecological sensitivity of grid corresponding to land use type ; and is the basic resistance coefficient of grid corresponding to land use type. |
| Year | Low (km2) | Relatively Low (km2) | General (km2) | Relatively High (km2) | Extremely High (km2) |
|---|---|---|---|---|---|
| 2000 | 96.14 | 385.30 | 14.97 | 39.95 | 83.64 |
| 2010 | 107.93 | 359.79 | 36.10 | 68.83 | 47.35 |
| 2020 | 124.51 | 355.33 | 14.91k | 73.15 | 52.10 |
| Name of Township | Ecological Source Area in 2000/km2 | Ecological Source Area in 2010/km2 | Ecological Source Area in 2020/km2 |
|---|---|---|---|
| Qingshanquan Town | 21.96 | 21.77 | 19.62 |
| Daquan Street | 36.88 | 35.18 | 38.25 |
| Jiangzhuang Town | 18.67 | 18.55 | 19.33 |
| Biantang Town | 8.55 | 8.50 | 8.94 |
| Laokuang Street | 5.29 | 5.25 | 5.37 |
| Dawu Street | 12.28 | 10.33 | 12.25 |
| Tashan Town | 6.76 | 6.76 | 6.76 |
| Zizhuang Town | 6.48 | 6.38 | 6.53 |
| Pananhu Street | 6.72 | 3.46 | 8.20 |
| Total | 123.59 | 116.18 | 125.25 |
| Proportion of the study area/% | 19.93 | 18.74 | 20.20 |
| Year | Number of Corridors < 2 km | Number of Corridors of 2–5 km | Number of Corridors of >5 km | Total |
|---|---|---|---|---|
| 2000 | 23 | 28 | 2 | 53 |
| 2010 | 24 | 24 | 3 | 51 |
| 2020 | 23 | 24 | 2 | 49 |
| Year | Jiangzhuang Town/% | Qingshanquan Town/% | Pananhu Street/% | Laokuang Street/% | Daquan Street/% | Dawu Street/% | Zizhuang Town/% | Bian Tang Town/% |
|---|---|---|---|---|---|---|---|---|
| 2000 | 12.86% | 10.34% | 16.11% | 8.65% | 33.65% | 12.86% | 3.00% | 2.52% |
| 2010 | 14.97% | 14.80% | 6.02% | 0 | 49.91% | 8.09% | 4.82% | 1.38% |
| 2020 | 16.19% | 9.92% | 10.83% | 0 | 48.12% | 48.12% | 9.69% | 0 |
| Year | Jiangzhuang Town/% | Qingshanquan Town/% | Pananhu Street/% | Laokuang Street/% | Daquan Street/% | Dawu Street/% | Zizhuang Town/% | Bian Tang Town/% |
|---|---|---|---|---|---|---|---|---|
| 2000 | 10.01% | 9.11% | 11.54% | 5.14% | 19.12% | 31.38% | 9.29% | 4.24% |
| 2010 | 13.91% | 7.72% | 5.20% | 6.35% | 28.06% | 16.82% | 8.26% | 11.24% |
| 2020 | 8.98% | 5.67% | 11.57% | 10.00% | 26.61% | 22.60% | 6.14% | 8.43% |
| Rehabilitation Area | Land Use Status | Area/km2 | Main Distribution Position | Suggested Restoration Direction |
|---|---|---|---|---|
| Ecological source | Forest land | 80.66 | Jiangzhuang Town, Qingshanquan Town, Daquan Street, and Biantang Town | Protect ecological sources and control urban expansion |
| Grassland | 8.33 | Pananhu Street and Daquan Street | ||
| Waterbody | 23.17 | Pananhu Street, Dawu Street, Laokuang Street, Zizhuang Town, Tashan Town, and Biantang Town | ||
| Construction land | 4.30 | Daquan Street, Pananhu Street, Dawu Street, and Laokuang Street | ||
| Cropland | 8.79 | Daquan Street, Dawu Street, Tashan Town, and Pananhu Street | ||
| Ecological pinch point | Cropland | 6.44 | Jiangzhuang Town, Daquan Street, Qingshanquan Town, Pananhu Street, Dawu Street, and Zizhuang Town | Improve greening rate Protect forest lands and return farmland to forests |
| Forest land | 0.51 | Zizhuang Town, Daquan Street, and Qingshanquang Town | ||
| Waterbody | 0.77 | Pananhu Street and Dawu Street | ||
| Construction land | 0.79 | Zizhuang Town, Daquan Street, and Dawu Street | ||
| Grassland | 0.26 | Pananhu Street | ||
| Ecological obstacle point | Cropland | 7.69 | Zizhuang Town, Daquan Street, Dawu Street, Pananhu Street, Jiangzhuang Town, and Biantang Town | Return farmland to forests and lakes Comprehensive control of soil erosion |
| Forest land | 0.75 | Daquan Street and Biantang Town | ||
| Construction land | 3.54 | Laokuang Street, Dawu Street, and Zizhuang Town | ||
| Waterbody | 0.58 | Dawu Street and Pananhu Street | ||
| Grassland | 0.14 | Pananhu Street | ||
| Ecological fracture point | Railway | - | Qingshanquan Town, Laokuang Street, Biantang Townt, Jiangzhuang Town, and Dawu Street | Create wildlife walkways or place warning signs |
| Highway | - | Qingshanquan Town, Laokuang Street, Biantang Town, Jiangzhuang Town, and Dawu Street |
Disclaimer/Publisher’s Note: The statements, opinions and data contained in all publications are solely those of the individual author(s) and contributor(s) and not of MDPI and/or the editor(s). MDPI and/or the editor(s) disclaim responsibility for any injury to people or property resulting from any ideas, methods, instructions or products referred to in the content. |
© 2023 by the authors. Licensee MDPI, Basel, Switzerland. This article is an open access article distributed under the terms and conditions of the Creative Commons Attribution (CC BY) license (https://creativecommons.org/licenses/by/4.0/).
Share and Cite
Wang, F.; Tong, S.; Chu, Y.; Liu, T.; Ji, X. Spatio-Temporal Evolution of Key Areas of Territorial Ecological Restoration in Resource-Exhausted Cities: A Case Study of Jiawang District, China. Land 2023, 12, 1733. https://doi.org/10.3390/land12091733
Wang F, Tong S, Chu Y, Liu T, Ji X. Spatio-Temporal Evolution of Key Areas of Territorial Ecological Restoration in Resource-Exhausted Cities: A Case Study of Jiawang District, China. Land. 2023; 12(9):1733. https://doi.org/10.3390/land12091733
Chicago/Turabian StyleWang, Fengyu, Shuai Tong, Yun Chu, Tianlong Liu, and Xiang Ji. 2023. "Spatio-Temporal Evolution of Key Areas of Territorial Ecological Restoration in Resource-Exhausted Cities: A Case Study of Jiawang District, China" Land 12, no. 9: 1733. https://doi.org/10.3390/land12091733