Abstract
China has experienced rapid urbanization, causing dramatic changes to the patterns of urban and rural land use relationships. This paper analyzes the spatiotemporal characteristics of rural settlements in the middle reaches of the Yangtze River region (MRYRR) using remote sensing monitoring data from 1990 to 2020 and reveals the influencing factors of spatiotemporal changes. The research found that (1) the overall increase in the quantity of rural settlements in the MRYRR between 1990 and 2020 was 504.70 km2. The area of transfer of other land use types to rural settlement was 1382.57 km2, of which 78.55% came from arable land and 16.62% came from forests; the area of rural settlement transfer to other land use types was 867.24 km2, of which 66.27% was reclaimed as arable land and 8.48% was transferred into urban built-ups. Changes in different stages and regions are diversified. (2) The spatial layout of rural settlements showed no significant differences in the MRYRR between 1990 and 2020, with a cluster distribution of “five main nuclei and many secondary nuclei” and a spatial distribution of “gathering in the north and east, while scattered in the south and west”. (3) The level of fragmentation of rural settlements in the MRYRR has greatly decreased since 1990, with the average patch size expanding significantly. The patch complexity of rural settlements fluctuated moderately, but the connectivity between patches continued to increase, and their distribution became more clustered. (4) Social and economic factors, including rural electricity consumption, the output value of the primary industry, net income per rural resident, urbanization rate, and the effective irrigated area, most strongly impacted the changes in rural settlements in the MRYRR. The research can be utilized as a guide for reconstructing the pattern of rural land use to promote sustainable rural revitalization.
1. Introduction
Rural settlements are regarded as groups of gathering places that enable rural inhabitants to engage primarily in agricultural production, provide habitation for rural populations, and serve as development centers for rural communities [1]. The forms, features, and spatial patterns of rural settlements represent the local living and production characteristics of rural areas [2] and can be viewed as reflective of the economic and social changes [3] and interactions between human activities and the rural geographical environment [4]. Since the economic reform and opening-up policy, land use structures and patterns in China have undergone tremendous changes. Rural settlements, which are one of the major spatial carriers reflecting the relationship between human and urban–rural built-ups, have been greatly impacted by the dramatic process of industrialization and urbanization of the country [5,6]. Plenty of opportunities, including capital flows and advanced technologies, are brought to rural regions owing to the speeding development of society, causing rural residents to expand their housing spaces [7,8]. Conversely, accelerated urban expansion and rural outmigration have caused disappearances of many rural residential areas around metropolitan areas and towns, which are easily included in urban development [8,9]. Consequently, it is crucially important to reveal the evolving traits and identify the impact factors of rural settlement variations in different regions and scales to further understand the mechanism of rural settlement changes and provide substantial guidance to revitalize rural areas.
While discussions on land use changes have attracted widespread interest among global scholars [10,11,12,13], concerns about the changes in rural settlements and associated influencing factors were not given adequate attention until recent years [14,15,16,17,18,19]. Identifying the changes in residential places requires relatively rich data support, while rural areas with sparse populations were often thought to be lacking this data. Recently, the application of machine learning methods to explore the growth of rural settlements is considered promising [20,21], and the open remote sensing data platform has been widely used [22].
In addition to the applied research on quantitative methods, academics are more concerned with the process and socio-economic effects of changes in rural settlements. The dynamic evolution of rural residential land is closely linked to social development and economic growth. It reflects the living and productive activities and the spatial pattern of the population in vast swathes of countryside [23,24,25]. Accompanied by large-scale and wide-ranging urbanization in recent decades, issues about the evolution characteristics [18], driving forces [26,27], socio-economic and ecological effects [22,28], rural hollowing [29], abandoned arable land, and reverse urbanization [30] of rural settlements are gaining widespread attention. Some studies have reported that the size of rural settlements has undergone rapid expansion [31] or fluctuating changing patterns [15], while other scholars have found that the number of villages has declined significantly in recent years [32]. As the countryside developed, arable land was the main source for the expansion of rural settlements [33]. This dynamic process of settlement expansion towards high-quality and productive land occurs not only in China but also in advanced economies, causing soil depletion and desertification risk [34]. However, in the face of global environmental change and regional population decline, rural settlement abandonment is very likely to sweep the world [35]. These phenomena have shown that rural settlements are transforming in complicated and pluralistic ways in pace with the continuous growth of urban areas and urban population, leading to a series of rural diseases like rural hollowing [9,29] and an increasing amount of abandoned arable land [36], which have threatened the implementation of rural revitalization measures and the overall effective promotion of sustainable urbanization [37,38].
In recent years, many scholars have found that the distribution and evolution of rural settlements are largely influenced by a range of factors, including the natural environment and socio-economic conditions [14,15,17,39], and there is a significant regional disparity in the dominant factors [40,41]. With the continuous advancement of socio-economic conditions and technological progress, the constraining effect of natural conditions, for example, slope and water sources, on rural settlements has gradually diminished [17], while the influence of socio-economic factors has become more dynamic and diversified [42,43]. However, current studies have paid more attention to the impact of natural factors by establishing regression models, neglecting the potential influence of socio-economic indicators [44]. As the dynamic evolution of rural settlements has been widely known as a result of a combination of factors in the complex socio-economic transformation [7], this paper, therefore, will attempt a larger scale analysis. Though knowledge about the spatial patterns of rural settlements has been explored in provinces [45,46], metropolitan areas [39], and various urban agglomeration areas [47,48,49], systematic research on the changes of rural settlements in the three provinces located in the MRYRR remain scarce, and research on the influencing factors, especially from the aspect of socio-economic factors, are even more inadequate. The MRYRR is located in Central China with diverse landform types. It connects relatively developed regions in the east and underdeveloped regions in the west through the golden waterway and convenient transportation networks. The region is blessed with superior sunshine, water, and soil resources, and is an important part of the middle and lower reaches of the Yangtze River Plains, providing ample conditions for agricultural production. There are 13 main grain-producing regions in the country, and all three provinces in the MRYRR are among them. However, with rapid socio-economic development, this advantage may also be a disadvantage to some extent, as the vast rural areas are oriented towards agricultural production, and economic development is somewhat limited, driving the rural population to migrate to cities and towns. Undoubtedly, it cannot be ignored that the region has experienced vibrant economic development, exerting a profound influence on the evolving patterns of rural settlements in the area. Exploring the changing characteristics and the driving factors of rural settlements in this fast-transforming area is not only crucial for optimizing the regional urban–rural spatial patterns but also important in reflecting rural human–land relations and promoting the utilization and production capacity of valuable arable land resources in this region.
Combining large-scale, long-time, and multi-dimensional approaches to the study area, this study utilizes rural settlement dynamics, land-use transfer matrices, kernel density analysis, and landscape pattern indices to comprehensively reveal the pattern evolution of rural settlements in time and space in the MRYRR from 1990 to 2020 and analyze the factors that impact the spatiotemporal variations. The study will provide a clear and systematic picture of the evolution of rural settlements in the region and serve as a scientific basis for reconstructing the relationship between humans and land in rural space towards a new stage of rural revitalization.
2. Materials and Methods
2.1. Study Area
The MRYRR (108°21′–118°28′ E, 20°09′–33°20′ N) comprises the three provinces of Hubei, Hunan, and Jiangxi, including 42 cities; the total area is 564,700 km2. The geographical location is relatively favorable, with abundant arable land, water systems, and forest resources. The climate is mainly subtropical with monsoonal humidity. The topography of Hubei Province is roughly mountainous in the west, northeast, and southeast, with a low, flat center and an incomplete basin called Jianghan Plain opening slightly to the south. Hunan lies to the south of Dongting Lake, located in the transition zone from the Yunnan-Guizhou Plateau to the Jiangnan Hills and from the Nanling Mountains to the Jianghan Plain. Jiangxi Province is encompassed by mountains ranging on its eastern, western, and southern sides, while its central region features undulating hills, and the north features lake basins and plains. In recent years, with continuous urbanization and industrialization, this region has progressively assumed a pivotal role as a crucial nexus for facilitating the coordinated development of the upper, middle, and lower reaches of the Yangtze River Economic Belt in China. Additionally, it serves as a conduit for the synergistic advancement of the East and West. The location of the MRYRR is presented in Figure 1.
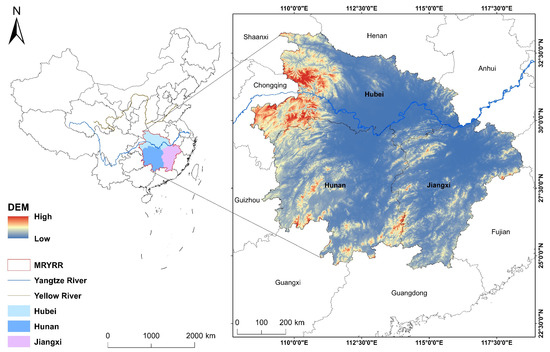
Figure 1.
Location map of the MRYRR.
2.2. Data Sources and Preconditioning
The data employed in this study included a land-use dataset, digital terrain data, and socio-economic data. The land-use dataset in the MRYRR is raster data with a resolution of 30 m derived from the Resource and Environment Science and Data Center (http://www.resdc.cn, accessed on 11 May 2023). It covers seven periods of time from 1990 to 2020, with an interval of five years between each period. Based on the total accuracy of 91.2% of the original 25 secondary land-use types, we reclassified the land use data into eight categories, including arable land, forests, grassland, water bodies, urban built-ups, rural settlements, other construction land, and unused land. The vector data of provincial and municipal administrative divisions were also acquired from the source mentioned above. The digital terrain data, also known as digital elevation model (DEM) data, with a spatial resolution of 30 m, were obtained from the Geospatial Data Cloud (http://www.gscloud.cn, accessed on 11 May 2023). The necessary socio-economic data were collected from the statistical yearbooks of the three provinces. To accurately characterize the locations of rural settlements, the road network data were sourced from the website of the Resource and Environment Science and Data Center.
2.3. Methods
2.3.1. Changes in Rural Settlements
We used a land-use transfer matrix and rural settlement dynamics [50] based on map overlay analysis to measure the changes in size and rate in the rural areas and compare the spatial variation of changes among the provinces and cities of the region. The land-use transfer matrix was applied to calculate the interconverted area between rural settlements and other land-use types. Rural settlement dynamics were used to show the changing rate of rural settlements during each interval. The functions are as follows:
Within the formula, R is the rural settlement’s changing rate in the region; S represents the area of rural settlement; t means a certain point of time; and T is the period from time t to t + 1.
In the formula above, i, j (i, j = 1, 2, …, n) are the eight different land utilization categories, such as arable land and forests, et al. Sij indicates the area of land converted from type i to type j.
2.3.2. Kernel Density Analysis
Kernel density, as a spatial statistical method used for analyzing the distribution of spatial data, enables robust visualization of spatial trends and concentration levels of the data. Calculating the density of elements within their surrounding neighborhoods reflects the distribution characteristics of point elements. The relevant equation is shown below:
In the preceding formula, the kernel function is represented as f(x); h is the distance between individual elements, where h > 0; x denotes the value of the sample data, and n refers to the number of relevant observations; (x − means the distance between the estimated point x and the observed point .
2.3.3. Morphology Characteristics Based on Landscape Pattern Index
Landscape pattern indices are a set of quantitative indicators that can capture the spatial characteristics of land cover types within a specific geographic area. In this paper, seven indicators were selected to describe the pattern evolution characteristics of rural settlements in the MRYRR from 1990–2020. The indices and their significance are shown in Table 1.

Table 1.
Landscape indices and ecological significance.
2.3.4. Geographic Detector
A geographic detector is a spatial statistical analysis model widely used for conducting exploratory analysis of spatial data. It is primarily applicable for evaluating the relationships between geographical phenomena and their associated driving factors. As an essential component of Geodetector, the factor detector calculates the impact of each factor on geographical phenomena, thereby identifying and evaluating the significant driving factors influencing the geographical phenomenon. Additionally, it can reveal the spatial heterogeneity among different regions. The relevant formulae are shown below:
In the formula above h = 1, 2, 3, …, L is the strata, or namely classifications, of the independent variable X; and N denote the unit numbers for classification h and the entire region, respectively; the variance of the dependent variable Y within classification h is represented by , while represents the variance of the dependent variable Y within the entire region; SSW (within sum of squares) and SST (total sum of squares) represents the sum of the variances of all classifications and the total variance within the region, respectively; q is utilized to quantify the spatial variability of geographic phenomena, thereby assessing the explanatory capacity of the independent variable on the dependent variable. Ranging from [0, 1], a higher q indicates a more significant explanatory influence of the independent variable X on the spatial distribution of the dependent variable Y.
The interaction detector is an effective method used to examine how the combined influence of two factors alters the dependent variable. In this study, the interaction detector is employed to analyze whether the explanatory effect on the area of rural settlements is strengthened or weakened when different influencing factors act together. Interactions are classified into the following five types: non-linear weakening, single-factor non-linear attenuation, two-factor enhancement, independent, and non-linear enhancement [51].
3. Results
3.1. Changes in the Amount of Rural Settlements
From 1990 to 2020, the rural settlement size exhibited an overall expansion of 504.70 km2. The area of rural settlements in each period is shown in Table 2.
Table 2.
The area of rural settlement during various periods from 1990 to 2020.
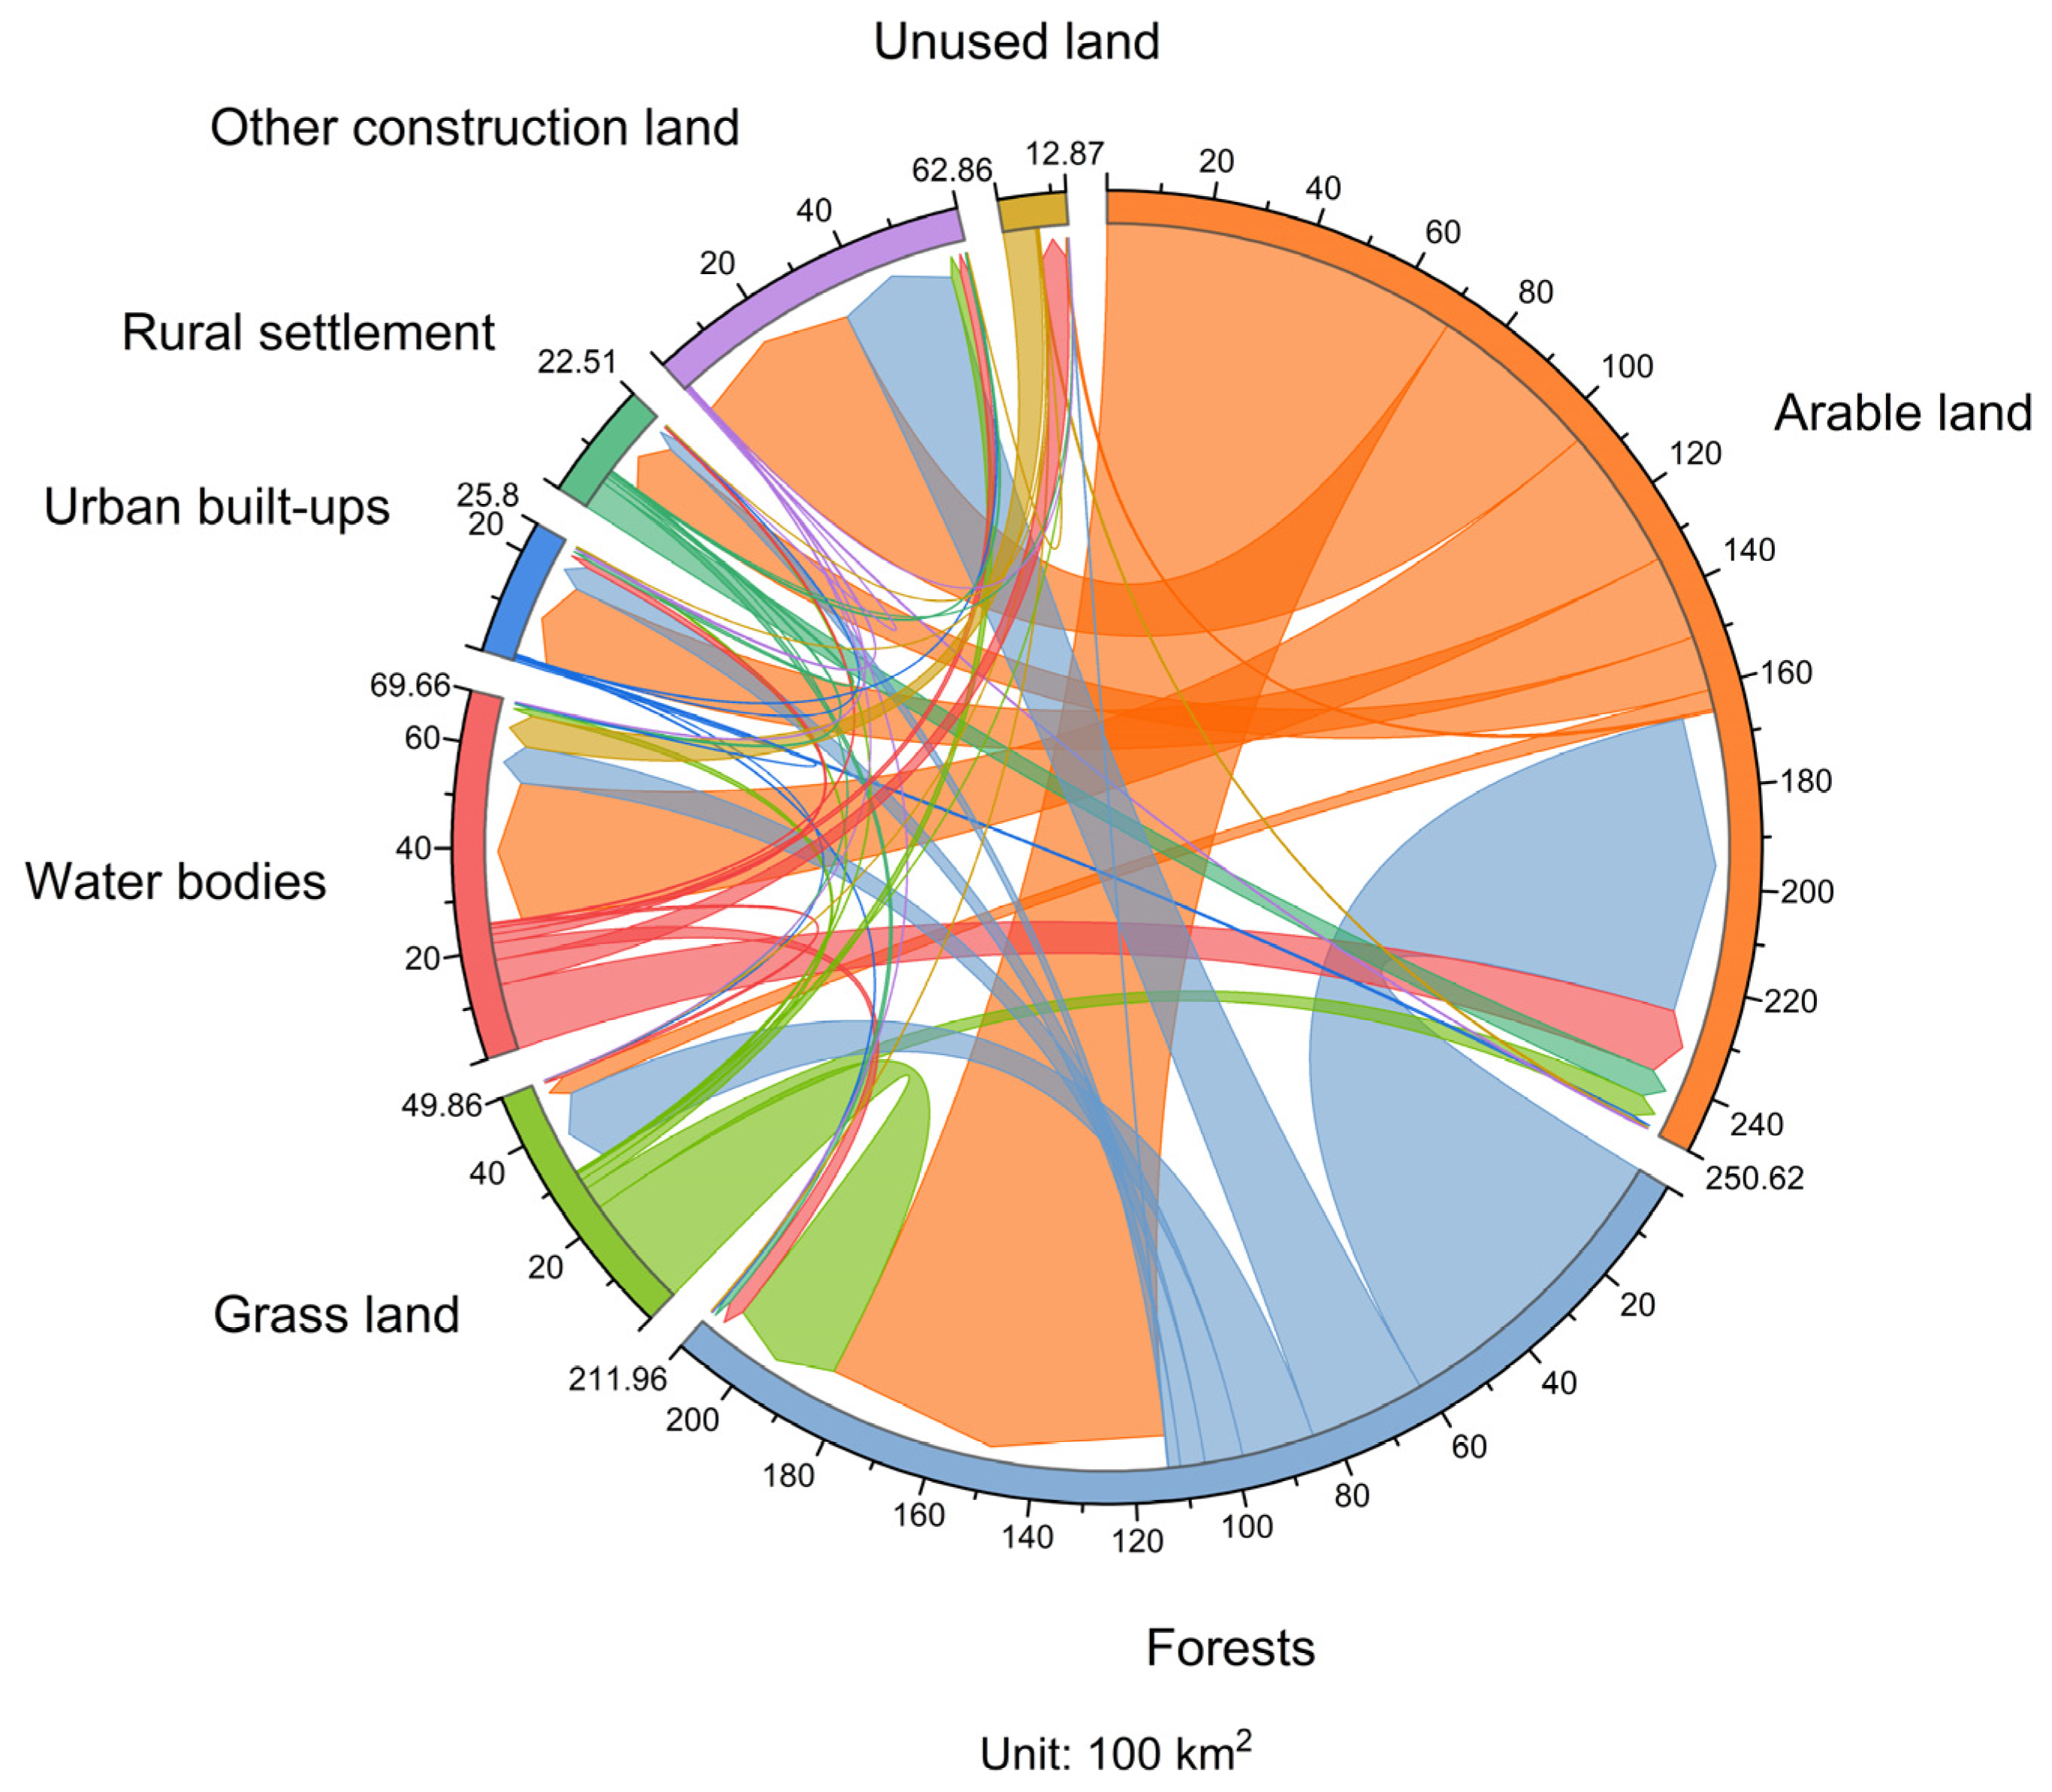
The two land use types with the largest areas occupied by rural settlements were arable land and forests (Table 3). A total of 1086.07 km2 of arable land and 229.75 km2 of forests were converted into rural settlements, accounting for 78.55% and 16.62% of the area of other land use types transfers to rural settlements, respectively. The sources of arable land are mainly located in the low-altitude plains, including southeastern Hubei Province, central and eastern Hunan Province, and northwestern Jiangxi Province. Meanwhile, the total area of rural settlement transfer to other land use types was 867.24 km2, with 66.27%, 14.62%, and 8.48% being converted into arable land, forests, and urban built-ups, respectively. The interconversions between the eight land use classifications are presented in Figure 2.
Table 3.
Area of changes between rural settlements and other land use types from 1990 to 2020.

Figure 2.
Land-use transfer matrix chord diagram in the MRYRR, 1990–2020.
The calculation results of rural settlement dynamics in the MRYRR revealed that between 1990 and 2020, rural settlements exhibited an overall growth trend. However, the rural settlements only experienced negative growth rates during the two periods of 1990–1995 and 2010–2015, with −0.077% and −0.109%, respectively. The overall size of rural settlements underwent a decrease during the aforementioned study periods, with the most significant decline of 41.94 km2 observed between 2010 and 2015. Apart from these two phases, rural settlements showed varying degrees of growth most of the time. Specifically, the most remarkable growth occurred during the period of 2000–2005, with a growth rate of 0.761%, resulting in an increase of 280.18 km2 in area. Although the growth during the period of 2005–2010 was the smallest, at only 76.33 km2, it still exceeded the largest decrease in rural settlement areas observed during the research period. Table 4 presents the dynamics of rural settlements in the MRYRR for each study period.
Table 4.
Changes and dynamics of rural settlements within the region between 1990 and 2020.
3.1.1. Changes at the Provincial Level
From the perspective of the area of other land use types transfer to rural settlement, Hubei Province had the largest expansion, followed by Jiangxi and Hunan, reaching 521.08 km2, 514.33 km2, and 347.16 km2, respectively. As for the area of rural settlement transfer to other land use types, the differences among the three provinces narrowed, with the sizes being 305.90 km2 in Hubei Province, 298.90 km2 in Hunan Province, and 262.44 km2 in Jiangxi Province, respectively.
From 1990–2020, the dynamics of rural settlements in the three provinces were ranked as follows: Jiangxi Province > Hubei Province > Hunan Province > 0, indicating that the most dramatic expansion was observed in Jiangxi Province, followed by Hubei Province, and finally Hunan Province. From various research periods, a remarkable upswing in the number of rural settlements emerged during 2000–2005 across all three provinces. Notably, this was the sole five-year period in which all three provinces experienced a net growth in rural settlements. For the other five-year periods, increases and decreases were both recorded in different provinces. Table 5 presents the dynamics of rural settlement in the three provinces during each study period.
Table 5.
Dynamics of provincial rural settlement areas from 1990 to 2020.
3.1.2. Changes at the Municipal Level
Overall, 41 of the 42 cities in the MRYRR showed an increase in rural settlement area from 1990 to 2020 except Xiangxi Tujia and Miao Autonomous Prefecture (Figure 3g). The most dramatic growth was observed in the Hubei Province’s west and Jiangxi Province, respectively, including Shennongjia Forest Region, Pingxiang, as well as Enshi Tujia and Miao Autonomous Prefecture, with increases of 2.68%, 1.88%, and 1.36%, followed by other seven municipalities with a range of rural settlement dynamics between 0.35% and 0.58%. Most other regions experienced smaller expansion at varying degrees during the time.
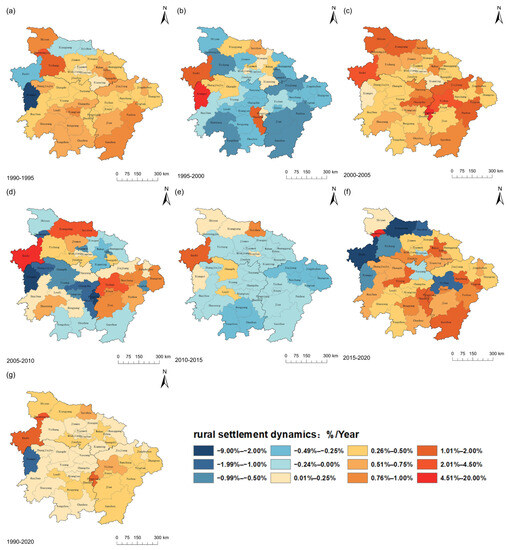
Figure 3.
Spatial and temporal differences in rural settlement dynamics by municipality in the MRYRR, 1990–2020. (a) Rural settlement dynamics in 1990–1995. (b) Rural settlement dynamics in 1995–2000. (c) Rural settlement dynamics in 2000–2005. (d) Rural settlement dynamics in 2005–2010. (e) Rural settlement dynamics in 2010–2015. (f) Rural settlement dynamics in 2015–2020. (g) Rural settlement dynamics in 1990–2020.
From 1990 to 1995, the distribution of rural settlement dynamics was relatively balanced, but the most drastic reduction was observed in Xiangxi in Hunan Province, with a rural settlement dynamic of −8.87%. From 1995 to 2000, spatial variations became greater. Among the 42 cities in the MRYRR, only 13 cities experienced a growth in the expanse of rural settlements, with the most dramatic growth in Xiangxi at 16.43%. Additionally, Zhuzhou in Hunan Province and Enshi in Hubei Province had increases of 1.34% and 1.08%, respectively. From 2000 to 2005, the area of rural settlements in all municipalities showed an increasing trend, with the most dramatic increase of 19.74% occurring in Pingxiang in Jiangxi Province. In addition, Enshi in Hubei Province and Yichun in Jiangxi Province had increases of 4.34% and 2.47%, respectively. Although all the 42 regions experienced growth in areas during this five-year period, the number of cities with low growth rates (0.02–0.5%) increased to 22, and the regions with high growth rates include only the three cities mentioned above. From 2005–2010, the most dramatic increase occurred mainly in the southwest and northwest of Hubei Province, including Enshi, Xiangyang, Suizhou, and Yichun in Jiangxi Province. In contrast, the size of rural settlements in Xiangxi and Pingxiang experienced the most drastic reduction. The five years from 2010–2015 were the period with the smallest changes in rural settlement dynamics and the most balanced spatial variations among cities, ranging from −0.44% to 1.26%. Only eight cities concentrated in Hubei and Hunan Provinces observed small growth in the scale of rural settlements, while the other 34 municipalities experienced slight shrinkage. The overall distribution of rural settlement dynamics in the MRYRR from 2015 to 2020 was diametrically opposed to that of the previous five years, with only eight cities having negative values, meaning a decrease in rural settlement areas and all other cities seeing a general increase.
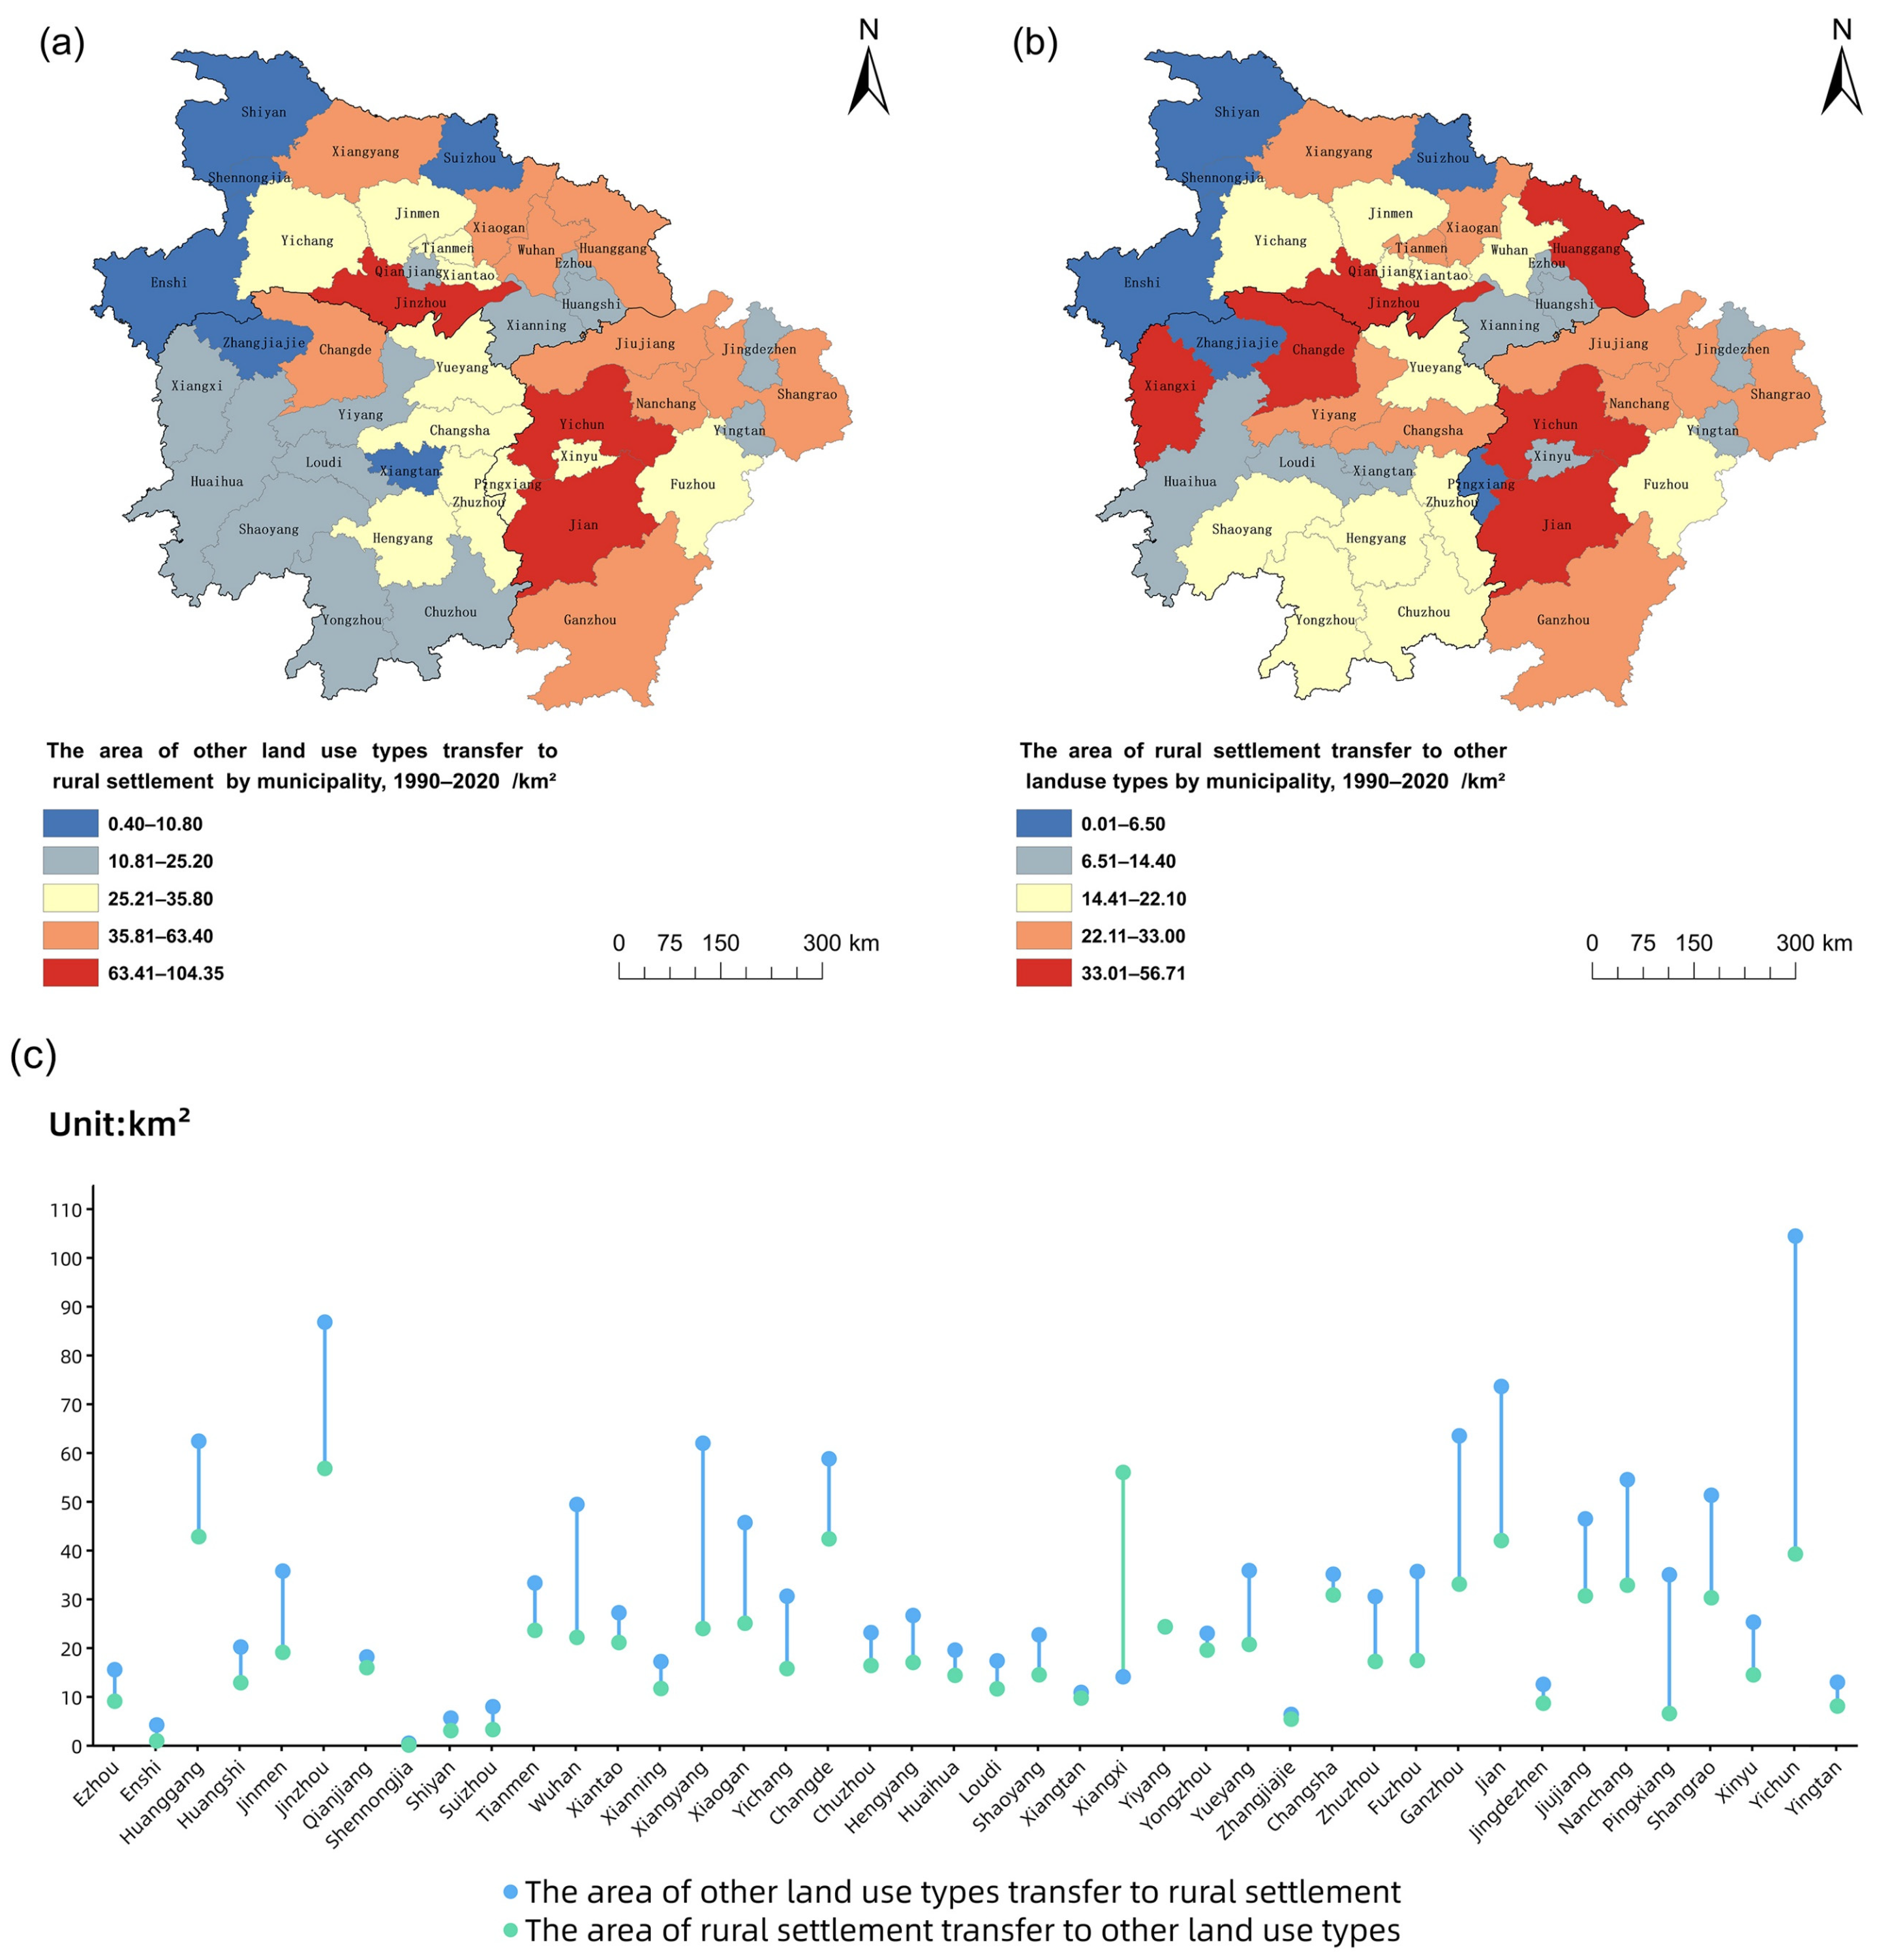
Spatially, Yichun experienced the largest net growth of 65.18 km2 (Figure 4), and it also had the largest area of other land use types transfer to rural settlement at 104.35 km2, which constituted 7.57% of the total area of other land use types transfer to rural settlement. Following Yichun were Jingzhou, Ji’an, and Ganzhou, with an area of 86.71 km2, 73.52 km2, and 63.40 km2, respectively. Jingzhou had the most significant area of rural settlement transfer to other land use types, covering 56.71 km2, which represented 6.54% of the overall area of rural settlement transfer to other land use types; closely Following are Xiangxi, Huanggang, and Changde, with areas of 55.90 km2, 42.72 km2, and 42.27 km2, respectively. The spatiotemporal distribution of the transformation of rural settlements and other land use types in cities in the MRYRR is detailed in Figure 4.
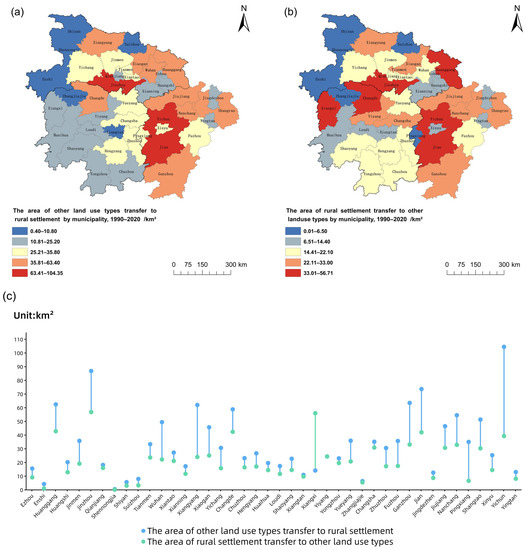
Figure 4.
The interconverted area between rural settlements and other land-use types by municipality, 1990–2020. (a) The area of other land use types transfer to rural settlement by municipality, 1990–2020. (b) The area of rural settlement transfer to other land use types by municipality, 1990–2020. (c) The quantitative relationship of the interconverted area between rural settlements and other land-use types by municipality from 1990 to 2020.
In addition to analyzing the scale of rural settlement transfers, this study also examined the proportional relationship between the area of rural settlements transferred and the initial area during the period 1990–2020, to capture the differences in the evolution of rural settlement scale by municipality more comprehensively. Although the transfer of other land use types to rural settlements in the Shennongjia Forestry District was only 0.396 km2 during the study period, the scale was equivalent to 81.03% of its rural settlement area in 1990. In addition, Pingxiang, Enshi, and Nanchang all had high percentages of the area of other land use types transfer to rural settlement, at 68.53%, 53.12%, and 33.29%, respectively, while Qianjiang had the lowest percentage, with only 9.99%. The percentage of the area transfer to other land use types in Xiangxi was the highest at 53.78%, followed by Changsha, Zhangjiajie, and Nanchang with 24.52%, 21.24%, and 20.39%, respectively, while Shennongjia Forestry District had the lowest proportion of the area of rural settlement transfer to other land use types, with only 2.95% (Figure 5).
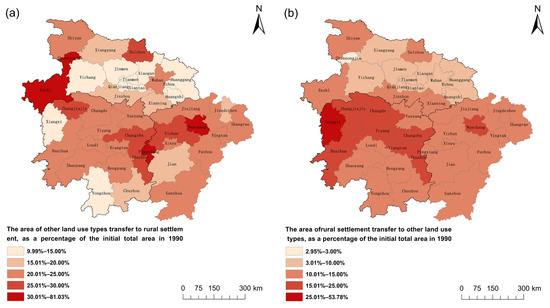
Figure 5.
The interconverted area between rural settlements and other land-use types as a percentage of the initial total area in 1990. (a) The area of other land use types transfer to rural settlement as a percentage of the initial total area in 1990. (b) The area of rural settlement transfer to other land use types as a percentage of the initial total area in 1990.
3.2. Density Analysis of Rural Settlements
The spatial layout of rural settlements in the MRYRR exhibited a cluster distribution characterized by “five main nuclei and many secondary nuclei”, along with a spatial distribution pattern of “gathering in the north and east, while scattered in the south and west” without significant changes during the time (Figure 6). The five main nuclei of the rural settlements were concentrated in the Jianghan Plain, involving the central part of Jingzhou, Tianmen, southern Xiaogan, northeastern Wuhan, and northwestern Huangshi. Each main nucleus radiated outward from its center, with a corresponding decrease in kernel density values. The multiple secondary nuclei spread progressively outward around each main nucleus, exhibiting a contiguous distribution. During the study period, 13 high-density points were identified, which were also primarily distributed in the Jianghan Plain, involving eight cities such as Changde, Jingzhou, Tianmen, Xiaogan, Wuhan, Huanggang, Ezhou, and Huangshi, as well as in the central part of Jiangxi Province, involving Ji’an, Pingxiang, Xinyu, Yichun, and Nanchang. The low-density areas were more extensively dispersed across the western and southern parts of the MRYRR, mainly in mountainous and hilly areas such as Shennongjia Forestry District, Enshi, and Shiyan.
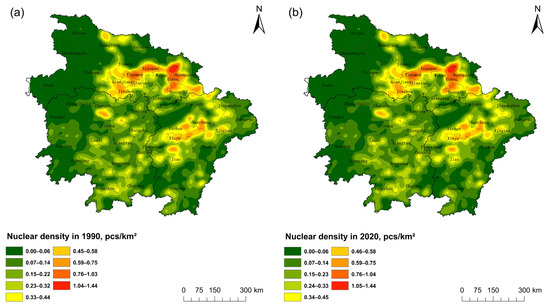
Figure 6.
Distribution of nuclear density of rural settlements in the MRYRR, 1990–2020. (a) The nuclear density of rural settlements in the MRYRR, 1990. (b) The nuclear density of rural settlements in the MRYRR, 2020.
Compared with the clustering distribution characteristics of rural settlements in 1990, only slight variations were observed in the MRYRR by the end of the study period. Rural settlements in Yiyang, Loudi, and Xiangtan were more aggregated and continuous, while the aggregation level of rural settlements in Jiujiang was reduced.
3.3. Analysis of Landscape Patterns in Rural Settlements
This study utilized seven landscape pattern indices to investigate the evolution characteristics of rural settlement patterns in the region from 1990 to 2020 [52]. Considering the memory capacity of the software of Fragstats 4.2, the image element size of the original raster data was resampled from 30 m × 30 m to 50 m × 50 m, to meet the requirements of the software for normal operation.
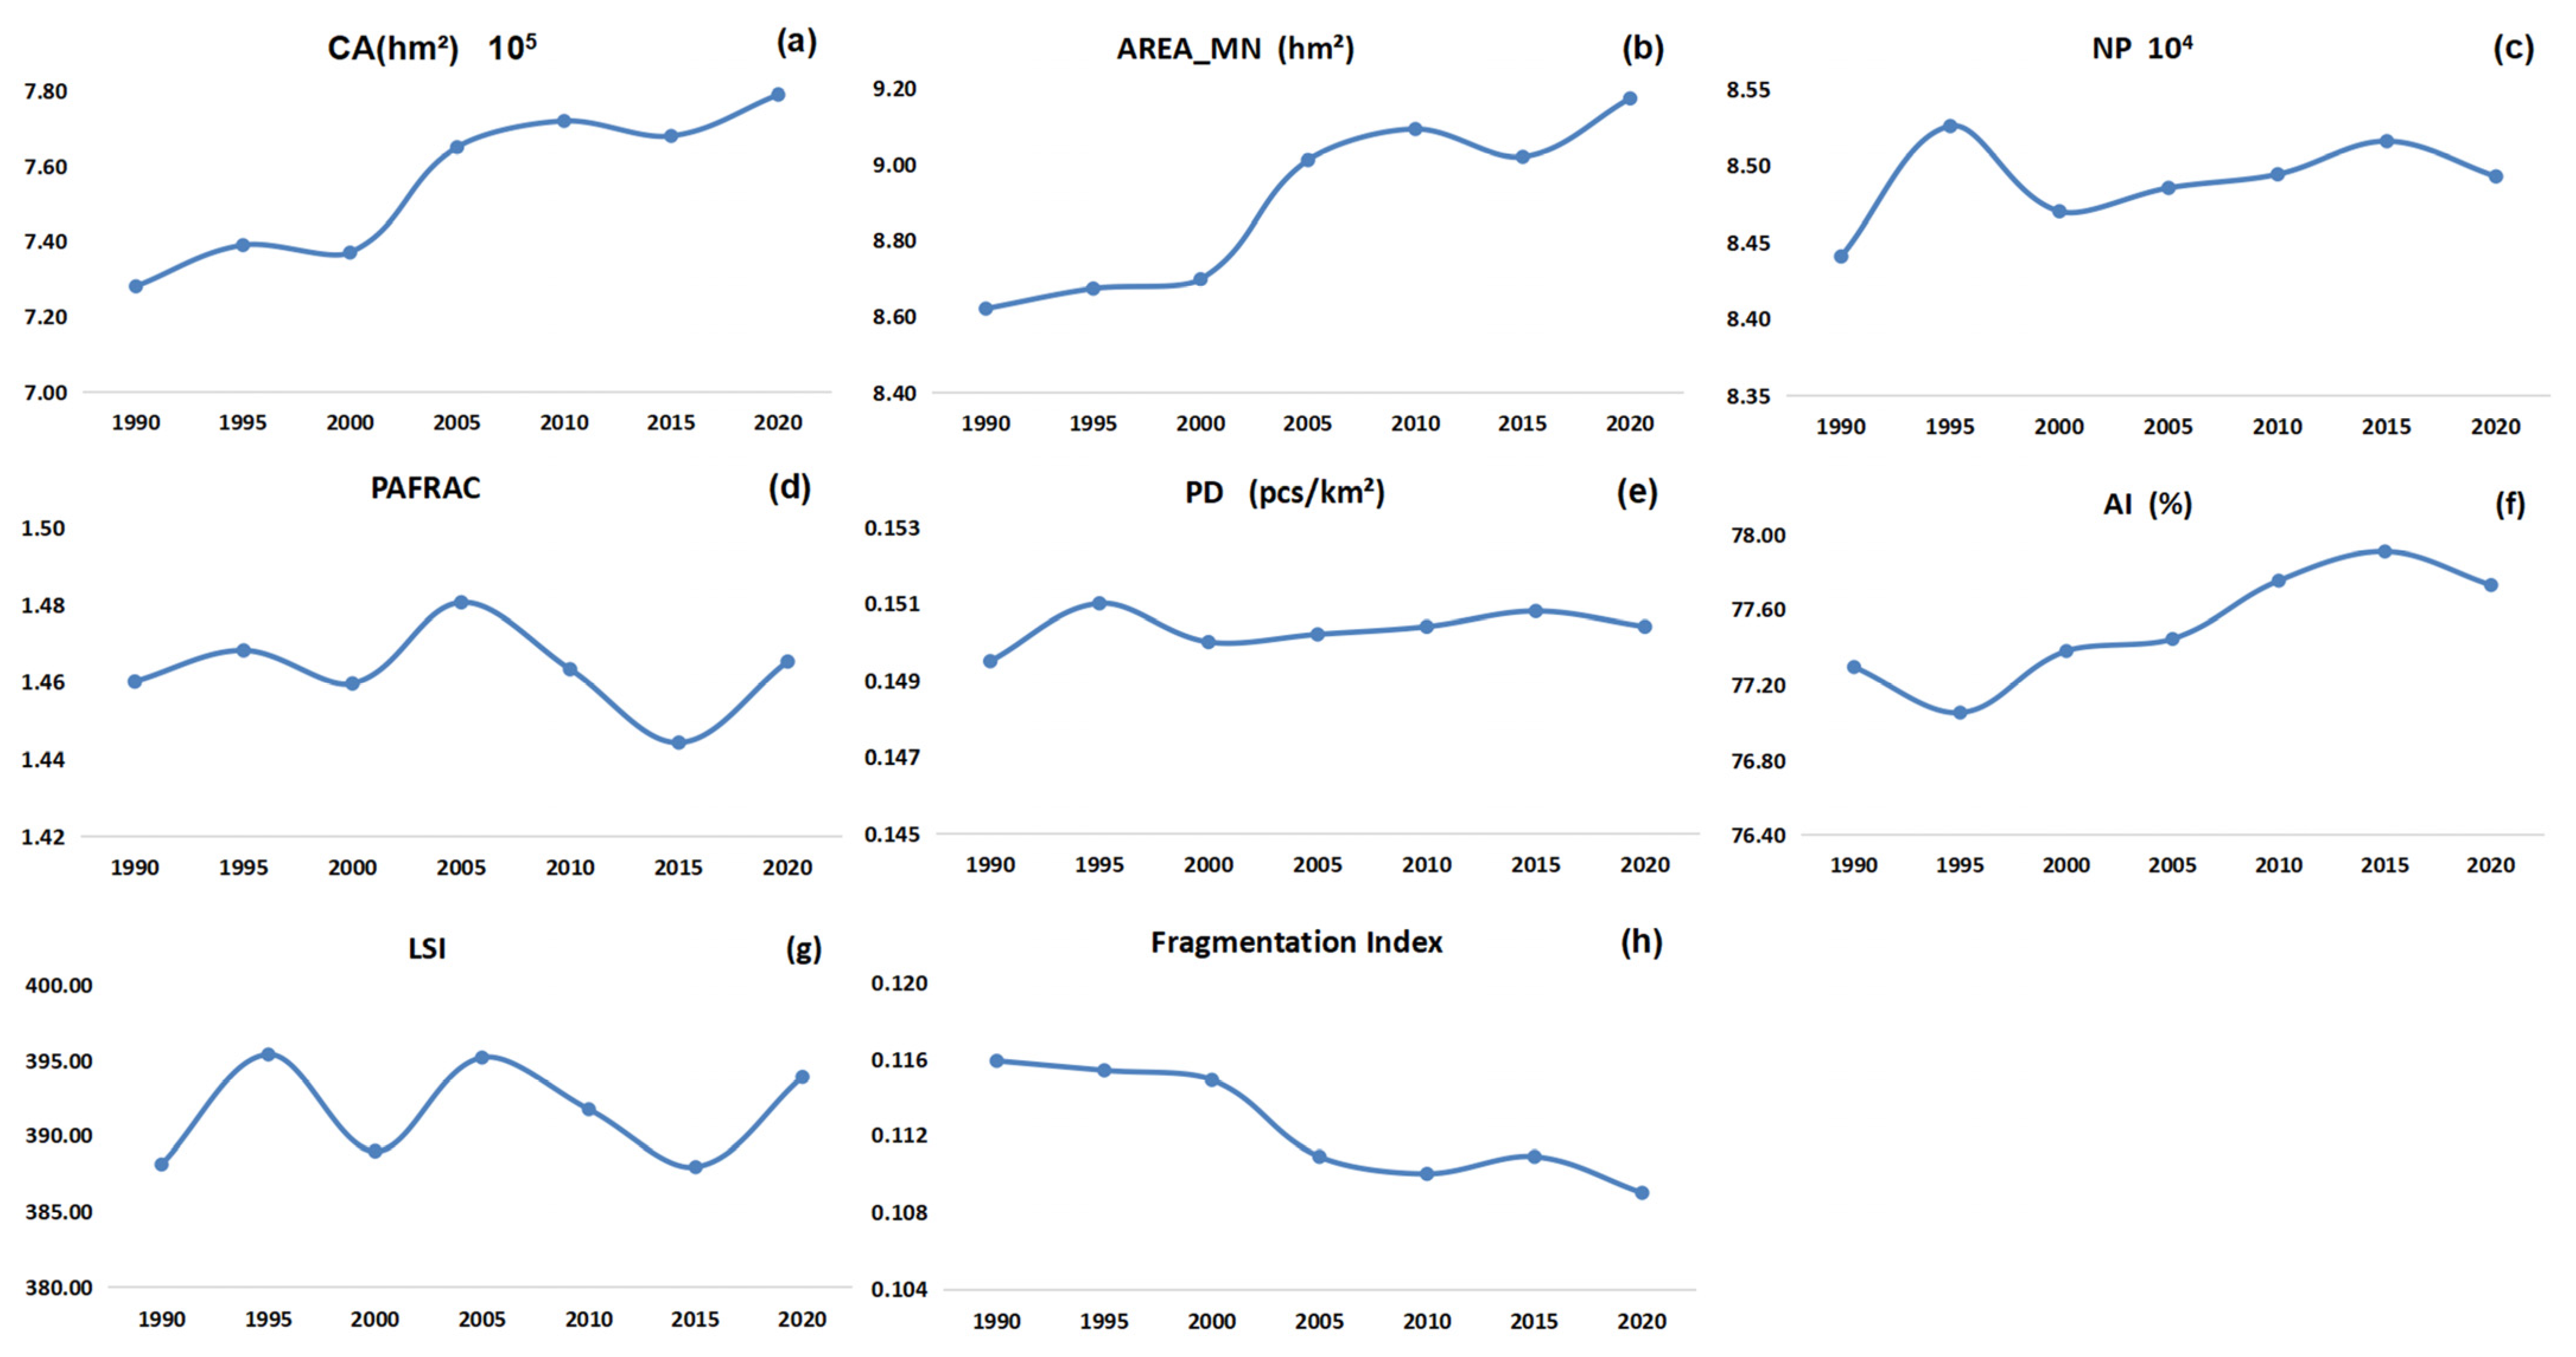
From 1990 to 2020, the class area (CA) and average patch area (AREA_MN) were both generally on the rise with synchronous fluctuation in 2015, indicating that the overall size and average patch size of rural settlements expanded significantly. The average patch area increased from 8.62 hm2 in 1990 to 9.17 hm2 in 2020. As for the spatial distribution, the number of patches (NP) first increased during 1990–1995, then fluctuated during 1995–2020, with the highest and second-highest points at 85,257 in 1995 and 85,158 in 2015, respectively. The patch density (PD) showed the same trend as NP, with the values remaining stable around 0.149 to 0.151 per square kilometer. In terms of patch shape, the landscape shape index (LSI) fluctuated between 388–396, and the perimeter area fractional dimension (PAFRAC) had almost the same waving evolution trend, with a maximum value of 1.48 in 2005 and a minimal value of 1.44 in 2015. Compared with the year 1990, both indicators were higher in 2020, indicating that the shape of rural settlement patches has become more complex. From the graph of the fragmentation index (Figure 7h), it is apparent that the landscape fragmentation of rural settlements in the MRYRR has greatly decreased since 1990, with the value of 0.116 in 1990 lowering to 0.109 in 2020, only with a slight fluctuation in 2015. Accordingly, the aggregation index (AI) was on an overall increasing trend, which increased from 77.05% of the minimum in 1995 to 77.91% of the maximum in 2015 and then slightly decreased to 77.73% in 2020, showing the distribution of rural settlements became more clustered.
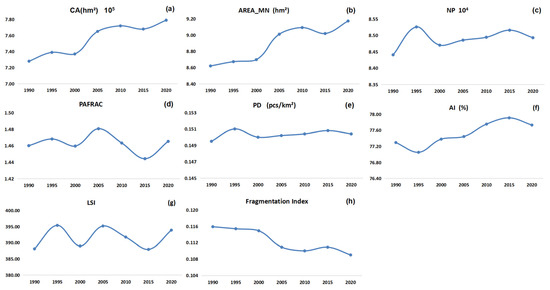
Figure 7.
Landscape pattern trends of rural settlements in the MRYRR, 1990 to 2020. (a) Changes in CA between 1990 and 2020. (b) Changes in AREA_MN between 1990 and 2020. (c) Changes in NP between 1990 and 2020. (d) Changes in PAFRAC between 1990 and 2020. (e) Changes in PD between 1990 and 2020. (f) Changes in AI between 1990 and 2020. (g) Changes in LSI between 1990 and 2020. (h) Changes in the Fragmentation Index between 1990 and 2020.
3.4. Analysis of Driving Factors of Rural Settlements
3.4.1. Selection of Factors
The socio-economic development in the MRYRR had shown a positive trend, exerting a profound impact on the evolution of rural settlement patterns in this area. Furthermore, given the distinctive natural environmental characteristics of the MRYRR, it is still necessary to incorporate natural factors into the analysis. Considering this region has well-developed water systems and small differences in the distance of rural settlements from rivers, so the “distance to water systems” is not included in the indicator system. Therefore, a total of 13 indicators were selected and categorized into two aspects: natural factors [53] and socio-economic factors [54]. These factors were utilized to explore and analyze the influencing elements behind the evolution of rural settlement sizes in the years 2000, 2010, and 2020. The factors were labeled as the independent variable “X” and the area of rural settlements were labeled as the dependent variable “Y”, to explore the impact of different factors on rural settlement area (Table 6).
Table 6.
Description of selected factors.
3.4.2. Analysis of Factor Detector Results
The test results showed that the 13 selected driving factors were all significant at the 5% level, indicating that the factors can explain the changes in rural settlements. Factors exhibiting q-values above 0.5 are considered core factors with strong influence [51,55]. It was found that the core factors for the three periods were generally similar. The findings indicated that over the period 2000–2020, rural electricity consumption, output value of primary industry, net income per rural resident, urbanization rate, and effective irrigated area have strong explanatory impacts on the rural settlement area. However, the explanatory effects of natural factors such as distance from road networks, elevation, and slope are relatively weak. The q-values of the driving factors in each period are shown in Figure 8.
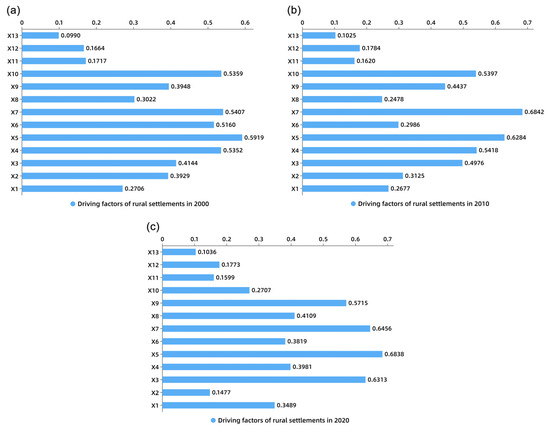
Figure 8.
Chart of driving factors in 2000, 2010, and 2020. (a) The q-values for driving factors in 2000. (b) The q-values for driving factors in 2010. (c) The q-values for driving factors in 2020.
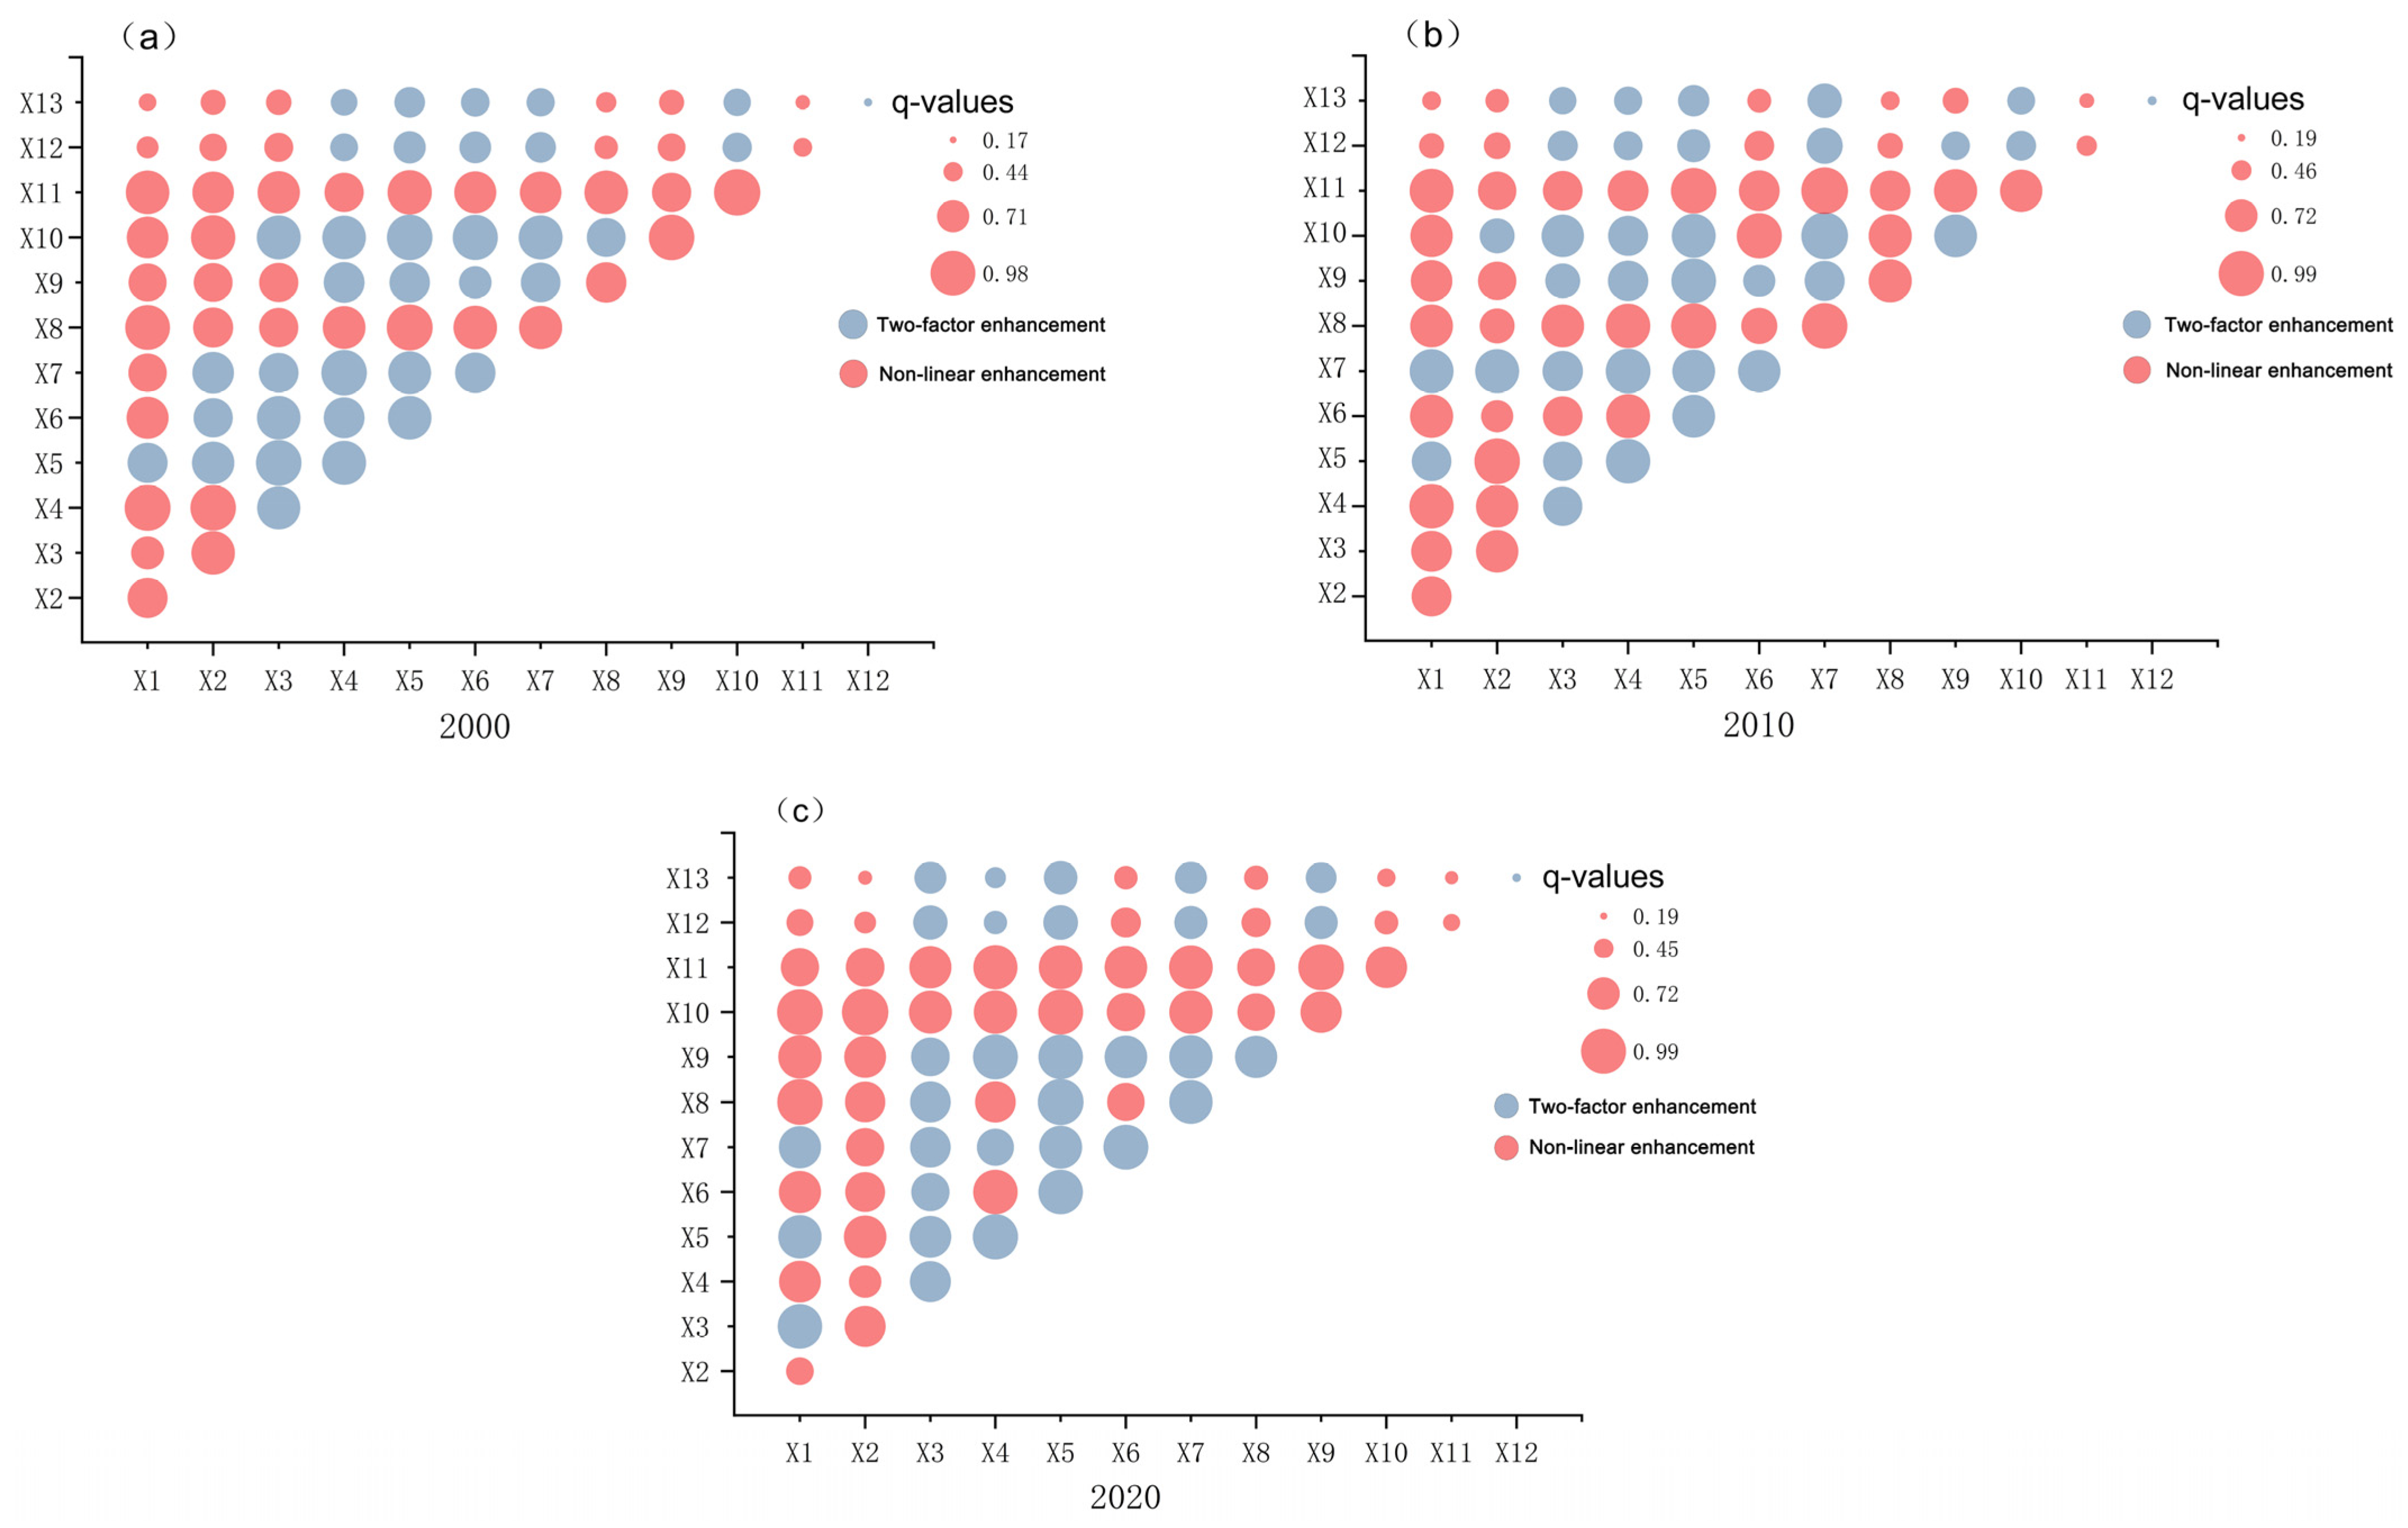
3.4.3. Analysis of Interaction Detector Results
There were 91 sets of interaction results among the 13 selected factors. The results of all factor interactions showed enhancement effects with significantly improved q-values compared to the effects of each individual factor (Figure 9). Elevation (X12), distance from the road networks (X11), and slope (X13) in 2000 and 2010 had lower explanatory power for the area of rural settlements, but their explanatory power was significantly enhanced after interacting with other factors, with the highest explanatory power of 0.986 for the interaction between distance from the road networks and urbanization rate (X11 ∩ X10) in 2000. The interaction between distance from the road networks and the output value of the primary industry was the highest in 2010 (X11 ∩ X7) at 0.993. In 2020, the explanatory capacity of individual factors such as elevation (X12), road network distance (X11), agricultural workers (X2), and slope (X13) were significantly increased when they interacted with other factors. Among them, the interaction between agricultural workers and urbanization rate (X2 ∩ X10) demonstrated a remarkable improvement in explanatory power, reaching 0.990. The above research findings indicated that the evolution of rural settlement areas is the result of the combined effects of multiple factors in real life. The interplay between natural and socio-economic factors exerts a more influential role in explaining the changes observed in rural settlement areas.
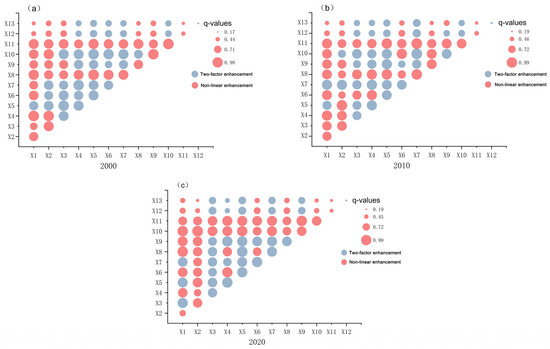
Figure 9.
Interaction detector bubble chart for independent variables. (a) Interaction detector bubble chart for independent variables in 2000. (b) Interaction detector bubble chart for independent variables in 2010. (c) Interaction detector bubble chart for independent variables in 2020.
4. Discussion
4.1. The Complexity of Rural Settlements’ Changes in the MRYRR
Along with the rapid growth of urban populations, the urbanization rate of the MRYRR increased from 22.2% in 1990 to 60.6% in 2020. Meanwhile, the total rural population has decreased from 118.85 million to 66.71 million, according to the successive National Population Census. The massive rural–urban migration has resulted in prominent abnormal phenomena like hollowing villages [56] and leaving behind a large number of inefficiently built-up land. Meanwhile, there was a serious shortage of land for construction in rapidly developing cities, so the Chinese government has put forward a policy called “the Linkage Policy of Increase and Decrease of Urban and Rural Built-up Land” (hereinafter referred to as the Linkage Policy) since 2006. Prior to 2000, that is, from the late 1990s, some local authorities adopted ways like land replacement or land consolidation to make up for the shortage of built-up land in urban and industrial zones even before the policy was officially launched. Through the application of this policy orientation, local governments have been able to adjust or demolish rural built-up land that was not adequately utilized or abandoned. In order to pursue rapid development, these three provinces in MRYRR are very motivated to carry out the linkage lolicy in order to increase the land targets for urban expansion. Given the time lag in policy effects, this may be the main reason why we observed the net reduction in the area of rural settlements during 1995–2000 and 2010–2015, respectively, with the decrease being more pronounced in 2010–2015 and in all three provinces [57,58].
Although the number of rural residents working in agriculture has become much smaller, and the linkage policy has provided a useful way to conserve and intensify rural land use, the overall expansion of rural settlements has been unchanged. Rural settlements on the outskirts of cities can easily be incorporated into the urban areas through expansion, while settlements in the rural hinterland are more likely to expand mainly through the occupation of surrounding arable land. This type of expansion of rural settlements is not only found in MRYRR or other parts of China [59] but is also quite common in other rapidly developing countries [19,20]. Even under the administrative control of very limited quota for new-built homesteads and government-led village planning, the trend of rapid growth in the area of rural settlements remains uncontrolled. In this study, for example, although over 60% of the reduced rural settlements were reclaimed as cropland during the three decades from 1990 to 2020, the amount of reclamation of rural settlements to cropland was only about half the area of the new rural settlements that occupied cropland. The number, as well as the density of rural settlement patches, did not shrink but increased slowly with just small fluctuations. This means that the degree of concentration and contiguity of rural settlements has become higher in the MRYRR. With the growth of rural residents’ economic income, their willingness to expand rural living space and improve housing conditions is expected to stay high, and a continuous increase in aggregation and decrease in fragmentation of rural settlement patterns could be expected in the future.
4.2. The Potential Impact of Expansion of Rural Settlements on Arable Land Spatial Distribution
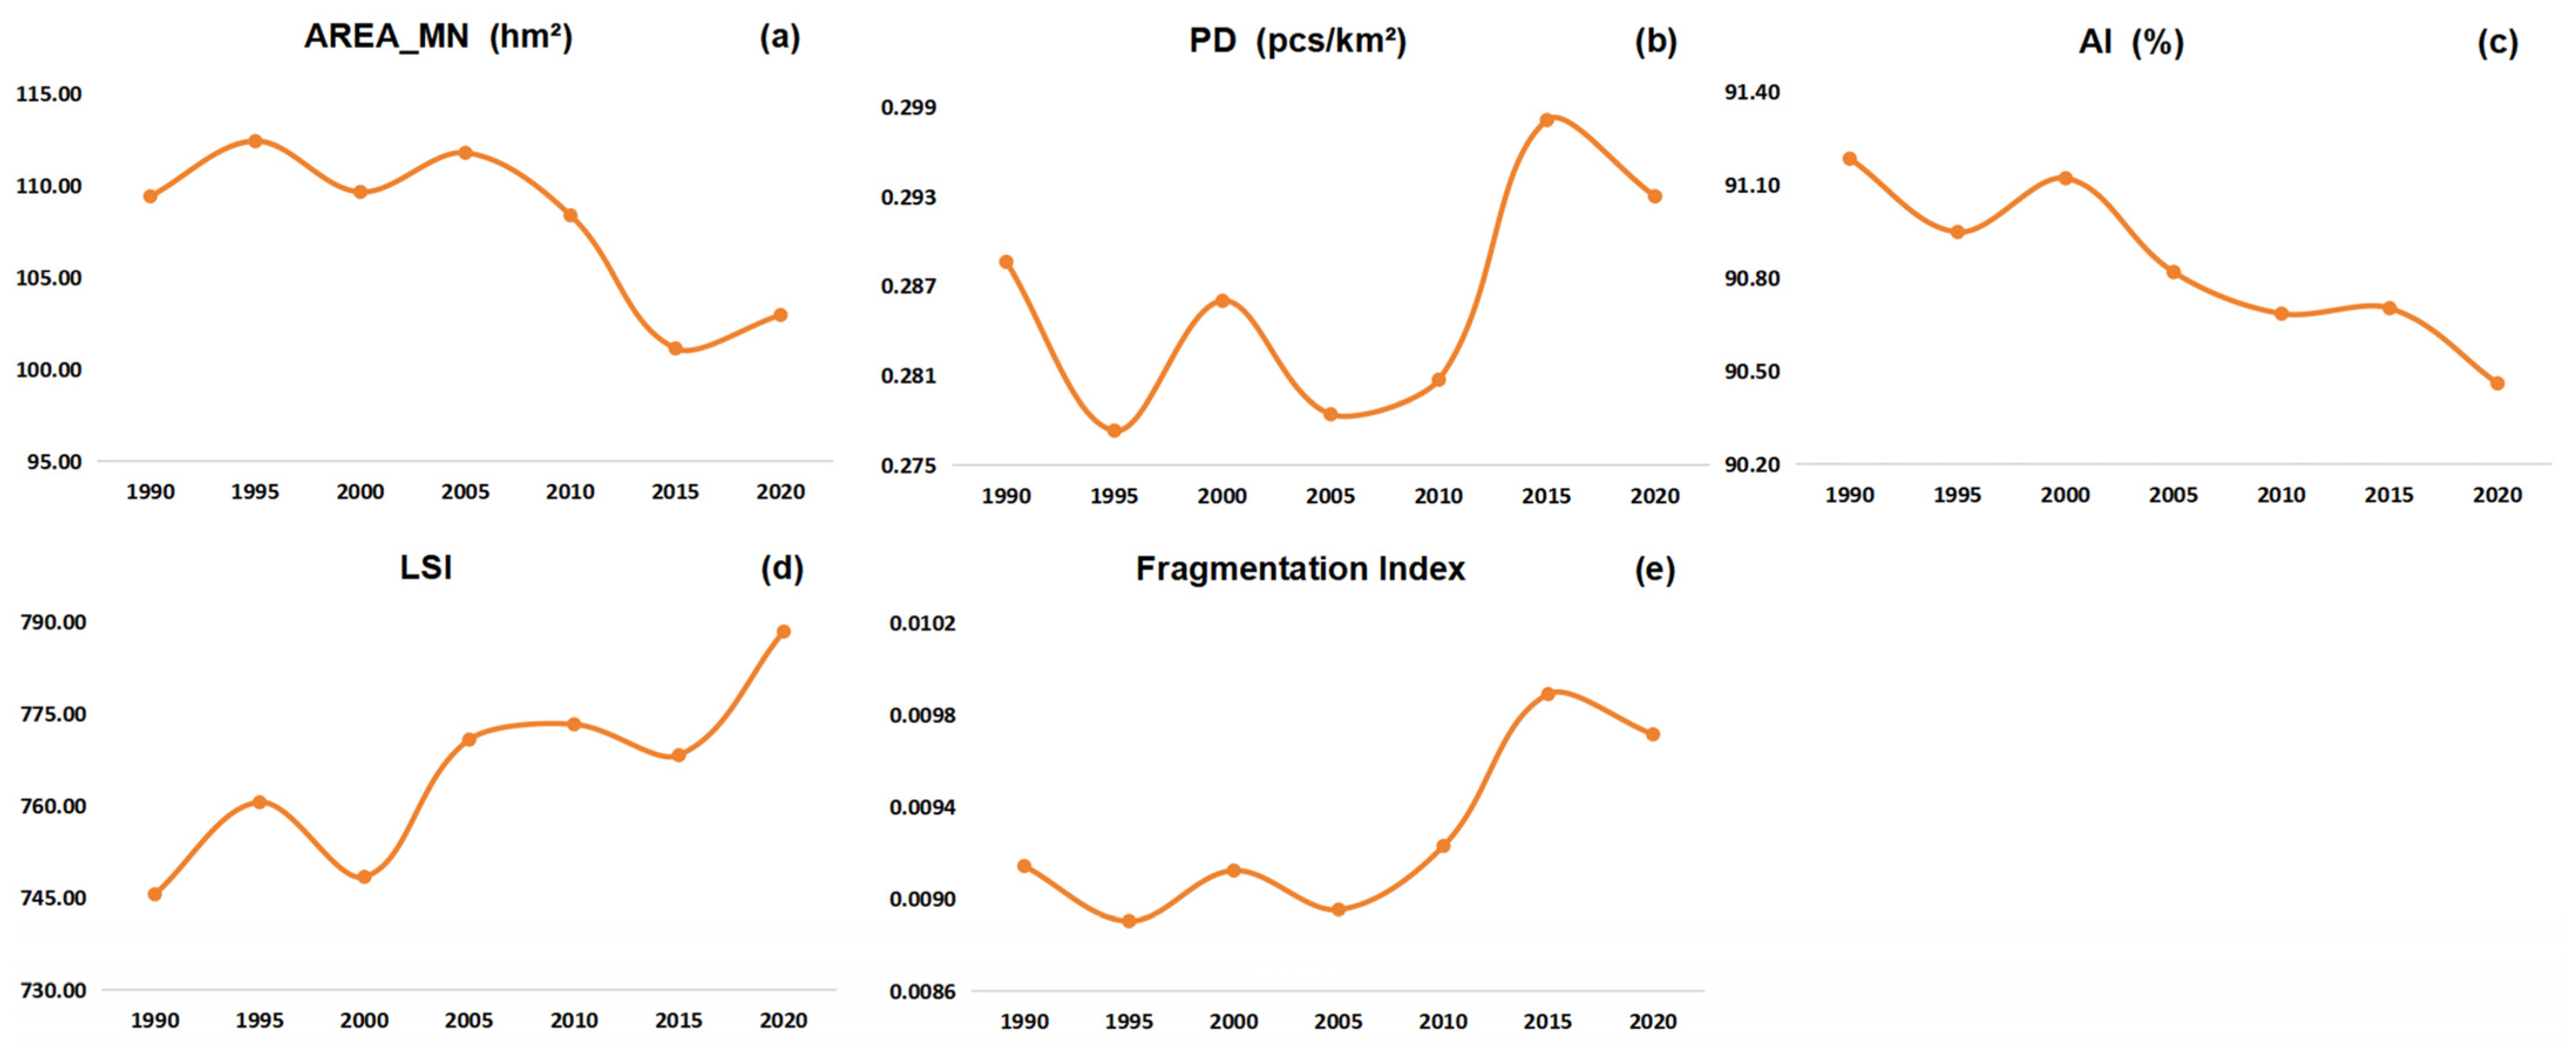
The expansion of rural settlements not only caused significant loss of arable land in the MRYRR but also profoundly impacted the spatiotemporal distribution pattern of arable land under rapid urbanization in this region [60]. The spatial distribution pattern of arable land changed significantly as a result of urban development and the expansion of rural settlements. During the period 1990–2020, the spatial distribution pattern of arable land changed significantly. By analyzing the landscape pattern index of arable land, we discovered that the average patch area (AREA_MN) of arable land in MRYRR consistently decreased over the years, while the PD and fragmentation index of arable land exhibited a fluctuating upward trend, particularly in 2005–2015. This indicated that the spatial distribution of arable land became increasingly dispersed and intricate, contrary to the trend of increasing aggregation of rural settlements. Furthermore, the LSI of arable land increased significantly while AI continued to decrease. This fully reflected the pattern of arable land towards irregularity and decreased internal connectivity of arable land patches. According to relevant studies, this may result in difficulty in improving the quality of arable land, as fragmentation and quality of arable land have an obvious negative spatial relationship [61]. The MRYRR, having served as a crucial grain-producing region in China, held significant importance for arable land conservation. The notable increase in arable land fragmentation posed serious challenges to arable land preservation and would be an obstacle to achieving sustainable land use and land management at the landscape level [62]. Even though the fragmentation of arable land is a complex outcome of resource endowments and human activities in rural areas [63], we cannot ignore the potential influence of settlement expansion. Therefore, while promoting rural development and urbanization, it is essential to maintain a balance between the expansion of rural settlements and the protection of arable land. The government should consider enforcing arable land conservation policies rigorously, enhancing the comprehensive agricultural production capacity of arable land, to ensure the sustainability of arable land resources [64]. This is crucial for ensuring national food security and sustainable rural development [65]. Changes in landscape pattern indices for arable land are shown in Figure 10.
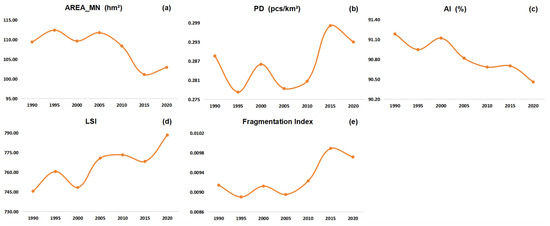
Figure 10.
Landscape pattern trends of arable land in the MRYRR, 1990 to 2020. (a) Changes in AREA_MN between 1990 and 2020. (b) Changes in PD between 1990 and 2020. (c) Changes in AI between 1990 and 2020. (d) Changes in LSI between 1990 and 2020. (e) Changes in the Fragmentation Index between 1990 and 2020.
4.3. The Driving Factors behind Changes in Rural Settlements in the MRYRR
Current research has indicated that the evolution of rural settlements is driven by a series of factors, and the impact was complex and varied with changes in time and space [17]. More recent researchers have found that as natural factors remain stable for a short period of time, the rapidly developing socio-economic factors play an increasingly leading role in the spatial pattern of rural settlements [42]. In this study, the rural electricity consumption, the output value of the primary industry, and the effective irrigated area are the major indicators reflecting the economic growth of the countryside, the quality of life of rural residents, and the state of rural infrastructure [66]. Effective irrigation can enhance the quality of agricultural products, ensuring stable and abundant supply in rural areas, thereby promoting comprehensive rural economic development. The primary industry also serves as a crucial driving force for rural economic growth, directly influencing the livelihood and economic conditions of rural residents. Additionally, the level of economic development is closely related to electricity consumption, as electricity forms the foundation and support for rural economic growth and is also an external manifestation of improved living standards for rural inhabitants. With the continuous development of the rural economy, the income level of residents has steadily increased, significantly enhancing the housing aspirations and purchasing power of rural inhabitants. Some rural residents may opt to purchase properties in urban areas, but the high property prices in cities exert pressure on the majority of farmers. As a result, most farmers still choose to construct new houses in rural areas to meet their housing needs. Furthermore, people tend to renovate and expand existing houses to enhance their quality of life, thus profoundly impacting the expansion of rural settlement areas [67,68]. The development of rural settlements is also constrained by natural factors such as elevation and slope. Therefore, when analyzing the evolution of rural settlement, it is essential to fully consider the interactions among various factors in order to obtain a more reasonable and comprehensive explanation. This will help us better understand the complexity of the rural settlement area evolution process, thus enabling the formulation of more effective decisions and policies to support the sustainable development of rural regions.
4.4. Limitations and Future Prospects
First, the selection of driving factors, especially for the natural indicators, may not be thoroughly comprehensive. The results of the Geodetector model in this study showed that the socio-economic factors had much stronger power to explain the changes in rural settlements than natural factors. However, the explanatory efforts of natural factors were mostly enhanced when combined with socio-economic factors. This may indicate that more natural factors, such as annual average precipitation and distance to water bodies, should be included. Furthermore, the guiding role of national policy forces in the development of rural settlements is increasingly strengthened [69]. Although some of the selected socio-economic factors, such as effective irrigated area, arable land area, rural electricity consumption, and urbanization rate, can indirectly reflect the policy orientations to some extent, it does not fully reflect the implementation effect of a particular land management policy, such as the land use master plan, which has been carried out for three rounds in the past, the annual land use plan, which has been in operation for nearly four decades, and the linkage policy on the changes of rural settlements. Therefore, future research should give more consideration to the impact of policy factors on changes in rural settlements. Accordingly, more accurate econometric models should be developed to explain the complex natural and socio-economic driving factors.
Second, this study focused on the evolutionary process of the spatiotemporal pattern of rural settlements and its drivers without exploring the pattern reconstruction and optimization of rural settlements, which is also a hot issue currently. Rural reconstruction is of particular importance in improving the functions of the countryside, thus promoting rural revitalization. How to reconstruct and optimize rural space at larger scales with consideration of the different types of villages, such as agglomeration promotion type, suburban integration type, characteristic protection type, and relocation and withdrawal type [18], is a question worthy of in-depth investigation.
Third, the three provinces of the MRYRR are all major grain-producing regions of China and play an extremely important role in the country’s guarantee of grain production. The main source of land for the expansion of rural settlements was arable land, which could result in enormous pressure on arable land conservation and grain security in the MRYRR. However, the effect of rural settlement expansion on arable land conservation was not deeply investigated in this paper, which is a key issue that should be taken into consideration.
5. Conclusions
(1) Over the years 1990 to 2020, the scale of rural settlements in the MRYRR showed fluctuating growth, with an overall expansion of 504.70 km2. The two land use types with the largest areas occupied by rural settlements were arable land and forests. Overall, 41 of the 42 cities in the MRYRR showed an increase in rural settlement area from 1990 to 2020, except Xiangxi Tujia and Miao Autonomous Prefecture. From 1990 to 2020, cities with a high proportion of transfers of other land use types to rural settlement in the total area of 1990 were Shennongjia Forest District, Pingxiang, Enshi, and Nanchang, while Qianjiang had the lowest proportion. Conversely, cities with a high proportion of the area of rural settlement transfer to other land use types in the total area of 1990 were Xiangxi, Changsha, Zhangjiajie, and Nanchang, with Shennongjia Forest District having the lowest proportion.
(2) The spatial layout of rural settlements in the MRYRR exhibited a cluster distribution characterized by “five main nuclei and many secondary nuclei,” along with a spatial distribution pattern of “gathering in the north and east, while scattered in the south and west” without significant changes during the time. The five main nuclei of the rural settlements were concentrated in the Jianghan Plain, involving the central part of Jingzhou, Tianmen, southern Xiaogan, northeastern Wuhan, and northwestern Huangshi. Each main nucleus radiated outward from its center, with a corresponding decrease in kernel density values.
(3) Since 1990, under the continuous influence of human factors, the overall scale and average patch size of rural settlements in the MRYRR have significantly increased, and the NP has also grown. It has been found that the landscape fragmentation level of rural settlements in this area has been effectively mitigated to a large extent. The connectivity between patches of rural settlements has continued to strengthen, indicating a more concentrated and orderly distribution. However, with the continuing development and construction in rural areas, the shapes of patches in rural settlements have become more complex and diverse.
(4) Factors with q-values higher than 0.5 are considered core factors that have a strong explanatory effect. Among the selected 13 factors, the core factors are rural electricity consumption, effective irrigated area, output value of primary industry, urbanization rate, and net income per rural resident. The interactive exploration results indicate that under the combined influence of natural and socio-economic factors, a better explanation of the evolution of rural settlement size can be achieved, thus revealing the driving mechanisms of rural settlement evolution in a more scientifically and logically sound manner.
Author Contributions
Conceptualization, X.Y.; methodology, X.Y. and D.W.; software, D.W.; validation, D.W.; formal analysis, D.W.; investigation, X.Y. and D.W.; resources, X.Y. and D.W.; data curation, D.W.; writing—original draft preparation, D.W.; writing—review and editing, X.Y.; visualization, D.W.; supervision, X.Y.; project administration, X.Y.; funding acquisition, X.Y. All authors have read and agreed to the published version of the manuscript.
Funding
This research was funded by the Youth Fund for Humanities and Social Sciences Research Project of the Ministry of Education of China (19YJCZH224) and National Natural Science Foundation of China (42001231).
Data Availability Statement
Publicly available datasets were analyzed in this study. This data can be found here: Resource and Environment Science and Data Center of Chinese Academy of Sciences [online]. Available from: https://www.resdc.cn/Datalist1.aspx?FieldTyepID=1,3 (accessed on 11 May 2023); Geospatial Data Cloud [online]. Available from: https://www.gscloud.cn/sources/index?pid=302 (accessed on 11 May 2023); Resource and Environment Science and Data Center of Chinese Academy of Science [online]. Available from: https://www.resdc.cn/Datalist1.aspx?FieldTyepID=20,0 (accessed on 11 May 2023); Resource and Environment Science and Data Center of Chinese Academy of Sciences [online]. Available from: https://www.resdc.cn/data.aspx?DATAID=237 (accessed on 11 May 2023); Hubei Provincial Statistics Bureau [online]. Available from: http://tjj.hubei.gov.cn/tjsj/sjkscx/tjnj/qstjnj/ (accessed on 11 May 2023); Hunan Provincial Bureau of Statistics [online]. Available from: http://tjj.hunan.gov.cn/hntj/tjsj/tjnj/index.html (accessed on 11 May 2023); Jiangxi Provincial Bureau of Statistics [online]. Available from: http://tjj.jiangxi.gov.cn/col/col38595/index.html (accessed on 11 May 2023).
Conflicts of Interest
The authors declare no conflict of interest.
References
- Zhou, G.; He, Y.; Tang, C.; Yu, T.; Xiao, G.; Zhong, T. Dynamic mechanism and present situation of rural settlement evolution in China. J. Geogr. Sci. 2013, 23, 513–524. [Google Scholar] [CrossRef]
- Lu, M.; Wei, L.; Ge, D.; Sun, D.; Zhang, Z.; Lu, Y. Spatial optimization of rural settlements based on the perspective of appropriateness-domination: A case of Xinyi City. Habitat Int. 2020, 98, 102148. [Google Scholar] [CrossRef]
- Bittner, C.; Sofer, M. Land use changes in the rural—Urban fringe: An Israeli case study. Land Use Policy 2013, 33, 11–19. [Google Scholar] [CrossRef]
- Hosseini, S.B.; Faizi, M.; Norouzian-Maleki, S.; Azari, A.R.K. Impact evaluation of rural development plans for renovating and retrofitting of rural settlements Case Study: Rural Districts of Tafresh in Iran. Environ. Earth Sci. 2015, 73, 3033–3042. [Google Scholar] [CrossRef]
- Lang, W.; Long, Y.; Chen, T. Rediscovering Chinese cities through the lens of land-use patterns. Land Use Policy 2018, 79, 362–374. [Google Scholar] [CrossRef]
- Cao, W.; Zhou, S.; Zhou, M. Operational Pattern of Urban-Rural Integration Regulated by Land Use in Metropolitan Fringe of China. Land 2021, 10, 515. [Google Scholar] [CrossRef]
- Song, W.; Chen, B.M.; Zhang, Y. Land-use change and socio-economic driving forces of rural settlement in China from 1996 to 2005. Chin. Geogr. Sci. 2014, 24, 511–524. [Google Scholar] [CrossRef]
- Li, Y.; Jia, L.; Wu, W.; Yan, J.; Liu, Y. Urbanization for rural sustainability—Rethinking China’s urbanization strategy. J. Clean. Prod. 2018, 178, 580–586. [Google Scholar] [CrossRef]
- Liu, Y.; Liu, Y.; Chen, Y.; Long, H. The process and driving forces of rural hollowing in China under rapid urbanization. J. Geogr. Sci. 2010, 20, 876–888. [Google Scholar] [CrossRef]
- Long, H.; Qu, Y. Land use transitions and land management: A mutual feedback perspective. Land Use Policy 2018, 74, 111–120. [Google Scholar] [CrossRef]
- Winkler, K.; Fuchs, R.; Rounsevell, M.; Herold, M. Global land use changes are four times greater than previously estimated. Nat. Commun. 2021, 12, 2501. [Google Scholar] [CrossRef] [PubMed]
- van Vliet, J.; de Groot, H.L.F.; Rietveld, P.; Verburg, P.H. Manifestations and underlying drivers of agricultural land use change in Europe. Landsc. Urban. Plan. 2015, 133, 24–36. [Google Scholar] [CrossRef]
- Hashem, D.; Parviz, A.; Mahdis, M. Land use change, urbanization, and change in landscape pattern in a metropolitan area. Sci. Total Environ. 2019, 655, 707–719. [Google Scholar] [CrossRef]
- Wang, J.; Zhang, Y. Analysis on the Evolution of Rural Settlement Pattern and Its Influencing Factors in China from 1995t o 2015. Land 2021, 10, 1137. [Google Scholar] [CrossRef]
- Wang, J.; Wang, X.; Du, G.; Zhang, H. Temporal and Spatial Changes of Rural Settlements and Their Influencing Factors in Northeast China from 2000 to 2020. Land 2022, 11, 1640. [Google Scholar] [CrossRef]
- Li, K.; Geng, H.; Yue, L.; Li, K.; Huang, L. Spatial Differentiation Characteristics and Driving Mechanism of Rural Settlements Transformation in the Metropolis: A Case Study of Pudong District, Shanghai. Front. Env. Sci. 2021, 9, 755207. [Google Scholar] [CrossRef]
- Tan, S.; Zhang, M.; Wang, A.; Ni, Q. Spatio-Temporal Evolution and Driving Factors of Rural Settlementsin Low Hilly Region—A Case Study of 17 Citiesin Hubei Province, China. Int. J. Environ. Res. Public Health 2021, 18, 2387. [Google Scholar] [CrossRef]
- Zhang, R.; Zhang, X. Spatial Pattern Evolution and Driving Mechanism of Rural Settlements in Rapidly Urbanized Areas: A Case Study of Jiangning District in Nanjing City, China. Land 2023, 12, 749. [Google Scholar] [CrossRef]
- Shach-Pinsly, D.; Shadar, H. Towards Rural Regeneration in a Post-Agricultural and Post-Ideological Era. Land 2023, 12, 896. [Google Scholar] [CrossRef]
- Conrad, C.; Rudloff, M.; Abdullaev, I.; Thiel, M.; Loew, F.; Lamers, J.P.A. Measuring rural settlement expansion in Uzbekistan using remote sensing to support spatial planning. Appl. Geogr. 2015, 62, 29–43. [Google Scholar] [CrossRef]
- Dietler, D.; Farnham, A.; de Hoogh, K.; Winkler, M.S. Quantification of Annual Settlement Growth in Rural Mining Areas Using Machine Learning. Remote Sens. 2020, 12, 235. [Google Scholar] [CrossRef]
- Gosch, M.S.; Parente, L.L.; Santos, C.O.D.; Mesquita, V.V.; Ferreira, L.G. Landsat-based assessment of the quantitative and qualitative dynamics of the pasture areas in rural settlements in the Cerrado biome, Brazil. Appl. Geogr. 2021, 136, 102585. [Google Scholar] [CrossRef]
- Li, H.; Yuan, Y.; Zhang, X.; Li, Z.; Wang, Y.; Hu, X. Evolution and transformation mechanism of the spatial structure of rural settlements from the perspective of long-term economic and social change: A case study of the Sunan region, China. J. Rural Stud. 2022, 93, 234–243. [Google Scholar] [CrossRef]
- Liu, Y.; Yang, Y.; Li, Y.; Li, J. Conversion from rural settlements and arable land under rapid urbanization in Beijing during 1985–2010. J. Rural Stud. 2017, 51, 141–150. [Google Scholar] [CrossRef]
- Qu, Y.; Jiang, G.; Tian, Y.; Shang, R.; Wei, S.; Li, Y. Urban—Rural construction land Transition (URCLT) in Shandong Province of China: Features measurement and mechanism exploration. Habitat Int. 2019, 86, 101–115. [Google Scholar] [CrossRef]
- Tan, M.; Li, X. The changing settlements in rural areas under urban pressure in China: Patterns, driving forces and policy implications. Landsc. Urban. Plan. 2013, 120, 170–177. [Google Scholar] [CrossRef]
- Song, W.; Li, H. Spatial pattern evolution of rural settlements from 1961 to 2030 in Tongzhou District, China. Land Use Policy 2020, 99, 105044. [Google Scholar] [CrossRef]
- Yang, R.; Xu, Q.; Long, H. Spatial distribution characteristics and optimized reconstruction analysis of China’s rural settlements during the process of rapid urbanization. J. Rural Stud. 2016, 47, 413–424. [Google Scholar] [CrossRef]
- Zhang, R.; Jiang, G.; Zhang, Q. Does urbanization always lead to rural hollowing? Assessing the spatio-temporal variations in this relationship at the county level in China 2000-2015. J. Clean. Prod. 2019, 220, 9–22. [Google Scholar] [CrossRef]
- Owen, C.; Jacqueline, B. Causes of urbanisation and counter-urbanisation in Zambia: Natural population increase or migration? Urban. Stud. 2019, 56, 2005–2020. [Google Scholar] [CrossRef]
- Tan, X.; Zhou, G.; Zhu, S.; Ou, C. Landscape Pattern Changes and the Characteristic of Spatio-temporal Differentiation of Rural Residential Area in Changsha in Recent 20 Years. Sci. Geogr. Sin. 2015, 35, 204–210, (In Chinese with English Abstract). [Google Scholar]
- Phil, M.; Jim, W.; Neil, A.; Scott, B.; Lisa, B.; John, M.; Bill, P.; Tony, S. Rural Community and Rural Resilience: What is important to farmers in keeping their country towns alive? J. Rural Stud. 2011, 28, 20–29. [Google Scholar] [CrossRef]
- Tian, G.; Qiao, Z.; Gao, X. Rural settlement land dynamic modes and policy implications in Beijing metropolitan region, China. Habitat Int. 2014, 44, 237–246. [Google Scholar] [CrossRef]
- Coluzzi, R.; Bianchini, L.; Egidi, G.; Cudlin, P.; Imbrenda, V.; Salvati, L.; Lanfredi, M. Density matters? Settlement expansion and land degradation in Peri-urban and rural districts of Italy. Environ. Impact Asses 2022, 92, 106703. [Google Scholar] [CrossRef]
- McLeman, R.A. Settlement abandonment in the context of global environmental change. Glob. Environ. Chang. 2011, 21, S108–S120. [Google Scholar] [CrossRef]
- Fayet, C.M.J.; Reilly, K.H.; Van Ham, C.; Verburg, P.H. What is the future of abandoned agricultural lands? A systematicre view of alternative trajectories in Europe. Land Use Policy 2022, 112, 105833. [Google Scholar] [CrossRef]
- Yin, X.; Chen, J.; Li, J. Rural innovation system: Revitalize the countryside for a sustainable development. J. Rural Stud. 2019, 93, 471–478. [Google Scholar] [CrossRef]
- Liu, Y.; Zang, Y.; Yang, Y. China’s rural revitalization and development: Theory, technology and management. J. Geogr. Sci. 2020, 30, 1923–1942. [Google Scholar] [CrossRef]
- Zhang, R.; Zhang, X. Distribution Characteristics and Influencing Factors of Rural Settlements in Metropolitan Fringe Area: A Case Study of Nanjing, China. Land 2022, 11, 1989. [Google Scholar] [CrossRef]
- Wu, K.; Zhang, H. Land use dynamics, built-up land expansion patterns, and driving forces analysis of the fast-growing Hangzhou metropolitan area, eastern China (1978–2008). Appl. Geogr. 2012, 34, 137–145. [Google Scholar] [CrossRef]
- Long, H.; Zhang, Y.; Tu, S. Rural vitalization in China: A perspective of land consolidation. J. Geogr. Sci. 2019, 29, 517–530. [Google Scholar] [CrossRef]
- Zhang, X.; He, J.; Deng, Z.; Ma, J.; Chen, G.; Zhang, M.; Li, D. Comparative Changes of Influence Factors of Rural Residential Area Based on Spatial Econometric Regression Model: A Case Study of Lishan Township, Hubei Province, China. Sustainability 2018, 10, 3403. [Google Scholar] [CrossRef]
- Rosner, A.; Wesolowska, M. Deagrarianisation of the Economic Structure and the Evolution of Rural Settlement Patterns in Poland. Land 2020, 9, 523. [Google Scholar] [CrossRef]
- You, T.; Yan, S. Spatial Differentiation and Driving Force Detection of Rural Settlements in the Yangtze River Delta Region. Sustainability 2023, 15, 8774. [Google Scholar] [CrossRef]
- Gong, J.; Jian, Y.; Chen, W.; Liu, Y.; Hu, Y. Transitions in rural settlements and implications for rural revitalization in Guangdong Province. J. Rural Stud. 2019, 93, 359–366. [Google Scholar] [CrossRef]
- Li, Y.; Liu, Y.; Long, H.; Cui, W. Community-based rural residential land consolidation and allocation can help to revitalize hollowed villages in traditional agricultural areas of China: Evidence from Dancheng County, Henan Province. Land Use Policy 2014, 39, 188–198. [Google Scholar] [CrossRef]
- Wen, Y.; Zhang, Z.; Liang, D.; Xu, Z. Rural Residential Land Transition in the Beijing-Tianjin-Hebei Region: Spatial-Temporal Patterns and Policy Implications. Land Use Policy 2020, 96, 104700. [Google Scholar] [CrossRef]
- Niu, X.; Liao, F.; Liu, Z.; Wu, G. Spatial-Temporal Characteristics and Driving Mechanisms of Land-Use Transition from the Perspective of Urban-Rural Transformation Development: A Case Study of the Yangtze River Delta. Land 2022, 11, 631. [Google Scholar] [CrossRef]
- Liu, Y.; Long, H. Land use transitions and their dynamic mechanism: The case of the Huang-Huai-Hai Plain. J. Geogr. Sci. 2016, 26, 515–530. [Google Scholar] [CrossRef]
- Xiao, X.; Huang, X.; Jiang, L.; Jin, C. Empirical study on comparative analysis of dynamic degree differences of land use based on the optimization model. Geocarto Int. 2022, 37, 9847–9864. [Google Scholar] [CrossRef]
- Wang, J.; Xu, C. Geodetector: Principle and prospective. Acta Geogr. Sin. 2017, 72, 116–134, (In Chinese with English Abstract). [Google Scholar]
- Fu, F.; Liu, W.; Wu, D.; Deng, S.; Bai, Z. Research on the Spatiotemporal Evolution of Land Use Landscape Pattern in a County Area Based on CA-Markov Model. Sustain. Cities Soc. 2022, 80, 103760. [Google Scholar] [CrossRef]
- Chen, Z.; Liu, Y.; Feng, W.; Li, Y.; Li, L. Study on spatial tropism distribution of rural settlements in the Loess Hilly and Gully Region based on natural factors and traffic accessibility. J. Rural Stud. 2019, 93, 441–448. [Google Scholar] [CrossRef]
- Liu, Y.; Yang, R.; Long, H.; Gao, J.; Wang, J. Implications of land-use change in rural China: A case study of Yucheng, Shandong province. Land Use Policy 2014, 40, 111–118. [Google Scholar] [CrossRef]
- Luan, W.; Zhang, S.; Li, Y.; Zheng, X. Spatiotemporal Differentiation and Influencing Factors of Chinese’s Tourism Demand to Thailand. Tour. Trib. 2019, 34, 76–89, (In Chinese with English Abstract). [Google Scholar]
- Wang, D.; Zhu, Y.; Zhao, M.; Lv, Q. Multi-dimensional hollowing characteristics of traditional villages and its influence mechanism based on the micro-scale: A case study of Dongcun Village in Suzhou, China. Land Use Policy 2020, 101, 105146. [Google Scholar] [CrossRef]
- Wang, J.; Lin, Y.; Glendinning, A.; Xu, Y. Land-use changes and land policies evolution in China’s urbanization processes. Land Use Policy 2018, 75, 375–387. [Google Scholar] [CrossRef]
- Wang, Z.; Fang, C.; Wang, J. Observation and Reflection on Land Policy of Linking the Increase in Land Used for Urban Construction with the Decrease in Land Used for Rural Construction. China Popul. Resour. Environ. 2012, 22, 96–102, (In Chinese with English Abstract). [Google Scholar]
- Li, H.; Song, W. Expansion of Rural Settlements on High-Quality Arable Land in Tongzhou District in Beijing, China. Sustainability 2019, 11, 5153. [Google Scholar] [CrossRef]
- Liu, S.; Xiao, W.; Ye, Y.; He, T.; Luo, H. Rural residential land expansion and its impacts on cultivated land in China between 1990 and 2020. Land Use Policy 2023, 132, 106816. [Google Scholar] [CrossRef]
- Pang, R.; Xu, H.; Zhang, M.; Qian, F. Spatial correlation and impact mechanism analysis of cultivated land fragmentation and quality in the Central Plain of Liaoning Province, Northeast China. Land. Degrad. Dev. 2023; early view. [Google Scholar] [CrossRef]
- Tolessa, T.; Senbeta, F.; Kidane, M. Landscape composition and configuration in the central highlands of Ethiopia. Ecol. Evol. 2016, 6, 7409–7421. [Google Scholar] [CrossRef]
- Liu, J.; Jin, X.; Xu, W.; Zhou, Y. Evolution of cultivated land fragmentation and its driving mechanism in rural development: A case study of Jiangsu Province. J. Rural Stud. 2022, 91, 58–72. [Google Scholar] [CrossRef]
- Uisso, A.M.; Tanrivermis, H. Driving factors and assessment of changes in the use of arable land in Tanzania. Land Use Policy 2021, 104, 105359. [Google Scholar] [CrossRef]
- Wu, Y.; Shan, L.; Guo, Z.; Peng, Y. Cultivated land protection policies in China facing 2030: Dynamic balance system versus basic farmland zoning. Habitat Int. 2017, 69, 126–138. [Google Scholar] [CrossRef]
- Long, H.; Gerhard, K.H.; Li, X.; Zhang, M. Socio-economic development and land-use change: Analysis of rural housing land transition in the Transect of the Yangtse River, China. Land Use Policy 2005, 24, 141–153. [Google Scholar] [CrossRef]
- Wei, S.; Bryan, C.P. The effects of China’s cultivated land balance program on potential land productivity at a national scale. Appl. Geogr. 2014, 46, 158–170. [Google Scholar]
- Huang, Q.; Song, W.; Song, C. Consolidating the layout of rural settlements using system dynamics and the multi-agent system. J. Clean. Prod. 2020, 274, 123150. [Google Scholar] [CrossRef]
- CAO, Y.; Li, G.; Cao, Y.; Wang, J.; Fang, X.; Zhou, L.; Liu, Y. Distinct types of restructuring scenarios for rural settlements in a heterogeneous rural landscape: Application of a clustering approach and ecological niche modeling. Habitat Int. 2020, 104, 102248. [Google Scholar] [CrossRef]


Disclaimer/Publisher’s Note: The statements, opinions and data contained in all publications are solely those of the individual author(s) and contributor(s) and not of MDPI and/or the editor(s). MDPI and/or the editor(s) disclaim responsibility for any injury to people or property resulting from any ideas, methods, instructions or products referred to in the content. |
© 2023 by the authors. Licensee MDPI, Basel, Switzerland. This article is an open access article distributed under the terms and conditions of the Creative Commons Attribution (CC BY) license (https://creativecommons.org/licenses/by/4.0/).