Abstract
Food production and trade play a fundamental role in the globalized food system. However, the phenomena of decreasing food production and trade interruptions are becoming increasingly common. Currently, there is a lack of simultaneous research on food production and import trade. This study compiles socio-economic environmental data from 146 countries and regions worldwide and employs mobile window and network analysis methods to illustrate how food production quantity influences the social-ecological system. The research findings indicate that in the majority of regions worldwide (102 countries), food demand is met through the local food supply, with a predominant distribution in coastal and inland areas. However, 31% of countries or regions primarily achieve food security through import trade, and many of them are island nations and peninsular countries. This discovery provides valuable insights for understanding the diversity and dependency within the global food system. Based on the impact of food production quantity on the global socio-ecological system network, this study reveals the uneven strengths of connections between nodes and inconsistent connection directions. Building upon these findings, we propose recommendations concerning agricultural policies, human-environment relationships, agricultural transformation, and climate change to help prevent and manage food insecurity risks.
1. Introduction
Amidst the backdrop of the modern world’s incessantly expanding global population, ensuring an abundant food supply and proper nutrition has emerged as an imperative and pivotal endeavor for socio-economic sustainability. To adequately cater to the dietary requirements of the population, some researchers project that global crop production must double by at least 2050 [1]. Simultaneously, the escalating population growth, stagnant crop yields, prevalent malnutrition, dietary shifts, and soaring food prices have been causing disruptions in supply chains within specific nations. Consequently, guaranteeing food security has evolved into a pressing and time-sensitive matter that warrants prompt attention [2].
In response, certain nations are enacting measures to regulate demand and curtail consumption. Concurrently, efforts are being directed towards the supply side, including the adoption of efficient fertilizer and irrigation techniques. While these initiatives may offer some respite to prevailing food challenges, their efficacy remains confined to the national domain. Owing to disparities in spatial food production and consumption, international food trade has emerged as a pivotal avenue for solutions [3]. It aids in stabilizing fluctuations in domestic food supply by redistributing food, enhancing its quality and diversity, and serving as a safety net [4] when domestic production encounters obstacles. However, relying solely on food trade is an inadequate long-term strategy for ensuring food security, as evidenced by the profound ripple effects in the global food market and food security predicaments triggered by export disruptions, such as those caused by the Russia–Ukraine conflict [5]. Moreover, escalating food import costs, structural contradictions in traditional food markets, and the heightened vulnerability of import-reliant food systems to health issues linked to unhealthy food imports further underscore the fragility of the system.
Due to the frequent occurrence of trade-disrupting conflict events, there is a growing focus on the importance of domestic food production in meeting the needs of the country’s residents [6]. As efforts to reduce food trade intensify, the pressure on domestic food supply is escalating due to population growth and the stable demand for nutrition. Additionally, limited arable land, scarce irrigation resources, nutrient-depleted soils, and the impact of variable climates [7], including greenhouse gas emissions, are all contributing to a decline in domestic food production. This is particularly evident in regions where small-scale farming predominates, and the issues of rural depopulation, hollowing out, and aging populations are exacerbating the problem of abandoned farmland. Therefore, the ongoing evolution of global food trade and production presents significant challenges in addressing issues of social inequality and environmental degradation.
Some countries are attempting to transition to alternative agricultural models to reduce the negative externalities associated with traditional agriculture, thereby easing the tensions between society and the ecosystem. However, it is essential to note that many of these studies are mostly meta-analyses, lacking specific quantitative analyses. Furthermore, agricultural transformation is confronted with higher labor costs and consumption fluctuations, which are particularly critical within major grain-producing countries. The economic pressures and risks of profitability may diminish farmers’ willingness to engage in production [8], and existing literature fails to clarify whether such measures can indeed enhance the quality of family life and foster mutually beneficial interactions between production and consumption.
Scholars often face a dilemma when offering guidance for the issues mentioned above. This can lead to overlooking the complex dynamics of food production in the social-ecological system, making it hard to fully grasp internal trade-offs. While every food production phase influences the social-ecological system, current research mainly focuses on production quantity. Moreover, a gap exists in understanding how positive interactions among social-ecological system elements can drive overall development and reduce counteractive effects. Existing research advocates for a coordinated approach to address food security on a global scale from both social and ecological perspectives. Besides low-income regions, countries need to focus on reducing caloric intake and shifting dietary patterns to decrease mortality rates caused by weight obesity and high red meat consumption. Similar measures also encompass responding to climate change patterns for rainfed agriculture [9], transforming agricultural production methods to reduce greenhouse gas emissions, mitigating food–fuel conflicts to regulate energy security, and curbing biodiversity loss and nitrogen–phosphorus pollution [10]. While these methods are effective for ensuring food security, they focus solely on particular facets of food production, like supply, acquisition, or utilization. They fail to take into account the changing dynamics of the social-ecological system as food supply conditions evolve [11]. For instance, increasing food production may directly impact the decline in environmental externalities, and lifting food trade restrictions may alleviate domestic food challenges but could increase the risk of negative environmental pressures for trading partners.
By examining how social–ecological systems in different countries respond to food supply sources, we can reveal obstacles and chances for sustainable food production worldwide. This study seeks to pinpoint particular high-priority actions for countries at different developmental stages by better grasping the growing food dynamics. To bridge this information gap, the research employs pertinent network methodologies to tackle two central concerns: first, how to identify and manage the intricate interactions and trade-offs between social and ecological dimensions under different levels of food production and second, how to design specific development plans to facilitate society’s transition towards sustainable food production stages.
In tackling these concerns, this study utilizes panel data from 146 countries on food production [12], acquired from the United Nations Food and Agriculture Organization. Previous research suggests that focusing on the comprehensive nature and dynamics of the social–ecological system, alongside maintaining its adaptability, could provide increased chances to prevent societal–ecological conflicts and enhance overall food security. Therefore, our aim is to apply cluster analysis to identify initial spatial distribution patterns among nations reliant on production and those reliant on imports. Following this, the paper enhances both social and ecological benefits, aligning with global objectives by seamlessly integrating ecological, economic, and social elements within a comprehensive network framework. The study ranks 146 countries according to the Sustainable Food Production Index and employs a dynamic moving window method to scrutinize the mounting repercussions of production dependency and import reliance on the intricate fabric of the social-ecological system. Additionally, the research delves into four critical network metrics—centrality, network density, connectivity, and modularity—to mirror the ever-shifting traits of the social–ecological system network. Furthermore, the paper computes weighted node degrees in collaborative and balanced networks to discern the evolving roles of individual nodes and their connections, aiming to propose cluster formations that lean toward mutual development. Grounded in these profound findings, this research ushers in fresh perspectives on the dynamic interplay between social and ecological dimensions in response to fluctuating food supply sources. Consequently, it aids in the discernment of actionable priorities crucial for ensuring food security across a spectrum of diverse country profiles.
2. Methods
2.1. Study Area
This research establishes a social–ecological system by utilizing data from 146 countries in 2020, sourced from the Food and Agriculture Organization (FAO). Furthermore, the countries are categorized based on the ratio of domestic food production to total food quantity (including both domestic production and imports) into two groups: production-dependent countries (0.5 < x < 1) and import-dependent countries (0 < x < 0.5). Among these, there are 102 production-dependent countries and 44 import-dependent countries. Prior studies [13] have indicated variations in crop yields among different crop types. Consequently, this study focuses on grains, root and tuber crops, and legumes while excluding processed crops and fruits. This selection enables a more targeted examination of crop productivity.
2.2. Variables and Research Methodology
Given the availability, accessibility, and stability of food production, along with the principles of sustainability, this paper quantifies their magnitudes using indicators that align with the social–ecological processes. Table 1 presents the social, economic, and ecological factors related to food production based on four principles and explains the relationships between the selected factors and food production in the following sections. Detailed definitions of the selected nodes are provided in Appendix A.

Table 1.
Socio-ecological system network metrics.
2.2.1. Integration of Climate Change Data
To assess the environmental externalities caused by food production, this study selects surface temperature increase and per capita greenhouse gas emissions as indicators. Environmental sustainability places significant emphasis on greenhouse gas emissions and their contribution to climate change. It is estimated that global food production accounts for 23–42% of total greenhouse gas emissions. Producers must enhance their capacity to adapt to high temperatures, prolonged cold, heavy rainfall, and extended droughts as fluctuations in market prices resulting from temperature rise and extreme precipitation directly affect food and income security for farmers. In many countries, farmers rely on rainwater irrigation for their livelihoods, making them vulnerable to climate adaptation and underscoring the renewed importance of monitoring weather changes and agricultural production yields [14].
2.2.2. Integration of Agricultural Production Data
To evaluate the production costs within the food supply chain, this paper has opted for data on land resources, water intensity, and the usage of fertilizers and pesticides. Changes in consumption habits have led to an increased demand for palm oil, soybean, timber, and beef, resulting in deforestation [15] and added pressure on habitats and biodiversity. Furthermore, in certain regions considering alterations to agricultural practices, the rising cost of pesticide usage remains a significant factor to be considered, as bio-fertilizers, organic fertilizers, and crop rotations might not provide sufficient soil nutrients [16]. The general public perceives that traditional cultivation involves higher pesticide residues, which not only contribute to obesity rates, food losses, and wastage but also elevate the risk of infant allergies and eczema [17], thereby posing food safety concerns. Therefore, reducing pesticide usage in traditional crop cultivation becomes imperative to ensure consumption safety [18]. Additionally, traditional agriculture requires more physical labor and entails greater exposure to chemical pesticides compared to organic farming. Consequently, due to concerns for their own health, employee health, and consumer well-being, an increasing number of traditional producers [19] are now less willing to engage in such cultivation practices. Lastly, as petroleum, natural gas, and coal serve as raw materials for fertilizer production, the cost of fertilizer inputs also rises when petroleum prices surge.
2.2.3. Integration of Socioeconomic Data
Economic profitability directly determines the global potential for sustainability in traditional agriculture, a fact of utmost significance. In the post-pandemic scenario, disruptions in food trade and increased dietary costs pose direct threats to the sustainability of the food system. Furthermore, slow economic development by various governments and the significant decline in rural populations contribute to a substantial reduction in food production quantities. Additionally, factors influencing profitability encompass but are not limited to production costs, product premiums, and the costs associated with acquiring non-renewable resources. While higher food prices present a major challenge for urban residents in resource-scarce developing countries or rural households, they may increase producer income and generate employment opportunities. Therefore, in this study, the selected key social aspects include import and export trade values, the value added in agriculture, forestry, and fishing sectors, population below food sufficiency, and the cost of staple food burden, among others.
Utilizing systemic thinking and analysis to assess the interactions within social–ecological systems represents the forefront of sustainability research. Network analysis has been extensively employed in the study of complex systems and serves as a holistic approach to explore the dynamic characteristics of social–ecological systems. It provides a clear visualization and conceptualization of the interactions between variables, as well as a comprehensive understanding of the trade-offs or synergies involved. A range of network centrality metrics, such as degree centrality, betweenness centrality, eigenvector centrality, and closeness centrality, can assess the importance of nodes in interaction networks, while network community detection can reveal clusters of strongly connected nodes within the interaction network. Thus, this paper employs the moving window method to calculate the strength of various factors in the social–ecological system. Subsequently, the computed results are integrated into the network to obtain values for unique indicators of network analysis, such as connectivity and modularity, to characterize the changes in factors within the social–ecological system under different food production capacities. Significantly, previous research has highlighted that global food security is influenced by income inequality, population growth, economic downturns, and government interventions. Taking this into consideration, this paper incorporates the aforementioned factors into the external challenges of food production, implying that the strength calculation using the moving window method is solely applied to the social–ecological system network. Finally, for ease of interpretation, the results of network analysis are visualized, as outlined in Section 2.4 and Section 2.5 for specific method descriptions.
2.3. Cluster Analysis
This paper employs cluster analysis to investigate the spatial variations in global food production and trade in the year 2020. Hierarchical clustering, a method of organizing clusters with high similarity through multiple iterative mergers, was utilized, repeating the process until the desired number of clusters was obtained. Stratified sampling is favored for its suitability and precision in representing the spatial traits of worldwide food supply across different hierarchical levels. Furthermore, these strata offer ample representativeness and are especially beneficial for conducting detailed spatial analyses of distinct features. Initially, the Euclidean distance between samples was computed, and then the hierarchical structure was established using the hclust function with Ward. D method in R software. Finally, the appropriate number of clusters was determined using the clusGap algorithm [20].
2.4. Moving Windows
The Pearson correlation coefficient is utilized to depict the interactions between social–ecological indicators and analyze the impact of increased local food production quantity or food trade on the social–ecological system dynamics [21]. In the analysis, positive values indicate synergistic interactions, while negative values indicate trade-offs, and the absolute value of the correlation coefficient represents the strength of the interactions. A total of 146 countries possess relatively comprehensive and complete datasets, arranged in an exponential gradient from lowest to highest. The primary aim of this study is to examine the influence of varying moving window sizes, comparing trends and inflection points in network metrics using window sizes ranging from 10 to 30. Due to the dependence of trade-off network modularity trends on the selection of window size, they have been excluded from this study. Employing a window size of 30 ensures that a network metric is not overly emphasized and aids in result interpretation. Finally, separate calculations have been conducted for positive (synergy) and negative (trade-off) correlations.
2.5. Network Analysis
For each window, the Pearson correlation coefficients are transformed into network graph objects, and the analysis is conducted using the igraph package in R. Within the network, each node represents 1 of the 16 internal factors that constitute the social–ecological system, and the links between any two nodes represent their positive/negative correlations and weights. Additionally, the connectivity and modularity of both the collaboration network and the trade-off network are determined. Connectivity is derived by calculating the ratio of the discussed links to all potential links in the network and is weighted based on the absolute value of the correlation coefficients. Furthermore, modularity is computed using the “cluster-walktrap” algorithm in igraph [22], which utilizes correlation coefficients as weights to separate densely connected subgraphs through random walks [21].
The use of two different network metrics provides distinct perspectives on the interactions between food production and the social–ecological system. High connectivity in the synergy network suggests that optimizing more social and ecological elements can be achieved simultaneously in the governance process. On the other hand, high connectivity in the trade-off network indicates that simultaneous optimization of global indicators is not feasible. In networks with high modularity, the social–ecological system is divided into isolated groups based on the connectivity of nodes. Nodes within the same group have tighter connections, leading to stronger interaction strength. Conversely, in networks with low modularity, the number of identifiable clusters is too few, and all nodes are closely connected globally, but the interaction strength between them is weaker than that within the same cluster.
Furthermore, this study collected data on per capita gross national income, gross domestic product, government expenditure, land area, and population size. The generalized additive model (GAM) was fitted using the mgcv package to assess the extent of impact of the selected external challenges on food security [23].To prevent undesirable biases in the curve, the fitting response is obtained by smoothing through the determination of the nature of k. To complement the network metrics, the weighted node degree (calculated as the product of node degree and the average strength of its connections to all other nodes, measured by the absolute correlation coefficients) is used to discern the strength of individual node behaviors within the context of the interaction network. Additionally, the cluster roaming algorithm in igraph is employed to compare the modular composition of different levels of cooperative networks and identify their module compositions. It is essential to emphasize that the existence and composition of modules in the network are independent of the network’s modularity value. Therefore, in all cases, individual modules can be easily identified, even if the modularity value is relatively low.
3. Results
3.1. The Spatial Distribution of Global Food Production
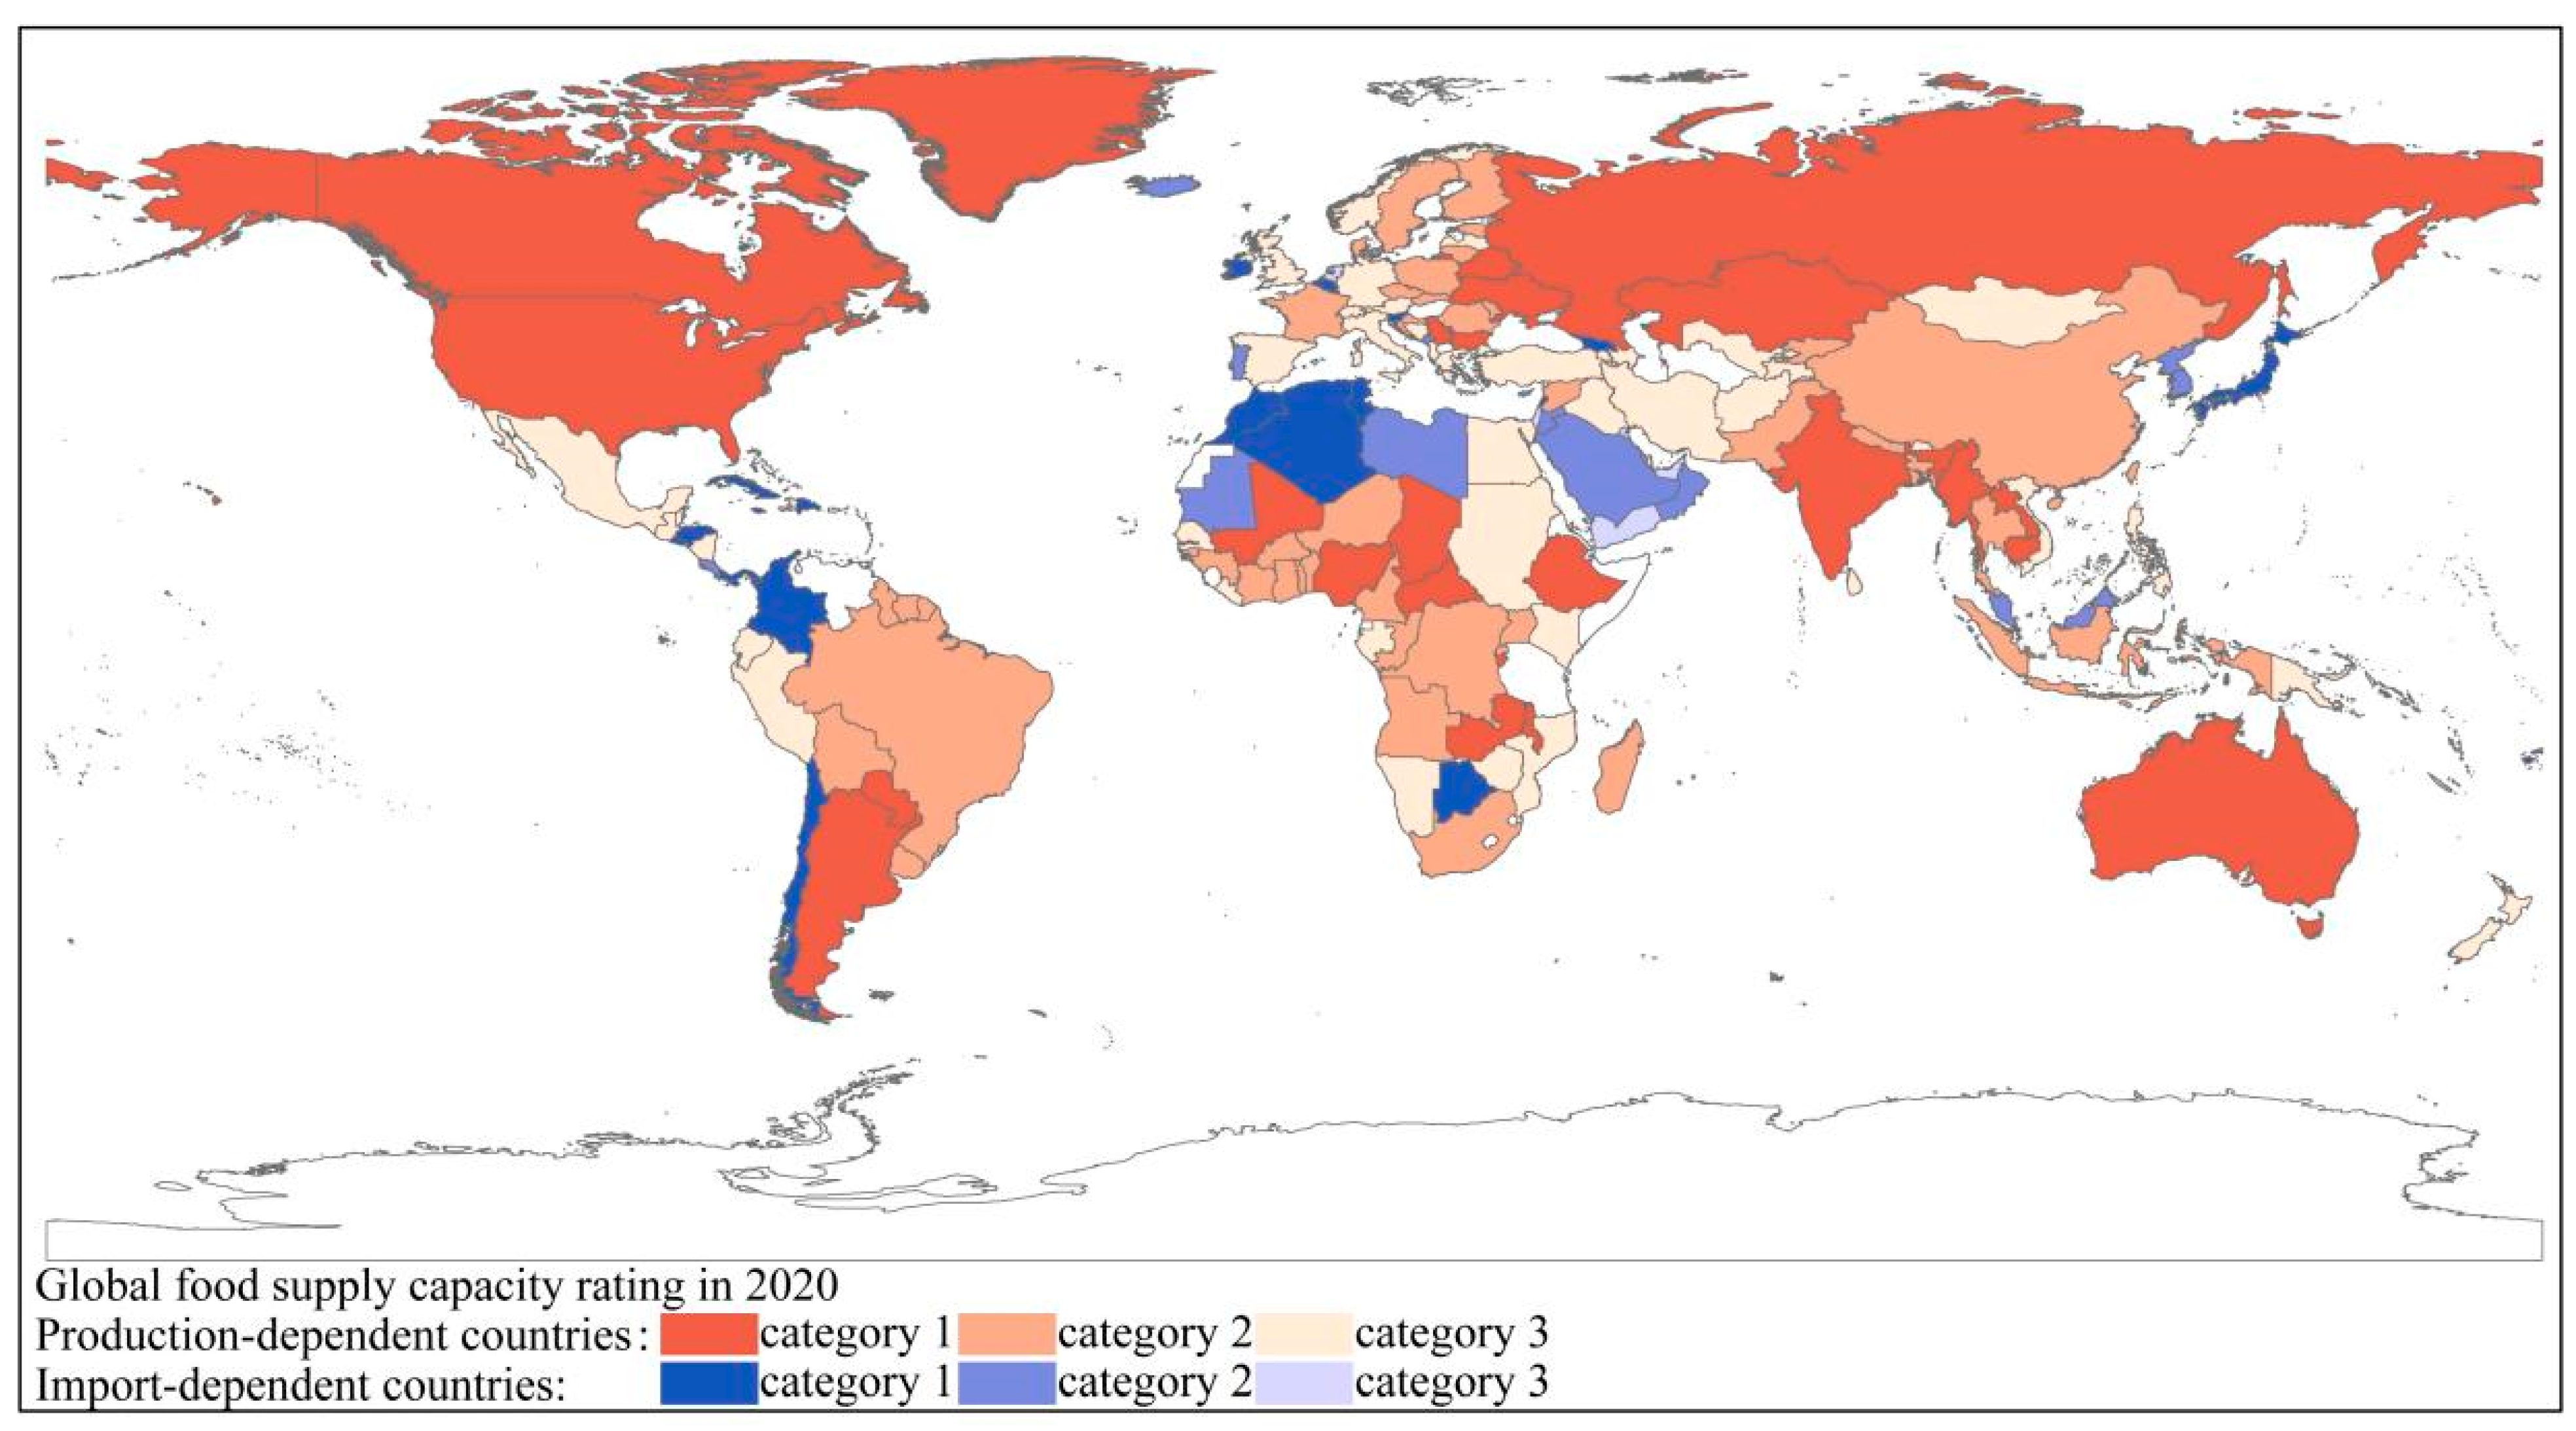
Due to significant variations in climate, labor force, arable land, and other resources across different regions of the world, spatial disparities in food supply and demand have arisen. This study reveals that globally, there are more production-dependent nations than import-dependent nations among all surveyed countries. The former primarily consist of coastal and inland countries, while the latter are predominantly island and peninsula nations (Figure 1). Specifically, countries with high global food production dependency include North American nations such as the United States and Canada, South American countries like Brazil and Argentina, Central African countries such as Nigeria, and Asian countries such as China, Australia, India, and Myanmar. This spatial distribution suggests a clear advantage in natural resources for countries with high levels of domestic food production. Conversely, countries with high import dependency are concentrated in East Asia, comprising Japan and South Korea, along with Middle Eastern countries like Saudi Arabia and Yemen, as well as North African nations such as Libya and Algeria. Additionally, island nations in the Gulf of Mexico and the Caribbean Sea demonstrate a significant reliance on imports. This striking contrast emphasizes that import-dependent countries often confront varying degrees of food shortages and generally have limited access to available arable land compared to production-dependent nations. However, it is crucial to note that not all import-dependent countries possess the capacity to import sufficient quantities of food. Beyond the aforementioned characteristics, this study also discovered a correlation between the spatial distribution of production-dependent countries and the land distance to a first-level country. For instance, this pattern is observed between Argentina and neighboring countries like Brazil, Bolivia, and Peru in South America, as well as between Central African and Asian nations.

Figure 1.
The spatial distribution characteristics of food production and trade. Source: Author’s own work.
3.2. Concentration Trends and Complexities of Social–Ecological Network
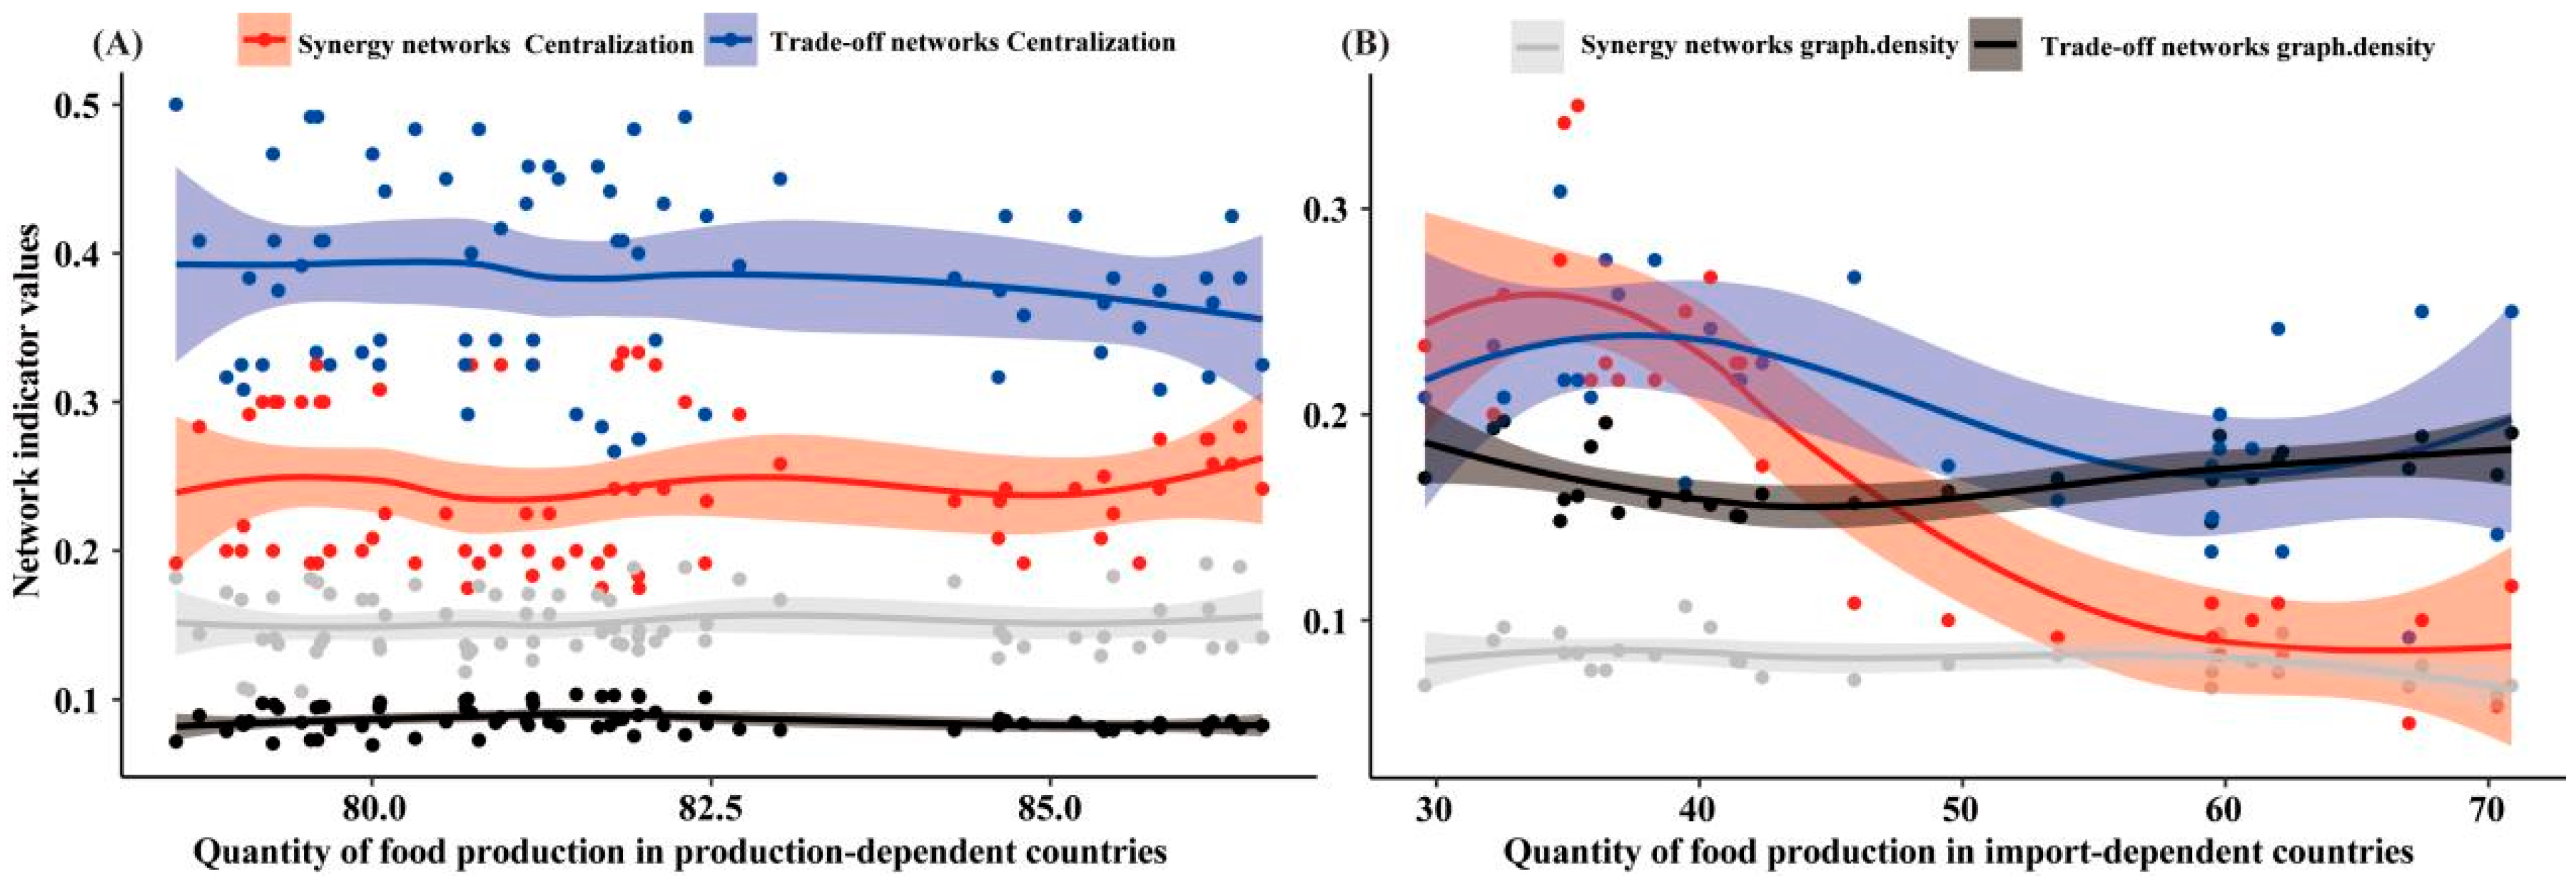
Figure 2A shows that the centrality of nodes in the trade-off network (0.3 < x < 0.4) for production-dependent countries is consistently higher than that of the synergy network (0.2 < x < 0.3). This suggests a greater concentration of interactions among internal factors within the trade-off network, resulting in tightly connected nodes. When one factor undergoes positive or negative changes, other nodes are more likely to respond sensitively and provide counteractive feedback, leading to adverse effects. Additionally, the synergy network density (0.1 < x < 0.2) for production-dependent countries consistently surpasses that of the trade-off network (0 < x < 0.1), indicating a higher level of complexity in interactions among nodes within the synergy network, leading to intricate variations.
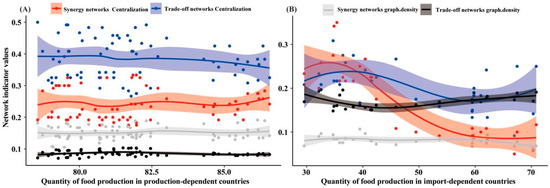
Figure 2.
Characteristics of Social–Ecological System Networks. (A): Production-dependent countries; (B): Import-dependent countries. Source: Author’s own work.
Import-dependent countries exhibit distinct characteristics, with the centrality of nodes within their networks showing an initial increase and then a subsequent decrease, and the synergy network centrality surpassing that of the trade-off network in the interval [24,25] (Figure 2B). Furthermore, the complexity of the network in import-dependent countries is opposite to that of production-dependent countries, as the complexity of interactions among nodes in the trade-off network consistently exceeds that of the synergy network. Figure 2 provides comprehensive evidence that, as domestic food production increases gradually across the globe, the nodes in the social–ecological system network tend to concentrate more within the trade-off network, but differences in the complexity of interactions still exist.
Import-dependent countries exhibit distinct characteristics. The centrality of nodes within their networks shows an initial increase and then a subsequent decrease, with the synergy network centrality surpassing that of the trade-off network in the interval [24,25] (Figure 2B). Furthermore, the complexity of the network in import-dependent countries is opposite to that of production-dependent countries. The complexity of interactions among nodes in the trade-off network consistently exceeds that of the synergy network. Figure 2 provides comprehensive evidence that, as domestic food production increases gradually across the globe, the nodes in the social–ecological system network tend to concentrate more within the trade-off network. However, differences in the complexity of interactions still exist.
3.3. The Response Patterns of the Social–Ecological System Network to Food Production
To quantify the strength of social–ecological system interactions and consider the network’s systemic and complex nature, this study explores connectivity and modularity patterns concerning food production capacity evolution. Figure 3 illustrates significant impacts of food production quantity on the social–ecological system network, revealing response variations. Figure 3A indicates reduced stability in the system network for production-dependent countries as food production quantity increases. Controlling for GDP, per capita income, total land area, and national population, Figure 3C displays complex nonlinear response changes for import-dependent countries. The decline in synergy network connectivity suggests increasing challenges in achieving simultaneous development among multiple nodes. Notably, Figure 3A presents trends and magnitudes of connectivity changes, without explicitly displaying actual values. Furthermore, Figure 3A shows that the synergy network connectivity increases from 0.25 to a peak of 0.275, then declines to 0.2. Conversely, the overall connectivity of the trade-off network decreases as food production capacity rises, with the decline rate gradually accelerating. When the food production score reaches 83, there is a brief increase in connectivity, followed by a rapid decrease, indicating a diminishing possibility of achieving simultaneous development among all nodes, with a slight increase, and then a continuous decrease. Combining Figure 3A and 3E, it is observed that production-dependent countries face increasing challenges in achieving multi-objective coordinated development as local food production quantity rises or import food quantity declines. This may be attributed to countries with higher domestic food supply capacity finding it more challenging to balance social and ecological benefits. Similar connectivity trends are observed in import-dependent countries (Figure 3C), with an initial increase followed by a decrease, but with differing rates of change. In contrast, the trade-off network exhibits an opposite trend (Figure 3D), with an initial decline and subsequent increase as food production quantity increases.
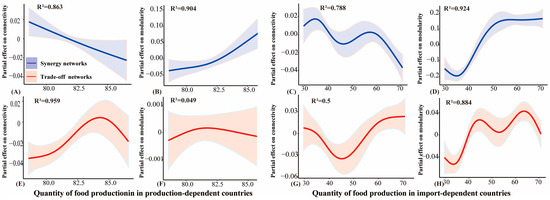
Figure 3.
The impact of food production capacity on the social–ecological system network. (A): Partial effect on connectivity in Synergy networks (Production-dependent countries); (B): Partial effect on modularity in Synergy networks (Production-dependent countries); (C): Partial effect on connectivity in Synergy networks (Import-dependent countries); (D): Partial effect on modularity in Synergy networks (Import-dependent countries); (E): Partial effect on connectivity in Trade-off networks (Production-dependent countries); (F): Partial effect on modularity in Trade-off networks (Production-dependent countries); (G): Partial effect on connectivity in Trade-off networks (Import-dependent countries); (H): Partial effect on modularity in Trade-off networks (Import-dependent countries). Source: Author’s own work.
Both types of countries show a pattern of modularity in their synergy networks (Figure 3E,G). Initially, the modularity decreases, leading to a more closely interconnected state compared to the initial network. During this decrease, global social, ecological, and economic factors interact more closely. Conversely, during the modularity increase, nodes in the social–ecological system network form isolated groups based on their connections, with stronger interactions within these groups, resulting in reduced overall network cohesion. The modularity of the trade-off network in production-dependent countries also changes with varying window sizes (Figure 3F), but it is not further analyzed. Additionally, Figure 3 only shows the trends in modularity changes without specifying the node connection status, necessitating supplementary explanations about modularity in Section 3.5.
3.4. The Strength of Interactions among Nodes in the Social–Ecological System Network
The quantity of food production influences the connections between highly interconnected nodes (referred to as hubs) and other nodes in the social–ecological system network, significantly impacting node weights within the social and ecological domains. Notably, the mechanisms driving these effects differ across each domain. In the synergy network of production-dependent countries, most nodes remain relatively stable, with rural population maintaining strong connections with other nodes throughout the entire network (Figure 4). With increasing food production quantity, the strength of the food shortage node decreases, while government agricultural expenditure and import trade nodes experience an initial slight decrease followed by a substantial increase (Figure 4A). This dominance of certain nodes in the social–ecological system implies that other nodes will experience varying degrees of improvement based on import trade development. The changes in connectivity strength between internal nodes of the trade-off network surpass those within the synergy network (Figure 4C). Specifically, a rise in the cost of a healthy diet significantly weakens the capacity to achieve goals like reducing food shortages and increasing rural population. Similar situations occur with other factors, but the strengths of offsetting effects vary. In countries with high domestic food production, the significance of government agricultural expenditure and value added from agriculture, forestry, and fisheries in the trade-off network diminish. Within the ecological domain, synergizing greenhouse gas emissions and climate change proves challenging, and changes in these nodes are more likely to generate offsetting effects on the development of other nodes (Figure 4B,D).
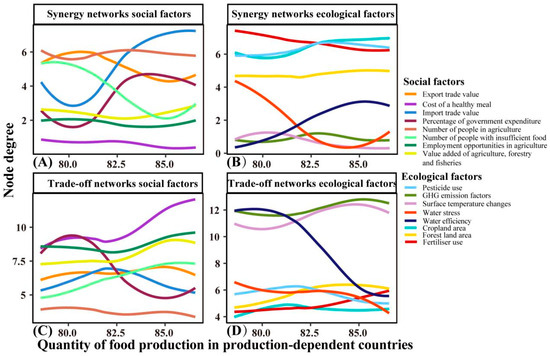
Figure 4.
Node strength in the production-dependent system network. (A): Synergy networks social factors; (B): Synergy networks ecological factors; (C): Trade-off networks social factors; (D): Trade-off networks ecological factors. Source: Author’s own work.
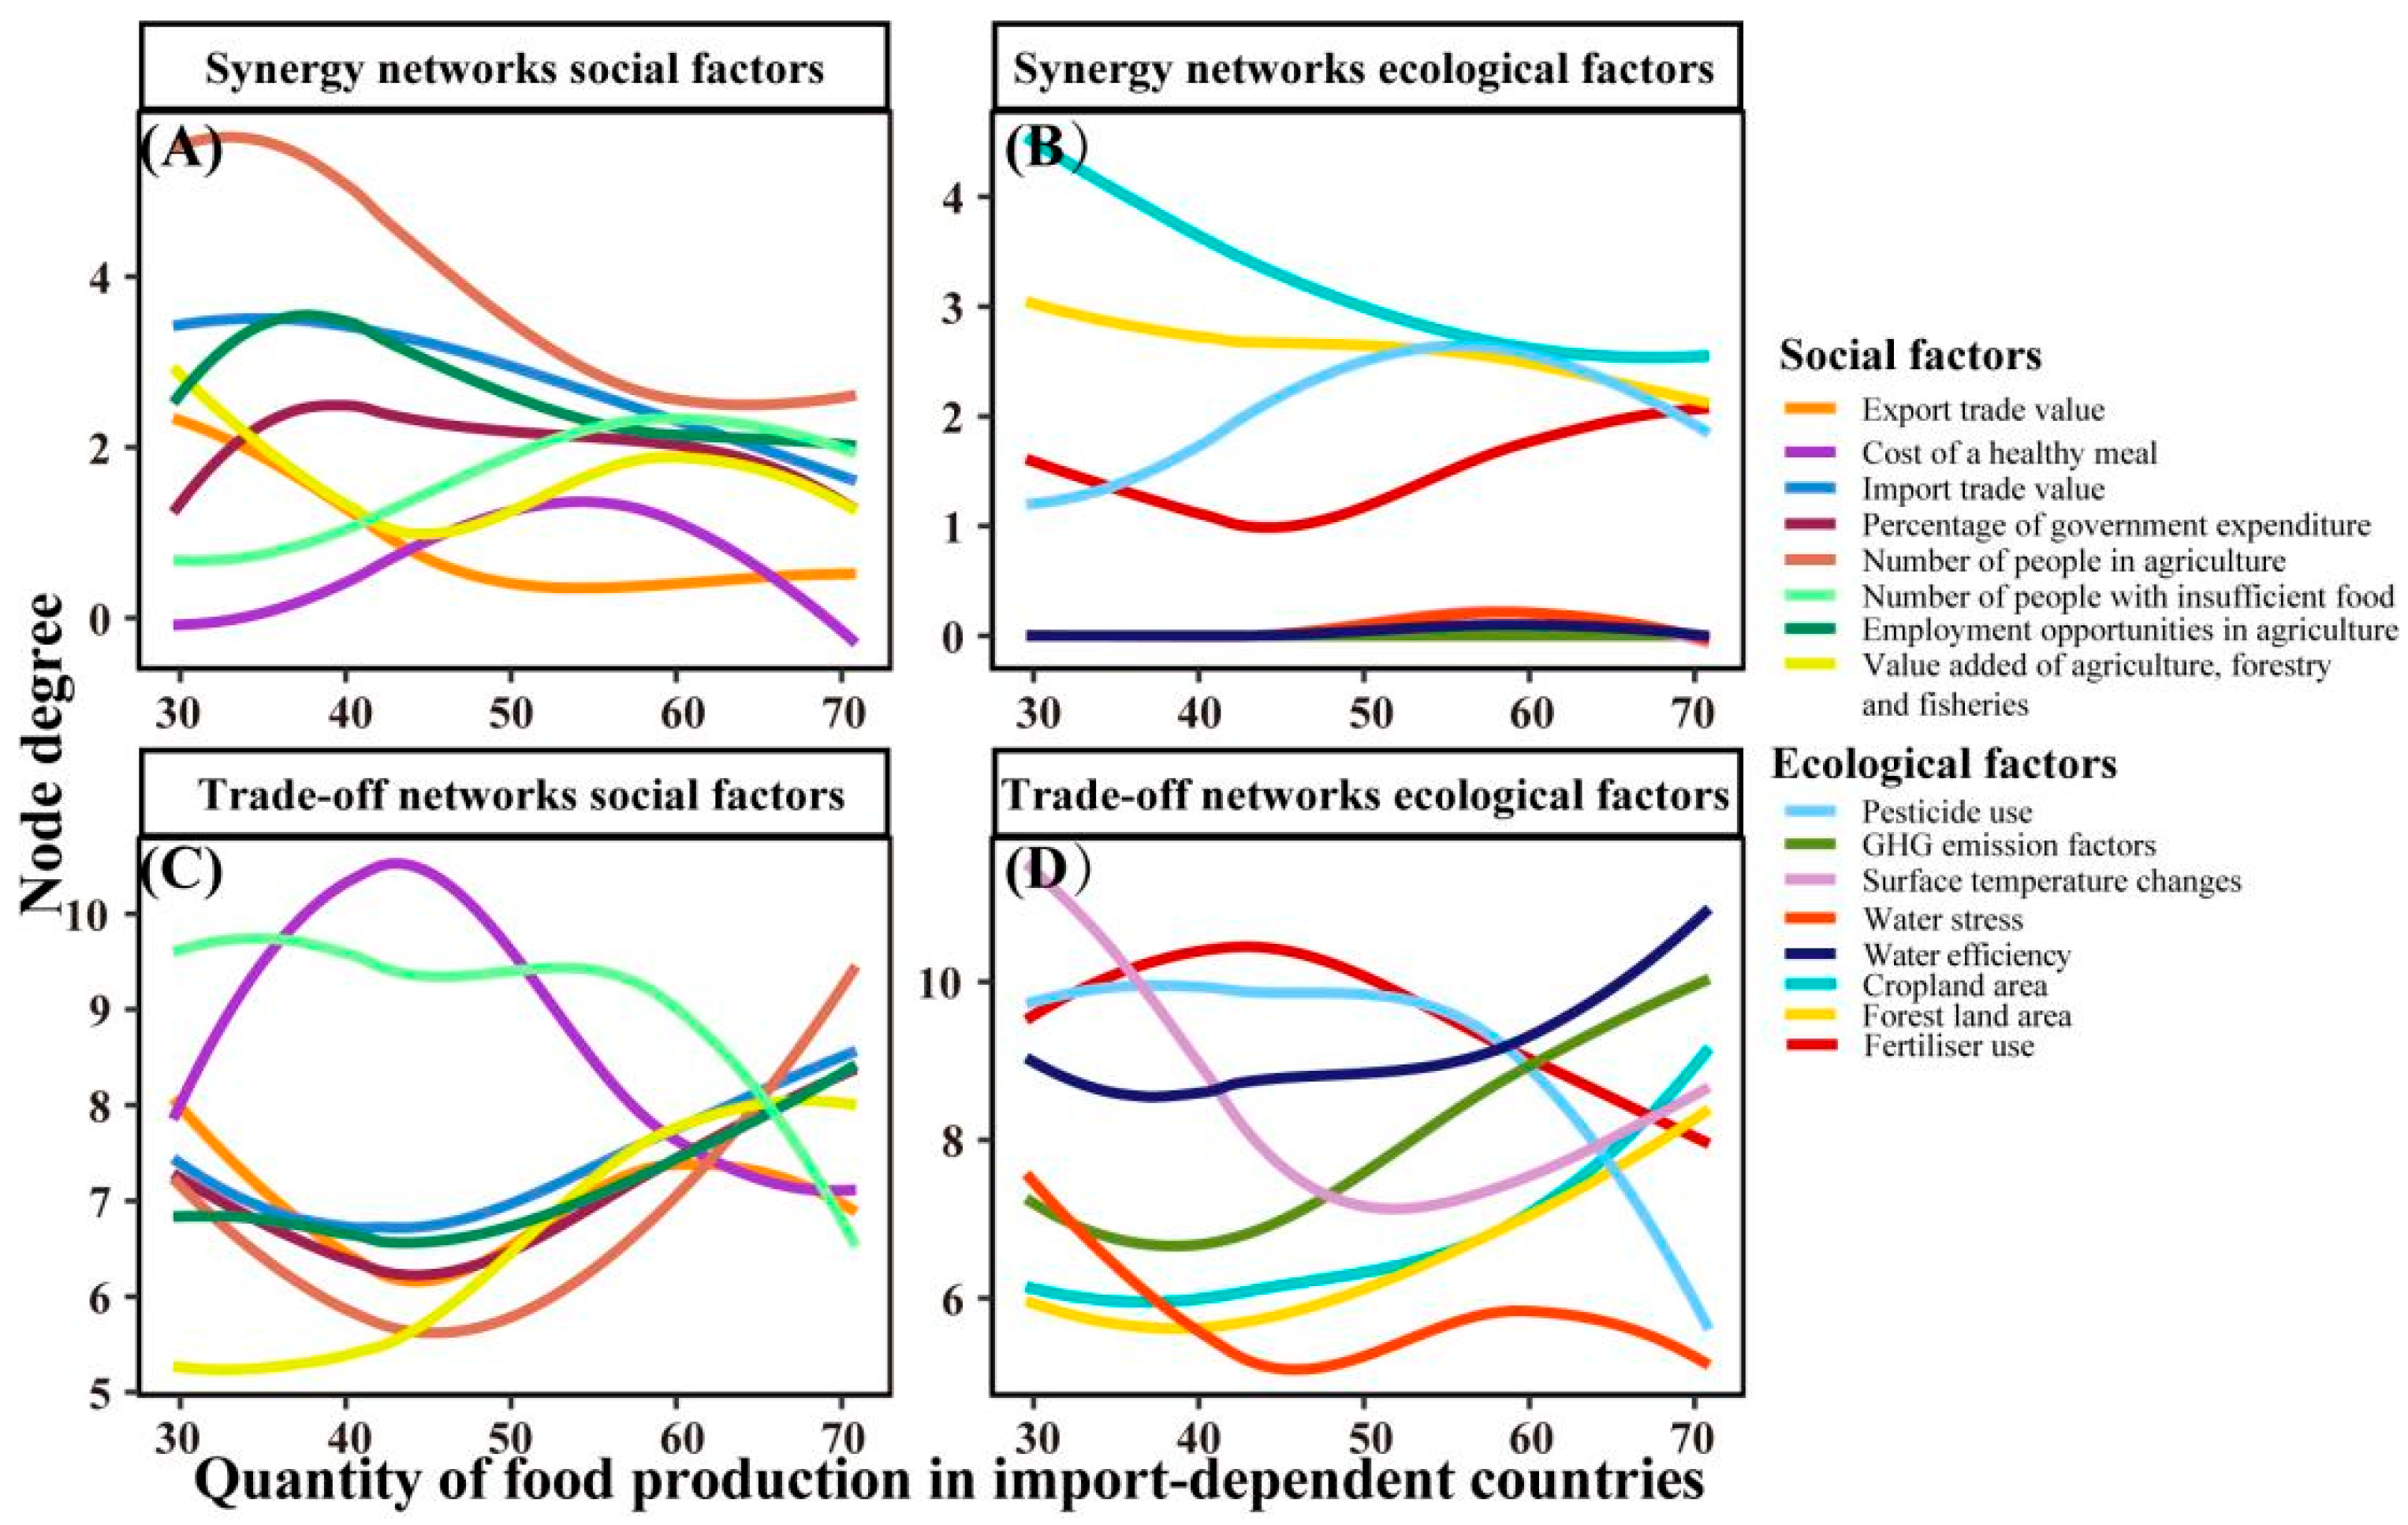
When domestic food production capacity is low, import-dependent countries show significant variations in the connectivity strength of nodes within the social system (Figure 5). Economic nodes, such as agriculture, forestry, and fisheries value, import trade, and government agricultural expenditure, exhibit higher strengths compared to social nodes. However, as food production quantity increases to high levels, except for the healthy diet cost and export trade, other node connectivity strengths become similar, indicating their equal importance in the social system and their role in driving overall system development. Moreover, in the trade-off network, as the strength of economic factors decreases, the capacity to offset the increase in system stability gradually diminishes. In the ecological domain, most nodes demonstrate a trend of decreasing and then increasing connectivity strength.
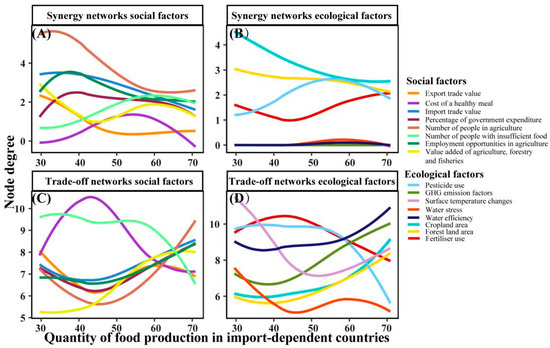
Figure 5.
Node strength in the import-dependent system network. (A): Synergy networks social factors; (B): Synergy networks ecological factors; (C): Trade-off networks social factors; (D): Trade-off networks ecological factors. Source: Author’s own work.
3.5. The Connectivity Status of Nodes in the Social–Ecological System Network
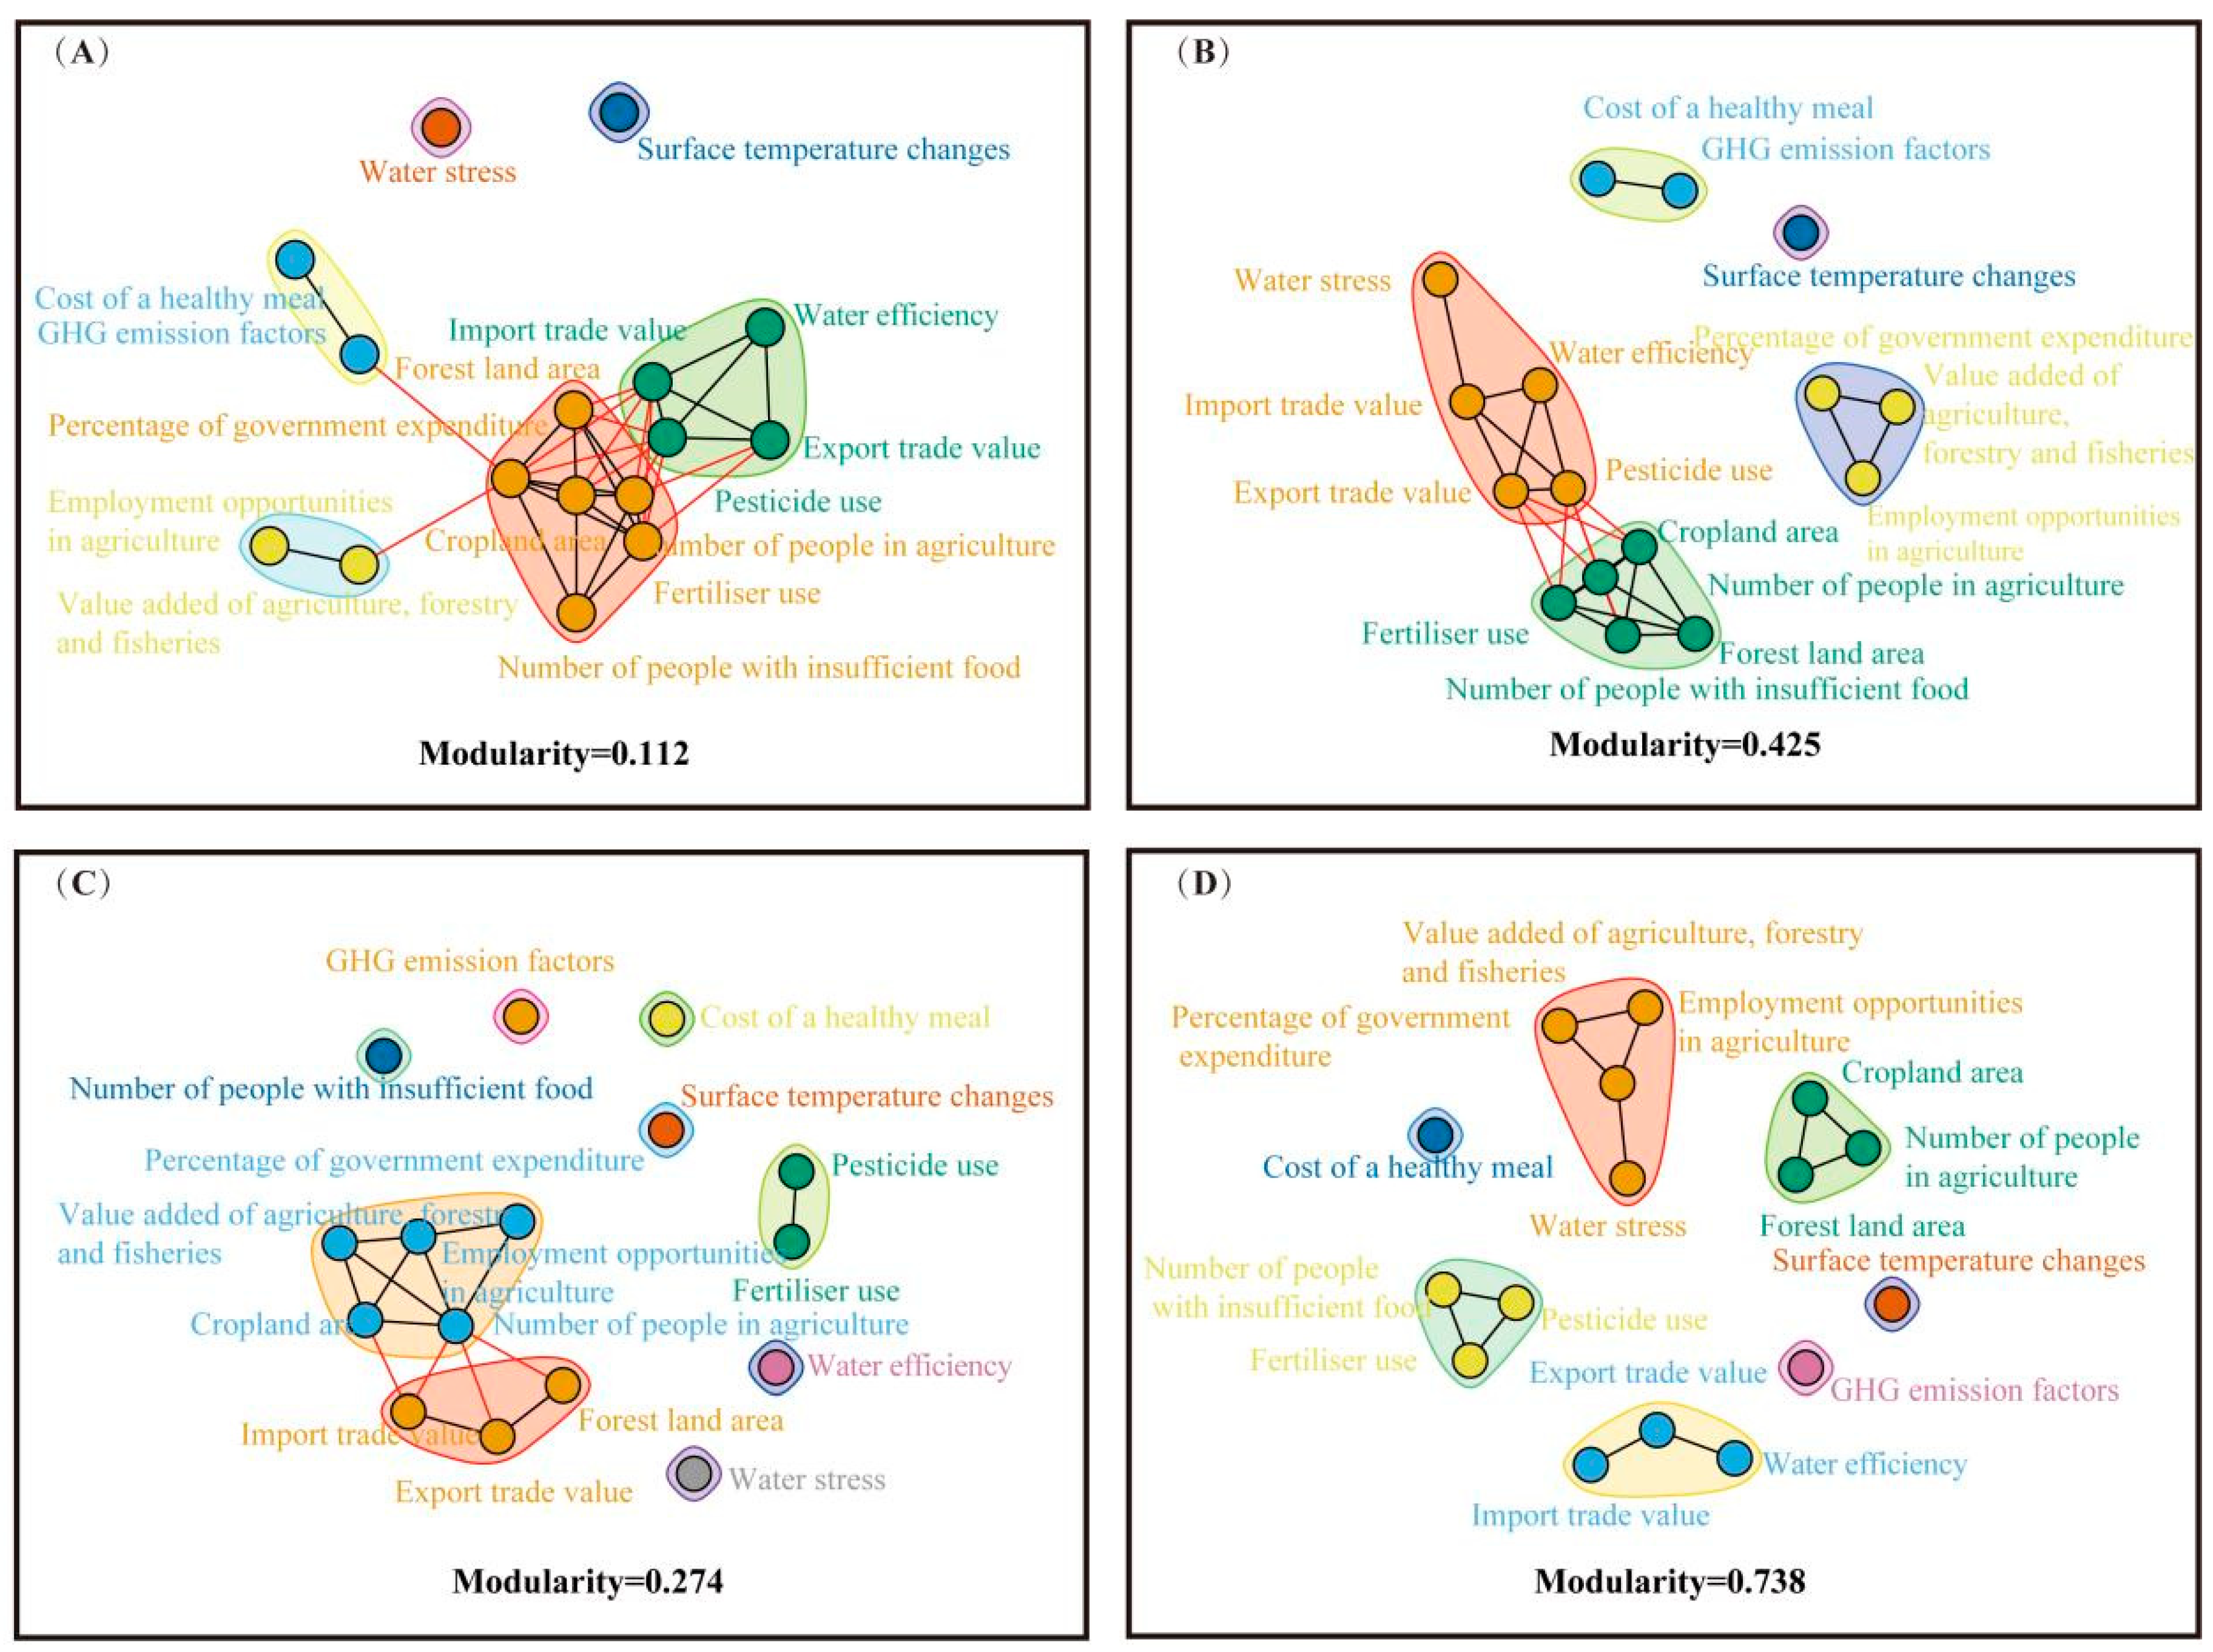
As food production quantity increases, the modularity of the social–ecological system enhances. Figure 6 demonstrates the varying relationship between food production quantity and modularity in the synergy network of different countries. In Figure 6A, water resource pressure is integrated into a cluster consisting of “water use efficiency-import trade-export trade-pesticide use”, while government agricultural expenditure separates from this cluster and joins the “agricultural employment-agriculture, forestry, and fisheries value” cluster. Compared to Figure 6A, Figure 6B exhibits higher modularity in the form of clusters, facilitating stronger interactions among factors within these clusters and promoting synergistic effects. In import-dependent countries, node connections undergo more pronounced changes, with the addition of a new cluster and an increase in the size of other clusters. Specifically, in Figure 6C, the positive impacts of reducing food shortages, improving water use efficiency, and lowering water resource pressure need to be distributed to global nodes based on the strength of node connections, offering relatively limited assistance to overall goal achievement. However, in Figure 6D, after these three nodes are integrated into a cluster, their positive impacts are primarily shared within the cluster, and then the higher-level cluster strength further drives overall development, maximizing synergistic benefits. Moreover, in high-modularity system networks, the climate change node in the synergy network of production-dependent countries is not integrated into any cluster. Similarly, in import-dependent countries, the nodes related to health diet, greenhouse gas emissions, and climate change also struggle to be part of any cluster. This indicates that these nodes are expected to receive relatively fewer benefits and make slower progress in future collaborative governance toward the goals set by the clusters within the system network.
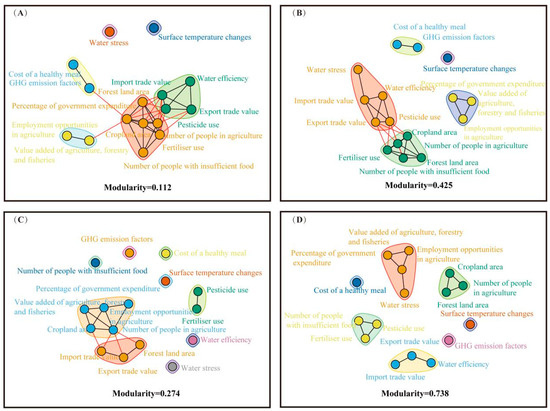
Figure 6.
Module composition structure. (A): Low modularity in the production-dependent system network. (B): High modularity in the production-dependent system network. (C): Low modularity in the import-dependent system network. (D): High modularity in the import-dependent system network. Source: Author’s own work.
4. Discussion
The constraints of limited food supply sources, coupled with the escalating impacts of climate change induced by global warming and other disturbances, are increasingly posing significant threats to food security. Whether in the present or the future, the approach to food supply serves as a starting point for addressing societal stability, economic growth, and ecological restoration. Confronting the intricate dynamics of the socio-ecological system, analyzing the diverse origins of worldwide food supply offers fresh perspectives in resolving the complexities of this system. To address this, the study uncovers distinct stability patterns within the socio-ecological system, as countries reliant on domestic production or imports experience varying trajectories in food quantity increase. Moreover, consistent connectivity patterns emerge among internal system nodes, characterized by similar structural clustering. Hence, this research extensively explores these fluctuation and connectivity trends, taking a cluster-based approach to provide scientific guidance for ensuring food security.
4.1. Global Disparities in the Vulnerability of Food-Producing Nations
The global-scale spatial characteristics of food production have received relatively limited research attention in the past. Figure 1 presents the passive approach of import-dependent countries towards ensuring their food security, while island nations increasingly rely on imports, leading to a decline in their domestic food sovereignty. Drawing from the primary modes of food supply in different nations, this study unveils clear spatial distribution patterns in global food provision. These patterns partially align with existing research outcomes. Remarkably, the study underscores that countries reliant on imports for their food supply display heightened instability in this domain. Earlier investigations, which concentrated on smaller Pacific Island nations, provided empirical evidence showcasing the susceptibility and increased risk linked to food import trade. Pacific Island nations and countries like South Korea and Japan exhibit a growing dependence on grain imports from Southeast Asia and Australia, including highly processed food products. Recent research [26] indicates that this reliance is triggering a transformation in the Pacific region’s dietary systems, shifting from nutritionally diverse pre-European food systems to sustained nutrition types based on imported processed foods, which contributes to the rise of non-communicable diseases. Furthermore, island nations face a vexing challenge in providing locally produced food at competitive and affordable prices compared to imports. Localized studies have indicated that import-dependent countries encounter numerous obstacles to food production due to unfavorable climate conditions, limited available land area, and pest threats [27]. Moreover, the COVID-19 pandemic has significantly reduced tourism income, which many island and peninsular nations heavily rely on for their livelihoods. Additionally, the Russia–Ukraine conflict has disrupted the international market balance for commodities like wheat, fertilizers, and fuel. Consequently, import-dependent countries grapple with the pressing issue of increasing domestic production and effectively responding to the escalating global impacts.
Production-dependent regions encompass countries with low, middle, and high-income levels, leading to diverse implementations of agricultural technologies. However, the adoption of transformative technologies is somewhat restricted by varying market regulatory mechanisms, market access principles, and market demands across these countries. Currently, the primary challenge for production-dependent countries lies in the lack of sufficient driving forces to transform their agricultural systems. Merely reducing food waste and transitioning dietary patterns, without qualitative advancements in agricultural technologies, will not adequately meet future domestic food demands. In the past, certain technological innovations have benefited agriculture. However, some studies have also noted environmental and health deterioration resulting from these innovations. Moreover, the adoption of technological advancements by producers significantly impacts food production development. Knowledge-intensive agricultural systems demand highly skilled individuals who can learn on-the-go during the production process. This may create challenges for farmers in low-income countries or with limited education [28]. In conclusion, this paper uncovers that the stability of the macroeconomic environment poses further challenges to institutional innovation in production-dependent countries. The instability in the financial environment presents further challenges to innovation in production-dependent countries’ systems. The global financial environment has been volatile since the 2008 financial crisis, and technological innovation demands stable and long-term funding. As a result, the insufficient driving force for agricultural system upgrades in production-dependent countries significantly impedes the global development of food production.
4.2. Global Warming Poses Supply Risks to Food Production
Section 3.1 has already revealed the primary spatial characteristics of global food production distribution. For scenario simulations, the study areas selected include the Middle East and Africa, Asia, Latin America, and Eastern Europe. Additionally, the climate change and greenhouse gas emission nodes, which tend to exhibit stronger trade-off effects and have difficulty integrating into clusters under high modularity in the social-ecological system network, are quantitatively evaluated for their impacts on food security using SSP scenarios. The analysis comprises SSP1 (sustainable development) and SSP2 (middle-of-the-road) scenarios, with SSP1-26 representing a temperature change scenario below 2 °C and SSP2-45 representing a scenario around 3 °C of global warming. These scenarios are used to simulate the changes in global food supply and demand under future warming conditions.
Despite variations in the magnitude of future global warming, all scenarios show a trend of rapid increase followed by a gradual decline in food supply and demand. Between 2060 and 2100, some regions experience negative growth in food production and demand. By 2100, due to global warming, food production in Asia is projected to decrease by 1.3% to 7.0%, Latin America may witness a yield change of 2.0% to 4.5%, and the Middle East and Africa could see an increase of 3.99% to 5.5%. In contrast, Eastern Europe’s food production is estimated to decline by 2.2% to 4.2%. Additionally, the future food demand in the Middle East and Africa is higher than in other regions. While other regions may experience negative growth in food demand, Africa is still projected to have an increase of 4% to 4.8%. This implies that without timely intervention measures, food production could threaten future food security in the Middle East and Africa. Considering these potential environmental changes, it is essential to adopt comprehensive approaches to enhance crop production stability. This includes developing climate-adaptive crop varieties [29] and implementing practices to minimize the impact of environmental fluctuations on crop yields.
4.3. “Clustered Development” Mitigates Social–Ecological Trade-Offs
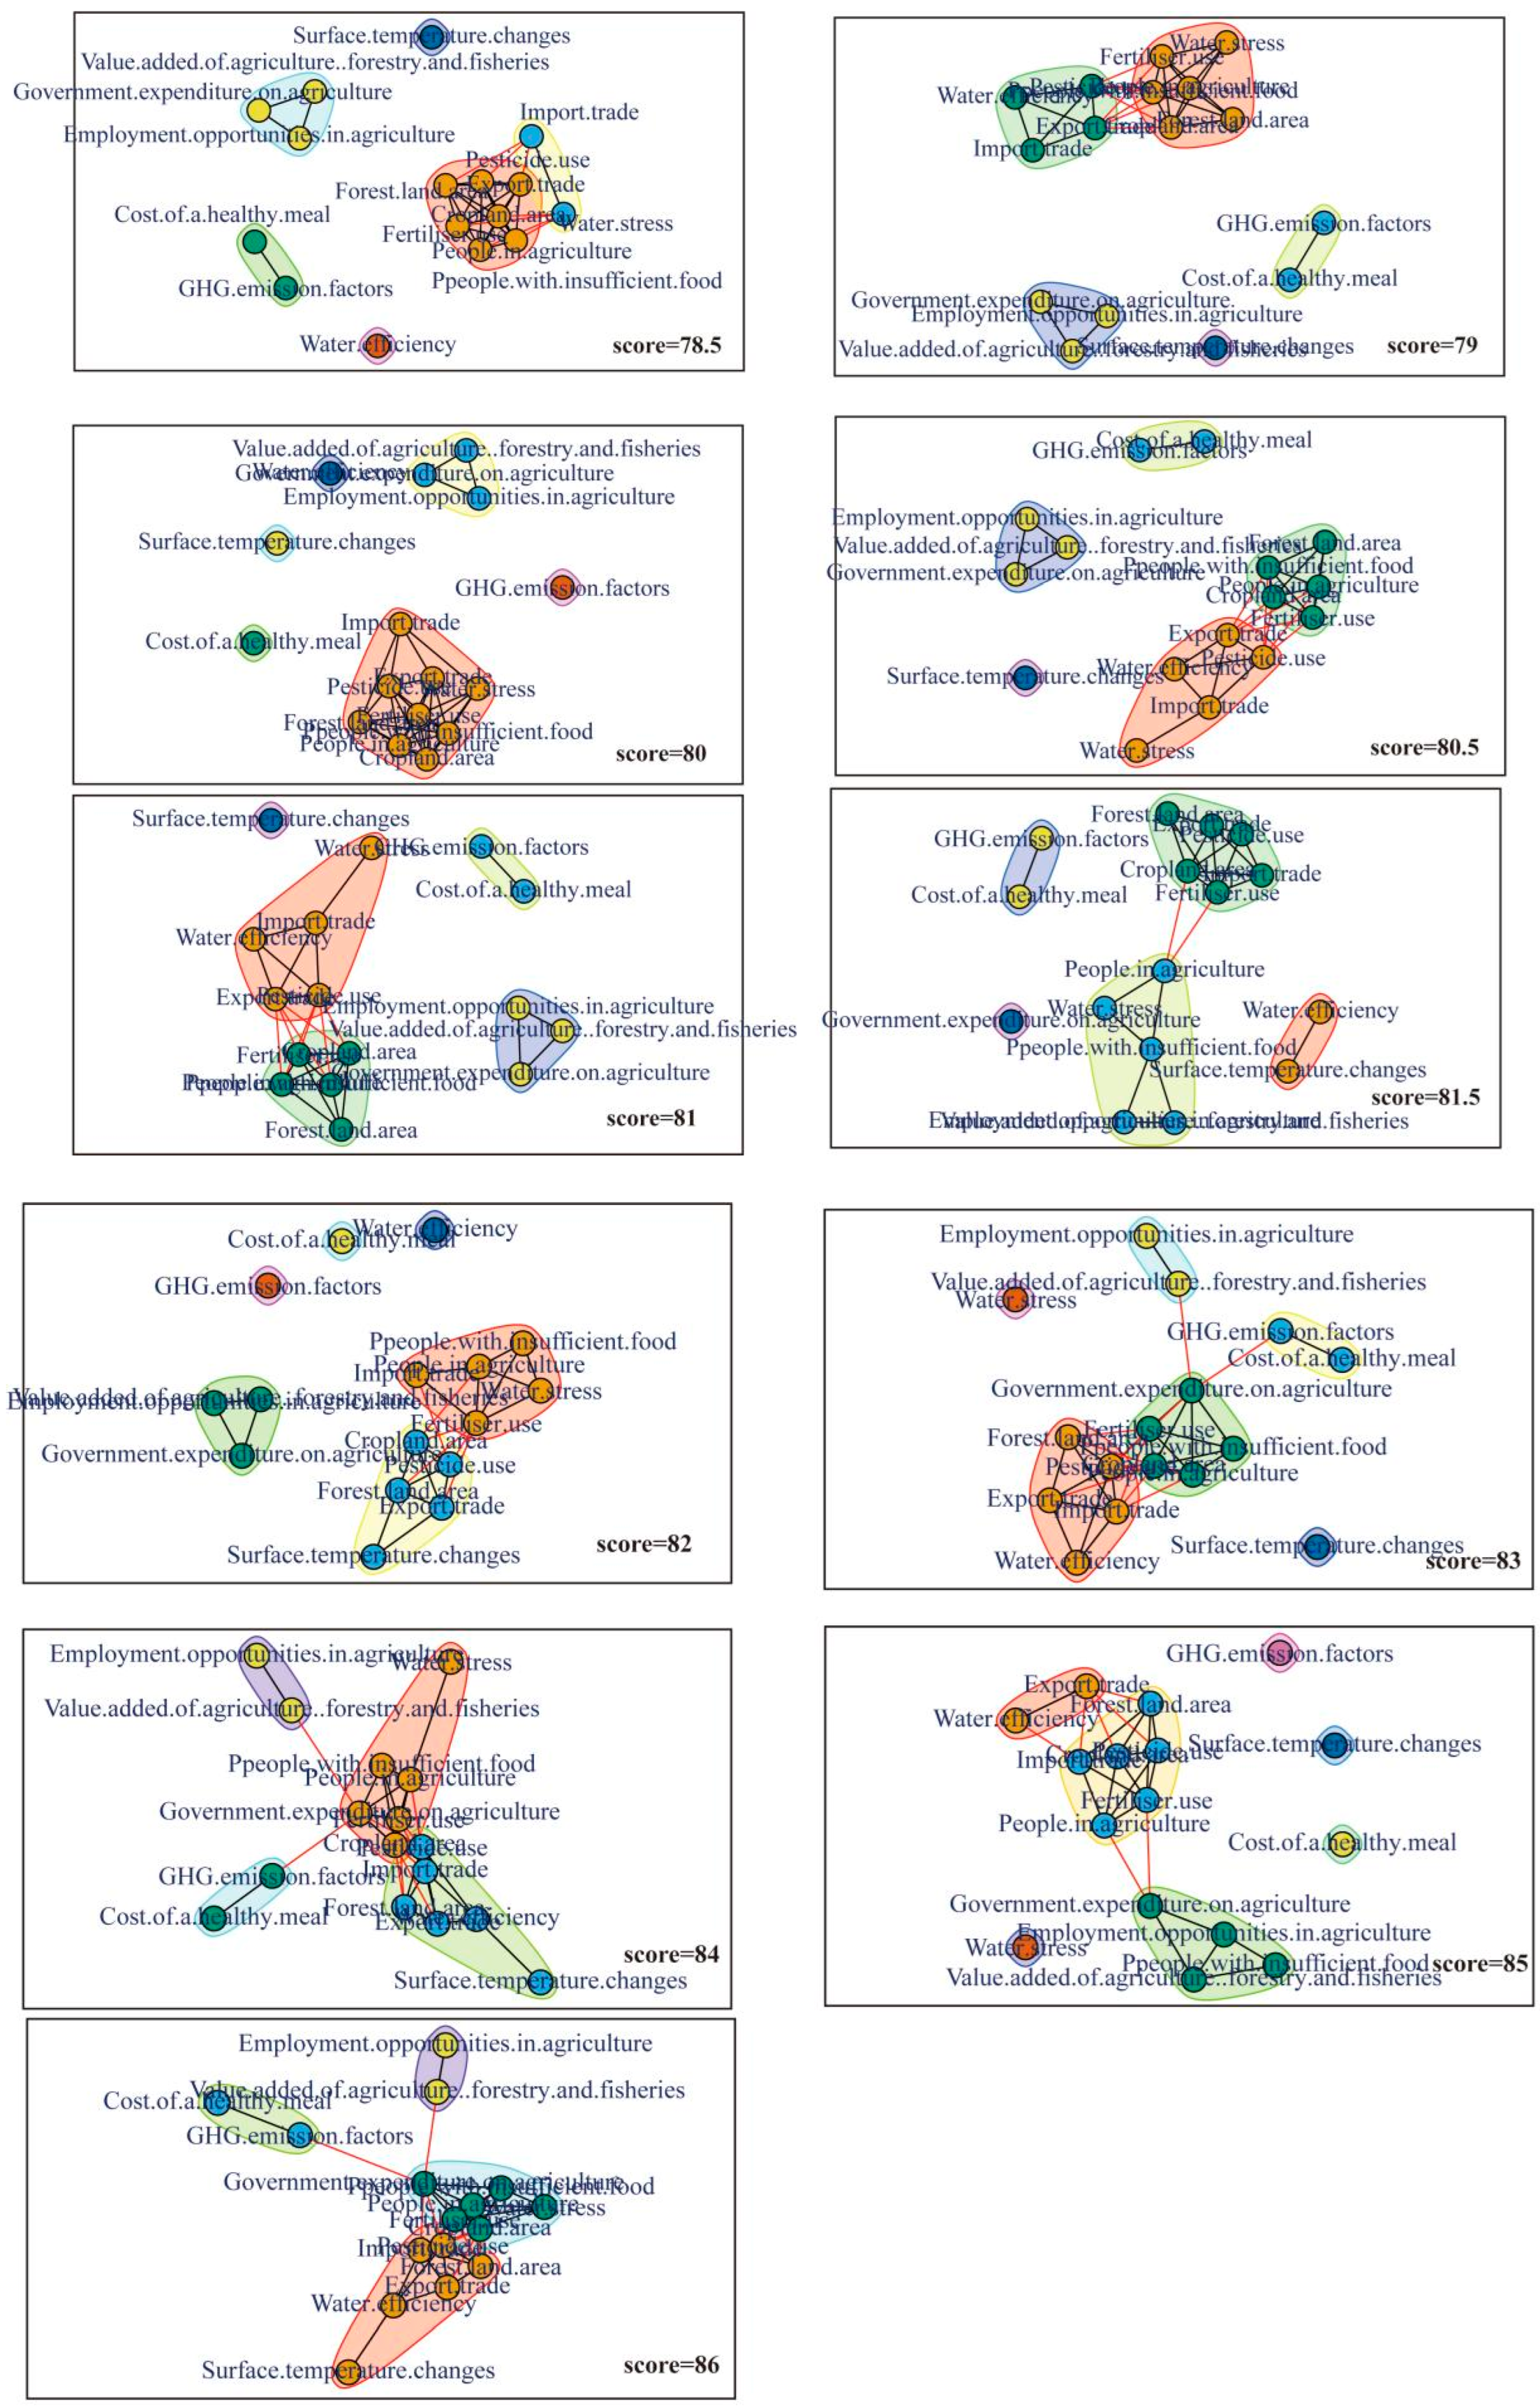
In comparison to previous studies, this research introduces a novel approach by utilizing systemic network applications within the social–ecological system. It aims to enhance cluster modules from a comprehensive standpoint, moving beyond the isolated consideration of individual elements. This innovative method effectively reduces the potential negative impacts of module development on other elements, thereby optimizing collaborative synergies at an advanced level. This study explores the rise in modularity within the social–ecological system network, which results in stronger connections among nodes within clusters. Building upon the node strength (Section 3.4) and modularity characteristics (Section 3.5), we identify various connection states based on the similarities of clusters under different food production scenarios (Figure A1). The primary goal is to prioritize governance measures for nodes within clusters to foster global effects. These findings provide valuable insights for comprehensive policy interventions.
4.3.1. Rural Financial Support
By enhancing the macroeconomic cluster centered around “government agricultural expenditure-Value added of agriculture, forestry and fisheries” we can increase rural employment opportunities and reduce food insecurity. Improving targeted agricultural policy support involves the following key steps:
- 1.
- Increasing national agricultural subsidies.
- 2.
- Expanding the range of subsidized agricultural activities.
- 3.
- Incorporating environmentally oriented incentives into subsidy mechanisms.
- 4.
- Creating a public agricultural reserve.
From 2000 to the present, countries have demonstrated a relatively stable growth in total agricultural support. Developed countries, in general, maintain certain advantages in the intensity and stability of agricultural support compared to developing countries [30]. In response to the impact of global agricultural product price fluctuations, effective measures to tackle rural labor outflow and boost rural employment opportunities involve strengthening policy support for agricultural producers. This support can be achieved through targeted subsidies for farmers and specific agricultural products, which may include compensation for losses, comprehensive agricultural input subsidies, and agricultural credit assistance. However, concerning agricultural public service policies, there has been a significant decrease in comprehensive support for rural services among countries. This trend suggests a reduced level of market intervention in agricultural policies worldwide, except in China. Furthermore, agricultural policy support should encompass more than just price-based measures. It is crucial to broaden the scope of agricultural subsidies and focus on enhancing environmental considerations through linked subsidies. For instance, developed economies have implemented subsidies for crop insurance [31], incentives to promote environmental quality, and multifunctionality in agriculture [30] as measures to mitigate the environmental impact of fertilizers and pesticides. These efforts contribute to the comprehensive development of the social–ecological system. Finally, in countries with large populations or substantial future food production needs, governments can ensure food security and social stability by creating agricultural public reserves. These reserves aim to reduce the number of food-insecure individuals.
4.3.2. Synergistic Human–Land Coupling Relationship
Enhancing harmonizing human–land relationships involves addressing socio-agricultural issues through a resource-based cluster that considers “cropland area-forest land area-rural population”. Based on this cluster module, the paper proposes strategies to address the current challenges in agricultural development by emphasizing the significance of cultivated and forested land areas. Specific measures include:
- 1.
- Differentiating between land designated for planting and that for harvesting.
- 2.
- Securing specific land for cultivating cereal crops.
- 3.
- Drawing in young labor for agricultural production and strengthening agricultural education and training.
Some studies focus mainly on societal and ecological responses to production quantity, overlooking the direct impact of cultivation area and harvested area on production stability. Recent research highlights the significant effects of variations in cultivation area and harvested area on grain yields in the United States [24]. Additionally, from 1992 to 2015, global food production did not show a linear correlation with changes in arable land area, indicating that merely setting a threshold for arable land conservation may not ensure food security. Hence, governments should conduct further investigations into the relationship between harvested area and food production to develop more scientifically accurate support strategies [32]. With advancements in agricultural mechanization, irrigation, and fertilizer technologies, the growth rate of grain harvest areas has accelerated. Producers now prefer cultivating economically viable crops with shorter growth cycles. This underscores the importance for governments to prioritize ensuring the cultivation of food crops as a vital measure to guarantee food security. Furthermore, the global aging population exacerbates labor shortages and hinders innovation in labor-intensive countries [33]. This situation necessitates that government authorities consider strategies to attract young people to engage in agricultural work, enhance agricultural education and training, and expand agricultural production scale. It is crucial to avoid smaller agricultural production scales as they may lead to wastage of agricultural equipment and resources [34].
4.3.3. Shifting from Conventional Agricultural System Patterns
To optimize agricultural production technologies and address the comprehensive ecological challenges in agriculture, a production factor-oriented cluster can be structured based on “export trade-water use efficiency”. This cluster can be integrated with nodes representing import trade, pesticide usage, or other production inputs. Drawing on existing research and observing the changing trends in future food demand (as shown in Figure 7), This study advocates enhancing water use efficiency and boosting agricultural product export trade through transitioning to organic farming. As global food production and demand are expected to decline from 2040 to 2100, transitioning to sustainable agricultural production methods becomes crucial. Although organic agriculture may have certain drawbacks in crop yields compared to conventional agriculture, it has demonstrated superior performance in addressing external challenges such as agricultural pollution, food waste, greenhouse gas emissions, and climate change. During the process of organic agriculture expansion, organic producers will encounter pressures on agricultural ecosystems. They will need to address ecological issues like soil eutrophication, soil compaction, declining land productivity, and heavy metal residues [35,36,37]. Moreover, organic agriculture, by rejecting the use of conventional pesticides and adopting sustainable pest protection measures, can effectively enhance soil fertility and biodiversity. It also represents a significant pathway in alignment with the global carbon reduction trend [38,39,40].
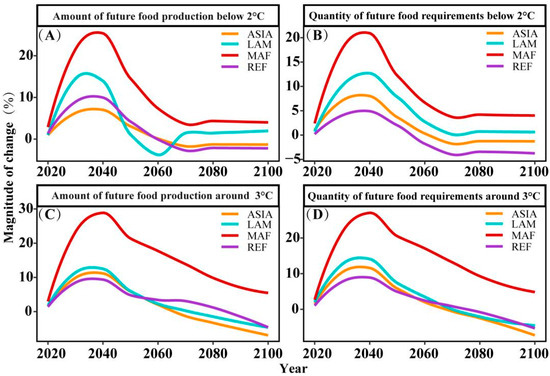
Figure 7.
Changes in future food supply and demand. (A): future food production below 2 °C; (B): future food requirements below 2 °C; (C): future food production around 3 °C; (D): future food requirements around 3 °C. Source: Author’s own work.
Currently, most organic farms operate on a small scale. This leads to limitations in the organic industry chain, which primarily focuses on production and lacks autonomy in processing, distribution, preparation, and consumption activities. To address this, our study proposes the concept of “long chains, supplementary chains, and strengthened chains” from an industrial chain perspective, emphasizing the importance of enhancing the deep processing of organic products. Moreover, we introduce the hypothesis of the “company + collective + technology” organizational model for organic raw material exporting countries. This model is also applicable to nations with a significant number of organic product manufacturers. It serves as a complement and improvement to the “long chains, supplementary chains, and strengthened chains” concept, setting higher requirements for labor quality and technological innovation. By implementing these measures, we can facilitate the promotion of export trade. This will enable producing countries to benefit from expanding export volumes and upgrading the industrial chain from exporting raw materials to exporting finished products. Furthermore, companies can improve the production and processing of organic products by engaging experts in organic agriculture and processing. These experts will offer guidance and supervise the comprehensive management of processing and trade activities. Ensuring the quality and integrity of the industry chain through this approach requires employing more workers. This not only reduces the risks associated with decentralized management by small-scale farmers but also tackles the existing challenges in agricultural employment [25,41,42]. Therefore, transitioning agricultural production methods and fostering the growth of organic agriculture have substantial potential to address global food production challenges and environmental degradation.
5. Conclusions
This study focuses on constructing a social–ecological system network and analyzing its impact on food quantity. The research reveals that in most regions of the world (102 countries, accounting for 69% of the surveyed nations), food demand is mainly met through domestic food production. However, in 31% of the regions (44 countries), food supply heavily relies on import trade. Balancing social and ecological interests in different types of countries, the connectivity and modularity of the social–ecological system network vary, demonstrating uneven node strength, inconsistent directions of influence, and loosely linked synergies. These findings highlight the complex trade-offs faced by global food production in social and ecological dimensions. To tackle these challenges, this study proposes strategies to address and manage food security risks. These strategies include boosting national agricultural subsidies, improving subsidy systems, safeguarding cultivated land area, and transitioning to organic agriculture. These proposals are informed by the connectivity structure of network nodes at different modularity levels. It is important to highlight that this study has not conducted focused investigations on individual countries. Rather, it has grouped research areas based on food supply sources, differentiating between production-dependent and import-dependent regions. Future research should delve deeper into specific countries or explore perspectives related to food consumption.
Author Contributions
Conceptualization: W.X., X.C., H.Y.; Methodology: W.X. and H.Y.; Software: W.X.; Data Curation: C.W.; Formal analysis: W.X. and G.Z.; Visualization: W.X. and J.J.; Writing; W.X. and H.Y. All authors have read and agreed to the published version of the manuscript.
Funding
We would like to thank the financial support provided by the National Natural Science Foundation of China (42171197).
Data Availability Statement
Not applicable.
Conflicts of Interest
The authors declare that they have no known competing financial interests or personal relationships that could have appeared to influence the work reported in this paper.
Appendix A
Appendix A.1. Indicators
All the data can be found at https://www.fao.org/faostat/zh/#country (FAO, 2020).
Cost of a healthy meal: The cost of a healthy diet indicator is the cost of purchasing the least expensive locally available foods to meet requirements for energy and food-based dietary guidelines (FBDGs), for a representative person within energy balance at 2330 kcal/day. The cost of a healthy diet is converted to international dollars using purchasing power parity (PPP).
Number of people with insufficient food: The indicator expresses the total number of people who cannot afford a healthy diet. The indicator is computed by multiplying the percentage of the population in a country unable to afford a healthy diet by population data taken from the World Development Indicators (WDI) of the World Bank, to obtain the number of people who cannot afford a healthy diet in a given country and year.
Employment opportunities in agriculture: The indicator corresponds to the agriculture category of the ILOSTAT indicator “Employment by sex and economic activity—ILO modelled estimates, November 2020 (thousands)—Annual”. Agriculture includes agriculture, forestry, and fishing in accordance with the Section A of ISIC classification. Employment comprises all persons of working age who during a specified brief period, such as one week or one day, were in the following categories: (a) paid employment (whether at work or with a job but not at work); or (b) self-employment (whether at work or with an enterprise but not at work).
Number of people in agriculture: De facto population living in areas classified as urban/rural according to the criteria used by each area or country. Data refer to 1 July of the year indicated. Source: United Nations, World Urbanization Prospects—the 2014 Revision.
Percentage of government expenditure on agriculture: Agriculture share of Government expenditures.
Value added of agriculture, forestry and fisheries: Value Added (Agriculture, Forestry and Fishing).
Export trade value: Total agricultural exports are expressed in terms of value. They cover all movements out of the country of the commodity in question during the reference period. They include commercial trade, donated quantities and estimates of unrecorded trade. Source: FAO Statistics Division.
Import trade value: Total agricultural imports are expressed in terms of value. They cover all movements into the country of the commodity in question during the reference period. They include commercial trade, food aid granted on specific terms, donated quantities and estimates of unrecorded trade. Source: FAO Statistics Division.
GHG emission factors: This indicator is defined as greenhouse gas emissions per kg of product.
Surface temperature changes: The FAOSTAT Temperature change on land domain disseminates statistics of mean surface temperature change by country, with annual updates. The current dissemination covers the period 1961–2022. Statistics are available for monthly, seasonal, and annual mean temperature anomalies, i.e., temperature change with respect to a baseline climatology, corresponding to the period 1951–1980. The standard deviation of the temperature change of the baseline methodology is also available. Data are based on the publicly available GISTEMP data, the Global Surface Temperature Change data distributed by the National Aeronautics and Space Administration Goddard Institute for Space Studies (NASA-GISS).
Cropland area: Land used for cultivation of crops in rotation with fallow, meadows and pastures within cycles of up to five years. The total of areas under “Temporary crops”, “Temporary meadows and pastures”, and “Temporary fallow”. Arable land does not include land that is potentially cultivable but is not cultivated.
Forest land area: Land spanning more than 0.5 hectares with trees higher than 5 m and a canopy cover of more than 10 per cent, or trees able to reach these thresholds in situ. Excludes land that is predominantly under agricultural or urban land use.
- Water efficiency: Water Use Efficiency (Agriculture (ISIC4 A01 A0210 A0322))
- Water stress: Level of water stress (Agriculture (ISIC4 A01 A0210 A0322))
Pesticide use: Value of total pesticides, covering insecticides, fungicides and bactericides (including seed treatments), herbicides, plant growth regulators, rodenticides, mineral oils, disinfectants and others.
Fertilizer use: Value of total nitrogen (N, P2O5, K2O) from all fertilizer products.

Figure A1.
Group structure.
Figure A1.
Group structure.
References
- Godfray, H.C.J.; Beddington, J.R.; Crute, I.R.; Haddad, L.; Lawrence, D.; Muir, J.F.; Pretty, J.; Robinson, S.; Thomas, S.M.; Toulmin, C. Food Security: The Challenge of Feeding 9 Billion People. Science 2010, 327, 812–818. [Google Scholar] [CrossRef] [PubMed]
- Francis; Charles. Full Planet, Empty Plates: The New Geopolitics of Food Security. NACTA J. 2013, 57, 101–102. [Google Scholar]
- Porkka, M.; Kummu, M.; Siebert, S.; Varis, O. From food insufficiency towards trade dependency: A historical analysis of global food availability. PLoS ONE 2017, 8, e82714. [Google Scholar] [CrossRef] [PubMed]
- Muthayya, S.; Sugimoto, J.D.; Montgomery, S.; Maberly, G.F. An overview of global rice production, supply, trade, and consumption. Ann. N. Y. Acad. Sci. 2014, 1324, 7–14. [Google Scholar] [CrossRef]
- Brewer, T.D.; Andrew, N.L.; Abbott, D.; Detenamo, R.; Faaola, E.N.; Gounder, P.V.; Lal, N.; Lui, K.; Ravuvu, A.; Sapalojang, D.; et al. The role of trade in pacific food security and nutrition. Glob. Food Secur. 2023, 36, 100670. [Google Scholar] [CrossRef]
- Clapp, J. Food self-sufficiency: Making sense of it, and when it makes sense. Food Policy 2017, 66, 88–96. [Google Scholar] [CrossRef]
- Ji, X.J.; Xu, Y.H.; Zuo, X.; Fang, W.S.; Lu, Y.Y. Estimating the climatic capacity of food security in Henan Province, China under the future climate change scenarios. Ying Yong Sheng Tai Xue Bao J. Appl. Ecol. 2020, 31, 853–862. [Google Scholar]
- Gruère, G.; Nagarajan, L.; King, E.O. The role of collective action in the marketing of underutilized plant species: Lessons from a case study on minor millets in South India. Special Section: Collective action for smallholder market access. Food Policy 2009, 34, 39–45. [Google Scholar] [CrossRef]
- Ahmed, S.M. Impacts of drought, food security policy and climate change on performance of irrigation schemes in Sub-saharan Africa: The case of Sudan. Agric. Water Manag. 2020, 232, 106064. [Google Scholar] [CrossRef]
- Sefater, G.; Oluwafemi, A.; Adeyinka, A.J.; Sarem, T.; Shandry, T.; Mary, A.O.; Bunmi, O.; Olayemi, O.J.; Patrick, N. Food safety, food security and genetically modified organisms in Africa: A current perspective. Biotechnol. Genet. Eng. Rev. 2021, 37, 39–45. [Google Scholar]
- Ming, R.; Chen, H.; Yazhen, W.; Andre, D.; Stefan, F.; Petr, H.; Yuyao, Z.; Chen, F.; Xiaotian, M.; Yong, L.; et al. Enhanced food system efficiency is the key to China’s 2060 carbon neutrality target. Nat. Food 2023, 4, 552–564. [Google Scholar]
- Skaf, L.; Buonocore, E.; Dumontet, S.; Capone, R.; Franzese, P.P. Applying network analysis to explore the global scientific literature on food security. Ecol. Inform. 2020, 56, 101062. [Google Scholar] [CrossRef]
- Liu, Y.; Song, W. Modelling crop yield, water consumption, and water use efficiency for sustainable agroecosystem management. J. Clean. Prod. 2020, 253, 119940. [Google Scholar] [CrossRef]
- Islam, M.A.; Warwick, N.; Koech, R.; Amin, M.N.; Bruyn, L.L.d. The importance of farmers’ perceptions of salinity and adaptation strategies for ensuring food security: Evidence from the coastal rice growing areas of Bangladesh. Sci. Total Environ. 2020, 727, 138674. [Google Scholar] [CrossRef] [PubMed]
- Smallwood, J.M.; Delabre, I.; Pinheiro Vergara, S.; Rowhani, P. The governmentality of tropical forests and sustainable food systems, and possibilities for post-2020 sustainability governance. J. Environ. Policy Plan. 2023, 25, 103–117. [Google Scholar] [CrossRef]
- Ali, M.P.; Kabir, M.M.M.; Haque, S.S.; Qin, X.; Nasrin, S.; Landis, D.; Holmquist, B.; Ahmed, N. Farmer’s behavior in pesticide use: Insights study from smallholder and intensive agricultural farms in Bangladesh. Sci. Total Environ. 2020, 747, 141160. [Google Scholar] [CrossRef]
- Takumi, S.; Noriko, M.; Yuka, M.; Satoshi, O.; Yuji, I.; Makoto, K.; Hiroshi, K.; Yozo, N.; Teruomi, T.; Tetsuo, N. Association between pesticide usage during pregnancy and neonatal hyperbilirubinemia requiring treatment: The Japan Environment and Children’s Study. Pediatr. Res. 2020, 89, 1565–1570. [Google Scholar]
- B, A.K.; Joanna, U.; Elizabeth, B.; Sylvia, B. Food price volatility and household food security: Evidence from Nigeria. Food Policy 2021, 102, 102061. [Google Scholar] [CrossRef]
- Abadi, B. The determinants of cucumber farmers’ pesticide use behavior in central Iran: Implications for the pesticide use management. J. Clean. Prod. 2018, 205, 1069–1081. [Google Scholar] [CrossRef]
- Tibshirani, R.; Walther, G.; Hastie, T. Estimating the Number of Clusters in a Data Set via the Gap Statistic. J. R. Stat. Society. Ser. B (Stat. Methodol.) 2001, 63, 411–423. [Google Scholar] [CrossRef]
- Felipe-Lucia, M.R.; Soliveres, S.; Penone, C.; Fischer, M.; Ammer, C.; Boch, S.; Boeddinghaus, R.S.; Bonkowski, M.; Buscot, F.; Fiore-Donno, A.M.; et al. Land-use intensity alters networks between biodiversity, ecosystem functions, and services. Proc. Natl. Acad. Sci. USA 2020, 117, 28140–28149. [Google Scholar] [CrossRef] [PubMed]
- Pons, P.; Latapy, M. Computing Communities in Large Networks Using Random Walks. J. Graph Algorithms Appl. 2006, 10, 191–218. [Google Scholar] [CrossRef]
- Dixon, P. VEGAN, a package of R functions for community ecology. J. Veg. Sci. 2003, 14, 927–930. [Google Scholar] [CrossRef]
- Song, F.; Wang, S.; Bai, X.; Wu, L.; Wang, J.; Li, C.; Chen, H.; Luo, X.; Xi, H.; Zhang, S.; et al. A New Indicator for Global Food Security Assessment: Harvested Area Rather Than Cropland Area. Chin. Geogr. Sci. 2022, 32, 204–217. [Google Scholar] [CrossRef]
- Adil, A.; Syarief, R.; Widiatmaka; Najib, M. Stakeholder Analysis and Prioritization of Sustainable Organic Farming Management: A Case Study of Bogor, Indonesia. Sustainability 2022, 14, 16706. [Google Scholar] [CrossRef]
- Allen, M.G. Framing food security in the Pacific Islands: Empirical evidence from an island in the Western Pacific. Reg. Environ. Chang. 2015, 15, 1341–1353. [Google Scholar] [CrossRef]
- Connell, J. Food security in the island Pacific: Is Micronesia as far away as ever? Reg. Environ. Chang. 2015, 15, 1299–1311. [Google Scholar] [CrossRef]
- Herrero, M.; Thornton, P.K.; Mason-D’Croz, D.; Palmer, J.; Benton, T.G.; Bodirsky, B.L.; Bogard, J.R.; Hall, A.; Lee, B.; Nyborg, K.; et al. Innovation can accelerate the transition towards a sustainable food system. Nat. Food 2020, 1, 266–272. [Google Scholar] [CrossRef]
- Ray, D.K.; Gerber, J.S.; MacDonald, G.K.; West, P.C. Climate variation explains a third of global crop yield variability. Nat. Commun. 2015, 6, 5989. [Google Scholar] [CrossRef]
- Marta, G.; Sebastian, S.; Katarzyna, S.-A.; Anna, M. Is small beautiful? Techinical efficiency and environmental sustainability of small-scale family farms under the conditions of agricultural policy support. J. Rural Stud. 2022, 89, 235–247. [Google Scholar]
- Roman, R.; Łukasz, W.; Mirosław, B. A Spatial Typography of Environmentally Friendly Common Agricultural Policy Support Relevant to European Green Deal Objectives. Land 2021, 10, 1092. [Google Scholar]
- Beate, E.-C.; Joachim, v.B.; Christine, L.; Daniel, B.; Jim, P. Policy: Five cornerstones of a global bioeconomy. Nature 2016, 535, 221–223. [Google Scholar]
- Chenchen, R.; Xinyue, Z.; Chen, W.; Yaolin, G.; Yu, D.; Sisi, S.; Stefan, R.; Wanyue, L.; Jianming, X.; Baojing, G. Ageing threatens sustainability of smallholder farming in China. Nature 2023, 616, 96–103. [Google Scholar]
- de Salazar, L.M.; Villar RC, L. Globalization and Health Inequities in Latin America; Springer: Cham, Switzerland, 2018. [Google Scholar]
- Chukwuma, U. The role of improved market access for small-scale organic farming transition: Implications for food security. J. Clean. Prod. 2023, 387, 135889. [Google Scholar]
- Johan, B.; Christian, S.; Anja, H.; Christian, G.; Irene, K.; Egyir, I.S.; Anne, M.; Joseph, B.; Tanga, C.M.; Joseph, C.; et al. Do organic farming initiatives in Sub-Saharan Africa improve the sustainability of smallholder farmers? Evidence from five case studies in Ghana and Kenya. J. Rural Stud. 2023, 98, 34–58. [Google Scholar]
- Shyam, B.; Amanda, W.; Elin, R.; Torbjörn, J.; Ingo, F.; Line, G. Organic agriculture in a low-emission world: Exploring combined measures to deliver sustainable food system in Sweden. Sustain. Sci. 2023, 18, 501–519. [Google Scholar]
- Hartmut, K. Comparative Analysis of Soil Fertility, Productivity and Sustainability of Organic Farming in Central Europe—Part 1: Effect of Medium Manifestations on Conversion, Fertilizer Types and Cropping Systems. Agronomy 2022, 12, 2001. [Google Scholar]
- Małgorzata, H.; Jolanta, K.; Magdalena, J. Reducing Carbon Footprint of Agriculture—Can Organic Farming Help to Mitigate Climate Change? Agriculture 2022, 12, 1383. [Google Scholar]
- Vincent, C.; Stephen, O. Organic agriculture: A fountain of alternative innovations for social, economic, and environmental challenges of conventional agriculture in a developing country context. Clean. Circ. Bioeconomy 2022, 3, 100025. [Google Scholar]
- Petrova, M.; Nikolova, M.; Pavlov, P. An Innovative Organic Agriculture Model for Sustainable Development of Rural Areas in Bulgaria. IOP Conf. Ser. Earth Environ. Sci. 2023, 1126, 012034. [Google Scholar] [CrossRef]
- Xiaohong, Z.; Donghong, D. Factors Influencing Farmers’ Willingness and Behaviors in Organic Agriculture Development: An Empirical Analysis Based on Survey Data of Farmers in Anhui Province. Sustainability 2022, 14, 14945. [Google Scholar]


Disclaimer/Publisher’s Note: The statements, opinions and data contained in all publications are solely those of the individual author(s) and contributor(s) and not of MDPI and/or the editor(s). MDPI and/or the editor(s) disclaim responsibility for any injury to people or property resulting from any ideas, methods, instructions or products referred to in the content. |
© 2023 by the authors. Licensee MDPI, Basel, Switzerland. This article is an open access article distributed under the terms and conditions of the Creative Commons Attribution (CC BY) license (https://creativecommons.org/licenses/by/4.0/).