Abstract
The spatial-temporal distribution pattern of China’s cultivated land has changed dramatically from 1990 to 2020, and the problem of cultivated land fragmentation has become more prominent. However, the existing research lacks a focus on the two specific land use types, paddy fields and dryland. In this study, the spatiotemporal distribution pattern and the fragmentation driving mechanism of paddy field and dryland during the years 1990 to 2020 were identified by using the center of gravity center migration model, standard deviation ellipse, and land-use dynamic model for the urban agglomeration in the middle reaches of the Yangtze River as an example. The results show that there are significant differences in the spatiotemporal distribution characteristics of paddy field and dryland in the MRYRUA. Among the provinces and cities, Hubei province and its Xiangyang city showed the most obvious trend of change. The loss and gain of paddy fields and dryland is related to economic and policy contexts in each period. The main driving factor of paddy field and dryland fragmentation is natural condition, whereas a relatively important factor is the per capita disposable income of rural residents. The effects of each factor on paddy field and dryland fragmentation were not independent; any two factor interactions had a stronger effect on paddy field and dryland fragmentation than a single factor. In general, this study provides guidance and references for the main grain-producing areas undergoing rapid urbanization relating to cultivated land conservation, food security, and sustainable agricultural utilization.
1. Introduction
The pattern of cultivated land can reflect the quantitative and structural status of regional food production, and its changing characteristics have an impact on agricultural ecosystem stability and agricultural production functions [1]. Over the past 30 years, the occupation of cultivated land by construction land and ecological land has led to drastic changes in the distribution pattern of cultivated land [2]. Chinese cultivated land is located mainly in the eastern monsoon region bounded by the Daxinganling–Yinshan–Helan Mountain line, with less in the western region. Because of the significant differences in soil, heat, and precipitation between southern and northern China, the types, methods and areas of cultivated land for food crops in the north and south are not quite the same, resulting in a pattern of cultivated land use that is “paddy field in the south and dryland in the north”, with the Qinling-Huaihe River line as the boundary [3]. A paddy field is an important wetland type that plays an important role in maintaining biodiversity and regional ecological security [4]. Dryland has a wide distribution area and high yield potential. Wheat production from dryland occupies over three-quarters of global wheat output, playing an important role in both China’s and the world’s agricultural development [5]. Spatial-temporal changes in the distribution pattern of paddy fields and dryland have important implications for agriculture in the region, especially cultivation, and determine, to some extent, the direction of agricultural development in a region over a certain period of time [3]. However, since entering the 21st century, paddy fields and dryland across China are at risk of resource loss, landscape fragmentation, and quality degradation due to urban expansion, agricultural restructuring, and global climate change [6], which poses a huge challenge to food security and sustainable agricultural development.
In the early 1950s, Binns first introduced the concept of cultivated land fragmentation (CLF) to describe cultivated land patches that are individually farmed and spatially non-contiguous to each other within a broad spatial area [7]. During this period, scholars believed that cultivated land was farmed by different management subjects to create economic output value for the operators, and the concept of CLF should be defined based on the management subjects of cultivated land [8]. As a result, traditional research on CLF focuses on the perspective of farmers at the microscale, exploring the problem of cultivated land property rights fragmentation using methods involving field surveys and statistical analyses [9]. With the increasingly acute problems of resources and the environment caused by CLF, the definition and connotation of CLF have begun to expand from the cultivated land property rights fragmentation to the cultivated land landscape fragmentation. Studies that quantitatively analyze CLF based on landscape ecology theory have become increasingly frequent [10,11]. Cultivated land landscape fragmentation is actually the basis leading to property rights fragmentation [12]. Through the landscape index, quantitative CLF is not only able to conduct multidimensional and multilevel comprehensive evaluations of CLF from a more macroscopic regional level but can also provide a solution idea for the problem of cultivated land property rights [13].
When considering paddy fields and dryland as the main subtypes of cultivated land, paddy field fragmentation (PFF) and dryland fragmentation (DLF) are essentially specific manifestations of cultivated land fragmentation (CLF). CLF is a shared agricultural characteristic of numerous developing countries [14,15] and an issue faced by countries around the globe in the process of achieving sustainable agricultural development [13]. The rapid economic and social development in China has made the problem of cultivated land fragmentation increasingly prominent [16]. The CLF severely restricts the scale operation of land [17], hampering agricultural modernization and industrialization [10]. CLF not only significantly reduces the marginal productivity of agricultural labor [18] but also raises the cost of equipment transport, fertilizers, and pesticides [19], negatively affecting agricultural productivity [20]. The process of CLF is accompanied by damage to the cultivated land soil, leading to a significant decline in soil fertility, and this damage is irreversible [21]. In addition, China’s status quo of more people and less land is increasingly grim, with a cultivated land area of only 0.09 ha per capita in 2020, far below the world average of 0.2 ha per capita [22]. National food production is under unprecedented pressure [23], requiring that the finite cultivated land resources be utilized more appropriately and efficiently.
To gain a thorough insight into CLF and to eliminate its negative impacts, academics have conducted research around the definition and classification of CLF [24], the impacts of CLF on agricultural production and ecosystems [20], and the driving mechanisms of CLF [25]. Among the many research directions, Wu [26] posited that analyzing the driving mechanism of CLF is the basis for understanding and solving the problem of CLF, and it is of great significance for promoting effective cultivated land management and protection, so it has received extensive attention from the academic community. The effects of a driving factor of CLF can be categorized into natural and anthropogenic factors [13]. The former includes aspects such as topography and geomorphology climatic conditions and soil structure [27], whereas the latter focuses on property rights systems, population migration, and urban sprawl [28].
The research methods of CLF driving mechanisms can be divided into two main categories: qualitative analysis and quantitative modeling analysis. The qualitative analysis method is based on human logical thinking and applies human subjective judgment to the CLF driving force as a research object to reveal its evolutionary principles [29]. Niroula [30] adopted qualitative analysis to analyze the causality of CLF in South Asian countries from economic, cultural, and political perspectives and concluded that population growth, land inheritance system, livelihoods of farmers, and size of the land market are the main causes of CLF. Quantitative models often used to analyze CLF driving mechanisms include correlation models [31], statistical regression models [32], and spatial regression models [33]. CLF is not only characterized by obvious spatial heterogeneity and nonlinearity but also affected by complex interactions among multiple driving factors [34]. Therefore, the introduction of nonlinear spatial statistical models that can demonstrate the interactions between factors will facilitate exploring the driving mechanisms of CLF.
The vast and flat plains in urban agglomeration in the middle reaches of the Yangtze River (MRYRUA) provide rich and high-quality cultivated land resources for agricultural development. The cultivated land area of the MRYRUA is approximately 10% of the national cultivated land area. The gross agricultural output value reaches 12% of the national gross agricultural output value, which is an important grain-producing area and agricultural development zone [35]. Currently, spatial distribution of cultivated land in China is characterized by overlap between farmland and construction land, which resulted in massive cultivated land wastage and increased fragmentation [11]. The MRYRUA is both a major grain-producing area and a rapidly urbanizing region where serious contradictions exist between municipal development and the preservation of cultivated land.
Although some previous studies have analyzed the changes in the distribution pattern of cultivated land and the causes of cultivated land fragmentation [32,36], little attention has been focused on mega-city clusters such as the MRYRUA (the urban agglomeration in the middle reaches of the Yangtze River), which have a dual orientation of food production and rapid urbanization. At the present stage, research on spatial-temporal change in the distribution pattern of cultivated land has focused too much on cultivated land as a first level land type and lacks attention to paddy fields and dryland as two refined land types, which tends to overlook the significance of paddy fields and dryland in stabilizing food production and protecting agroecosystems. In addition, the driving mechanisms of CLF are complex, although previous studies treated natural and anthropogenic activities as two individual subjects, ignoring the results of their mutual linkage [37]. In view of the above, this study will focus on the following issues: (1) What is the evolutionary pattern of the MRYRUA’s paddy fields and dryland during the study period in terms of quantity, time, and space? (2) To what land categories have the MRYRUA’s disappearing paddy fields and dryland flowed during the study period? And from what land types have these losses been replenished? Have the reductions and increases been balanced? (3) What are the spatial differences in the pattern of fragmentation of the MRYRUA’s paddy fields and dryland over the last 30 years? What are the driving factors and their possible interactions that have contributed to this?
2. Materials and Methods
2.1. Study Area
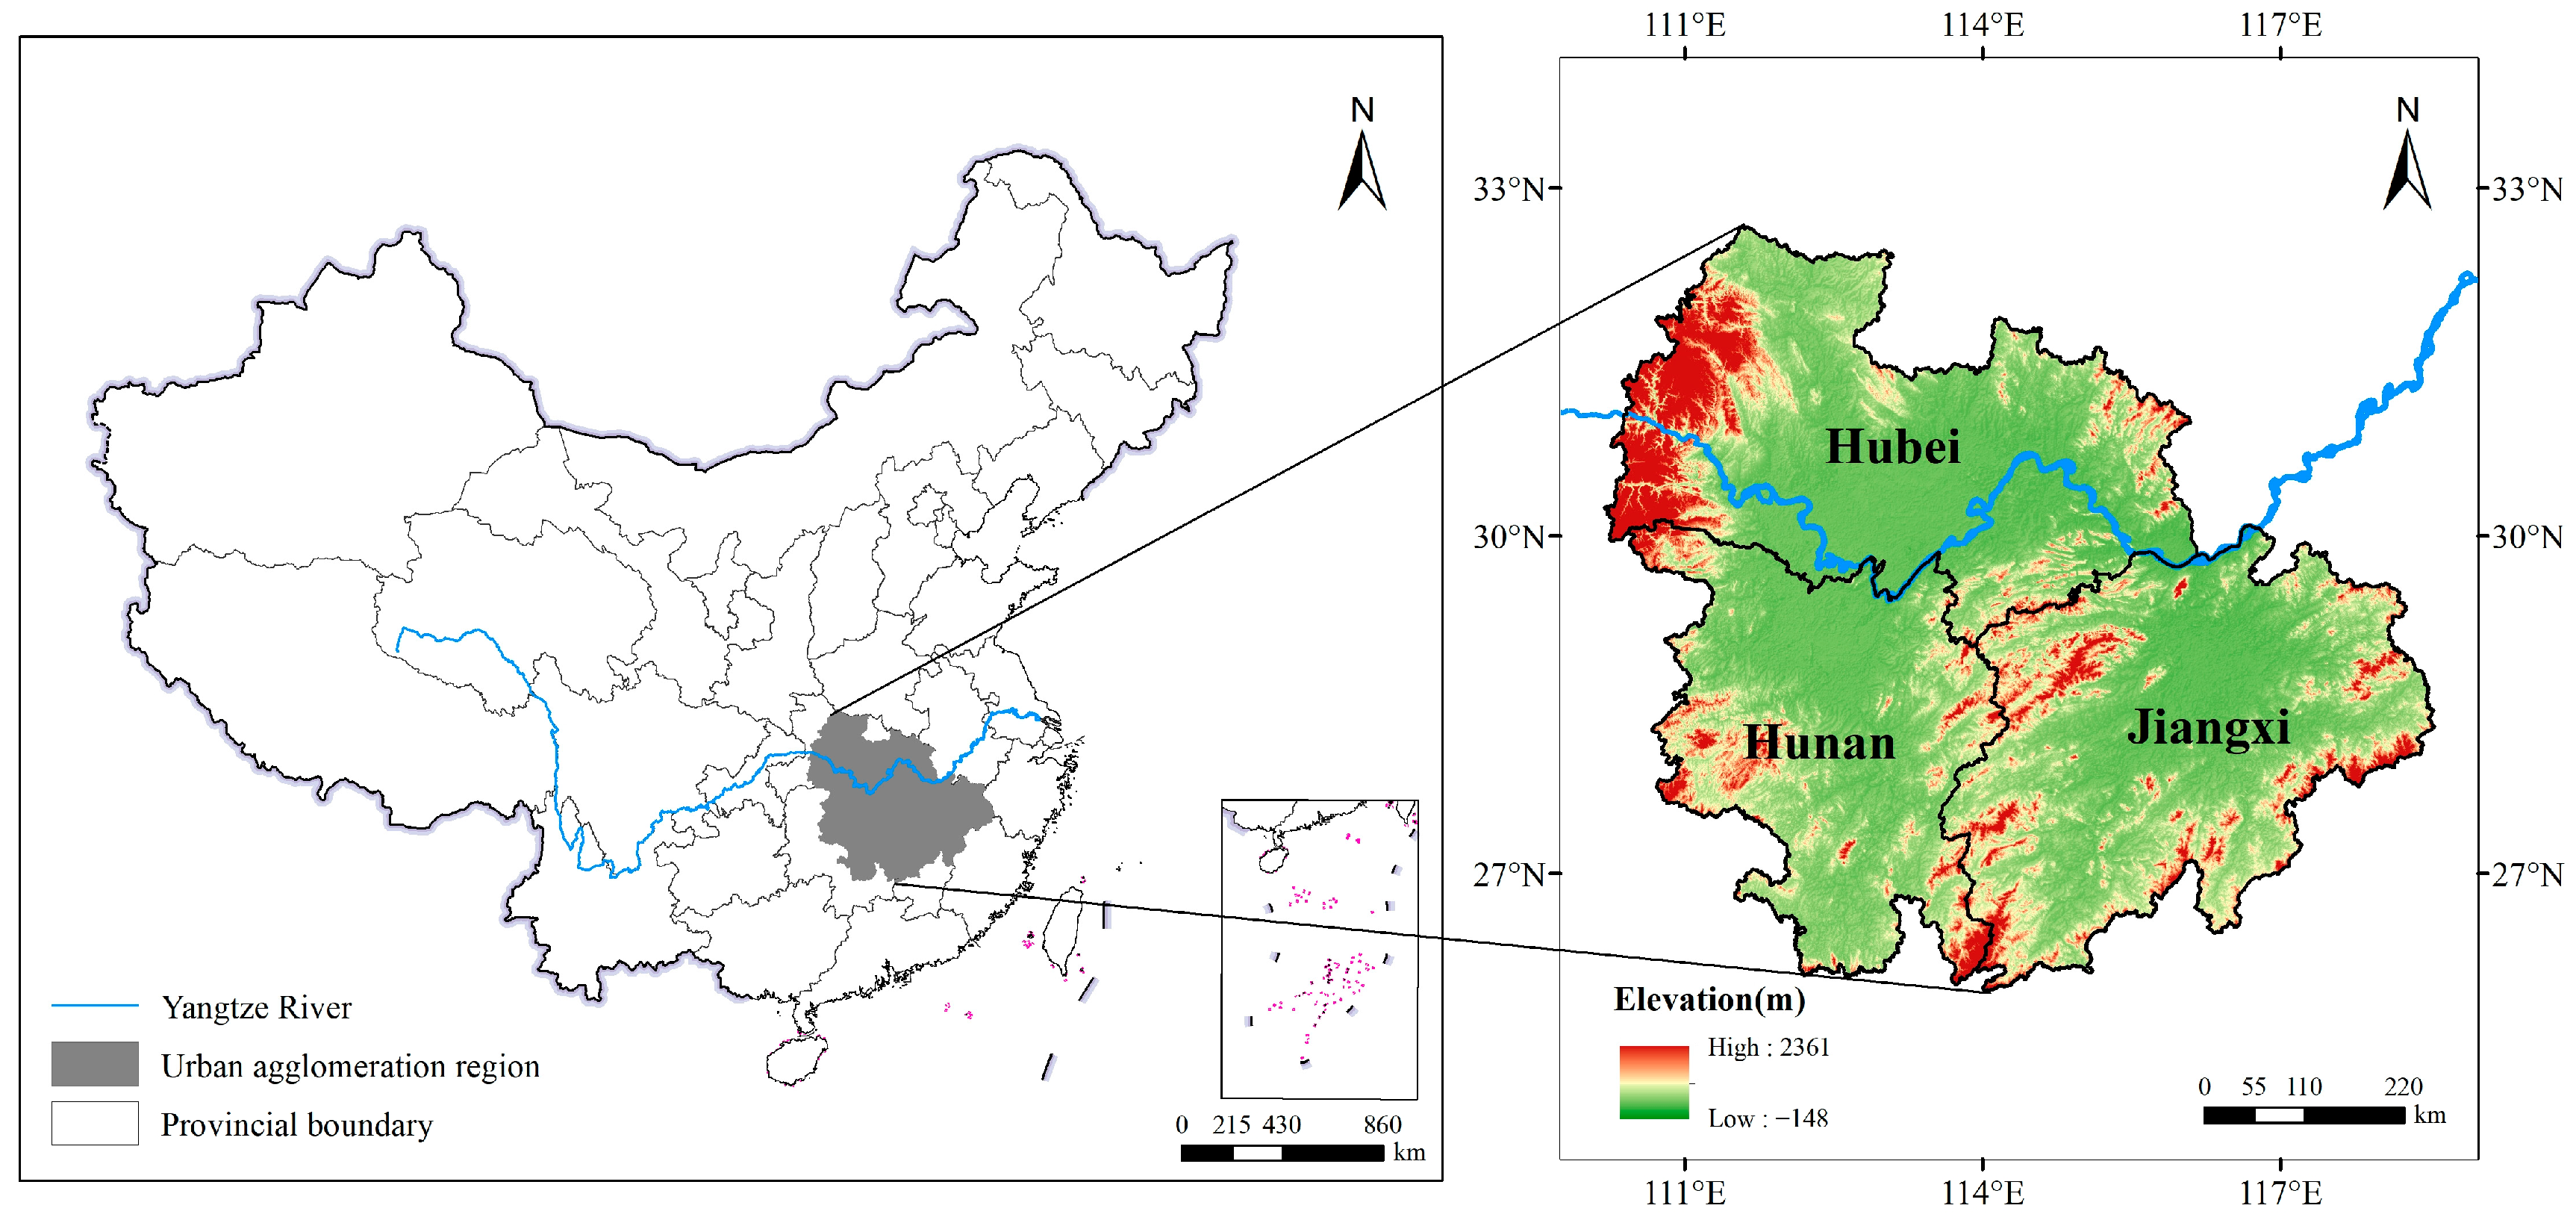
The MRYRUA is the first cross-regional mega city cluster officially recognized by the Chinese government. The MRYRUA is situated in central China, spanning the Hubei, Hunan, and Jiangxi provinces, and is a crucial node linking east and west China and extending over the north and south (Figure 1). The MRYRUA has a subtropical monsoon climate, with high temperatures and rainy summers, as well as mild and humid winters. The annual precipitation ranges from 1000 mm to 1600 mm, and the average annual temperature ranges from 16 °C to 18 °C [38]. The total land area of the region is about 310,000 km2, with the land use types dominated by forest, cultivated land, and water area, accounting for 48.27%, 36.77%, and 7.26% of the total area, respectively [39]. The high temperature and rainy climate and the complex and varied topography have created a spatial pattern of interspersed paddy fields and dryland. At the end of 2019, the resident population of the MRYRUA was 131 million, concentrated in the cities of Wuhan (Hubei province), Changsha (Hunan province), and Nanchang (Jiangxi province).
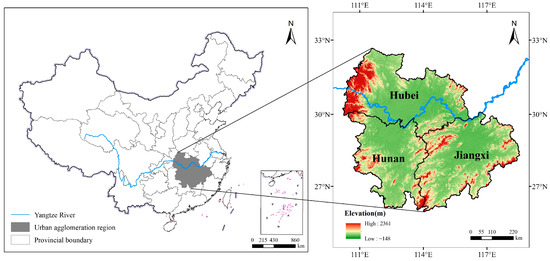
Figure 1.
The location of the study area. The left side shows the location of the MRYRUA in China. The right side shows the MRYRUA elevation map and the location of the Hunan, Hubei, and Jiangxi provinces.
2.2. Data Sources
This study uses data including land use data (CNLUCC), digital elevation model (DEM), and socioeconomic statistics for four time periods: 1990, 2000, 2010, and 2020. Both the CNLUCC with a resolution of 1 km and the DEM with a resolution of 500 m are acquired from the Resource and Environmental Sciences Data center of the Chinese Academy of Sciences (https://www.resdc.cn accessed on 5 October 2023). Based on the 1 km resolution land use data and officially released population data, it can be calculated that the per capita cultivated land area of the MRYRUA in 1990, 2000, 2010, and 2020 will be 0.129 ha, 0.106 ha, 0.101 ha, and 0.098 ha, respectively. Socioeconomic statistics are gathered from the published yearbooks of the municipalities.
The principle of CNLUCC is to use human–computer interactive visual interpretation to analyze Landsat-TM/ETM and Landsat 8 remote sensing image data to interpret the spatial distribution of land use cover [40]. There are six primary land use types and twenty-five secondary land use types at CNLUCC. According to the classification system of CNLUCC, the primary land use types are cultivated land, forest, grassland, water area, construction land, and unutilized land, of which cultivated land is divided into two secondary land use types, paddy fields and dryland. Paddy fields are cultivated land that primarily grows aquatic crops such as rice and lotus roots, so it requires the construction of irrigation facilities to safeguard the water requirements of the production crops [41]. Dryland is cultivated land that primarily grows dry crops such as wheat, corn and soybeans, so it does not require the construction of irrigation facilities and relies on natural precipitation for crop growth [41]. In the test sample of CNLUCC, the accuracy of the decoding test was 84.35% and 92.86% for paddy fields and dryland [40,42].
2.3. Methods
2.3.1. Spatial-Temporal Change in Distribution Patterns of Paddy Fields and Dryland
- Gravity center migration model
The gravity center migration model reflects the spatial trends of geographical elements through the direction, distance, and speed of center of gravity migration [43]. Changes in the gravity center depend on the spatial location and geographical attributes of the variable, and its dynamic trajectory represents the direction of change of the variable pattern [44].
This study adopts the gravity center migration model to analyze the spatial distribution pattern and change tendency of paddy fields and dryland in the MRYRUA during the study period, as well as to reveal the direction of change in paddy fields and dryland and the evolution of the scale of diffusion over the past 30 years. The gravity center migration model is calculated as follows:
where and are the latitude and longitude coordinates of the paddy field or dryland gravity center in the study area; is the area of paddy field or dryland of the city; and and are the latitude and longitude coordinates of the city.
- 2.
- Standard deviation ellipse
Standard deviation ellipses can measure the directionality and centripetal nature of geographic elements and their trends [45]. The longer the y-axis, the more discretely the data are presented, and conversely, the more centripetal the data are. The higher the ratio of the difference in distance between the two axes, the more obvious the orientation of the data; otherwise, the orientation of the data is not obvious [45].
The core parameters of the standard deviation ellipse are calculated to analyze the spatial distribution characteristics, main directions of change, trends of agglomeration and disagglomeration, and strength of directionality in paddy fields and dryland. The standard deviation ellipse is calculated as follows:
where and are the elliptic variance, and are the coordinates of geographic element, and are the arithmetic mean center of the geographic element, and is the number of elements. is the angle of rotation clockwise to the x-axis starting at due north; and are the mean center deviations; and and are the standard deviation along the and axis.
- 3.
- Land-use dynamic degree indicator
The land-use dynamic degree can quantifies the rate of change in the area of a land-use type in a certain region and time frame [46]. By calculating the land-use dynamic degree of paddy fields and dryland and adopting the natural breakpoint method for spatial classification it is possible to effectively compare the regional differences in the changes of paddy fields and dryland among the cities in the study area, as well as to analyze the trend of changes in the quantity of paddy fields and dryland. The formula for calculating the land-use dynamic degree is as follows [47]:
where is the rate of change of paddy field and dryland in each city over a certain period of time (%); and are the area of paddy field or dryland at the beginning and end of the study period, respectively (km2); and is the length of the study period.
2.3.2. Comprehensive Evaluation of Paddy Field and Dryland Fragmentation
The evaluation of the fragmentation of paddy fields and dryland is essentially an evaluation of the fragmentation of cultivated land after a refined classification. Currently, the concept of CLF mostly reflects the landscape characteristics of cultivated land, and the degree of CLF is graded by the comprehensive calculation of landscape indicators [48]. China has a huge population and very limited cultivated land resources, with a high ratio of population to cultivated land, and the overall and continuous cultivated land patches become complex, heterogeneous, and discontinuous in the process of allocating limited resources [49]. The number of patches (NP) and total class area (CA) can reflect the degree of PFF and DLF in the region from a resource scale perspective [25]. Moreover, cultivated land fragmentation is strongly influenced by topography and anthropogenic factors in the process of its formation and manifests itself in the spatial distribution of clustering or dispersing within a certain regional scale [50]. Aggregation index (AI) and patch density (PD) as key indicators characterizing the level of spatial agglomeration in the region are the basis for constructing the PFF and DLF evaluation systems. In addition, the shape of cultivated patches has an impact on animal migration, foraging, and other activities, as well as on crop cultivation and productivity [51]. It is necessary to introduce the area-weighted mean shape index (AWMSI) into the PFF and DLF evaluation systems to measure the complexity and fragmentation of cultivated land at the landscape shape level [33]. Therefore, this study selected five landscape indicators, NP, CA, AI, PD, and AWMSI, from the three categories of resource scale, spatial agglomeration, and landscape shape to construct a comprehensive evaluation system for PFF and DLF. The calculation formulas and definitions of each landscape indicator are presented in Table 1. The specific calculation process was performed using the Fragstats 4.2 software [52].

Table 1.
Evaluation indicator system of PFF and DLF.
There is often a problem of nonuniformity in the units and outlines between the landscape indicators [53]. It is necessary to normalize raw data dimensionless using the maximum difference normalization method by uniformly transforming the positive and negative attribute indicators into positive standardized indicators to avoid bias in the comprehensive evaluation results [10]. The formula for the maximum difference normalization method is as follows:
where and denote the standardized and actual values of the landscape indicator for the municipal unit, respectively; and are the minimum and maximum values of a particular type of landscape indicator.
In the next step, the entropy weight method is used to calculate the weight of NP, CA, AI, PD, and AWMSI as 0.2383, 0.069, 0.1194, 0.0868, and 0.4865, respectively. This method can determine the weights of the indicators by evaluating the value of the indicators under objective conditions, which has greater operability and objectivity. It can reflect the implicit information in the data and make the variability between indicators more visible, thus avoiding difficulties in analyzing and the inability to compare information comprehensively due to too small a difference in the selection of the indicators [54]. The formula for entropy weight method is as follows:
Finally, the degree of PFF and DLF was measured for each municipal unit using a linear weighted integrated evaluation model, as follows:
where is the degree of fragmentation of the paddy field or dryland; is the standardized value of the indicator; and is the entropy weight of the indicator.
2.3.3. Detection of Driving Factors in Paddy Field and Dryland Fragmentation
- Selection of Driving Factors
Paddy field and dryland are refined classifications of cultivated land’s internal structure, and the driving factors of CLF patterns equally affect PFF and DLF patterns. Current research on CLF driving factors focuses on various aspects such as socioeconomic factors, agricultural development, and natural conditions. GDP per capita, industrial structure, and urbanization level are typical socioeconomic factors that determine the allocation of resources and the spatial pattern of farming activities [11] and are closely related to the spatial distribution of CLF [55]. Moreover, the output, yield, and development potential of agricultural production are always linked to endowments like cultivated land area and spatial distribution of cultivated land [56]. Elevation and slope are the two most critical natural factors [10] and are the material basis and spatial factors for determining the agricultural production pattern and cropping structure [25]. In summary, this study picked eight potential drivers in three categories: socioeconomic, agricultural development, and natural conditions. These driving factors are described in Table 2.

Table 2.
Driving factors for PFF and DLF.
- 2.
- Detection of driving factors based on the geodetector model
The geodetector model is a tool for detecting and exploiting spatial variability by integrating the functions of factor detector, interaction detector, risk detector, and ecological detection [57]. It reveals the driving forces of the dependent variable by detecting the spatial heterogeneity of different geographic objects or phenomena, now widely adopted for analyzing the driving mechanisms and causes of spatial differentiation in the evolution of the pattern of geographic elements [58]. The basic idea of the method is to divide a region into smaller regions, which are heterogeneous if the sum of the variances of these smaller regions is less than the variance of the region. Two variables are correlated if they are approximately equally distributed [37]. The advantage of the geodetector model over other driving force analysis methods is that it can detect not only quantitative and qualitative variables but also the interaction of multiple independent factors on the dependent factor [59]. Moreover, the principle of the geodetector model ensures that it is immune to multicollinearity between driving factors [57]. The Q statistic for the geodetector explains the magnitude of driving factor influence. The formula for the factor detector is as follows:
where = 1, 2, 3 ......, is the stratification of the dependent variable or driving factor; and are the total area of the layers, respectively; and are the variances of the Y-values for layer and the whole region; and and are the sum of the within-layer variance, as well as the variance for the entire region.
The interaction detector is used to identify whether different driving factors have independent effects on PFF and DLF and to investigate which state’s different driving factors will be present when interacting with each other (nonlinear weakening, single-factor nonlinear weakening, dual factor enhancement, independence, and nonlinear enhancement).
3. Results
3.1. Spatial-Temporal Change in Pattern of Distribution of Paddy Field and Dryland
3.1.1. Overall Change in Paddy Field and Dryland
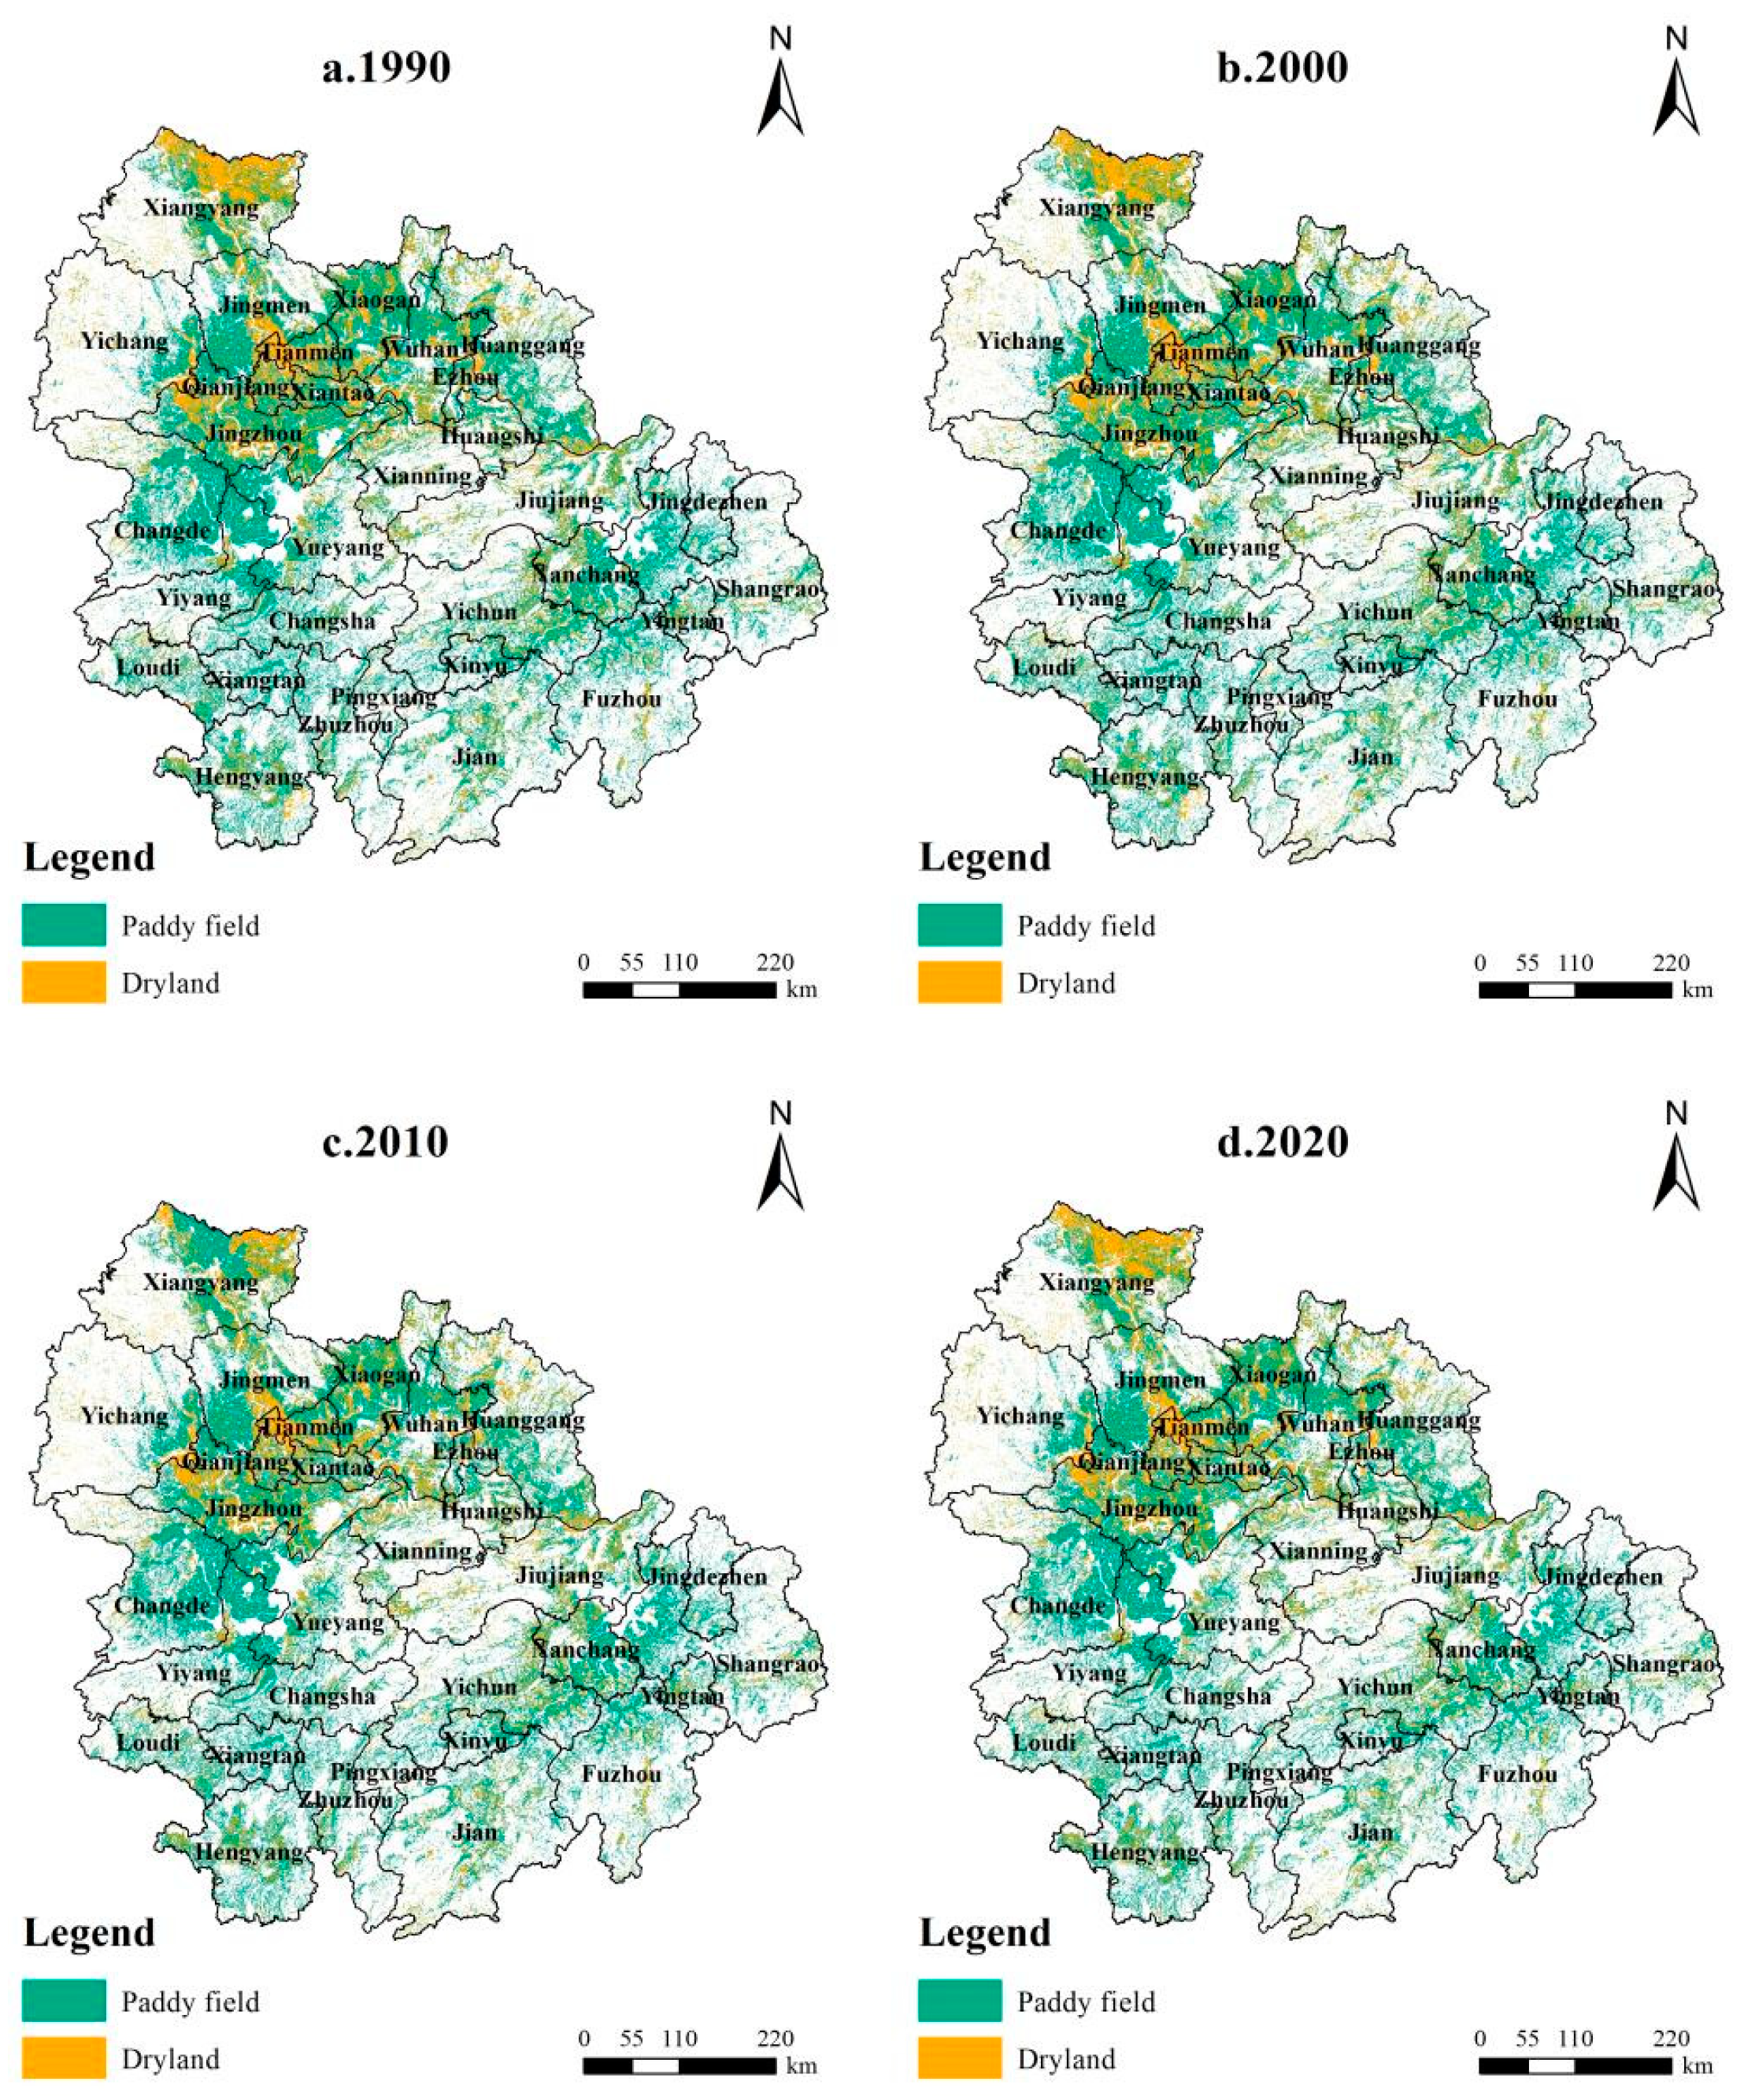
Influenced by natural factors such as topography, rainfall, and temperature and anthropogenic factors such as land policy and population density [60], the spatial distribution of paddy field and dryland in the MRYRUA varies significantly (Figure 2). The area of paddy field has been consistently higher than that of dryland over the past 30 years, with the maximum difference between the two being 55,215.22 km2 in 2010 and the minimum difference being 51,230.20 km2 in 2020. The difference between the area of paddy field and dryland in 1990 and 2000 was 53,334.85 km2 and 53,011.21 km2, respectively. The proportion of paddy field and dryland to the total cultivated land remained in the ranges of 70.44–72.03% and 27.97–29.56%, respectively.
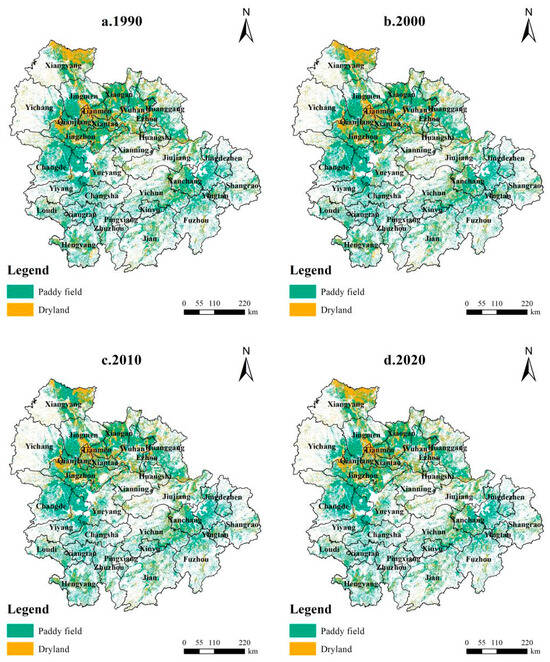
Figure 2.
Spatial distribution of paddy fields and dryland in the MRYRUA in 1990 (a), 2000 (b), 2010 (c), and 2020 (d).
The paddy field areas are distributed in the plains in the northwestern, western, and eastern parts of the MRYRUA. These basin and valley plains, which are alluviated by the Yangtze River and its tributaries, have topographical and climatic conditions that are extremely favorable for extensive rice cultivation [61]. However, with the continuous decline in cultivated land resources by human activities, the paddy field area has been decreasing from 91,887.18 km2 in 1990 to 87,767.16 km2 in 2020, showing a continuous and steady downward trend. The largest decrease in paddy field area occurred from 2010 to 2020, with a decrease of 2499.75 km2.
Dryland is concentrated in Jingzhou, Jingmen, Tianmen, and Xiangyang in the central and northern Hubei province, whereas dryland distribution in other cities is relatively scattered. The area of dryland declined from 38,552.33 km2 in 1990 to 35,051.69 km2 in 2010 and then rebounded to 36,536.96 km2 in the following 10 years, experiencing a downward and then upward trend. The largest decrease in dryland area occurred between 2000 and 2010, with a decrease of 3125.52 km2 and the most significant dryland loss in northern Xiangyang.
3.1.2. Analysis of Gravity Center Migration in Paddy Field and Dryland
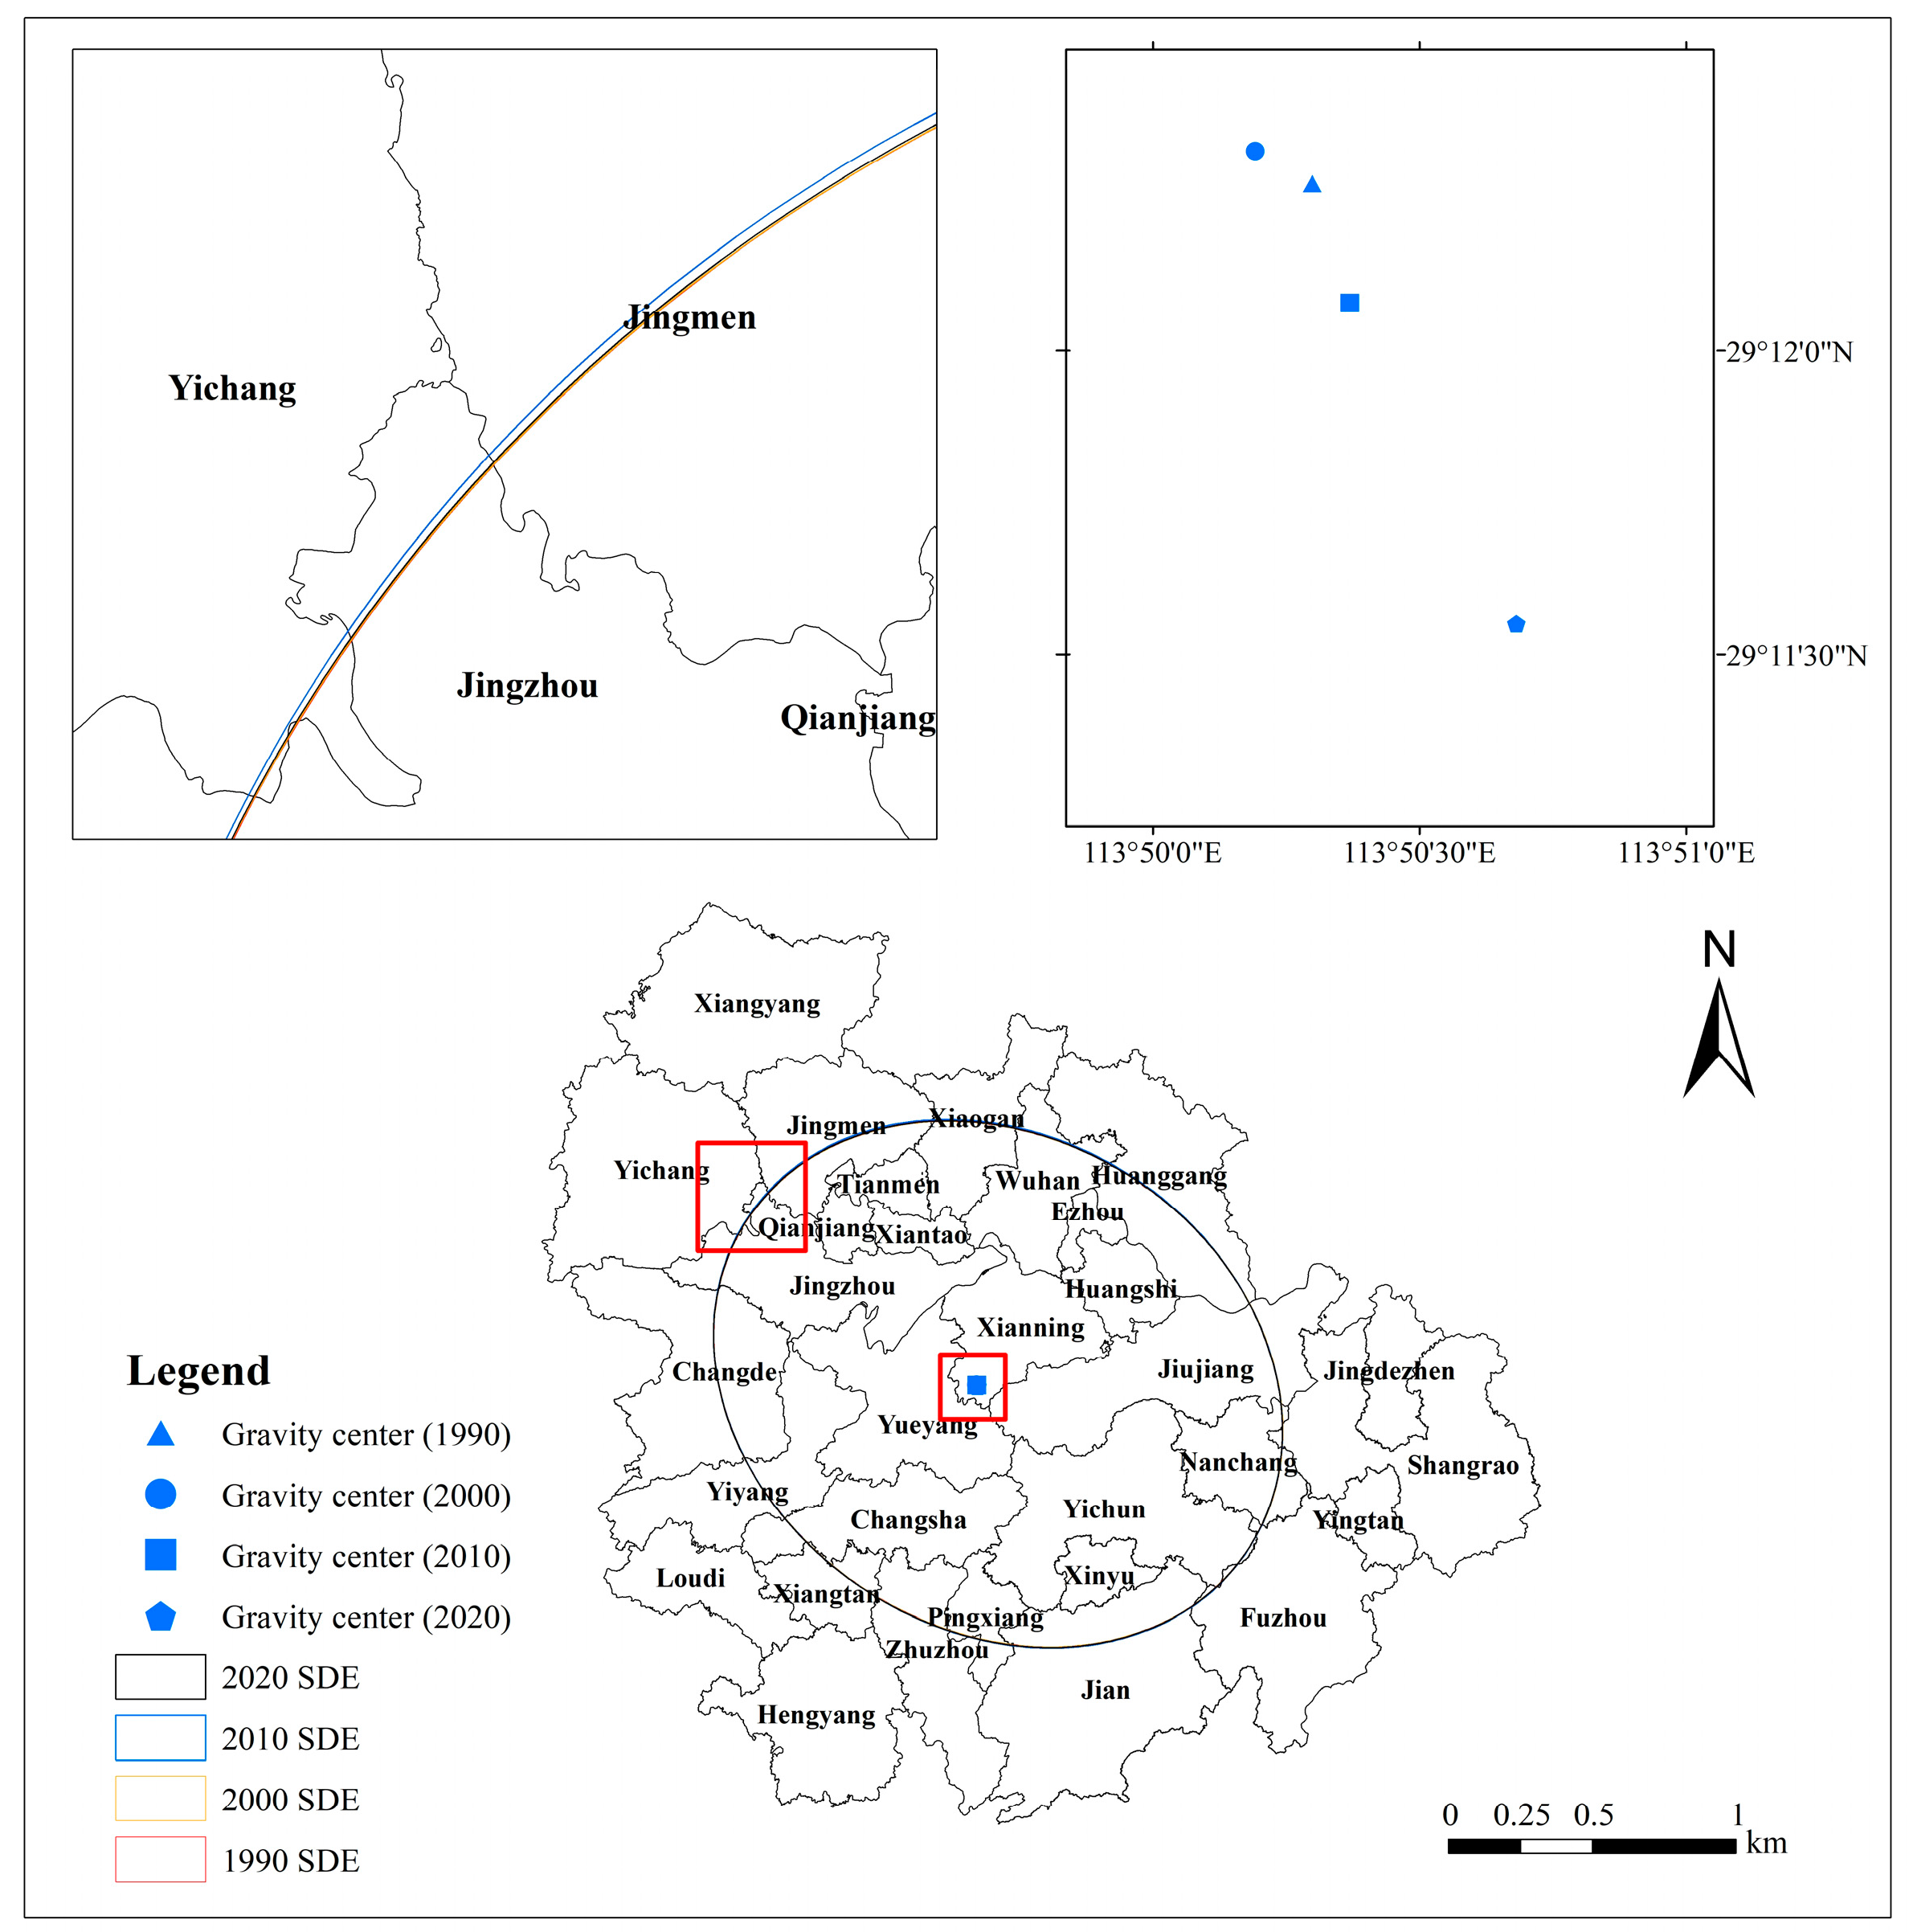
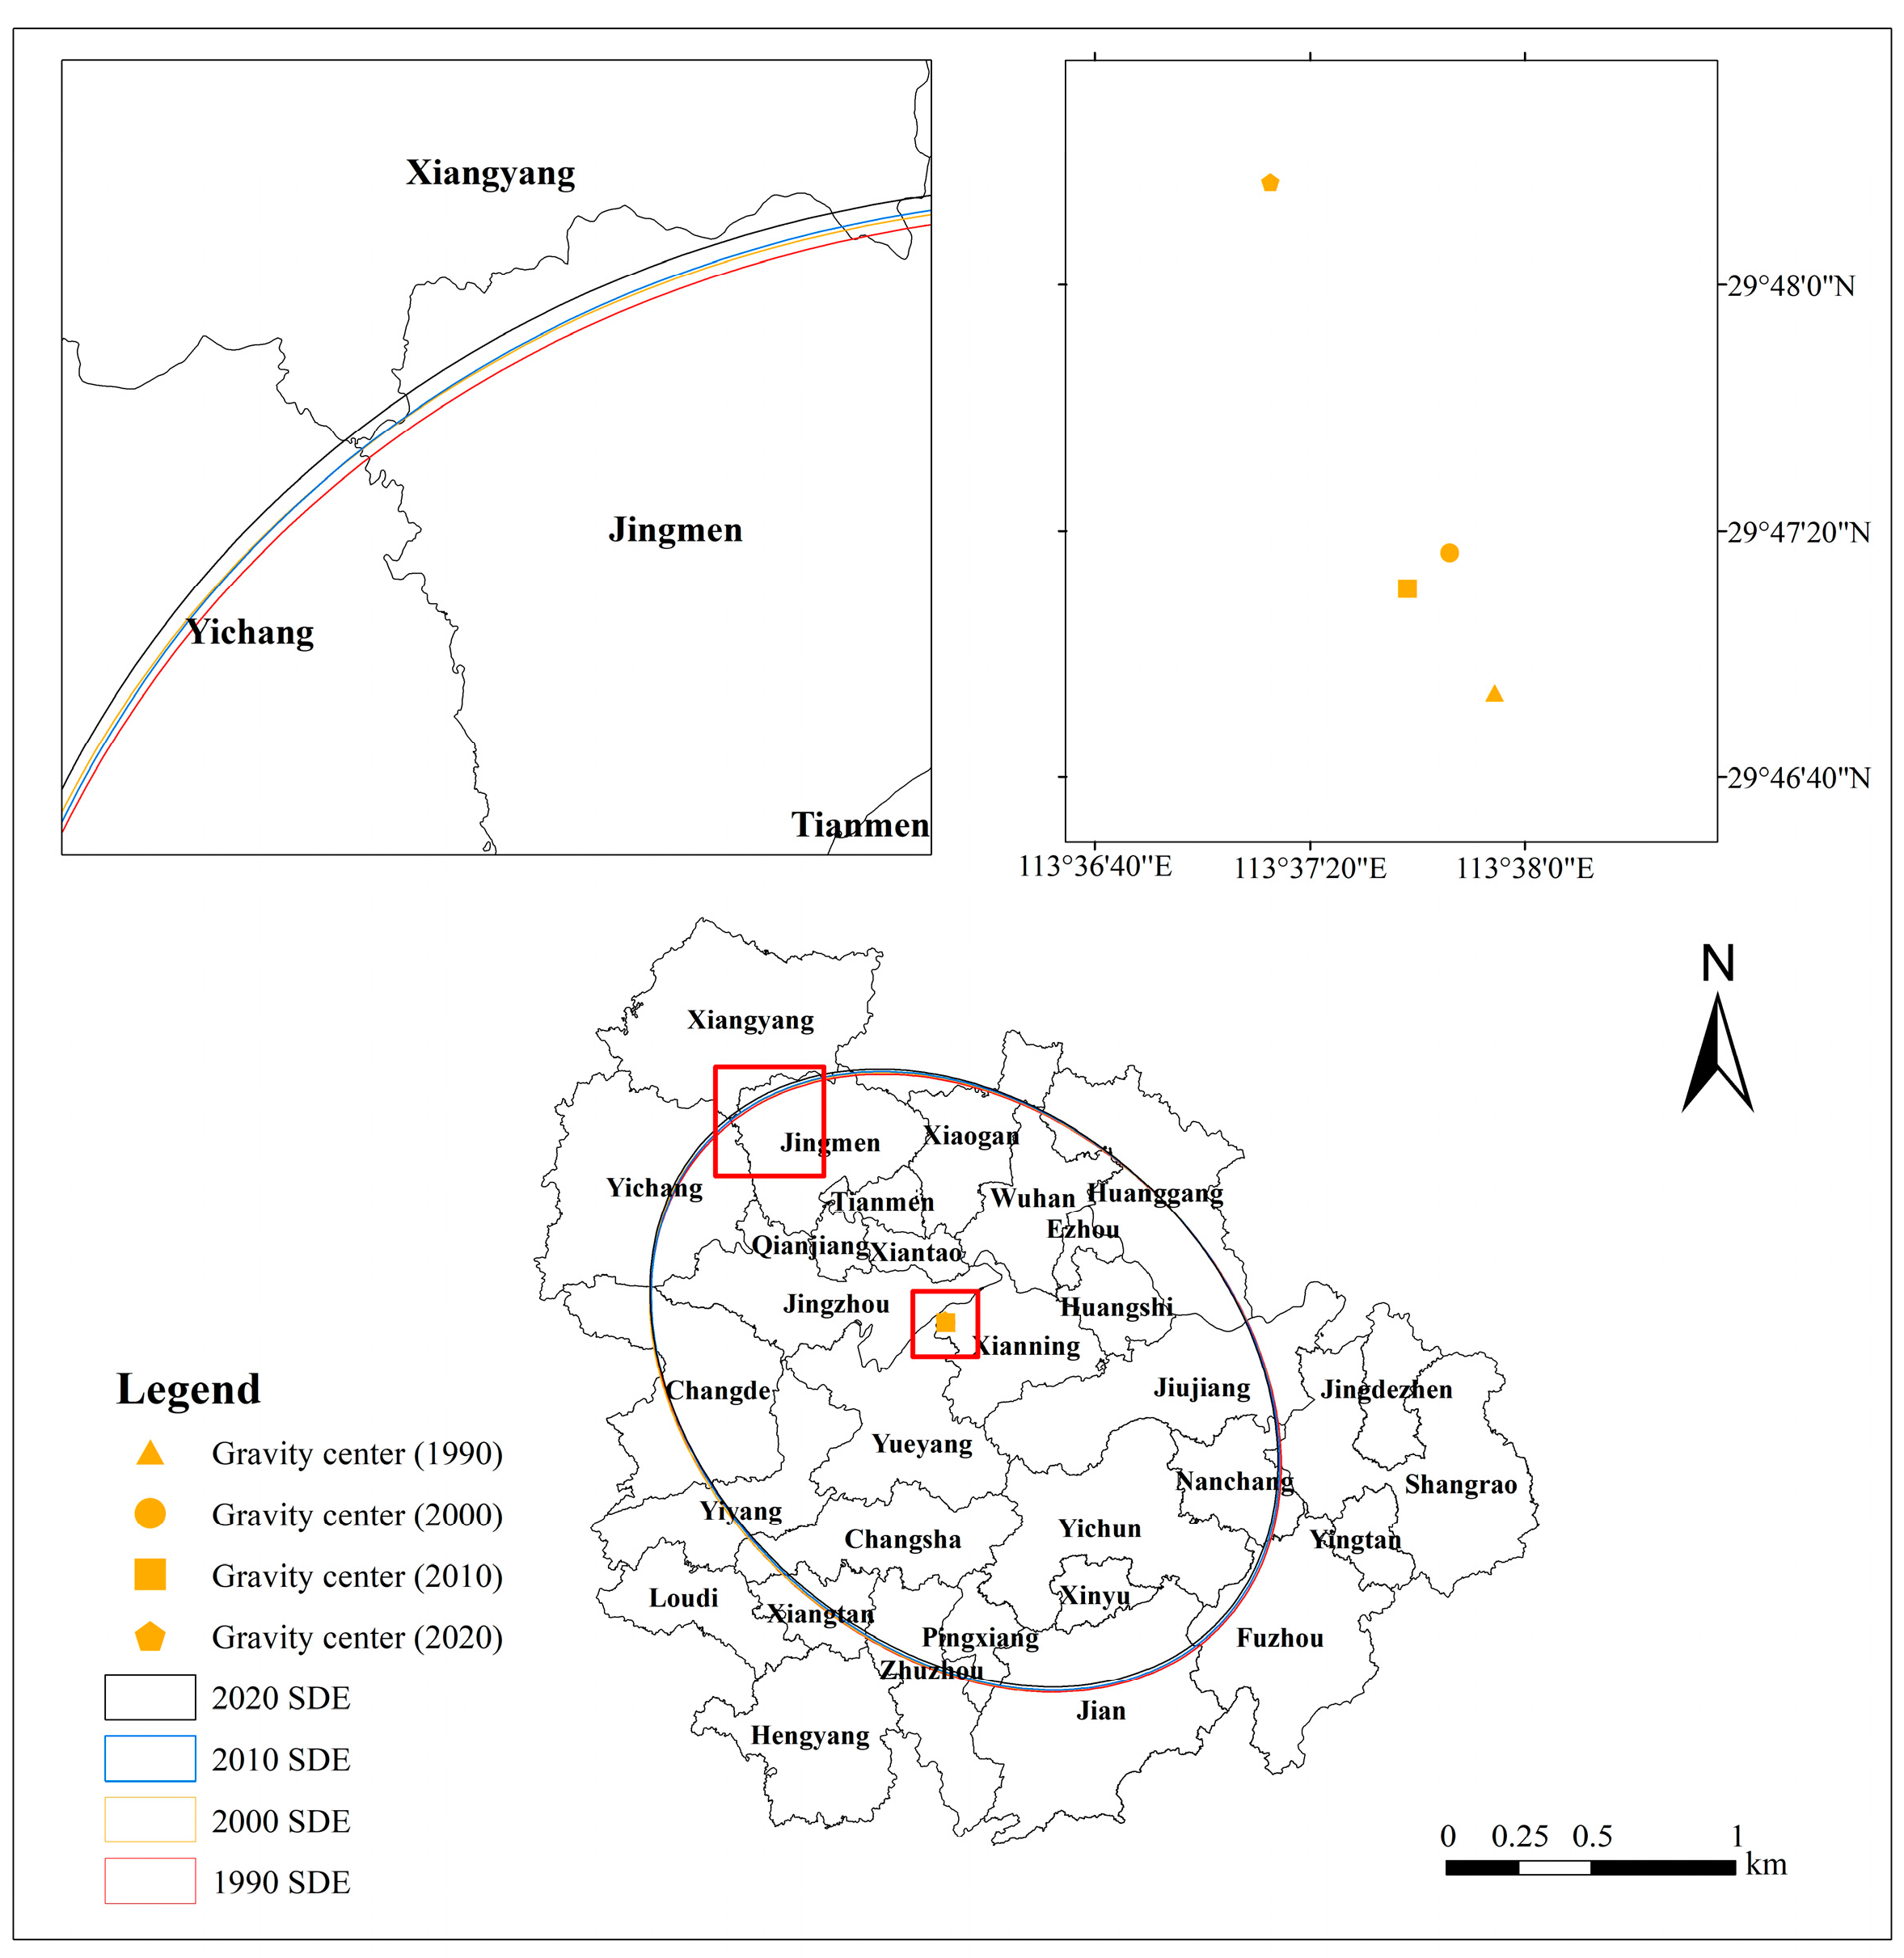
The distance of gravity center migration, direction of gravity center migration, and standard deviation ellipse parameters of paddy field and dryland in 1990, 2000, 2010, and 2020 were calculated using formulas (1)–(5), as shown in Table 3 and Table 4. The gravity center migration trajectories and standard deviation ellipses for paddy fields and dryland in the MRYRUA were plotted based on the relevant parameters (Figure 3 and Figure 4).

Table 3.
Distance and direction of gravity center migration in paddy field and dryland.

Table 4.
Standard deviation ellipse parameters for paddy field and dryland.
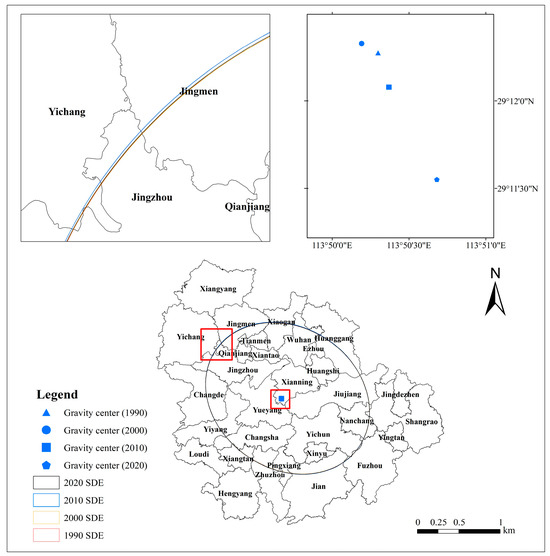
Figure 3.
Standard deviation ellipses and gravity center migration pathways in paddy fields.
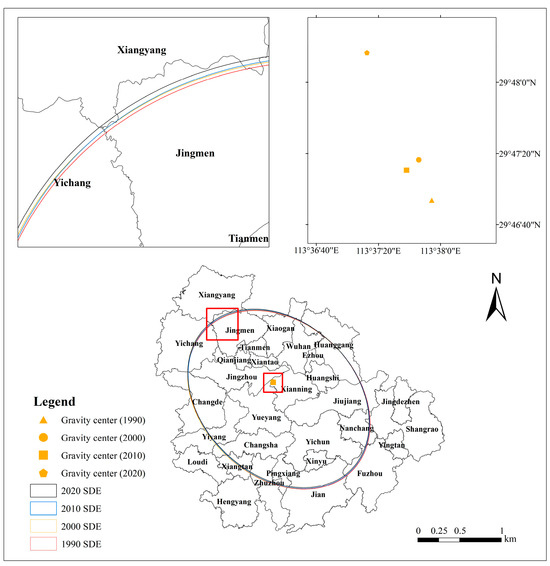
Figure 4.
Standard deviation ellipses and gravity center migration pathways in dryland.
The results show that the gravity centers of paddy field and dryland of the four periods were situated in the southwestern and northwestern parts of Xianning, Hubei. The distance of gravity center migration of paddy field has been continuously extended from 0.2 km to 1.1 km. The gravity center position of paddy field shows a change from northwest to southeast. The gravity center migration distance in dryland fluctuates from 0.74 km in 1990–2000 to 0.28 km in 2000–2010 to 2.15 km in the last 10 years. The span of gravity center migration is wider in dryland than it is in paddy fields. The direction of gravity center migration in dryland is opposite to that of paddy fields, with an overall southeast to northwest migration phenomenon.
The standard deviation ellipse of the paddy field showed a tendency to rotate horizontally from the vertical and then vertically, with the ellipse angle of rotation first narrowing from 122.19° to 117.99° and then recovering to 122.34°. The dryland standard deviation ellipse changed from a horizontal to vertical orientation, with the angle of rotation increasing from 130.16° to 130.61°. The overall decreasing trend in the y-axis standard deviation of the standard deviation ellipse for paddy field and dryland demonstrates a more pronounced nature of centripetal distribution in paddy field and dryland.
3.1.3. Dynamics Change in the Areas of Paddy Field and Dryland
By calculating and comparing the land-use dynamic degree of paddy fields and dryland in 31 cities within the MRYRUA (Table 5), we can grasp the rate of the quantitative change of paddy fields and dryland in different provinces and cities and further reveal the spatial-temporal change of these land uses at the administrative scale.

Table 5.
Dynamic degree of paddy field and dryland in each city from 1990 to 2020.
From 1990 to 2000, the number of paddy field and dryland in the cities of Hunan province showed a slow decline, with Changsha and Xiangtan showing the fastest decline in the number of dryland, which was related to the large-scale expansion of construction land after the integration of the Changsha–Zhuzhou–Xiangtan Urban Agglomeration [62]. The differences in the paddy field dynamic degrees between the cities in Hubei province are higher than those in dryland dynamic degrees. The fastest rates of change in Xiangyang paddy fields and Ezhou drylands. Dryland in Jiangxi province is decreasing faster than the rate of decreasing in paddy fields, especially in Jingdezhen, Pingxiang, and Xinyu. The frequent mining activities in Jiangxi Province from 1990 to 2000 led to the conversion of numerous drylands in these cities into mining districts [63].
From 2000 to 2010, the rate of decline in total cultivated land accelerated. The rate of change in dryland areas was generally greater than for paddy field during this period, with widespread dryland to paddy field conversion projects in China’s southern provinces being the main reason for this phenomenon [64]. The rate of change in paddy field is relatively fast in Changsha (Hunan province), Wuhan (Hubei province), and Pingxiang (Jiangxi province). The rate of change in dryland is relatively fast in Hengyang (Hunan province), Xiangyang (Hubei province), and Jingdezhen (Jiangxi province).
From 2010 to 2020, the declining trend of paddy field and dryland relatively slowed down, which is attributed to the permanent basic farmland protection measure and cultivated land use regulation policy implemented by the Chinese government [26]. In the case of paddy fields, only Changsha (Hunan province) and Ezhou and Xiantao (Hubei province) have higher rates of change. The number of dryland areas in Hunan and Jiangxi provinces remained on a downward trend at lower rates. In Hubei province, the number of dryland areas rebounded to some extent in all cities, except for Ezhou, Jingmen, and Qianjiang, where the number has remained in decline.
3.2. Attribution of Spatial-Temporal Change in Paddy Fields and Dryland
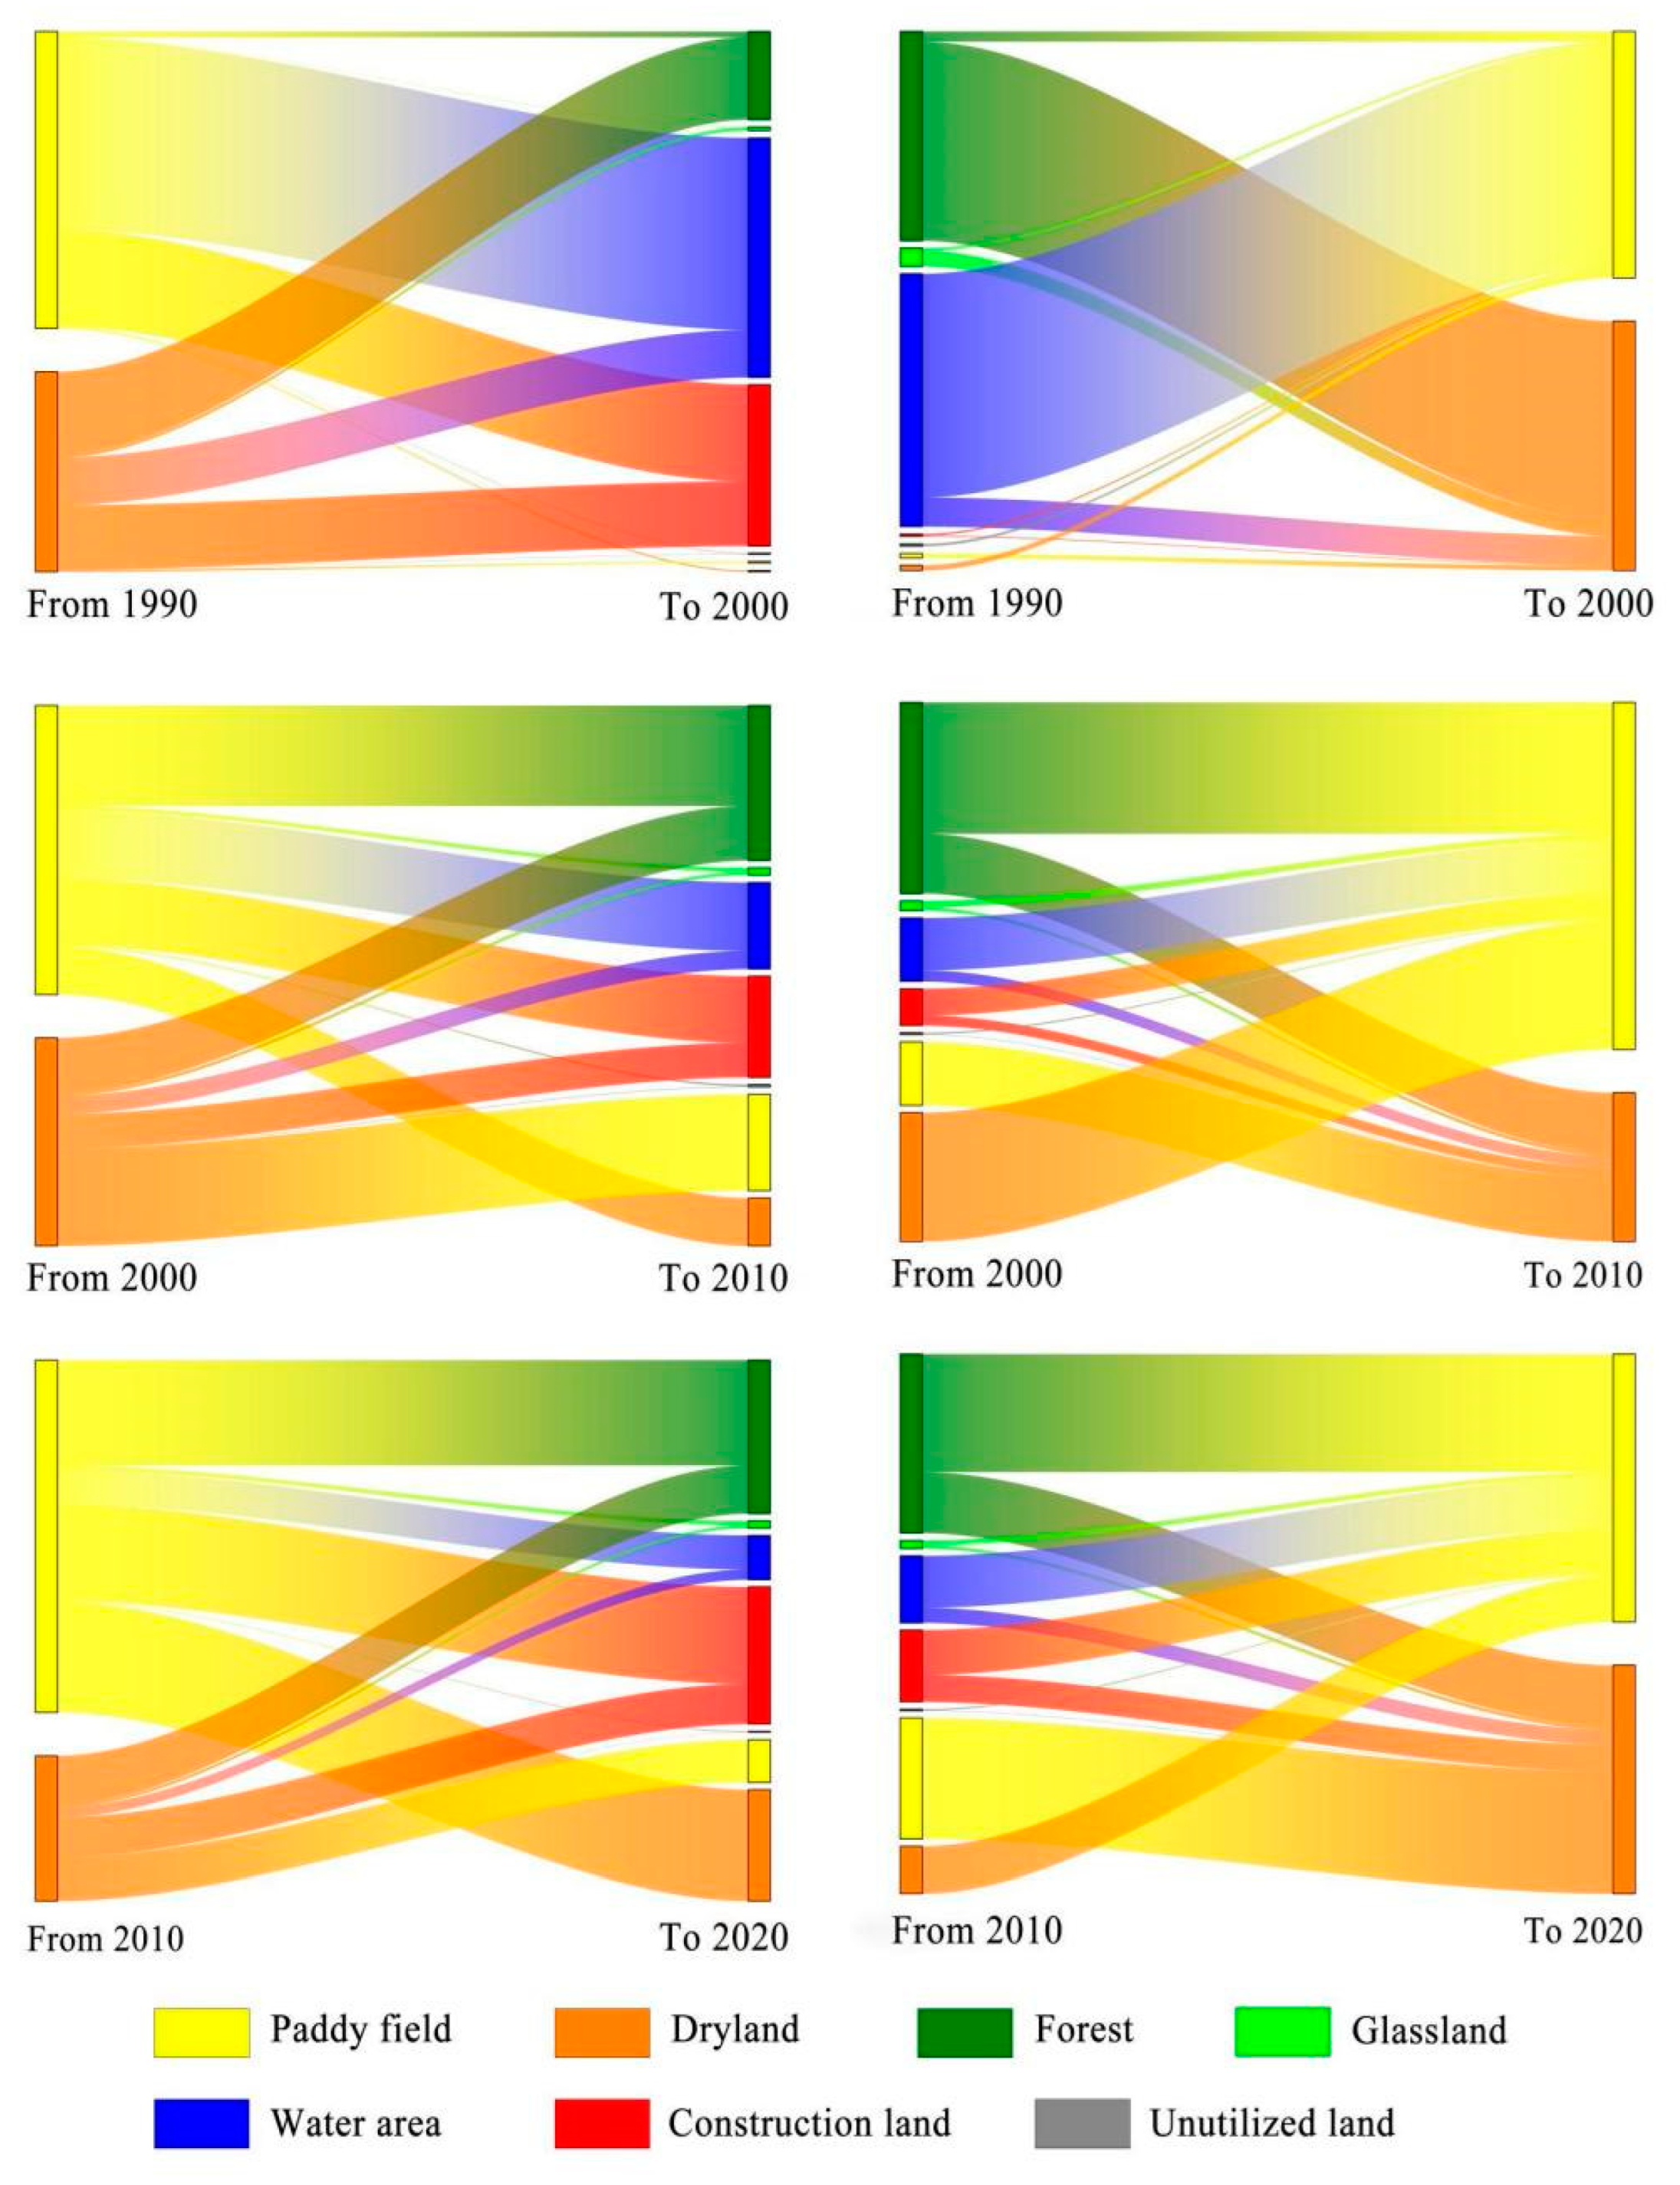
The conversion of paddy fields and dryland to other land use types is shown in Figure 5. The gain and loss of paddy fields and dryland from 1990 to 2020 are shown in Table 6 and Table 7.
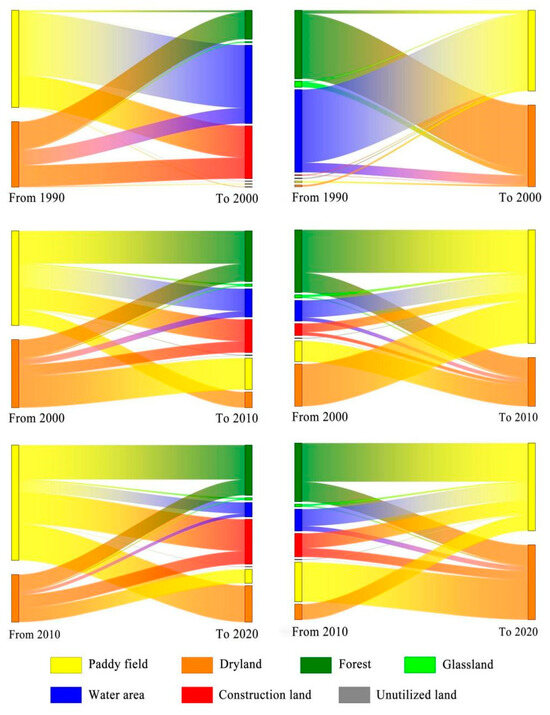
Figure 5.
Sankey diagram of paddy field and dryland loss and gain.

Table 6.
Amount and proportion of paddy field loss and gain.

Table 7.
Amount and proportion of dryland loss and gain.
From 1990 to 2000, there was a tendency for both paddy fields and dryland to decrease in area. More area was lost in paddy fields than in dryland. Paddy fields mainly flow to water areas and construction land. A total of 90.72% of the additional paddy fields originated from water areas, which was caused by the conversion of many lakes and wetlands in the MRYRUA into paddy fields due to the activities of enclosure of lakes and fields at the end of the last century [65]. Dryland was lost in larger quantities during this period, gaining less than half of the area of loss. Forests, construction land, and water areas became the main directions of dryland loss.
The years 2000 to 2010 were a period of rapid variation in paddy field and dryland areas. A total of 9393.30 km2 of paddy field and 6753.51 km2 of dryland were converted to other land types, of which 34.71% of the paddy fields and 26.33% of the dryland were converted to forest. Under the impact of the Chinese government’s policy of returning cultivated land to forest since the 21st century [66], paddy fields and dryland mainly flowed to forest during this period. In addition, to increase food production and improve farming conditions, the Chinese government has conducted a large-scale “dryland to paddy field” project in the MRYRUA. As a result, a larger portion of the lost dryland and additional paddy fields were interconverted among paddy fields and dryland.
Trends in paddy fields and dryland continue to be complex from 2010 to 2020. In the past, paddy fields and dryland mainly flowed to water areas and construction land, but nowadays paddy fields flow more to forest or the interconversion of paddy fields and dryland. This reflects the current changes in cultivated land, which are deeply influenced by agricultural production mode shift and food cultivation structure adjustment [67]. A total of 16.74% and 11.81% of additional paddy fields and dryland come from construction land, a proportion that has been increasing over the past three decades, which some studies have suggested is related to land consolidation measures in China [68].
3.3. Spatial-Temporal Change and Driving Mechanisms of Paddy Field and Dryland Fragmentation
3.3.1. Spatial-Temporal Change in Paddy Field and Dryland Fragmentation
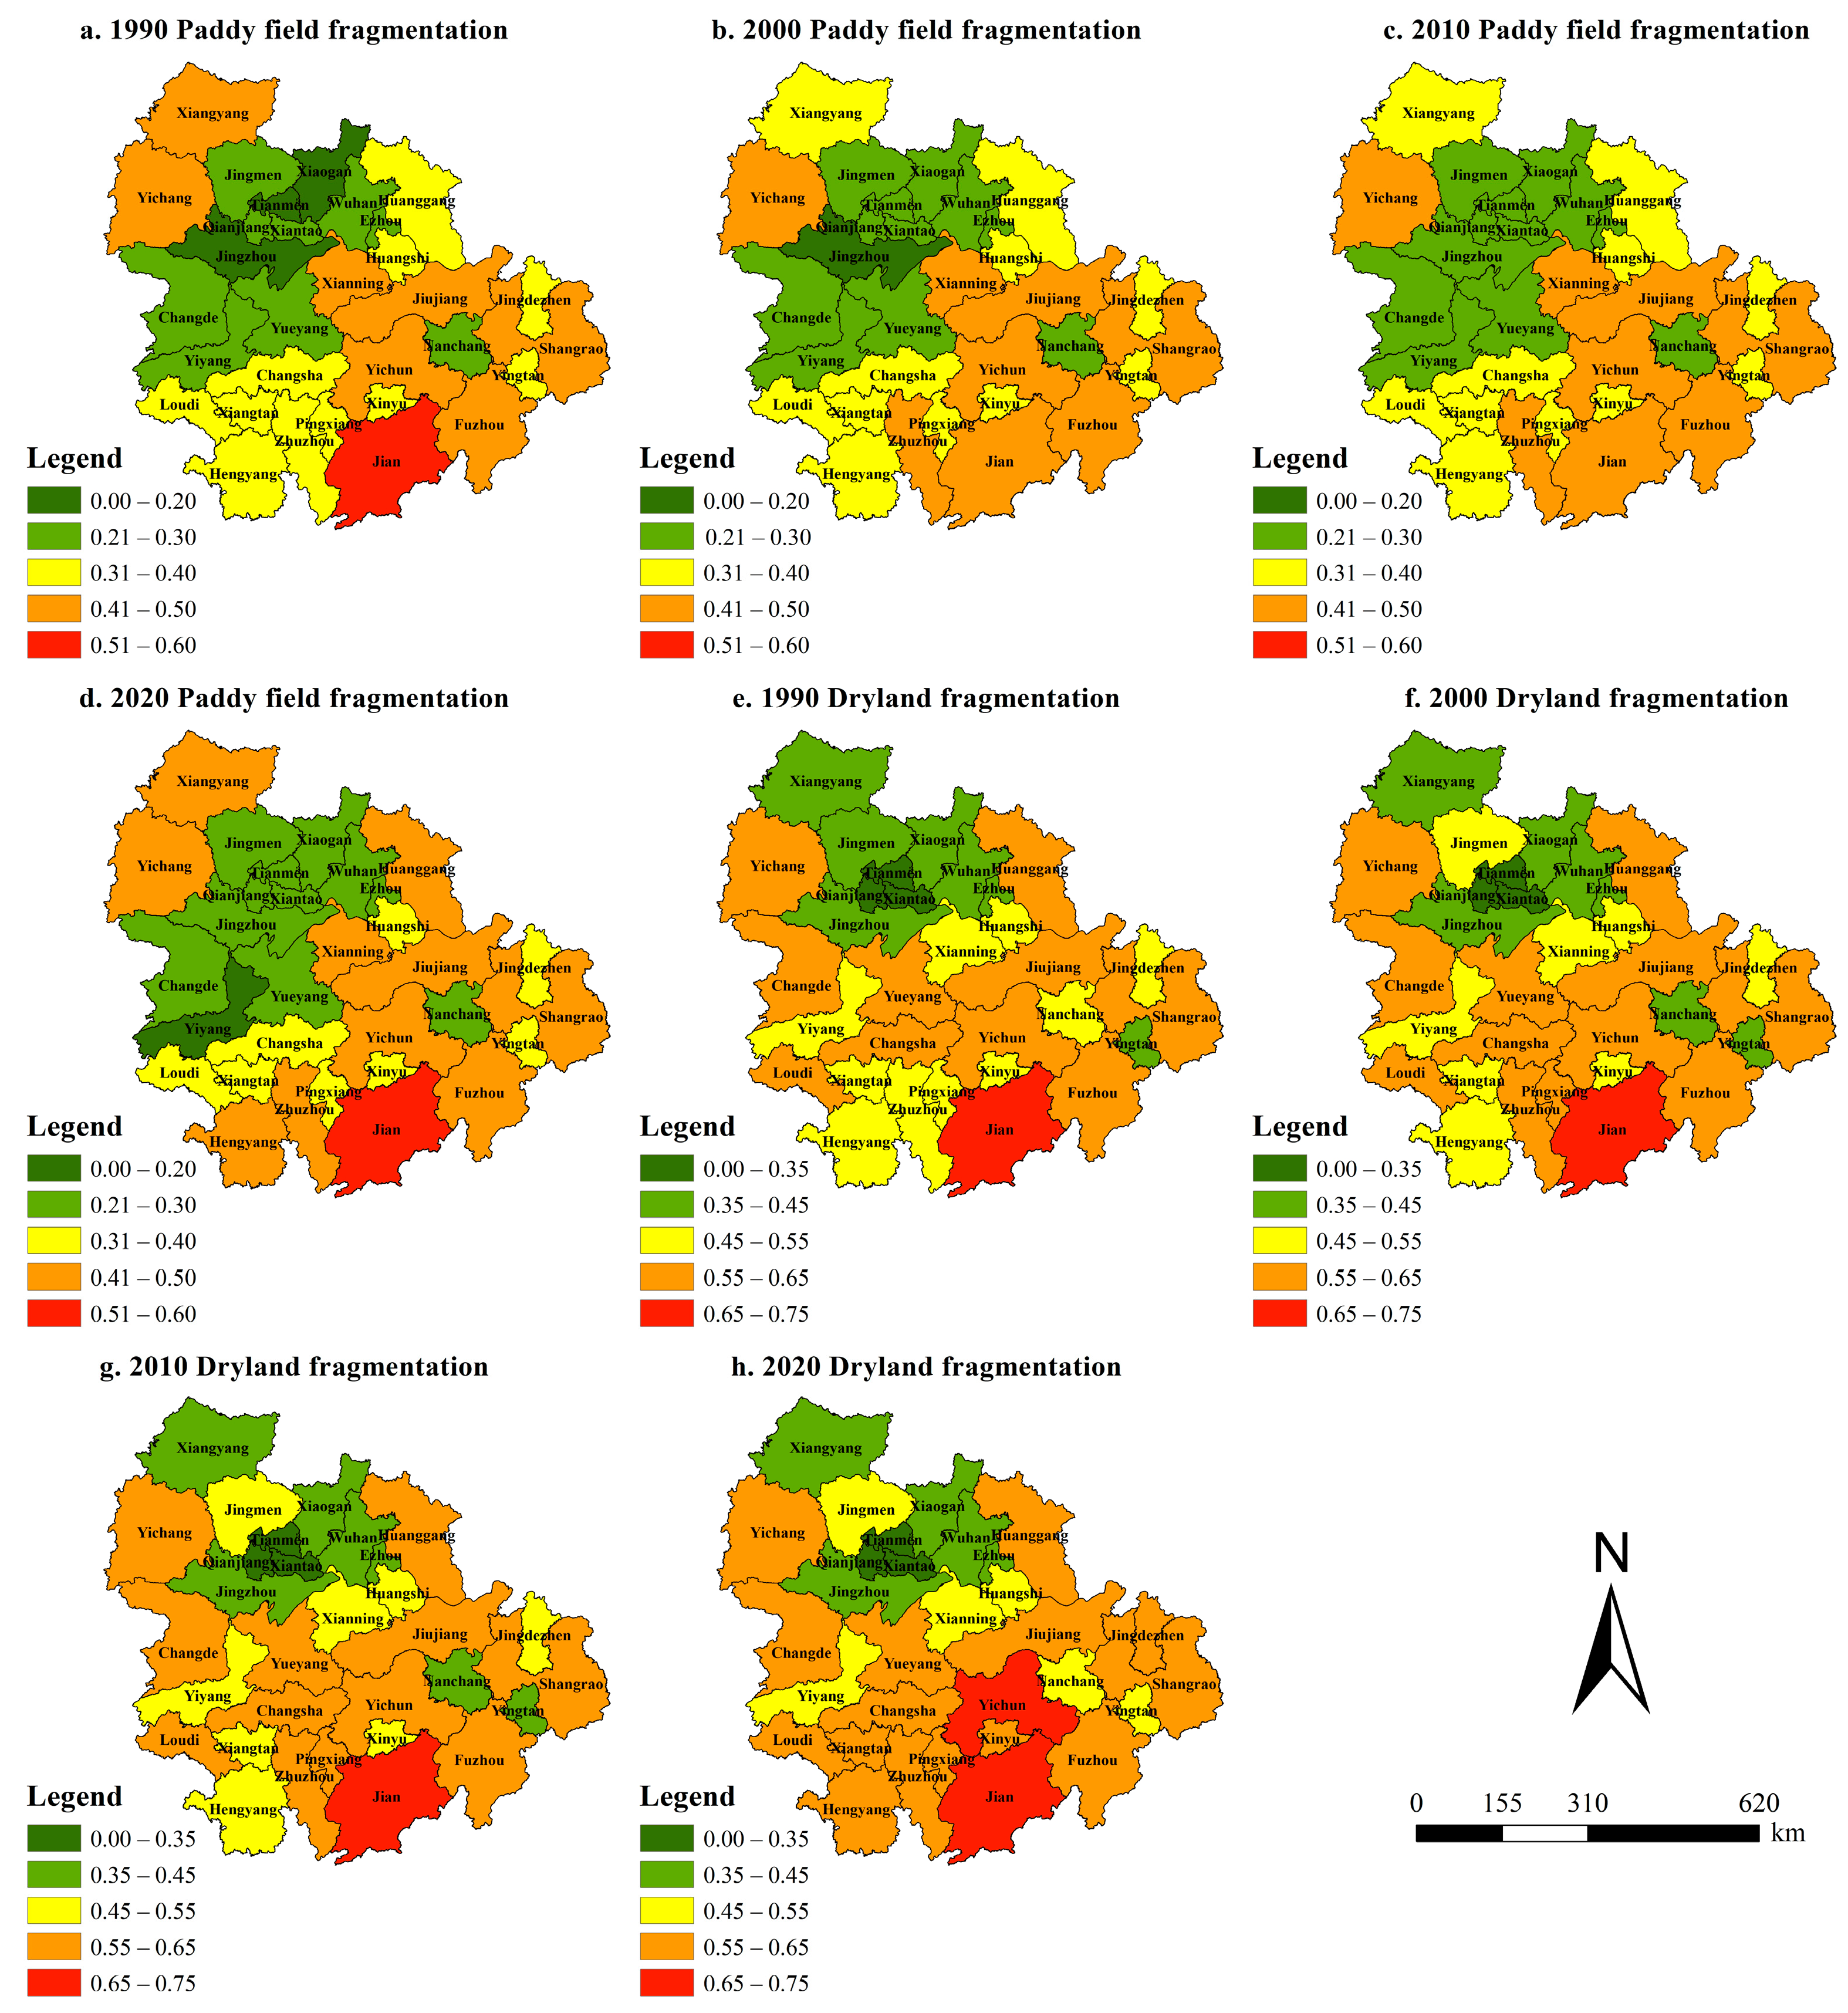
The spatiotemporal changes of the fragmentation of paddy field and dryland land are shown in Figure 6. Overall, there are more areas of high DLF values than PFF. High-value zones of PFF are concentrated in the eastern and northwestern parts of the MRYRUA. Low-value zones of PFF are clustered in the western and north-central parts of the MRYRUA. High-value zones of DLF are mainly clustered in Jiangxi province to the east of the MRYRUA and in Hunan province to the south. Low-value zones of DLF are clustered in Tianmen, Qianjiang, and Xiantao in central Hubei province.
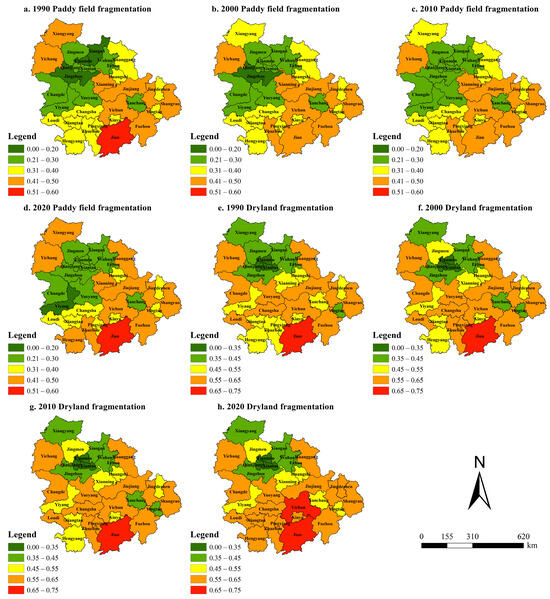
Figure 6.
Spatial changes in PFF in 1990 (a), 2000 (b), 2010 (c), and 2020 (d). Spatial changes in DLF in 1990 (e), 2000 (f), 2010 (g), and 2020 (h).
In terms of temporal changes, PFF and DLF have the strongest trends over the 2010–2020 period. The number of cities with PFF > 0.4 has risen from 8 in 1990 to 11 in 2020, and the number of cities with DLF > 0.55 has gradually increased from 11 in 1990 to 13 in 2000 and 17 in 2020. The change in the number of high-value zones of PFF and DLF shows a slow rise in the early part of the period and a sharp rise in the later part of the period. In the case of paddy fields, only Yiyang’s PFF has declined from a range of 0.21–0.3 to a range of less than 0.2 over the past 30 years, while the other cities’ PFF ranges have either remained unchanged or shown an increase. As far as dryland is concerned, only eight cities located in Hubei have consistently maintain the low value of DLF < 0.45, and the cities belonging to Hunan and Jiangxi provinces have a more obvious trend of increasing DLF.
3.3.2. Driving Mechanisms of Fragmentation in Paddy Fields and Dryland
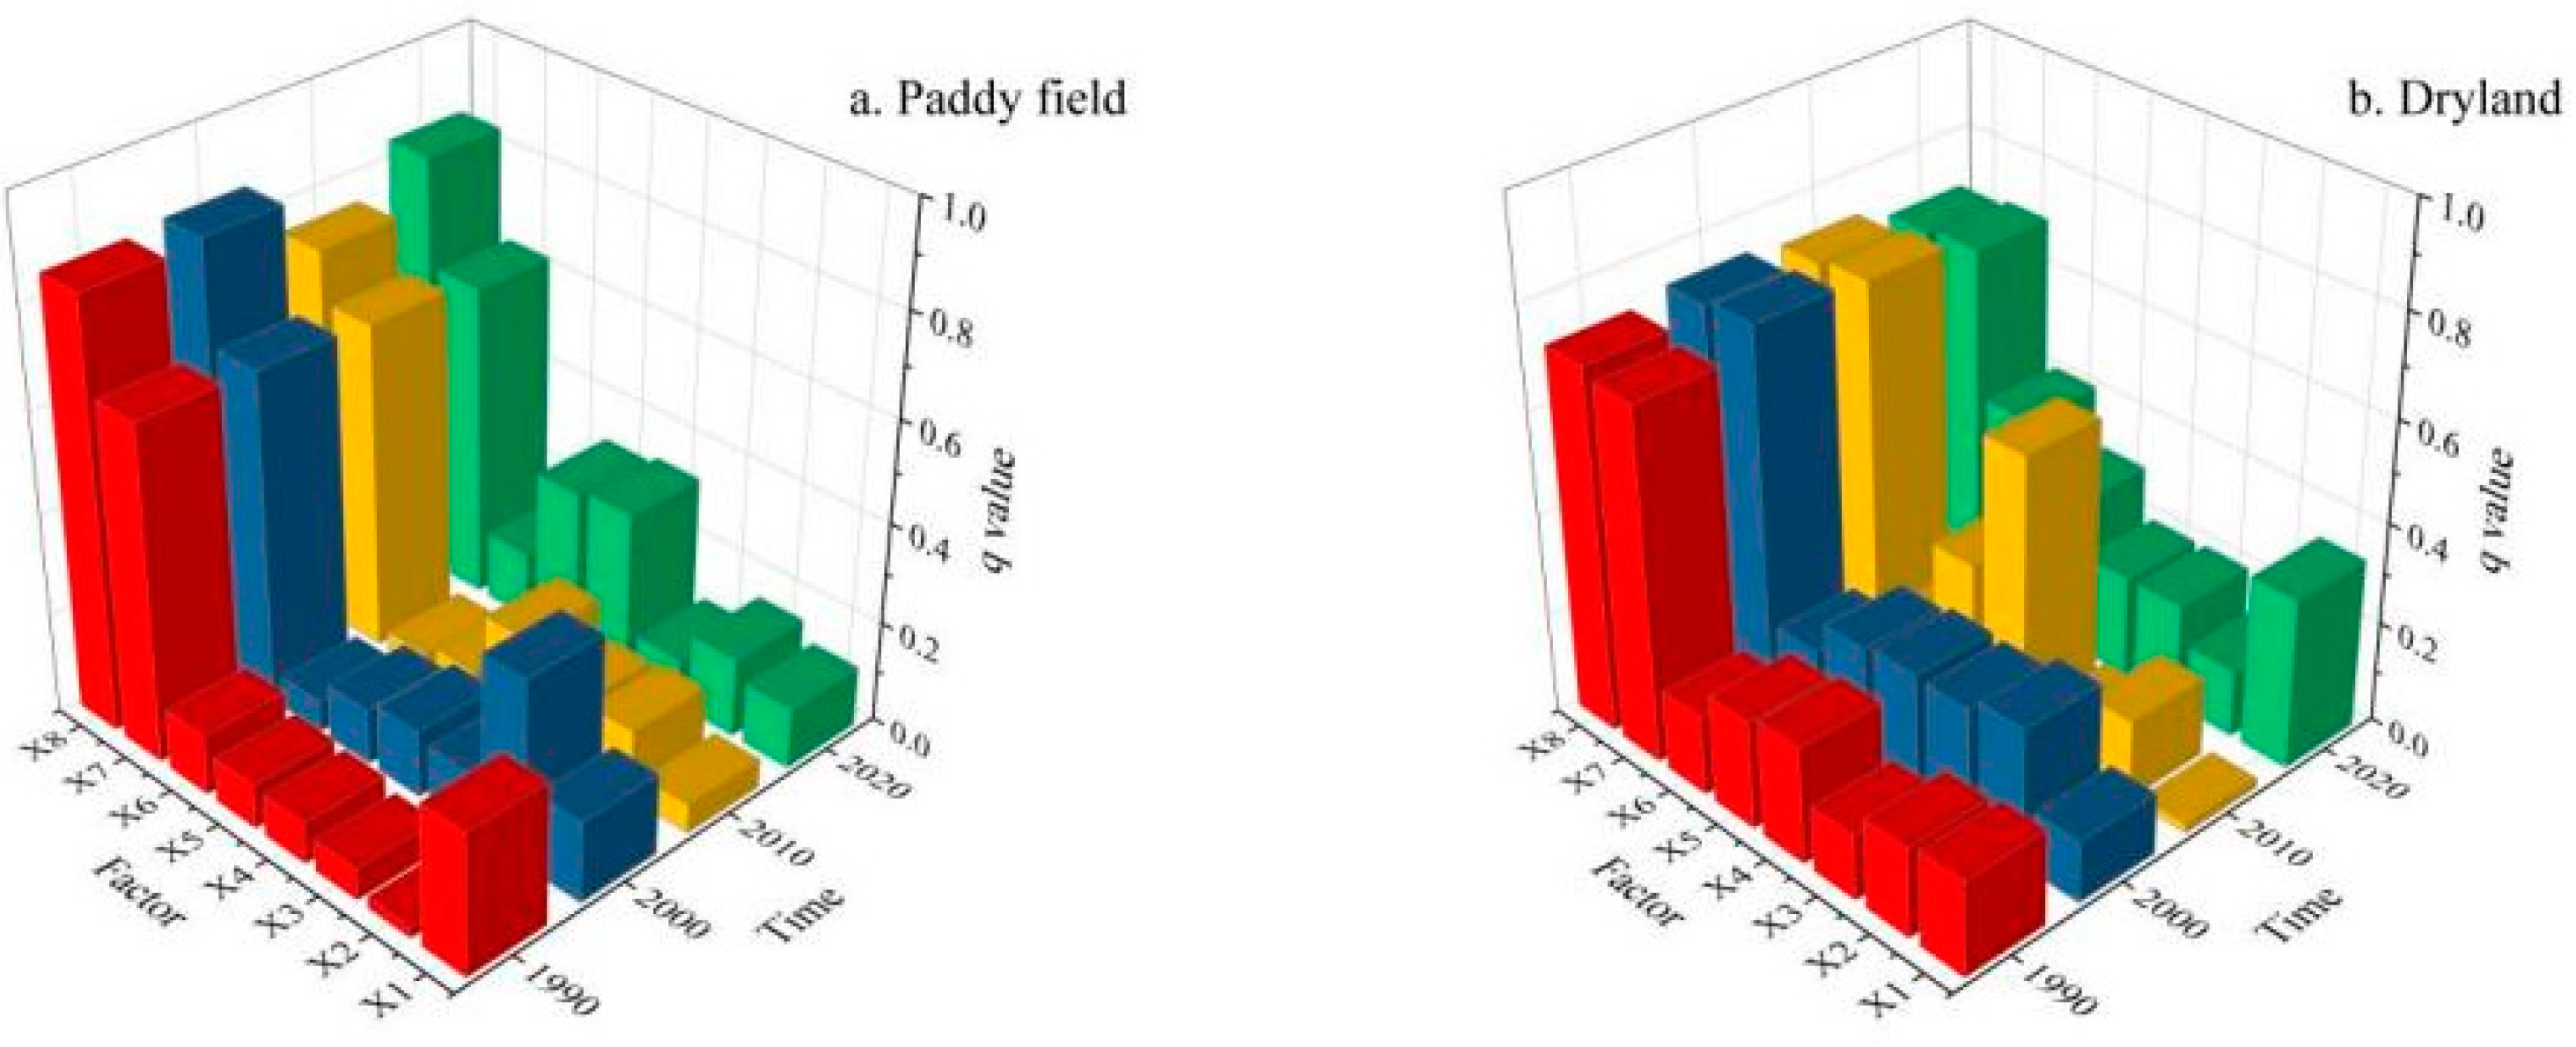
The results of factor detector for socioeconomic factors, agricultural development, and natural conditions on PFF and DLF are shown in Figure 7. Among the socioeconomic factors, the proportion of industry and service industry (X2) and per capita regional GDP (X1) have a higher influence power (q) on PFF, with annual average influence power (q) values of 0.1714 and 0.1552, which are much higher than the value of 0.0997 for urbanization rate (X3). Among the agricultural development factors, the annual average influence power (q) of per capita disposable income of rural residents (X4) on PFF and DLF is 0.1857 and 0.3095, which is a relatively important factor driving spatial-temporal change in PFF and DLF. Among the natural condition factors, slope (X8) and elevation (X7) had consistently high influence power (q) on PFF and DLF. The mean annual influence power (q) values for elevation were 0.6512 and 0.7208, respectively, and for slope were 0.8226 and 0.7164, respectively. The factors of socioeconomic and agricultural development categories are significantly weaker in driving PFF and DLF than the factors of natural conditions. Elevation and slope of cultivated land are the dominant factors driving PFF and DLF in both paddy field and dryland.
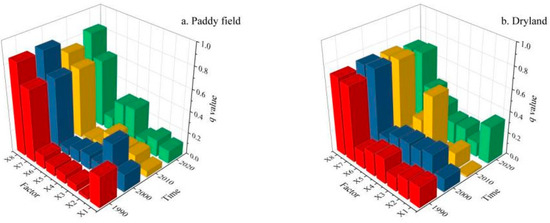
Figure 7.
The influence power of PFF (a) and DLF (b) driving factors.
Although natural conditions have always been a key factor influencing PFF and DLF, the influence of other driving factors has also changed over time. In 1990 and 2000, macroeconomic indicators represented by per capita regional GDP (X1) and the proportions of industry and service industry (X2) were the driving factors that had a large impact on PFF and DLF. However, the impact of driving factors reflecting the socioeconomic level on PFF has been weakening since the 21st century. The impact on DLF is also far less than that of per capita disposable income of rural residents (X4) and per capita arable land area (X6), which reflect the level of agricultural development. In general, socioeconomic indicators serve as rigid criteria used to measure the level of regional development in the early stages of rapid urbanizing in China [69]. It is inextricably linked to various social phenomena, including cultivated land fragmentation. As economic growth has plateaued, CLF, as a typical problem manifested in the agricultural production process, has gradually returned to the realm of agriculture and rural [70], forming a closer link with farmer as the main body of cultivated land utilization.
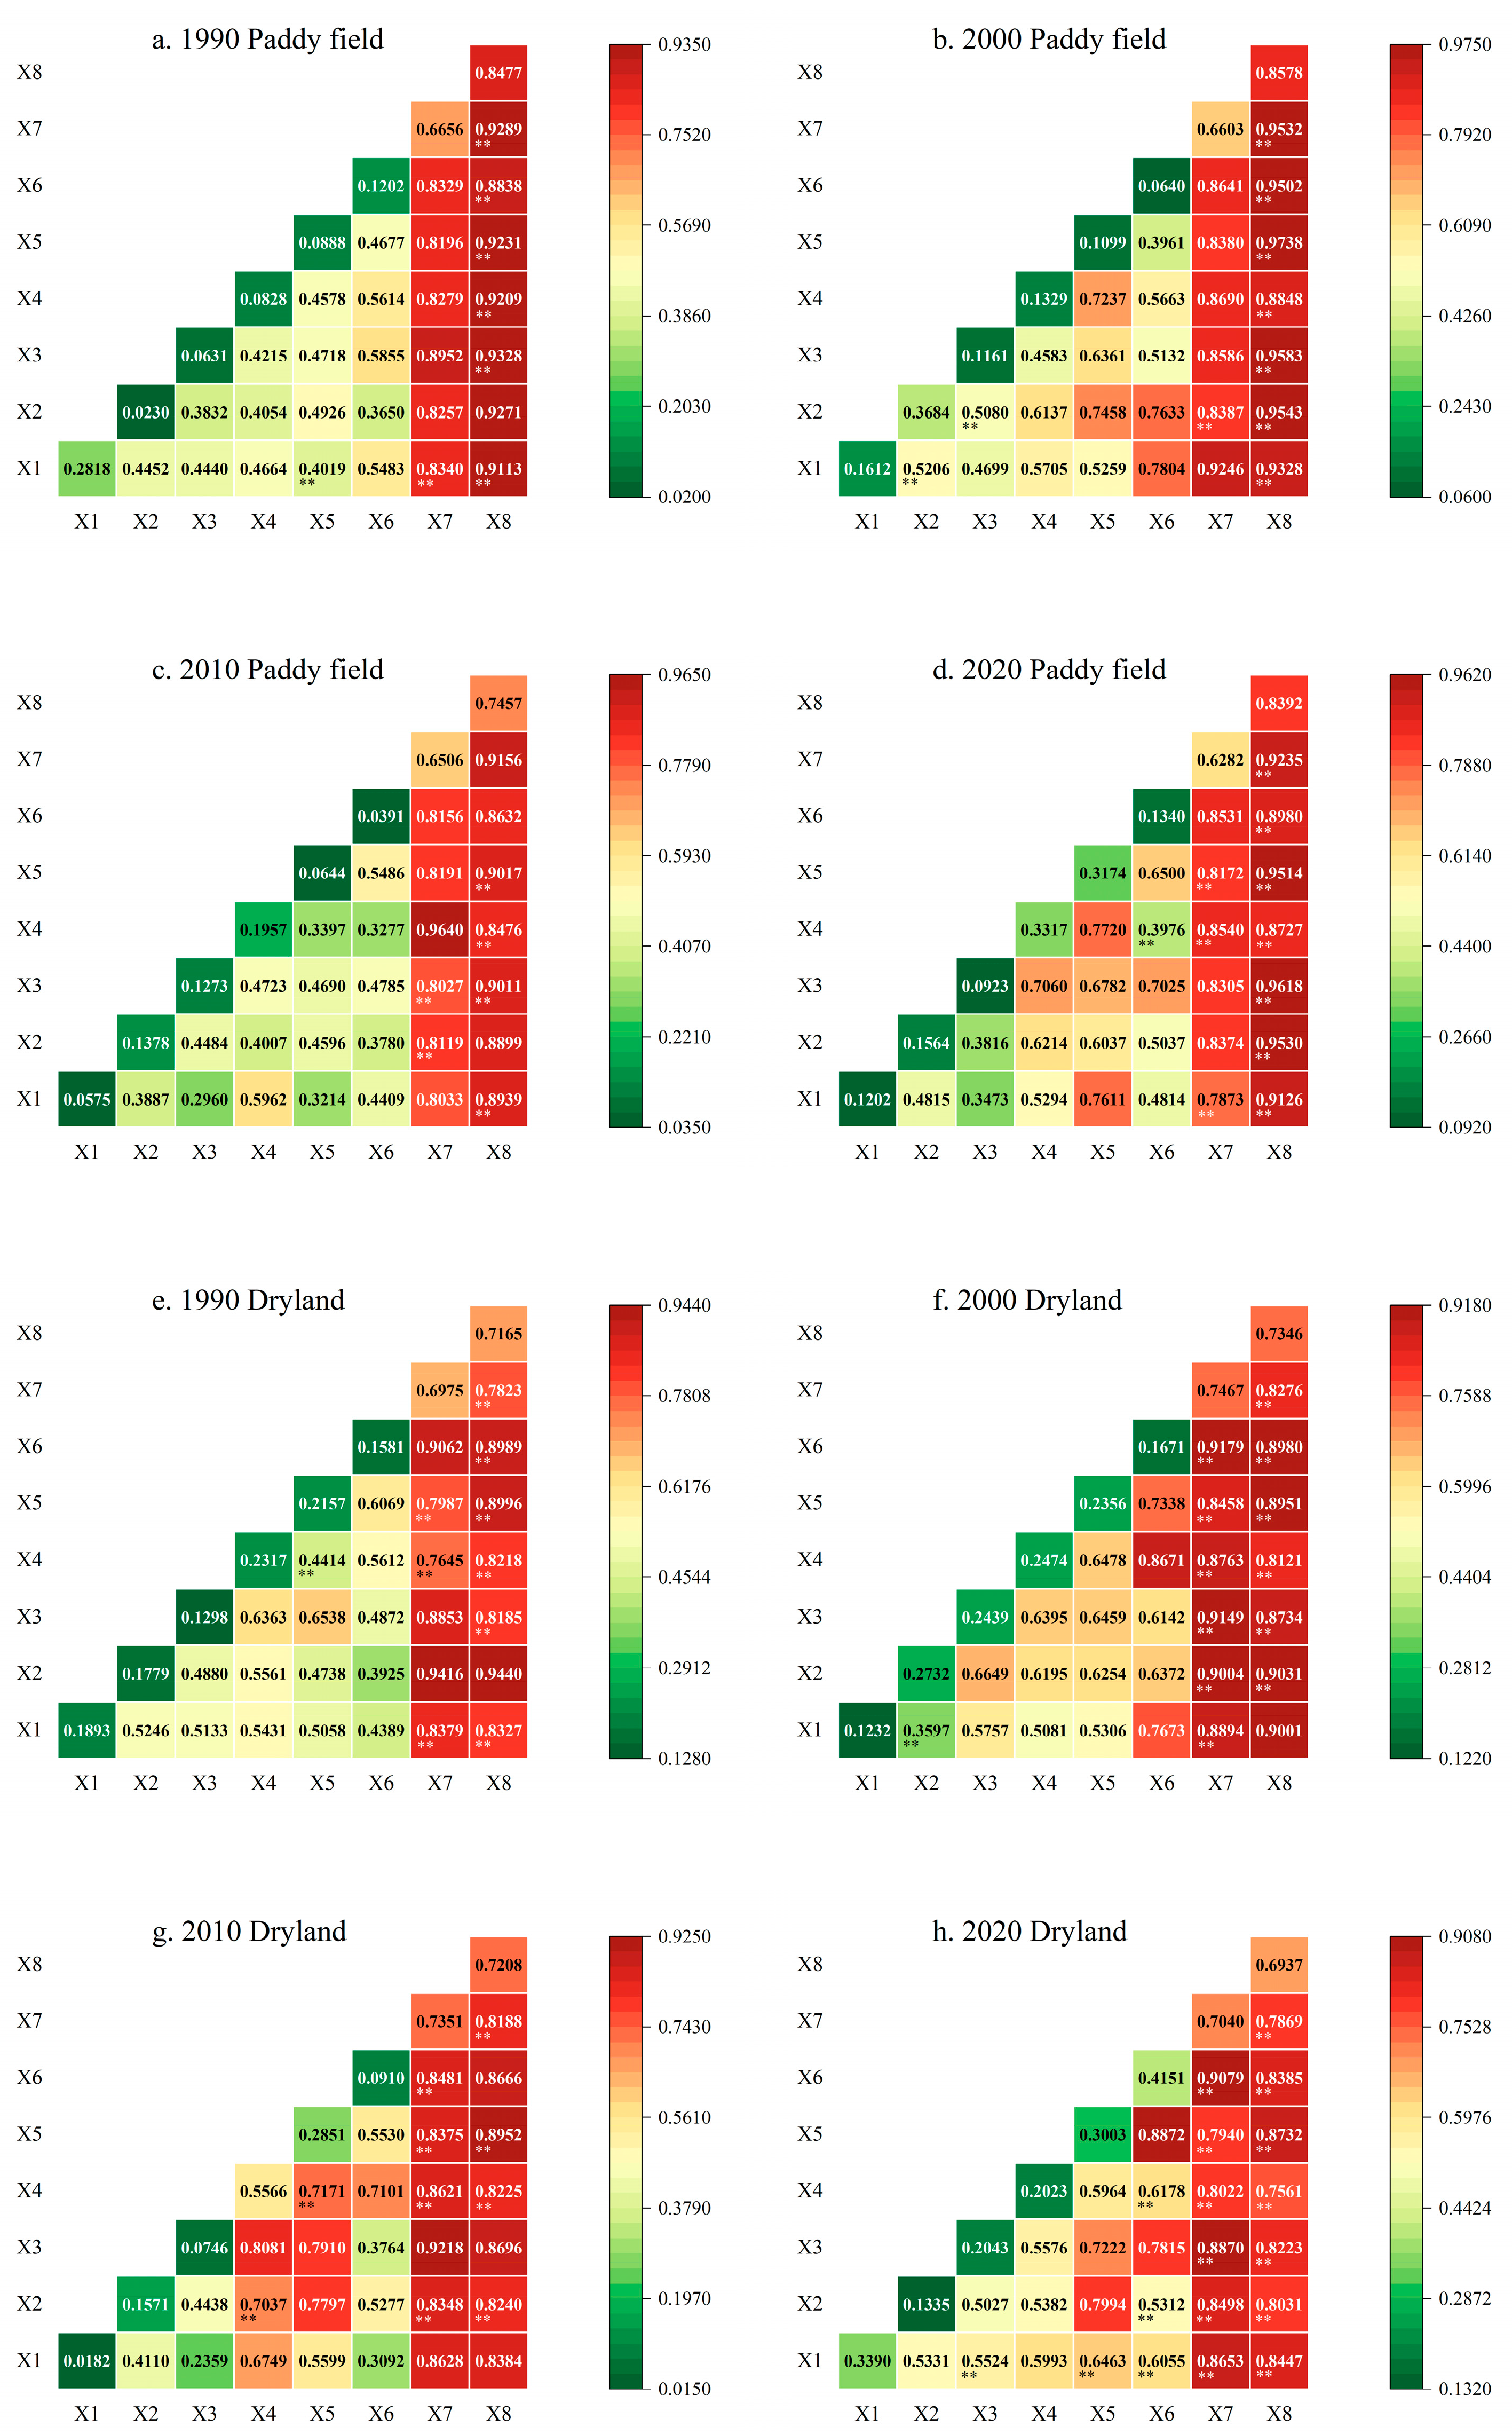
Interaction detector results are shown in Figure 8. Each pair of factors drove both PFF and DLF more than a single factor. This interaction driving force is either bifactor enhancement or nonlinear enhancement. Among the driving factors of PFF, the combinations of factors with high influence power (q) in the four periods are urbanization rate and paddy field slope (1990, 0.9328), grain output and paddy field slope (2000, 0.9738), per capita regional disposable income of rural residents and paddy field elevation (2010, 0.9640), and urbanization rate and paddy field slope (2020, 0.9618). Among the driving factors of the DLF, the factor combination with the higher influence power (q) for the four periods is the proportion of industry and service industry and dryland slope (1990, 0.9440), per capita cultivated land area and dryland elevation (2000, 0.9179), urbanization rate and dryland elevation (2010, 0.9218), and per capita cultivated land area and dryland elevation (2020, 0.9079).
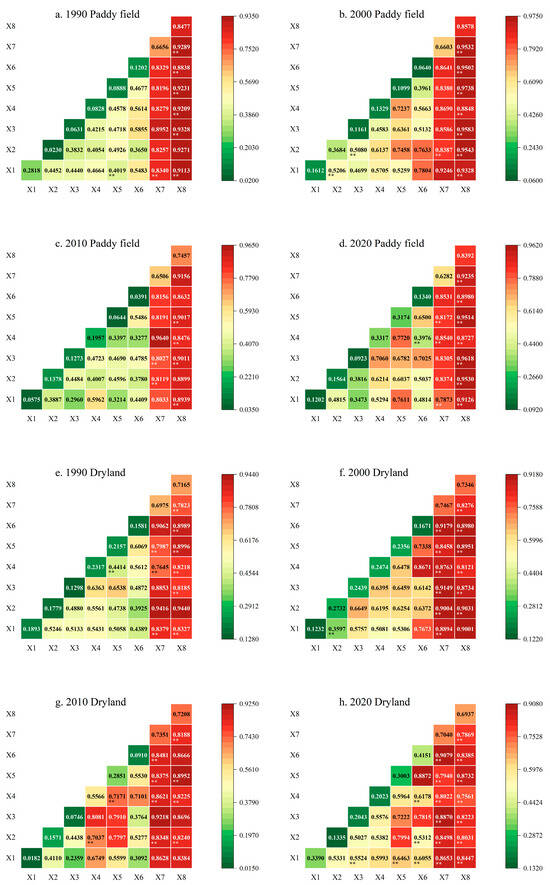
Figure 8.
The influence power of PFF interaction driving factor in 1990 (a), 2000 (b), 2010 (c), and 2020 (d). The influence power of DLF interaction driving factor in 1990 (e), 2000 (f), 2010 (g), and 2020 (h). The heat map with ** represents bifactor enhancement.
4. Discussion
4.1. Analysis of Spatial-Temporal Change Characteristics of Paddy Fields and Dryland
Climatic differences between the north and south of China have indirectly shaped the two patterns of cultivated land utilization, paddy field, and dryland by influencing the structure of crop cultivation [71]. The MRYRUA is located in central China, adjacent to the Qinling–Huaihe River line in the north, which divides the north and south of China. The spatial distribution pattern of paddy field and dryland has commonality with the national pattern of paddy field and dryland at the macro level, but at the micro level, it is influenced by the regional natural conditions showing typical characteristics. In the Hunan and Jiangxi provinces, which are relatively low in latitude and hilly, the dominant type of cultivated land is paddy field. On the one hand, it is because the aquatic rice grown in paddy fields requires sufficient heat and water [72]. On the other hand, there is a serious loss of water and fertility in hilly soils, and paddy field is a land use pattern that better retains water and fertilizer and reduces the intensity of soil erosion [3], so local farmers will reclaim the land as paddy field. In contrast, dryland is concentrated in the central and northern Hubei province at higher latitudes due to the relatively low light, heat, and water requirements of wheat, maize, sorghum, and other grains produced in dryland [73].
Over the past 30 years, the gravity center of paddy fields in the MRYRUA has gradually shifted from the north to the warmer and wetter south. The gravity center of dryland has also shifted from the south to the relatively dry north. In different climatic environments, there are large differences in the growth suitability of crops grown in paddy fields and dryland [74]. If there is a mismatch between the cropping structure and natural endowment in the region, it will not only cause a decline in grain output but also aggravate problems such as desertification and soil erosion [3]. The eastern and southern parts of the MRYRUA are hilly areas with steep topography and fragmented surfaces, and the conversion of fragmented dryland into paddy fields through land improvement projects is conducive to improving the efficiency of cultivated land use and avoiding the occupation of cultivated land by urbanization and industrialization [75]. Similarly, the northern part of the MRYRUA is the contiguous and flat Jianghan Plain, which is suitable for adopting dryland farming pattern to achieve large-scale and mechanized agricultural production. Therefore, the evolution of the spatial distribution pattern of paddy field and dryland is essentially a process of continuous optimization of the utilization pattern of cultivated land, with the objective of conserving cultivated land resources and improving the efficiency of agricultural production.
During the past 30 years, a period of rapid urbanizing in China, urban expansion, policy guidance, and agricultural restructuring have had a more obvious impact on paddy field and dryland, especially in terms of both quantitative changes and land type conversion [76]. The scale and speed of change shows that the dynamics of paddy field and dryland changed most dramatically from 2000 to 2010. Wang [77] concluded that construction land expansion brought about by rapid urbanizing was the major cause of the massive cropland loss during this period. However, the contribution of construction land to the decline in paddy field and dryland areas during the period was only 23.02% and 16.59%, with paddy field going mainly to forest and water bodies, and dryland going mainly to paddy field. The reason for this is related to the policy of returning cultivated land to forest and the project of converting dryland to paddy field implemented by the Chinese government. Since the flooding of the Yangtze River in 1998, the Chinese government has been gradually converting cultivated land into forest or lake in the middle reaches of the Yangtze River Basin out of concern for the preserving ecological environment. Although this has restored forest vegetation in the watershed and improved the capacity of the soil to contain water [78], it has resulted in the loss of cultivated land in some extent [65]. In addition, to stabilize food-growing areas by improving cultivated land quality, the Chinese government has extensively implemented land improvement projects to convert dryland into paddy field in the southern provinces [75], which has directly resulted in a large amount of dryland being converted into paddy field. Against the background of global warming, China has experienced frequent extreme drought weather since 2000. The northern Hubei province experienced severe drought for five consecutive years from 2010 to 2014 [79]. The arid climate coupled with poor water resources, inadequate water facilities, and insufficient labor led to the phenomenon of paddy fields being reconverted to dryland in Xiangyang city, northern Hubei province, from 2010 to 2020 [80]. Therefore, the implementation of projects to convert dryland to paddy field must coordinate among cultivated land use, topography, climate change, and water resource distribution.
4.2. Commonalities and Characteristics of Fragmentation Patterns in Paddy Fields and Dryland
Throughout the literature, CLF is widely recognized as a key obstacle to reducing agricultural productivity, accelerating land degradation, and hindering rural revitalization [13,20]. The spatial-temporal pattern of PFF and DLF, as two subdivisions of cultivated land under the paddy field and dryland types, have both commonality and individual characteristics.
The commonality of the PFF and DLF patterns in the MRYRUA is reflected in the spatial agglomeration of high-value and low-value zones. The low hills in the southeastern part of the MRYRUA are the high-value zone for PFF and DLF, and the Jianghan Plain in the northern part of the MRYRUA is the low-value zone for PFF and DLF. There are differences and characteristics in the magnitude of change in the degree of fragmentation in the low-value zones of the PFF and DLF. Tianmen, Qianjiang, Xiantao, and Jingzhou, which are located in the hinterland of the Jianghan Plain, have always been low-value zones for PFF and DLF. The upward trend of PFF in this region over the past 30 years has been more significant than that of DLF. The Jianghan Plain hinterland is the area of the MRYRUA where paddy field and dryland are most frequently converted to each other. Wang [81] have proved that the new paddy field created by dryland to paddy field conversion projects tend to have complex morphology and small patches, which are not favorable for resisting flooding and waterlogging. The rise in PFF in the region is related to the dryland to paddy field conversion project to some extent. In addition, the dryland to paddy field conversion project requires the installation of additional irrigation channels. The dense network of artificial channels will disrupt the landscape pattern of the ecological land and lead to a decline in the diversity of plant communities in natural areas [82]. To improve the disaster prevention and resilience of cultivated land, new paddy fields should be designed according to a more scientific model while limiting the scale of conversion between paddy field and dryland.
4.3. Driving Mechanisms of Paddy Field and Dryland Fragmentation
Similar to the conclusions presented by Xu [33], factor detector results confirmed that natural conditions represented by elevation and slope are the key factors affecting PFF and DLF. Therefore, proposing appropriate land improvement measures according to the geomorphological characteristics of different regions is the key to effectively optimizing the CLF problem [25]. The hilly and mountainous regions are characterized by a high degree of topographical relief, relatively poor cultivated land conditions, and a dispersed pattern of cultivated land. Over-cultivation of these steep and fragmented cultivated lands is not only ineffective in boosting grain output but also aggravates the problems of soil erosion and water loss. It is necessary to restore fragmented and poor-quality hillside cultivated land to ecological land such as forest, grassland, and wetland. Reclaiming cultivated land in areas with more suitable topography, water, and soil conditions will help to minimize the extent of CLF in the region.
The interaction detector results confirmed the existence of an interaction effect of factor combinations on PFF and DLF, with the combined effect of any two driving factors being stronger than the effect of a single factor. This finding is similar to that of Wang [55], demonstrating that the evolution of CLF is more influenced by a combination of conditions rather than just a single factor. In addition to elevation and slope, the proportion of industry and service industry and urbanization rate are among the combinations of factors that have a strong influence on PFF and DLF. In the context of rapid urbanization, industrial restructuring has led to the transformation of a large rural population into an urban population. The lack of agricultural labor has led to the increasing prominence of cultivated land abandonment, which further deepens the problem of CLF [10]. The government should actively conduct projects in the future, such as comprehensive land improvement in the whole region, reformation of the land property rights system, and the construction of basic farmland [32,33]. Government-led land management activities remain the key to solving the CLF problem.
4.4. Limitation and Prospect
Considering the differences in the classification system of different land-cover dataset, this study extracts paddy field and dryland based on CNLUCC with 1 km spatial resolution. Compared to other studies of land use change and land fragmentation [71], the relatively low spatial resolution of 1 km may involve the risk of insufficient precision and underestimation of the degree of fragmentation. Therefore, it is recommended in future studies to use a land-cover dataset processed from high-resolution remote sensing imagery for a more accurate identification of spatial-temporal paddy field and dryland distribution and fragmentation pattern. The driving factors of PFF and DLF selected in this study are not comprehensive enough to take into account the driving role of socioeconomic and agricultural development factors, such as local policies, development orientation, and land tenure, as well as the influence of natural conditions, such as precipitation, slope orientation, and soil texture. The future research should establish a more comprehensive evaluation system for CLF driving mechanisms to include a greater emphasis on local and regional differences in already-identified key parameters.
5. Conclusions
Paddy fields and dryland in the MRYRUA differ significantly in their distribution, with paddy fields covering a very wide area and dryland concentrated in central and northern Hubei province. From 1990 to 2020, the positions of gravity centers in paddy fields have undergone a change from northwest to southeast, while the gravity center for dryland has shifted from southeast to northwest. The loss and gain of paddy fields and dryland are related to the economic and policy context of the country in each period. The current development gap between urban and rural areas in China is large, so farmers choose to work in cities in industry and services for increasing income and gradually reduce the cost invested in the development and management of cultivated land [83]. This phenomenon will profoundly affect the characteristics of cultivated land utilization and expansion in the future. In general, local governments should coordinate the balance of rapid urbanization and cultivated land preservation, ensure that the total amount of cultivated land does not fall below the bottom line of food security, and appropriately arrange dryland to paddy field conversion projects in accordance with the topography, population, climate, and other conditions of the region.
High-value areas of PFF are mainly located in the hilly areas of Jiangxi and eastern Hunan provinces, while low-value areas are clustered in the plains of the northern Hunan and north-central Hubei provinces. High-value areas of DLF are concentrated in Jiangxi and Hunan provinces, while low-value areas are distributed to surrounding cities centered on Tianmen, Qianjiang, and Xiantao in the Hubei province. The main driving factors for the spatial variability of PFF and DLF are elevation and slope, and a relatively important factor is the per capita disposable income of rural residents. The influence of each factor on PFF and DLF is not independent. The proportions of industry and service industry and the natural conditions factors and the urbanization rate and the natural conditions factors are the factor combinations that have a greater influence on PFF and DLF. Although the average and number of high-value zones of PFF and DLF in the MRYRUA are still rising, the Chinese government is planning to build the existing basic farmland into regular-shaped and concentrated well-facilitated farmland before 2035, which will be helpful in controlling the rising trend. This study suggests that the negative impacts of increasing CLF can be gradually reduced through land improvement projects such as land fertility improvement, land leveling, and irrigation facility construction to narrow the differences in cultivated land endowment combined with high-efficiency land transfer and rational land property rights allocation.
Wheat and corn produced in dryland are the main food crops in most countries around the world, while rice produced in paddy fields is the typical food crop in those countries with large populations in East, South, and Southeast Asia. Few countries in the world have a pattern of interspersed paddy fields and dryland like China. This study analyzes the characteristics of spatiotemporal distribution and fragmentation driving mechanisms of paddy fields and dryland in different periods within the same region, hoping to provide reference for other countries to achieve sustainable agricultural development and increase food production under different cultivated land utilization patterns.
Author Contributions
Conceptualization, D.L. and L.D.; methodology, C.B.; software and validation, D.L. and L.D.; formal analysis and investigation, C.B.; resources, X.Z.; data curation, L.D.; writing—original draft preparation and writing—review and editing, D.L. and C.B; visualization, D.L.; supervision, X.Z. and Z.Z.; project administration, L.D. and Z.Z.; funding acquisition, L.D. and X.Z. All authors have read and agreed to the published version of the manuscript.
Funding
This research was funded by Jiangxi Provincial Social Science Foundation Project (Grant No. 23GL34), Humanities and social science research project of universities in Jiangxi Province (Grant No. GL22228), Open Fund of Key Laboratory of Mine Environmental Monitoring and Improving around Poyang Lake of the Ministry of Natural Resources(Grant No. MEMI-2021-2022-28), Key Laboratory for Digital Land and Resources of Jiangxi Province, East China University of Technology (Grant No. DLLJ202207), Science and Technology Research Project of Jiangxi Provincial Department of Education (Grant No. GJJ2200741), the Doctoral Research Initiation fund of East China University of Technology (Grant No. DHBK2019184), Jiangxi Provincial Natural Science Foundation Project(Grant No. 20232BAB203062), Science and Technology Research Project of Jiangxi Provincial Department of Education (Grant No. GJJ181516).
Data Availability Statement
No new data were created or analyzed in this study. Data sharing is not applicable to this article.
Conflicts of Interest
The authors declare no conflicts of interest.
References
- Zhou, H.; Lei, G.; Zhang, B.; Zhao, Y.; Zhang, X.; Dong, B. Farmland Change Induced Land and Water Resource Balance in Naoli River Basin from 1990 to 2013. Trans. Chin. Soc. Agric. Eng. 2015, 31, 272–280. [Google Scholar]
- Zhao, X.; Zhang, Z.; Wang, X.; Zuo, L.; Liu, B.; Yi, L.; Xu, J.; Wen, Q. Analysis of Chinese Cultivated Land′ s Spatial-Temporal Changes and Causes in Recent 30 Years. Trans. Chin. Soc. Agric. Eng. 2014, 30, 1–11. [Google Scholar]
- Xie, S.; Yin, G.; Wei, W.; Sun, Q.; Zhang, Z. Spatial–Temporal Change in Paddy Field and Dryland in Different Topographic Gradients: A Case Study of China during 1990–2020. Land 2022, 11, 1851. [Google Scholar] [CrossRef]
- Luo, X.; Wang, Y.; Wang, S.; Zheng, J.; Wang, D.; Wang, Z.; Gao, M. Spatiotemporal and Evolutional Characteristics of Paddy Yield in the Three Gorges Reservoir of Chongqing from 1990 to 2015. Chin. J. Agric. Resour. Reg. Plan 2022, 43, 71–80. [Google Scholar]
- Li, S.; Wang, Z. Dryland Agriculture in Eastern Asia. Dryland Agric. 2006, 23, 671–731. [Google Scholar]
- Ouyang, W.; Shan, Y.; Hao, F.; Lin, C. Differences in Soil Organic Carbon Dynamics in Paddy Fields and Drylands in Northeast China Using the CENTURY Model. Agric. Ecosyst. Environ. 2014, 194, 38–47. [Google Scholar] [CrossRef]
- Downing, T.E. Partible Inheritance and Land Fragmentation in a Oaxaca Village. Hum. Organ. 1977, 36, 235–243. [Google Scholar] [CrossRef]
- Jin, X.; Shao, Y.; Zhang, Z.; Resler, L.M.; Campbell, J.B.; Chen, G.; Zhou, Y. The Evaluation of Land Consolidation Policy in Improving Agricultural Productivity in China. Sci. Rep. 2017, 7, 2792. [Google Scholar] [CrossRef]
- Kalantari, K.; Abdollahzadeh, G. Factors Affecting Agricultural Land Fragmentation in Iran: A Case Study of Ramjerd Sub District in Fars Province. Am. J. Agric. Biol. Sci. 2008, 3, 358–363. [Google Scholar] [CrossRef][Green Version]
- Zhou, Y.; Xu, K.; Feng, Z.; Wu, K. Quantification and Driving Mechanism of Cultivated Land Fragmentation under Scale Differences. Ecol. Inform. 2023, 78, 102336. [Google Scholar] [CrossRef]
- Penghui, J.; Dengshuai, C.; Manchun, L. Farmland Landscape Fragmentation Evolution and Its Driving Mechanism from Rural to Urban: A Case Study of Changzhou City. J. Rural. Stud. 2021, 82, 1–18. [Google Scholar] [CrossRef]
- Du, G.; Gai, Z.; Wang, H. Theoretical Explanation and Research Framework of Cultivated-Land Fragmentation in China. J. Earth Sci. Environ. 2021, 43, 997–1008. [Google Scholar]
- Xu, W.; Jin, X.; Liu, J.; Zhou, Y. Analysis of Influencing Factors of Cultivated Land Fragmentation Based on Hierarchical Linear Model: A Case Study of Jiangsu Province, China. Land Use Policy 2021, 101, 105119. [Google Scholar] [CrossRef]
- Ertunç, E. Analysis of the Effect of Land Consolidation Projects in Terms of Land Fragmentation and Parcel Shapes: The Case of Konya, Turkey. Arab. J. Geosci. 2020, 13, 350. [Google Scholar] [CrossRef]
- Di Falco, S.; Penov, I.; Aleksiev, A.; Van Rensburg, T.M. Agrobiodiversity, Farm Profits and Land Fragmentation: Evidence from Bulgaria. Land Use Policy 2010, 27, 763–771. [Google Scholar] [CrossRef]
- Wang, L.; Anna, H.; Zhang, L.; Xiao, Y.; Wang, Y.; Xiao, Y.; Liu, J.; Ouyang, Z. Spatial and Temporal Changes of Arable Land Driven by Urbanization and Ecological Restoration in China. Chin. Geogr. Sci. 2019, 29, 809–819. [Google Scholar] [CrossRef]
- Yang, Y.; Liu, Y.; Li, Y.; Li, J. Measure of Urban-Rural Transformation in Beijing-Tianjin-Hebei Region in the New Millennium: Population-Land-Industry Perspective. Land Use Policy 2018, 79, 595–608. [Google Scholar] [CrossRef]
- Lu, H.; Xie, H.; Yao, G. Impact of Land Fragmentation on Marginal Productivity of Agricultural Labor and Non-Agricultural Labor Supply: A Case Study of Jiangsu, China. Habitat Int. 2019, 83, 65–72. [Google Scholar] [CrossRef]
- Ji, Y.; Wang, X.; Lu, W.; Liu, Y. The Characteristics of Rural Labors, Land Fragmentation, and Agricultural Machinery Services. Res. Agric. Mod. 2016, 37, 910–916. [Google Scholar]
- Hao, W.; Hu, X.; Wang, J.; Zhang, Z.; Shi, Z.; Zhou, H. The Impact of Farmland Fragmentation in China on Agricultural Productivity. J. Clean. Prod. 2023, 425, 138962. [Google Scholar] [CrossRef]
- Song, W.; Liu, M. Farmland Conversion Decreases Regional and National Land Quality in China. Land Degrad. Dev. 2017, 28, 459–471. [Google Scholar] [CrossRef]
- Jin, R.; Li, B.; Zhou, T.; Wanatowski, D.; Piroozfar, P. An Empirical Study of Perceptions towards Construction and Demolition Waste Recycling and Reuse in China. Resour. Conserv. Recycl. 2017, 126, 86–98. [Google Scholar] [CrossRef]
- Kong, X. China Must Protect High-Quality Arable Land. Nature 2014, 506, 7. [Google Scholar] [CrossRef] [PubMed]
- Sklenicka, P.; Janovska, V.; Salek, M.; Vlasak, J.; Molnarova, K. The Farmland Rental Paradox: Extreme Land Ownership Fragmentation as a New Form of Land Degradation. Land Use Policy 2014, 38, 587–593. [Google Scholar] [CrossRef]
- Liu, J.; Jin, X.; Xu, W.; Zhou, Y. Evolution of Cultivated Land Fragmentation and Its Driving Mechanism in Rural Development: A Case Study of Jiangsu Province. J. Rural. Stud. 2022, 91, 58–72. [Google Scholar] [CrossRef]
- Wu, Y.; Shan, L.; Guo, Z.; Peng, Y. Cultivated Land Protection Policies in China Facing 2030: Dynamic Balance System versus Basic Farmland Zoning. Habitat Int. 2017, 69, 126–138. [Google Scholar] [CrossRef]
- Ntihinyurwa, P.D.; de Vries, W.T.; Chigbu, U.E.; Dukwiyimpuhwe, P.A. The Positive Impacts of Farm Land Fragmentation in Rwanda. Land Use Policy 2019, 81, 565–581. [Google Scholar] [CrossRef]
- Tan, S.; Heerink, N.; Qu, F. Land Fragmentation and Its Driving Forces in China. Land Use Policy 2006, 23, 272–285. [Google Scholar] [CrossRef]
- Bürgi, M.; Celio, E.; Diogo, V.; Hersperger, A.M.; Kizos, T.; Lieskovsky, J.; Pazur, R.; Plieninger, T.; Prishchepov, A.V.; Verburg, P.H. Advancing the Study of Driving Forces of Landscape Change. J. Land Use Sci. 2022, 17, 540–555. [Google Scholar] [CrossRef]
- Niroula, G.S.; Thapa, G.B. Impacts and Causes of Land Fragmentation, and Lessons Learned from Land Consolidation in South Asia. Land Use Policy 2005, 22, 358–372. [Google Scholar] [CrossRef]
- Cheng, L.; Xia, N.; Jiang, P.; Zhong, L.; Pian, Y.; Duan, Y.; Huang, Q.; Li, M. Analysis of Farmland Fragmentation in China Modernization Demonstration Zone since “Reform and Openness”: A Case Study of South Jiangsu Province. Sci. Rep. 2015, 5, 11797. [Google Scholar] [CrossRef] [PubMed]
- Liu, J.; Jin, X.; Xu, W.; Sun, R.; Han, B.; Yang, X.; Gu, Z.; Xu, C.; Sui, X.; Zhou, Y. Influential Factors and Classification of Cultivated Land Fragmentation, and Implications for Future Land Consolidation: A Case Study of Jiangsu Province in Eastern China. Land Use Policy 2019, 88, 104185. [Google Scholar] [CrossRef]
- Xu, M.; Niu, L.; Wang, X.; Zhang, Z. Evolution of Farmland Landscape Fragmentation and Its Driving Factors in the Beijing-Tianjin-Hebei Region. J. Clean. Prod. 2023, 418, 138031. [Google Scholar] [CrossRef]
- Liang, J.; Pan, S.; Chen, W.; Li, J.; Zhou, T. Cultivated Land Fragmentation and Its Influencing Factors Detection: A Case Study in Huaihe River Basin, China. Int. J. Environ. Res. Public. Health 2021, 19, 138. [Google Scholar] [CrossRef]
- Lv, T.; Fu, S.; Zhang, X.; Hu, H.; Zhang, Y. Spatiotemporal Evolution and Convergence of Agricultural Eco-Efficiency in the Middle Reaches of the Yangtze River. Phys. Chem. Earth Parts ABC 2023, 131, 103438. [Google Scholar] [CrossRef]
- Song, L.; Cao, Y.; Zhou, W.; Kuang, X.; Luo, G. Study on the Variation of Arable Land Use and Management Countermeasures under Rapid Urbanization: The Application of a Gravity Model in a Regional Perspective. Environ. Monit. Assess. 2019, 191, 120. [Google Scholar] [CrossRef] [PubMed]
- Ren, D.; Cao, A. Analysis of the Heterogeneity of Landscape Risk Evolution and Driving Factors Based on a Combined GeoDa and Geodetector Model. Ecol. Indic. 2022, 144, 109568. [Google Scholar] [CrossRef]
- Zeng, X.; Zhou, J.; Zhai, J.; Su, B.; Xiong, M. Research on Climate Projection for the Period 2011–2050 in the Yangtze River Basin. Clim. Chang. Res. 2011, 7, 116–122. [Google Scholar]
- Yang, B.; Zhang, Z.; Wu, H. Detection and Attribution of Changes in Agricultural Eco-Efficiency within Rapid Urbanized Areas: A Case Study in the Urban Agglomeration in the Middle Reaches of Yangtze River, China. Ecol. Indic. 2022, 144, 109533. [Google Scholar] [CrossRef]
- Ning, J.; Liu, J.; Kuang, W.; Xu, X.; Zhang, S.; Yan, C.; Li, R.; Wu, S.; Hu, Y.; Du, G. Spatiotemporal Patterns and Characteristics of Land-Use Change in China during 2010–2015. J. Geogr. Sci. 2018, 28, 547–562. [Google Scholar] [CrossRef]
- Min, Q.; He, L. Agro-Cultural Landscapes in China: Types and Significances. In Biocultural Landscapes; Hong, S.K., Bogaert, J., Min, Q., Eds.; Springer: Dordrecht, The Netherlands, 2014. [Google Scholar] [CrossRef]
- Liu, J.; Kuang, W.; Zhang, Z.; Xu, X.; Qin, Y.; Ning, J.; Zhou, W.; Zhang, S.; Li, R.; Yan, C. Spatiotemporal Characteristics, Patterns, and Causes of Land-Use Changes in China since the Late 1980s. J. Geogr. Sci. 2014, 24, 195–210. [Google Scholar] [CrossRef]
- Li, S.; Zhang, D.; Xie, Y.; Yang, C. Analysis on the Spatio-Temporal Evolution and Influencing Factors of China’s Grain Production. Environ. Sci. Pollut. Res. 2022, 29, 23834–23846. [Google Scholar] [CrossRef] [PubMed]
- Wang, H.; Zhang, B.; Liu, Y.; Liu, Y.; Xu, S.; Zhao, Y.; Chen, Y.; Hong, S. Urban Expansion Patterns and Their Driving Forces Based on the Center of Gravity-GTWR Model: A Case Study of the Beijing-Tianjin-Hebei Urban Agglomeration. J. Geogr. Sci. 2020, 30, 297–318. [Google Scholar] [CrossRef]
- Zhang, X.; Zhang, B.; Yao, Y.; Wang, J.; Yu, F.; Liu, J.; Li, J. Dynamics and Climatic Drivers of Evergreen Vegetation in the Qinling-Daba Mountains of China. Ecol. Indic. 2022, 136, 108625. [Google Scholar] [CrossRef]
- Li, Y.; Liu, G.; Huang, C. Dynamic Changes Analysis and Hotspots Detection of Land Use in the Central Core Functional Area of Jing-Jin-Ji from 2000 to 2015 Based on Remote Sensing Data. Math. Problems Eng. 2017, 2017, 2183585. [Google Scholar] [CrossRef]
- Chen, X.; He, L.; Luo, F.; He, Z.; Bai, W.; Xiao, Y.; Wang, Z. Dynamic Characteristics and Impacts of Ecosystem Service Values under Land Use Change: A Case Study on the Zoigê Plateau, China. Ecol. Inform. 2023, 78, 102350. [Google Scholar] [CrossRef]
- Rosa, I.M.; Gabriel, C.; Carreiras, J.M. Spatial and Temporal Dimensions of Landscape Fragmentation across the Brazilian Amazon. Reg. Environ. Chang. 2017, 17, 1687–1699. [Google Scholar] [CrossRef] [PubMed]
- Nguyen, T.; Cheng, E.; Findlay, C. Land Fragmentation and Farm Productivity in China in the 1990s. China Econ. Rev. 1996, 7, 169–180. [Google Scholar] [CrossRef]
- Dumanski, J.; Pieri, C. Land Quality Indicators: Research Plan. Agric. Ecosyst. Environ. 2000, 81, 93–102. [Google Scholar] [CrossRef]
- Reid, R.S.; Thornton, P.K.; Kruska, R.L. Loss and Fragmentation of Habitat for Pastoral People and Wildlife in East Africa: Concepts and Issues. Afr. J. Range Forage Sci. 2004, 21, 171–181. [Google Scholar] [CrossRef]
- Peng, J.; Wang, Y.; Zhang, Y.; Wu, J.; Li, W.; Li, Y. Evaluating the Effectiveness of Landscape Metrics in Quantifying Spatial Patterns. Ecol. Indic. 2010, 10, 217–223. [Google Scholar] [CrossRef]
- Niesterowicz, J.; Stepinski, T.F. On Using Landscape Metrics for Landscape Similarity Search. Ecol. Indic. 2016, 64, 20–30. [Google Scholar] [CrossRef]
- Li, X. TOPSIS Model with Entropy Weight for Eco Geological Environmental Carrying Capacity Assessment. Microprocess. Microsyst. 2021, 82, 103805. [Google Scholar] [CrossRef]
- Wang, D.; Yang, H.; Hu, Y.; Zhu, A.-X.; Mao, X. Analyzing Spatio-Temporal Characteristics of Cultivated Land Fragmentation and Their Influencing Factors in a Rapidly Developing Region: A Case Study in Guangdong Province, China. Land 2022, 11, 1750. [Google Scholar] [CrossRef]
- Zhang, Y.; Long, H.; Ma, L.; Ge, D.; Tu, S.; Qu, Y. Farmland Function Evolution in the Huang-Huai-Hai Plain: Processes, Patterns and Mechanisms. J. Geogr. Sci. 2018, 28, 759–777. [Google Scholar] [CrossRef]
- Wang, J.-F.; Li, X.-H.; Christakos, G.; Liao, Y.-L.; Zhang, T.; Gu, X.; Zheng, X.-Y. Geographical Detectors-based Health Risk Assessment and Its Application in the Neural Tube Defects Study of the Heshun Region, China. Int. J. Geogr. Inf. Sci. 2010, 24, 107–127. [Google Scholar] [CrossRef]
- Zhou, X.; Wu, D.; Li, J.; Liang, J.; Zhang, D.; Chen, W. Cultivated Land Use Efficiency and Its Driving Factors in the Yellow River Basin, China. Ecol. Indic. 2022, 144, 109411. [Google Scholar] [CrossRef]
- Xu, D.; Zhang, K.; Cao, L.; Guan, X.; Zhang, H. Driving Forces and Prediction of Urban Land Use Change Based on the Geodetector and CA-Markov Model: A Case Study of Zhengzhou, China. Int. J. Digit. Earth 2022, 15, 2246–2267. [Google Scholar] [CrossRef]
- Chen, L.; Zhao, H.; Song, G.; Liu, Y. Optimization of Cultivated Land Pattern for Achieving Cultivated Land System Security: A Case Study in Heilongjiang Province, China. Land Use Policy 2021, 108, 105589. [Google Scholar] [CrossRef]
- Zhu, Y.; Zhang, R.; Cui, J. Spatial Differentiation and Influencing Factors in the Ecological Well-Being Performance of Urban Agglomerations in the Middle Reaches of the Yangtze River: A Hierarchical Perspective. Int. J. Environ. Res. Public Health 2022, 19, 12867. [Google Scholar] [CrossRef]
- Li, Z.; Jiang, W.; Wang, W.; Lei, X.; Deng, Y. Exploring Spatial-Temporal Change and Gravity Center Movement of Construction Land in the Chang-Zhu-Tan Urban Agglomeration. J. Geogr. Sci. 2019, 29, 1363–1380. [Google Scholar] [CrossRef]
- Yi, Z.; Shufang, T.; Hang, D. Evaluation and Analysis of the Exploitative Intensity of Mineral Resources in Jiangxi Province. China Min. Mag. 2021, 30, 30–37. [Google Scholar]
- Hao, L.; Sun, G.; Liu, Y.; Wan, J.; Qin, M.; Qian, H.; Liu, C.; Zheng, J.; John, R.; Fan, P. Urbanization Dramatically Altered the Water Balances of a Paddy Field-Dominated Basin in Southern China. Hydrol. Earth Syst. Sci. 2015, 19, 3319–3331. [Google Scholar] [CrossRef]
- Zhao, S.; Fang, J. Impact of Impoldering and Lake Restoration on Land-Cover Changes in Dongting Lake Area, Central Yangtze. AMBIO J. Hum. Environ. 2004, 33, 311–315. [Google Scholar] [CrossRef] [PubMed]
- Song, X.; Ouyang, Z.; Li, Y.; Li, F. Cultivated Land Use Change in China, 1999–2007: Policy Development Perspectives. J. Geogr. Sci. 2012, 22, 1061–1078. [Google Scholar] [CrossRef]
- Xue, B.; Xiao, X.; Li, J.; Xie, X.; Lu, C. Spatio-Temporal Evolution of Water Areas and Croplands in the Three Provinces of Northeast China Based on Remote Sensing Data. Chin. J. Ecol. 2019, 38, 1444. [Google Scholar]
- Zhou, J.; Cao, X. What Is the Policy Improvement of China’s Land Consolidation? Evidence from Completed Land Consolidation Projects in Shaanxi Province. Land Use Policy 2020, 99, 104847. [Google Scholar] [CrossRef]
- Xie, Y.; Yu, M.; Tian, G.; Xing, X. Socio-Economic Driving Forces of Arable Land Conversion: A Case Study of Wuxian City. China 2005, 15, 238–252. [Google Scholar] [CrossRef]
- Wen, G.; Yang, G.; Li, Y.; Zhao, W.; Wang, W. The Governance Effect of Rural Land Consolidation on Cultivated Land Fragmentation and Its Causes: A Case Study on Jiangxia District, Xian’an District, Tongshan County in Hubei Province. China Land Sci. 2016, 30, 82–89. [Google Scholar]
- Zhang, L.; Wang, Z.; Du, G.; Chen, Z. Analysis of Climatic Basis for the Change of Cultivated Land Area in Sanjiang Plain of China. Front. Earth Sci. 2022, 10, 862141. [Google Scholar] [CrossRef]
- Gao, J.; Liu, Y. Climate Warming and Land Use Change in Heilongjiang Province, Northeast China. Appl. Geogr. 2011, 31, 476–482. [Google Scholar] [CrossRef]
- Koohafkan, P. Water and Cereals in Drylands; Routledge: London, UK, 2012; ISBN 1-84977-374-2. [Google Scholar]
- Zhou, G.S. Research Prospect on Impact of Climate Change on Agricultural Production in China. Meteorol. Environ. Sci. 2015, 38, 80–94. [Google Scholar]
- Yu, D.; Ramsey, R.D.; Zhao, X.-M.; Fu, Y.-Q.; Sun, C.-K. Feasible Conversion Degree of Dryland to Paddy Field in Jinxian County, Jiangxi Province, China. Geocarto Int. 2019, 34, 1042–1053. [Google Scholar] [CrossRef]
- Wang, J.; He, T.; Lin, Y. Changes in Ecological, Agricultural, and Urban Land Space in 1984–2012 in China: Land Policies and Regional Social-Economical Drivers. Habitat Int. 2018, 71, 1–13. [Google Scholar] [CrossRef]
- Wang, L.; Zhang, S.; Liu, Y.; Liu, Y. Interaction between Construction Land Expansion and Cropland Expansion and Its Socioeconomic Determinants: Evidence from Urban Agglomeration in the Middle Reaches of the Yangtze River, China. Front. Environ. Sci. 2022, 10, 334. [Google Scholar] [CrossRef]
- Lei, D.; Shangguan, Z.-P.; Rui, L.I. Effects of the Grain-for-Green Program on Soil Erosion in China. Int. J. Sediment. Res. 2012, 27, 120–127. [Google Scholar]
- Chen, S.; Zhong, W.; Pan, S.; Xie, Q.; Kim, T.-W. Comprehensive Drought Assessment Using a Modified Composite Drought Index: A Case Study in Hubei Province, China. Water 2020, 12, 462. [Google Scholar] [CrossRef]
- Yang, R.; Harrison, M.T.; Wang, X. Current State and Limiting Factors of Wheat Yield at the Farm Level in Hubei Province. Agronomy 2023, 13, 2043. [Google Scholar] [CrossRef]
- Wang, L.; Long, H.; Liu, H.; Dong, G. Analysis of the Relationship between Drought-Flood Disasters and Land-Use Changes in West Jilin, China. Disaster Adv. 2012, 5, 652–658. [Google Scholar]
- Liu, X.; Zhang, Y.; Dong, G.; Hou, G.; Jiang, M. Landscape Pattern Changes in the Xingkai Lake Area, Northeast China. Int. J. Environ. Res. Public Health 2019, 16, 3820. [Google Scholar] [CrossRef]
- Yan, J.; Yang, Z.; Li, Z.; Li, X.; Xin, L.; Sun, L. Drivers of Cropland Abandonment in Mountainous Areas: A Household Decision Model on Farming Scale in Southwest China. Land Use Policy 2016, 57, 459–469. [Google Scholar] [CrossRef]
Disclaimer/Publisher’s Note: The statements, opinions and data contained in all publications are solely those of the individual author(s) and contributor(s) and not of MDPI and/or the editor(s). MDPI and/or the editor(s) disclaim responsibility for any injury to people or property resulting from any ideas, methods, instructions or products referred to in the content. |
© 2024 by the authors. Licensee MDPI, Basel, Switzerland. This article is an open access article distributed under the terms and conditions of the Creative Commons Attribution (CC BY) license (https://creativecommons.org/licenses/by/4.0/).

